Ecological Mapping in Assessing the Impact of Environmental Factors on the Aquatic Ecosystem of the Arys River Basin, South Kazakhstan


Abstract
:1. Introduction
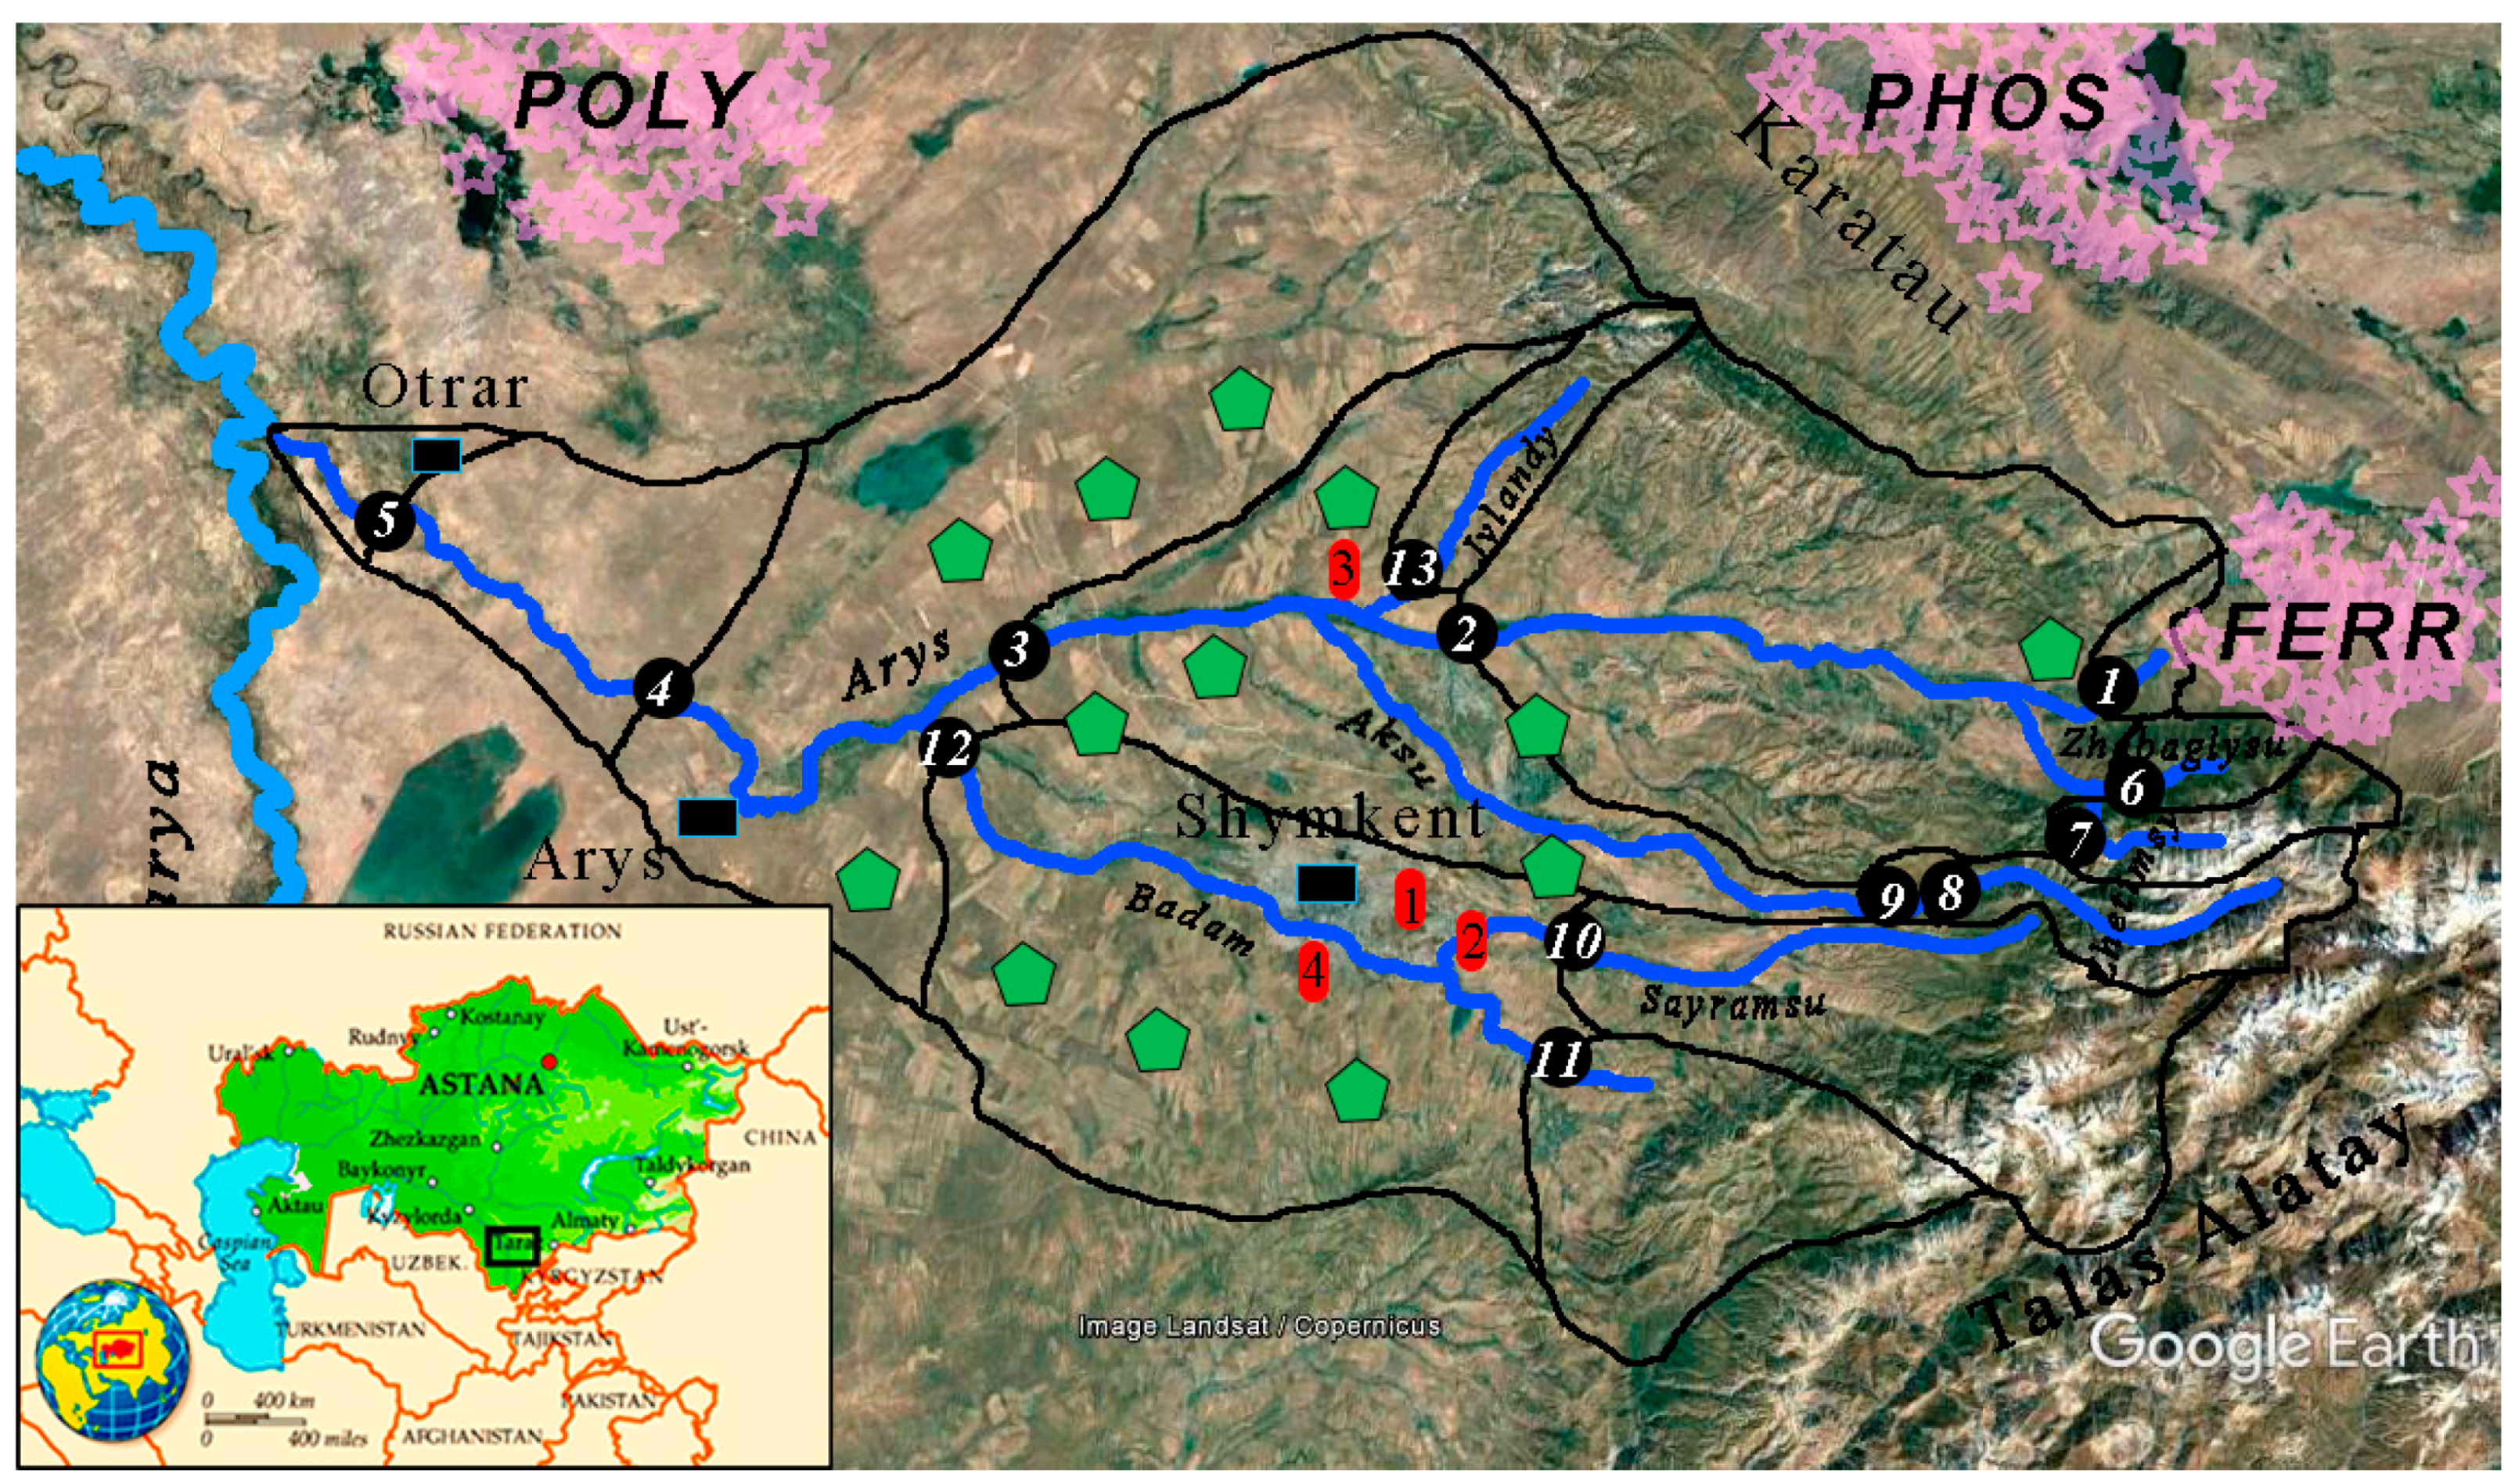
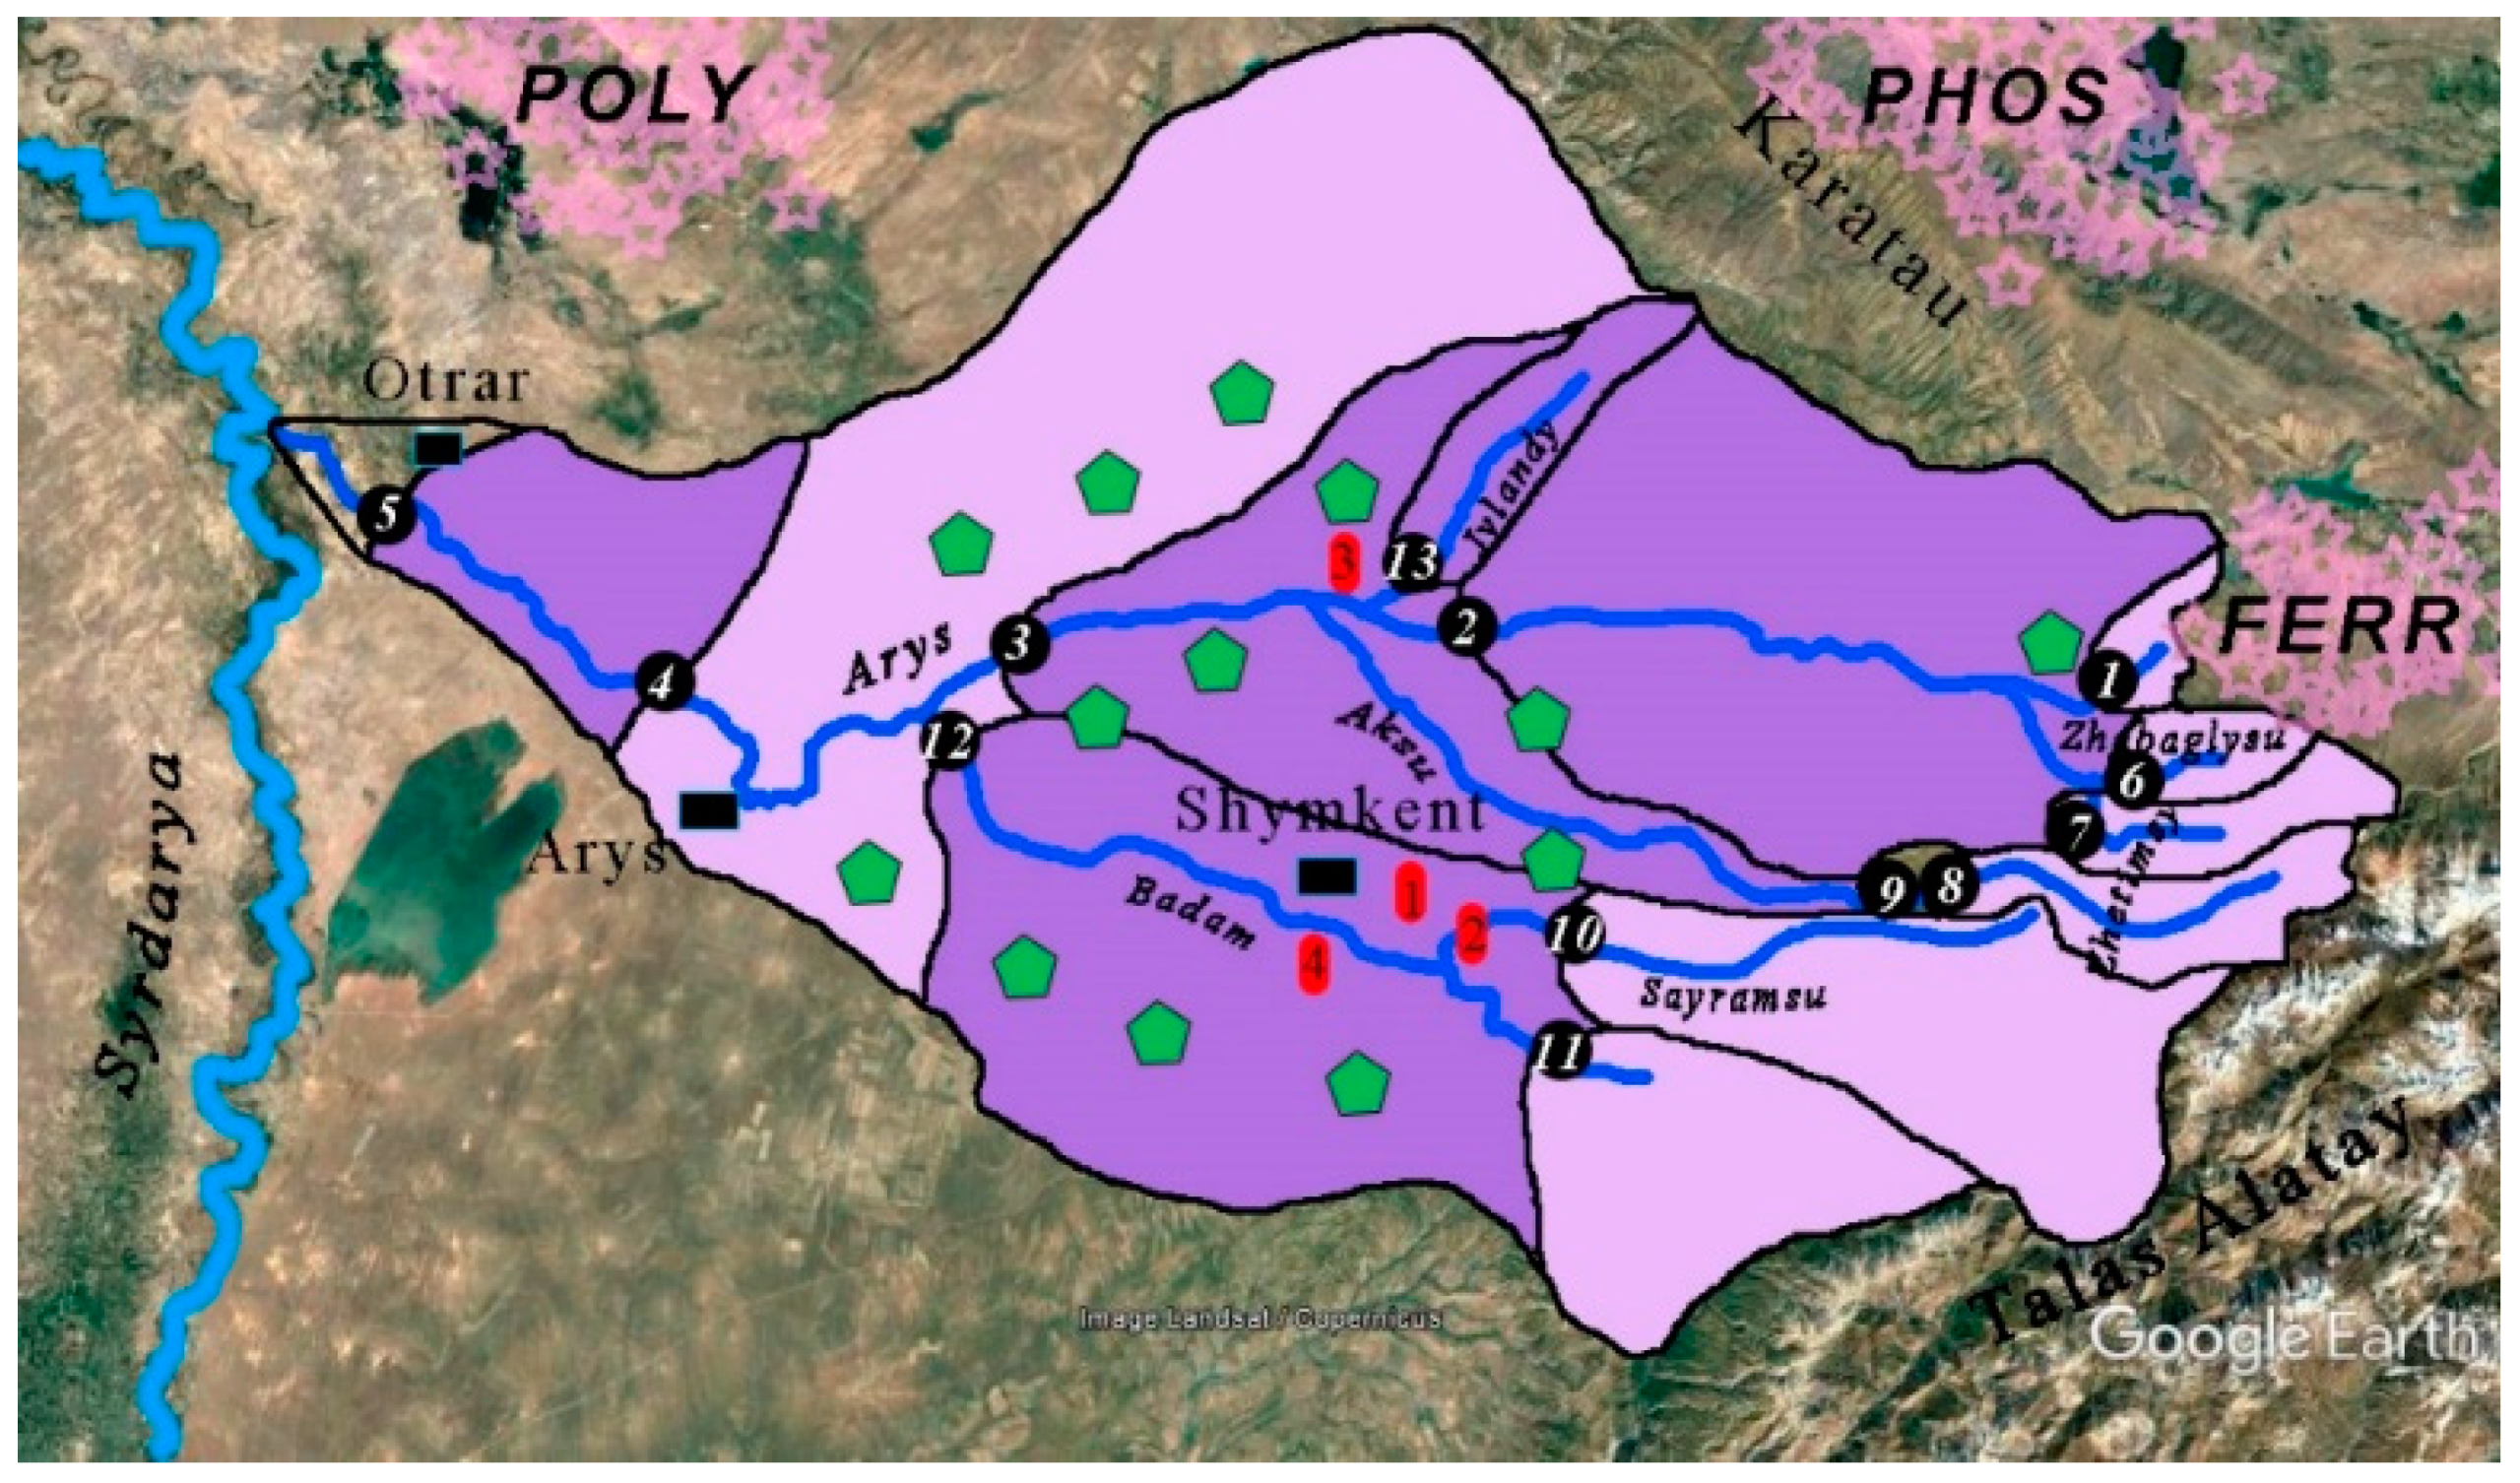
2. Description of the Study Area
3. Sources of Pollution
4. Material and Methods
5. Results
5.1. Environmental Variables
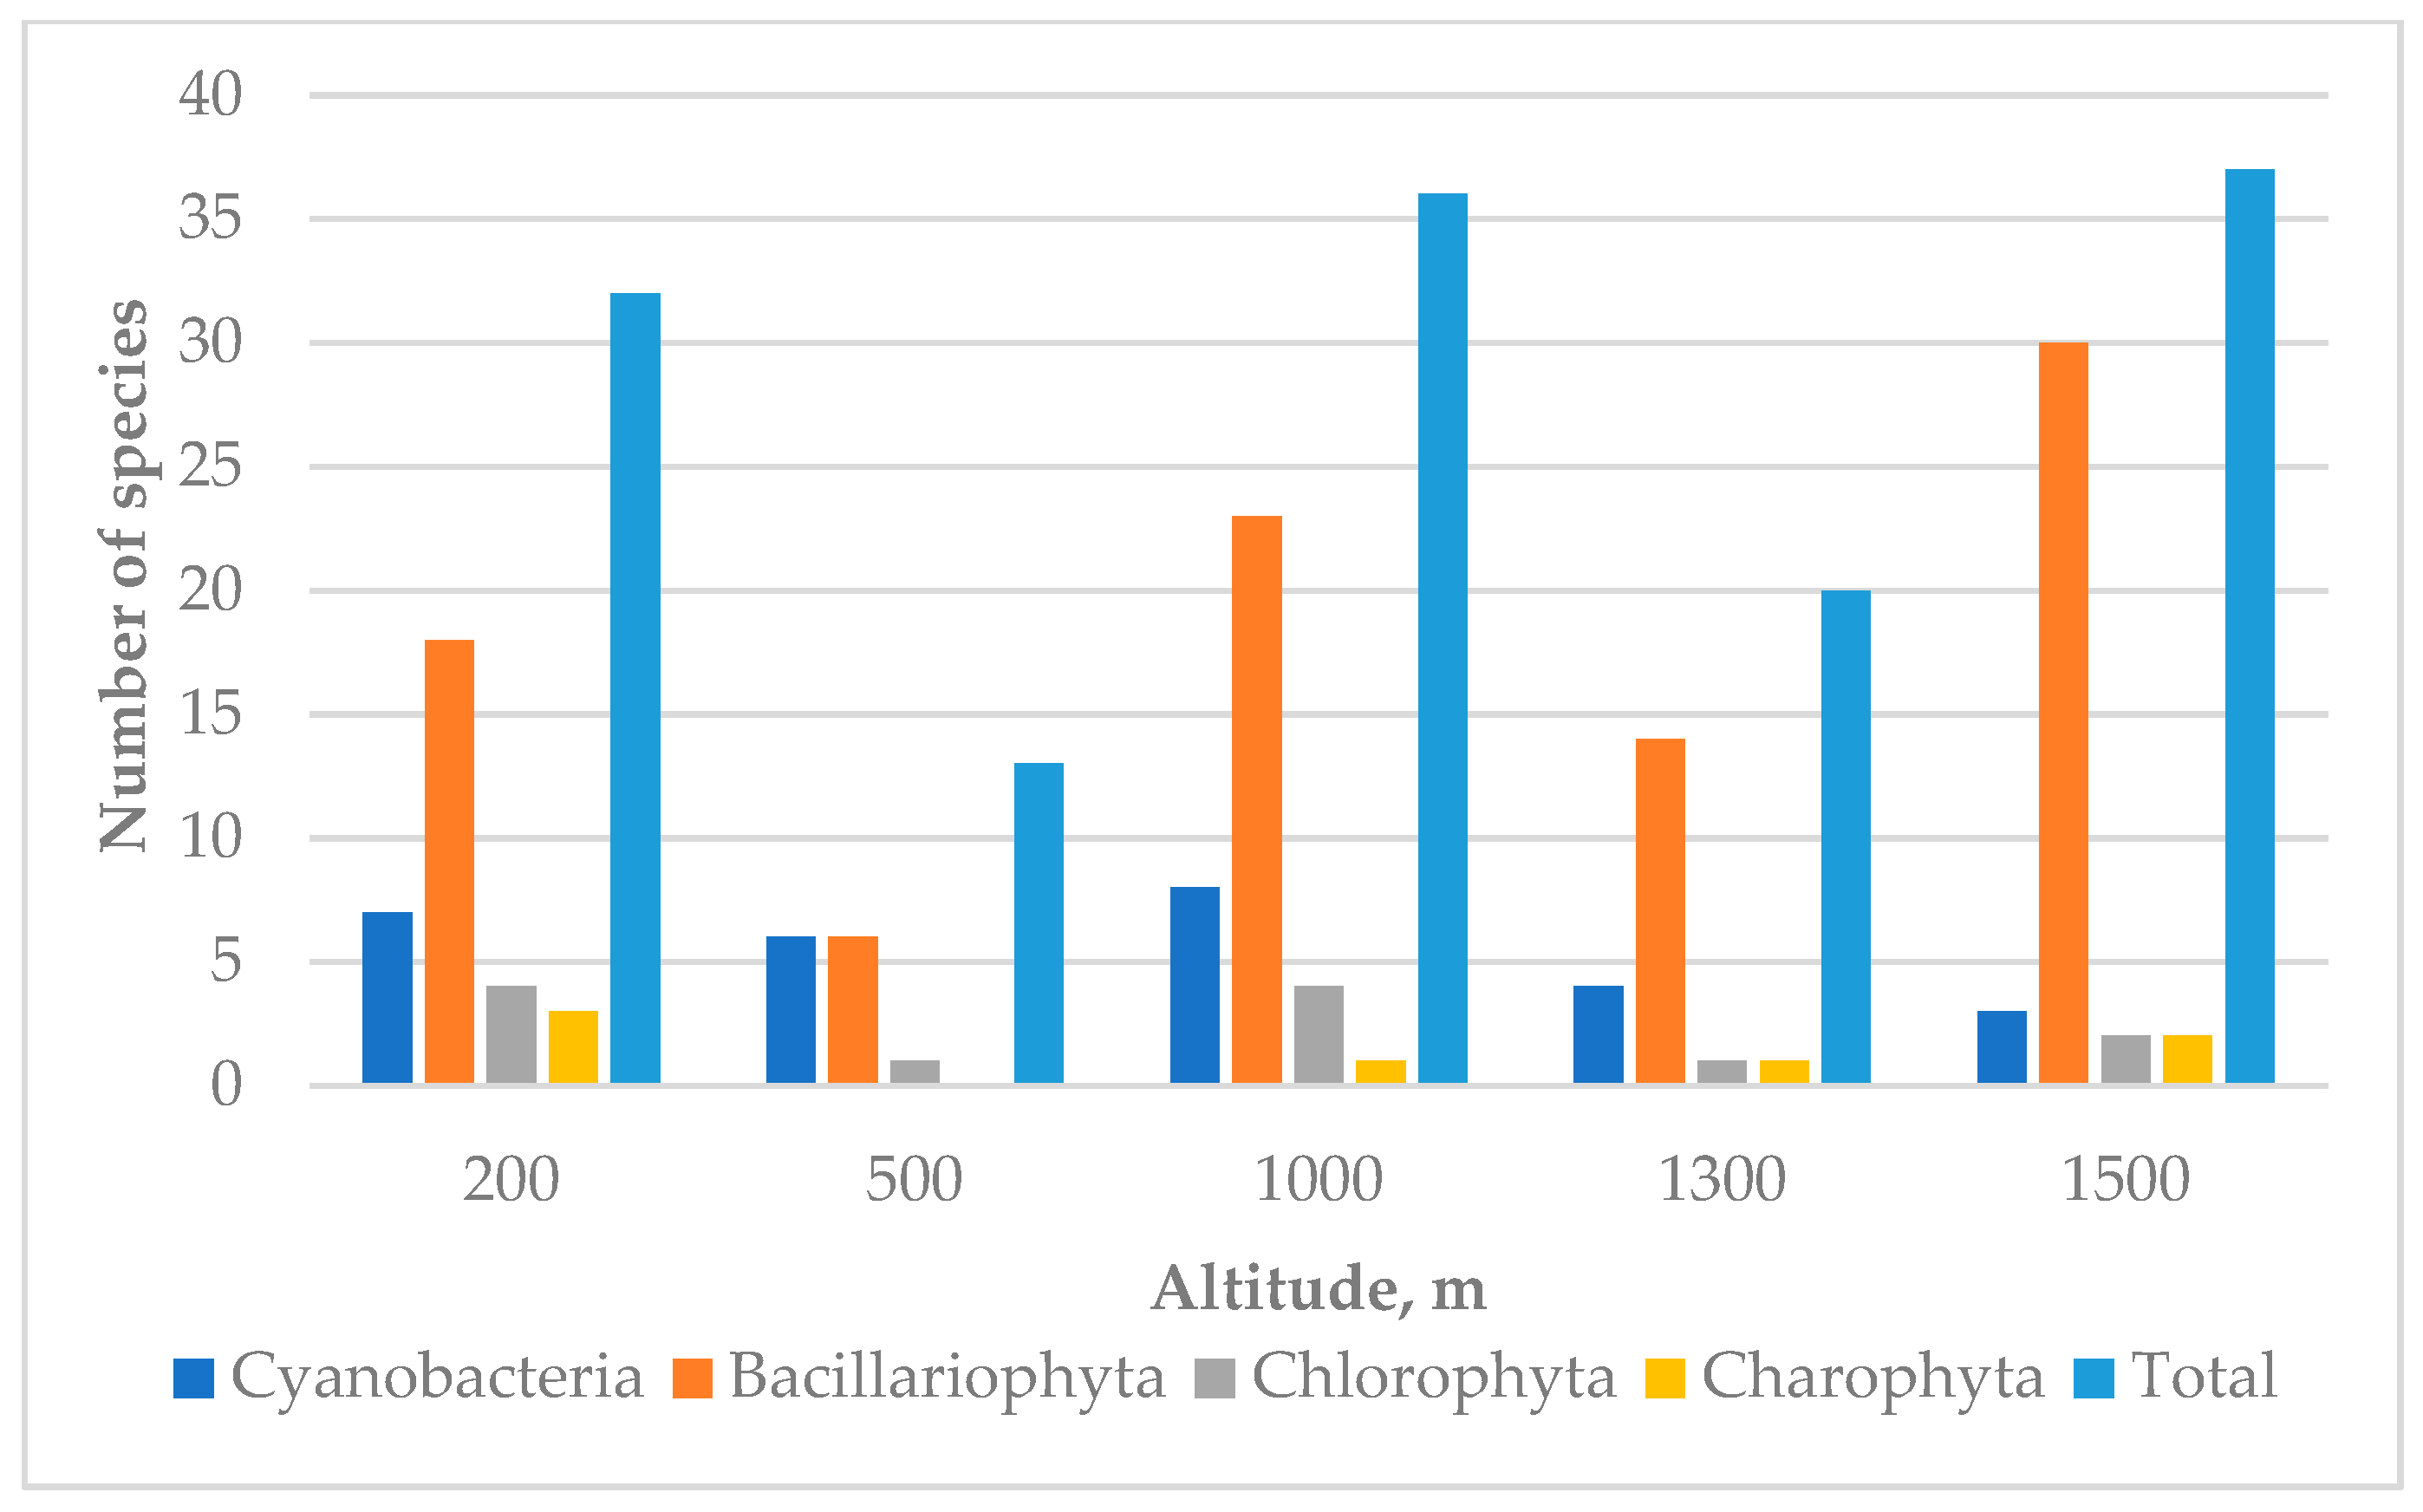
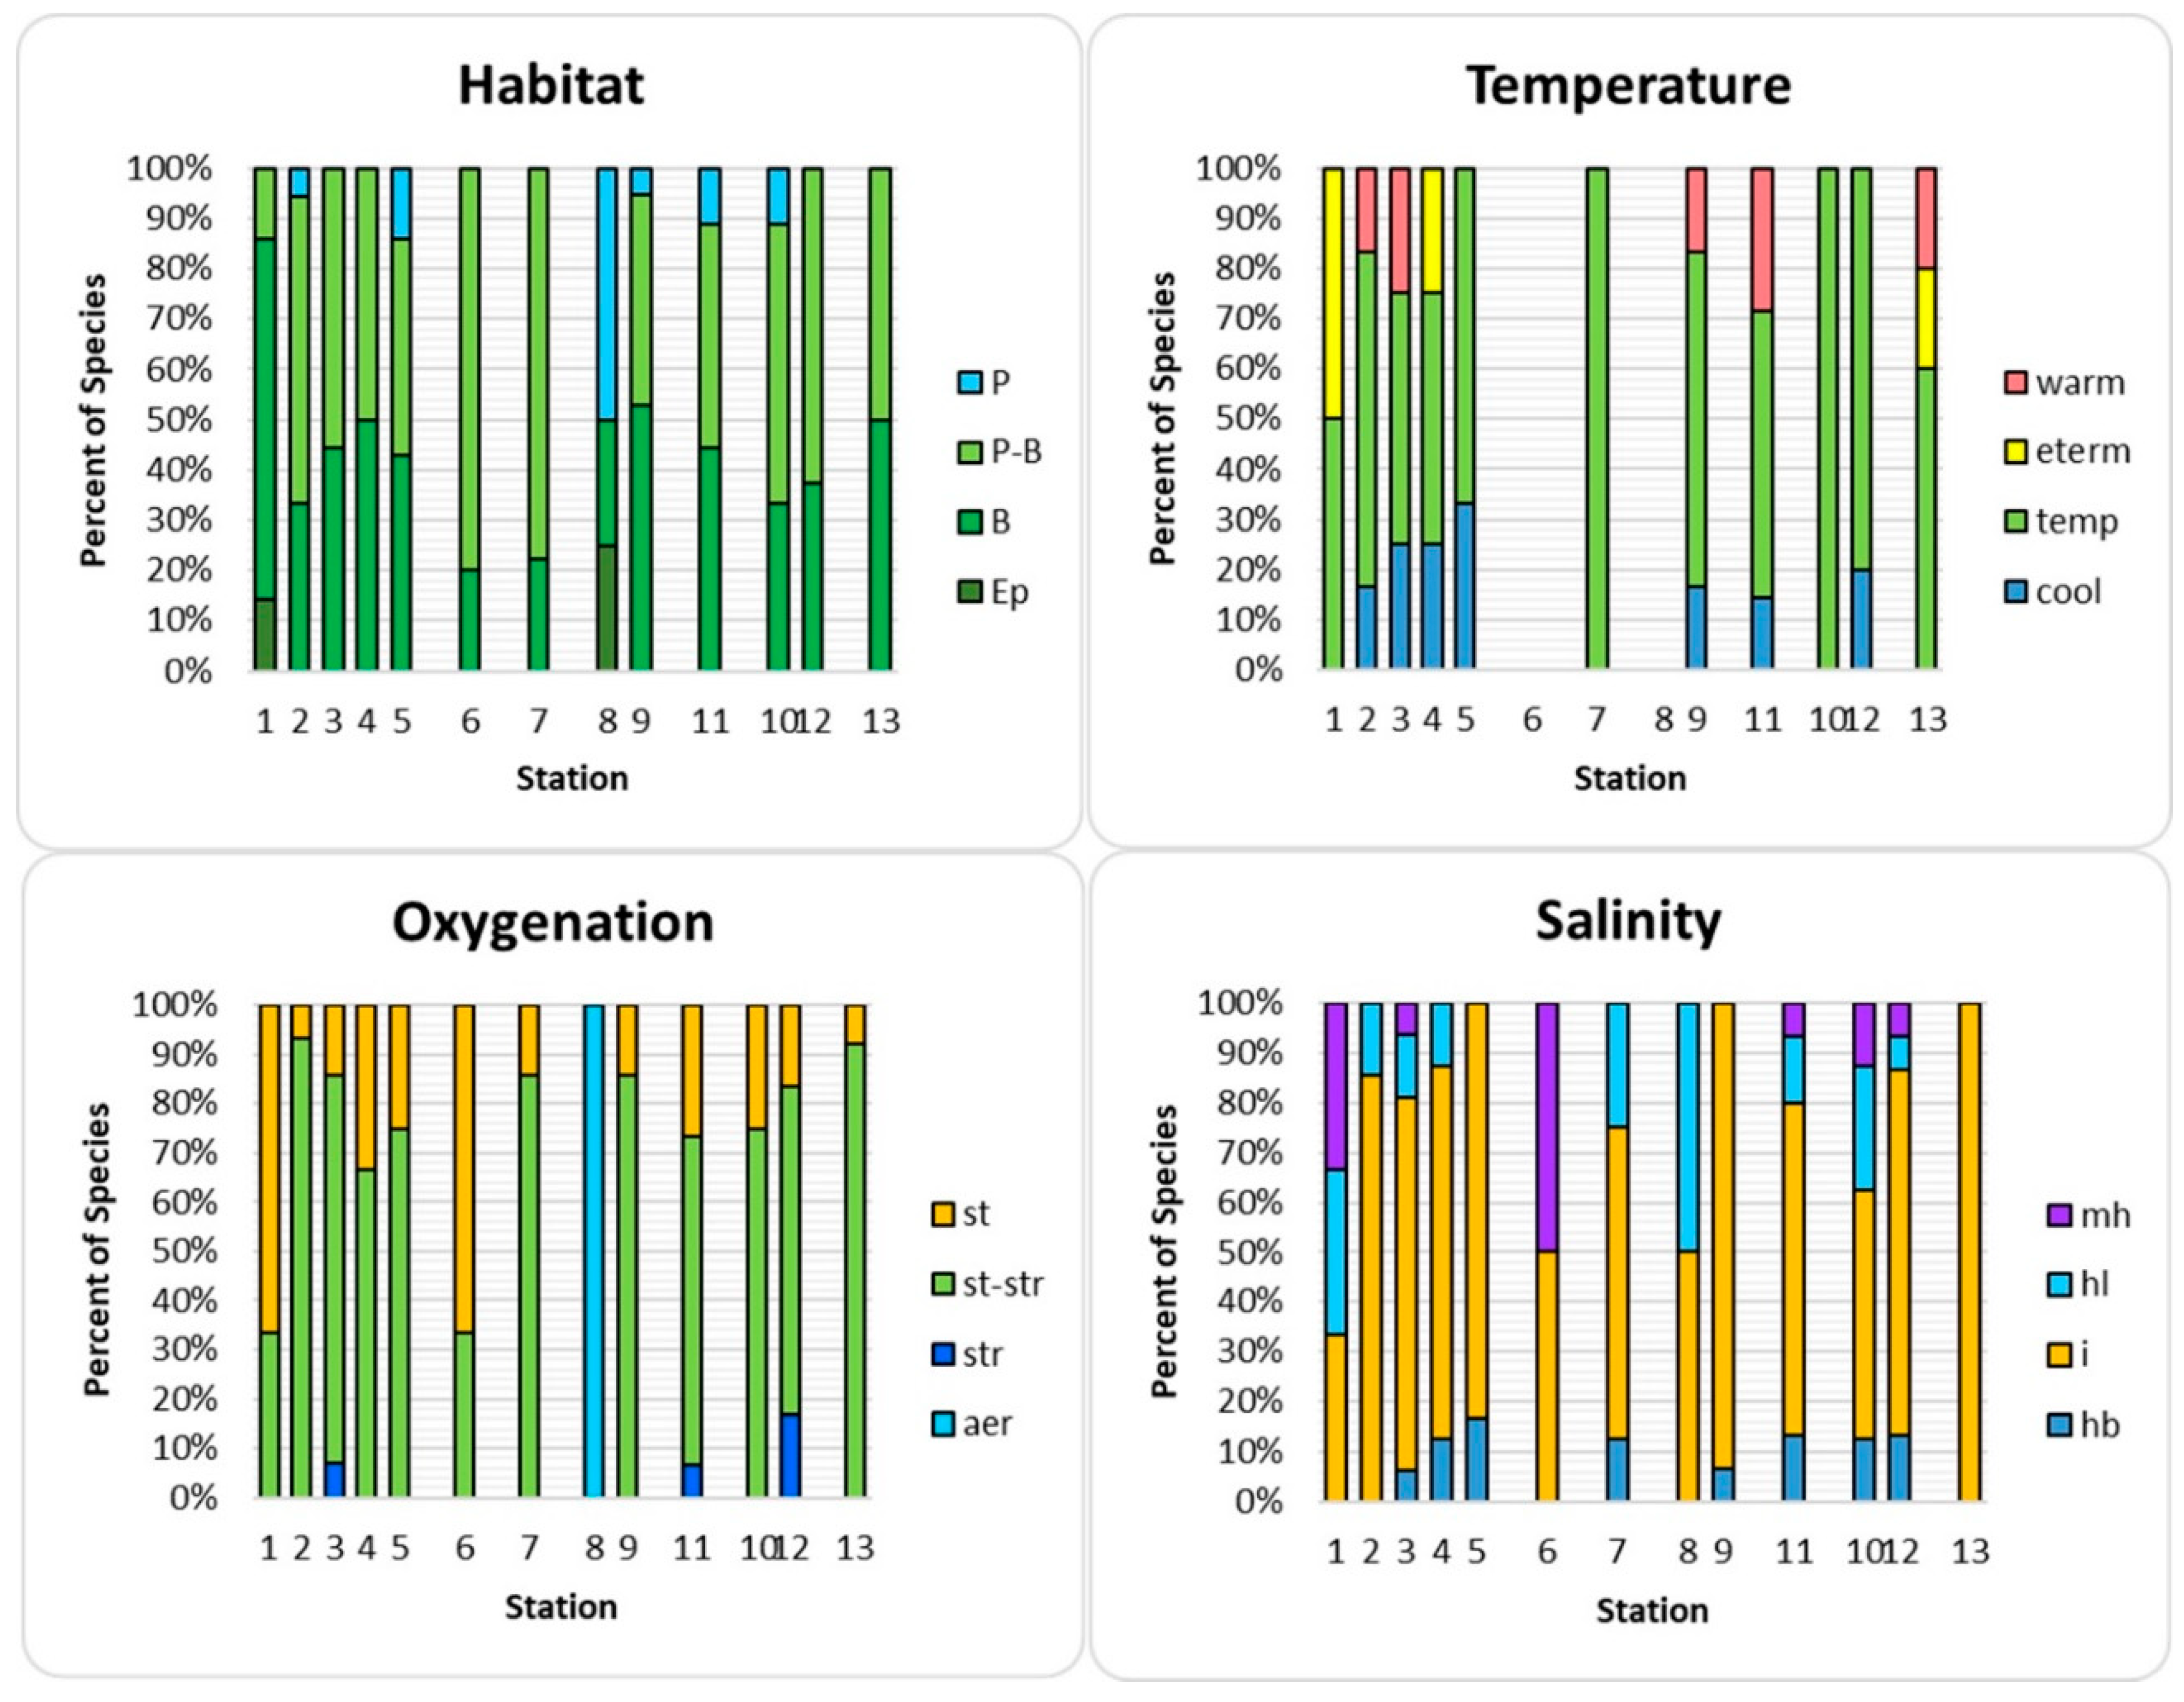
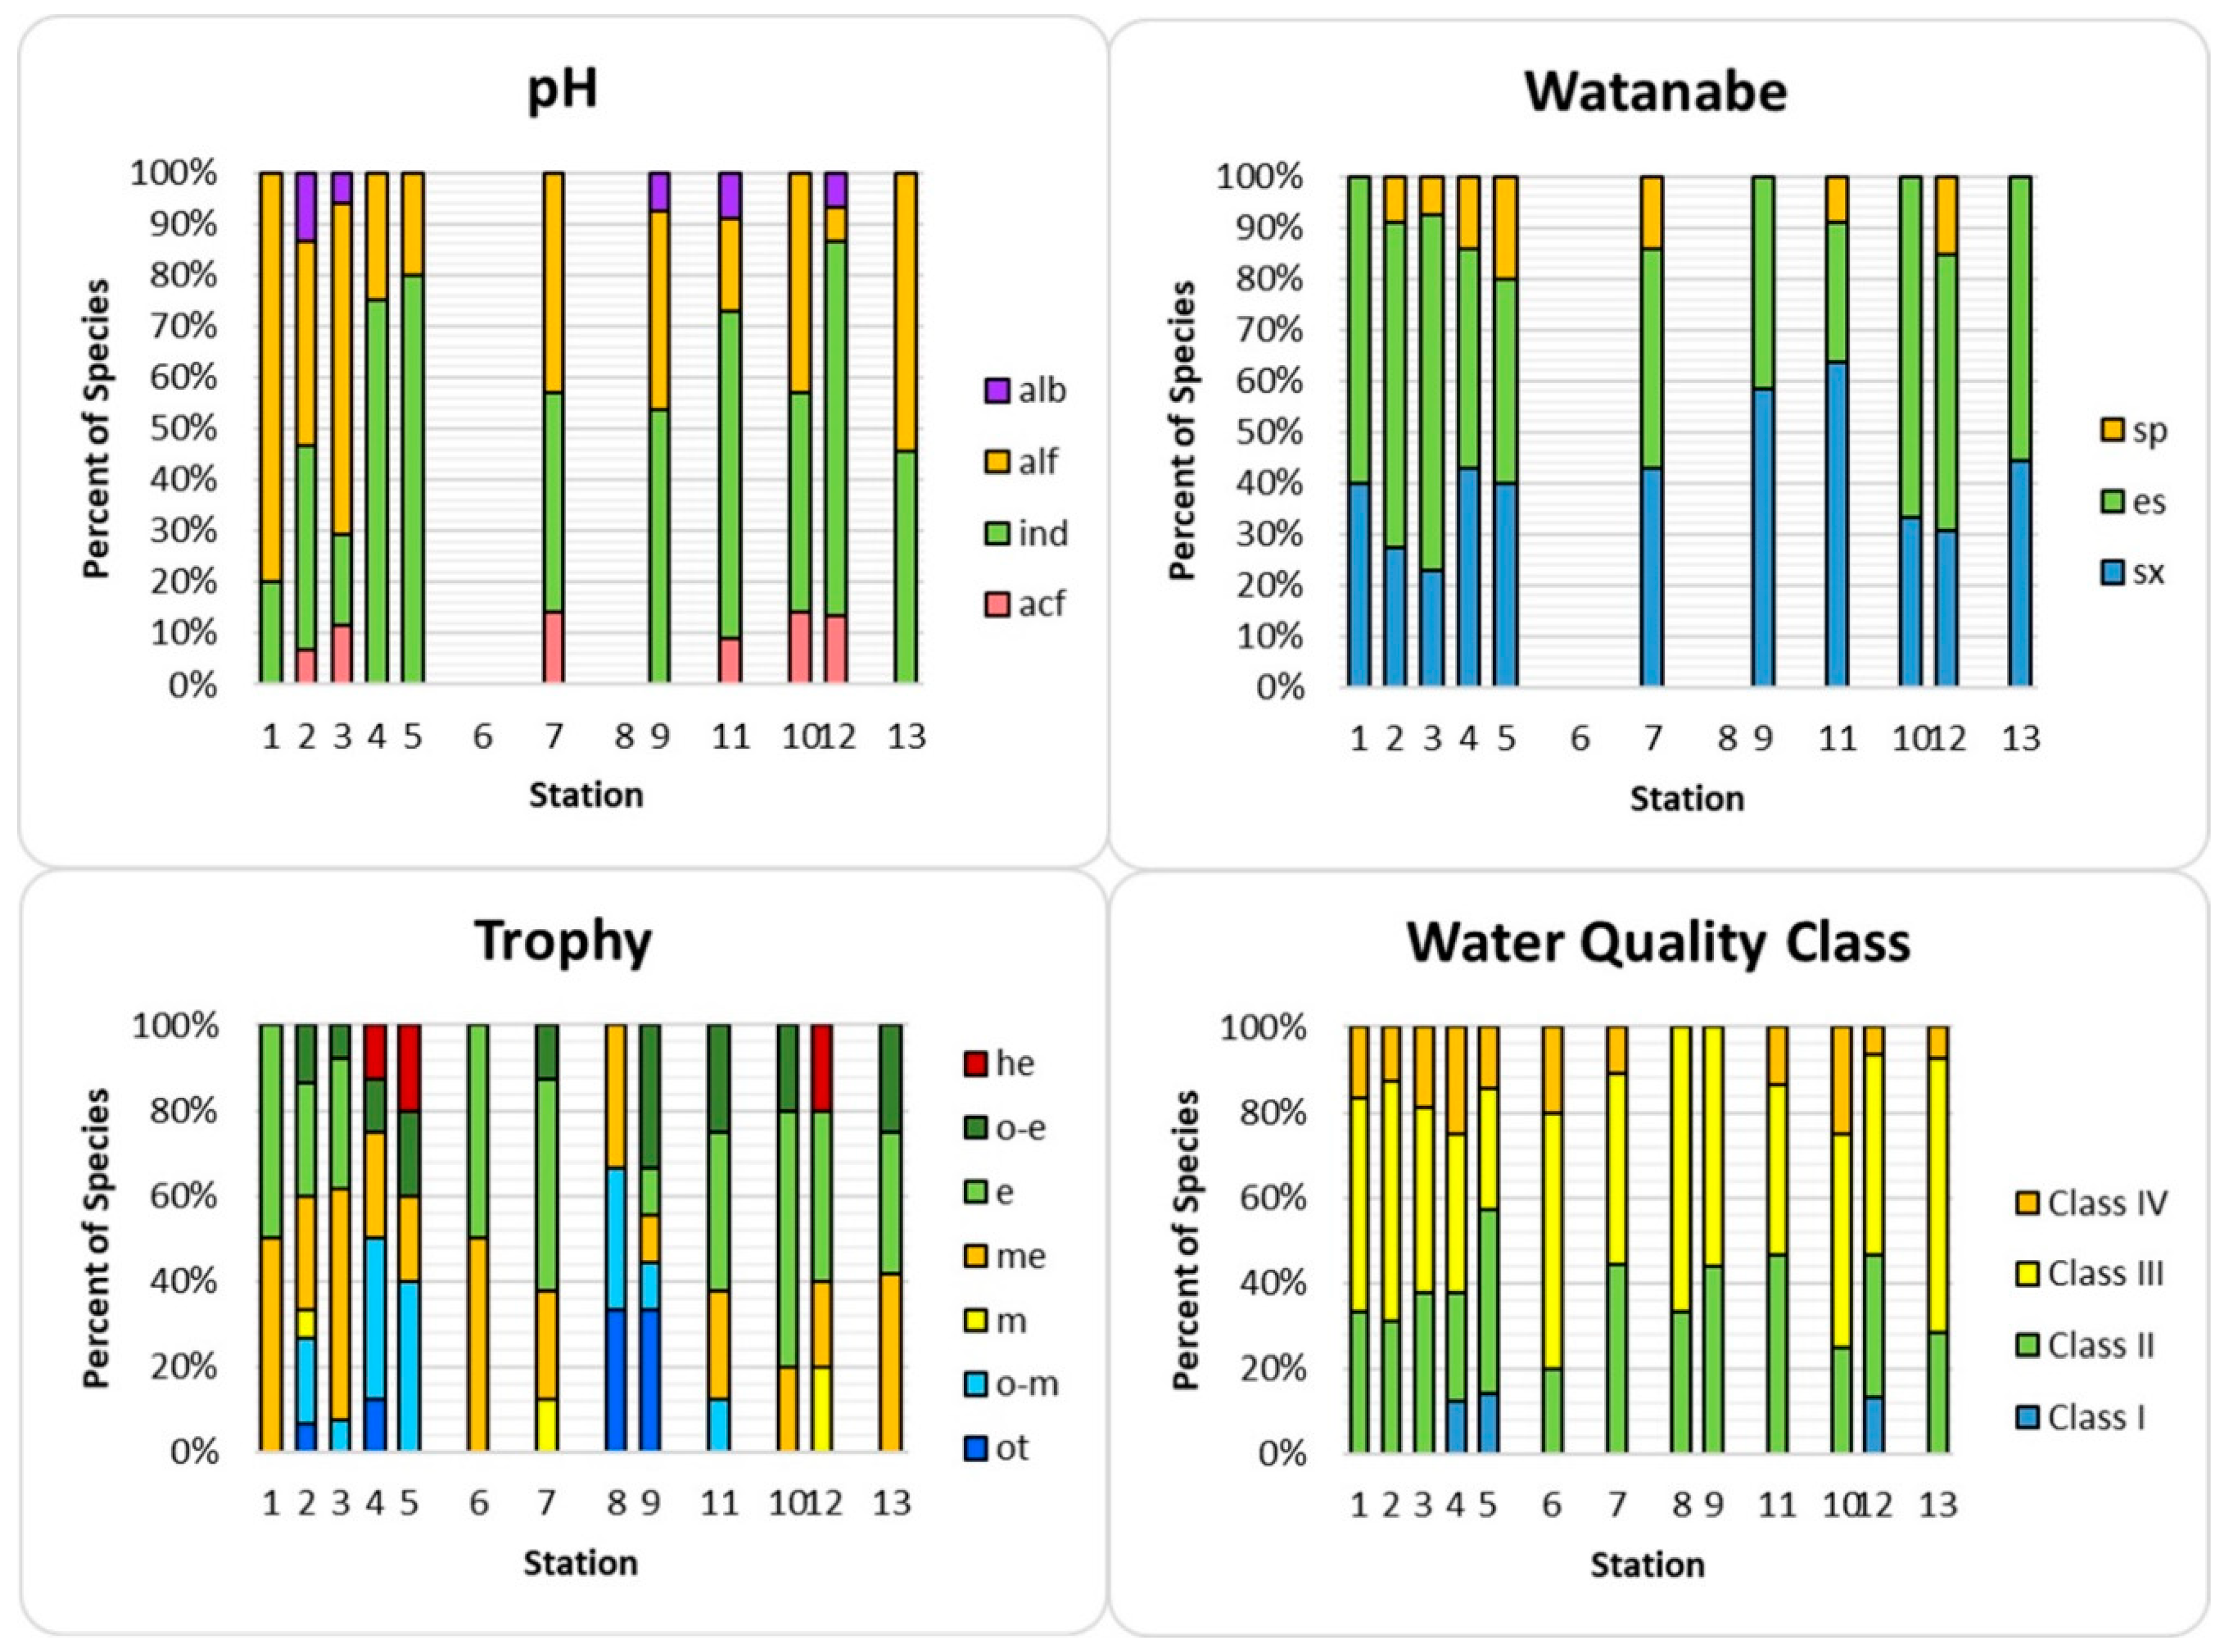
5.2. Characteristics of Phytoperiphyton
5.3. Water-Quality Assessment of the Arys River Basin by Abiotic Variables
5.4. Water-Quality Assessment of the Arys River Basin by Biological Variables
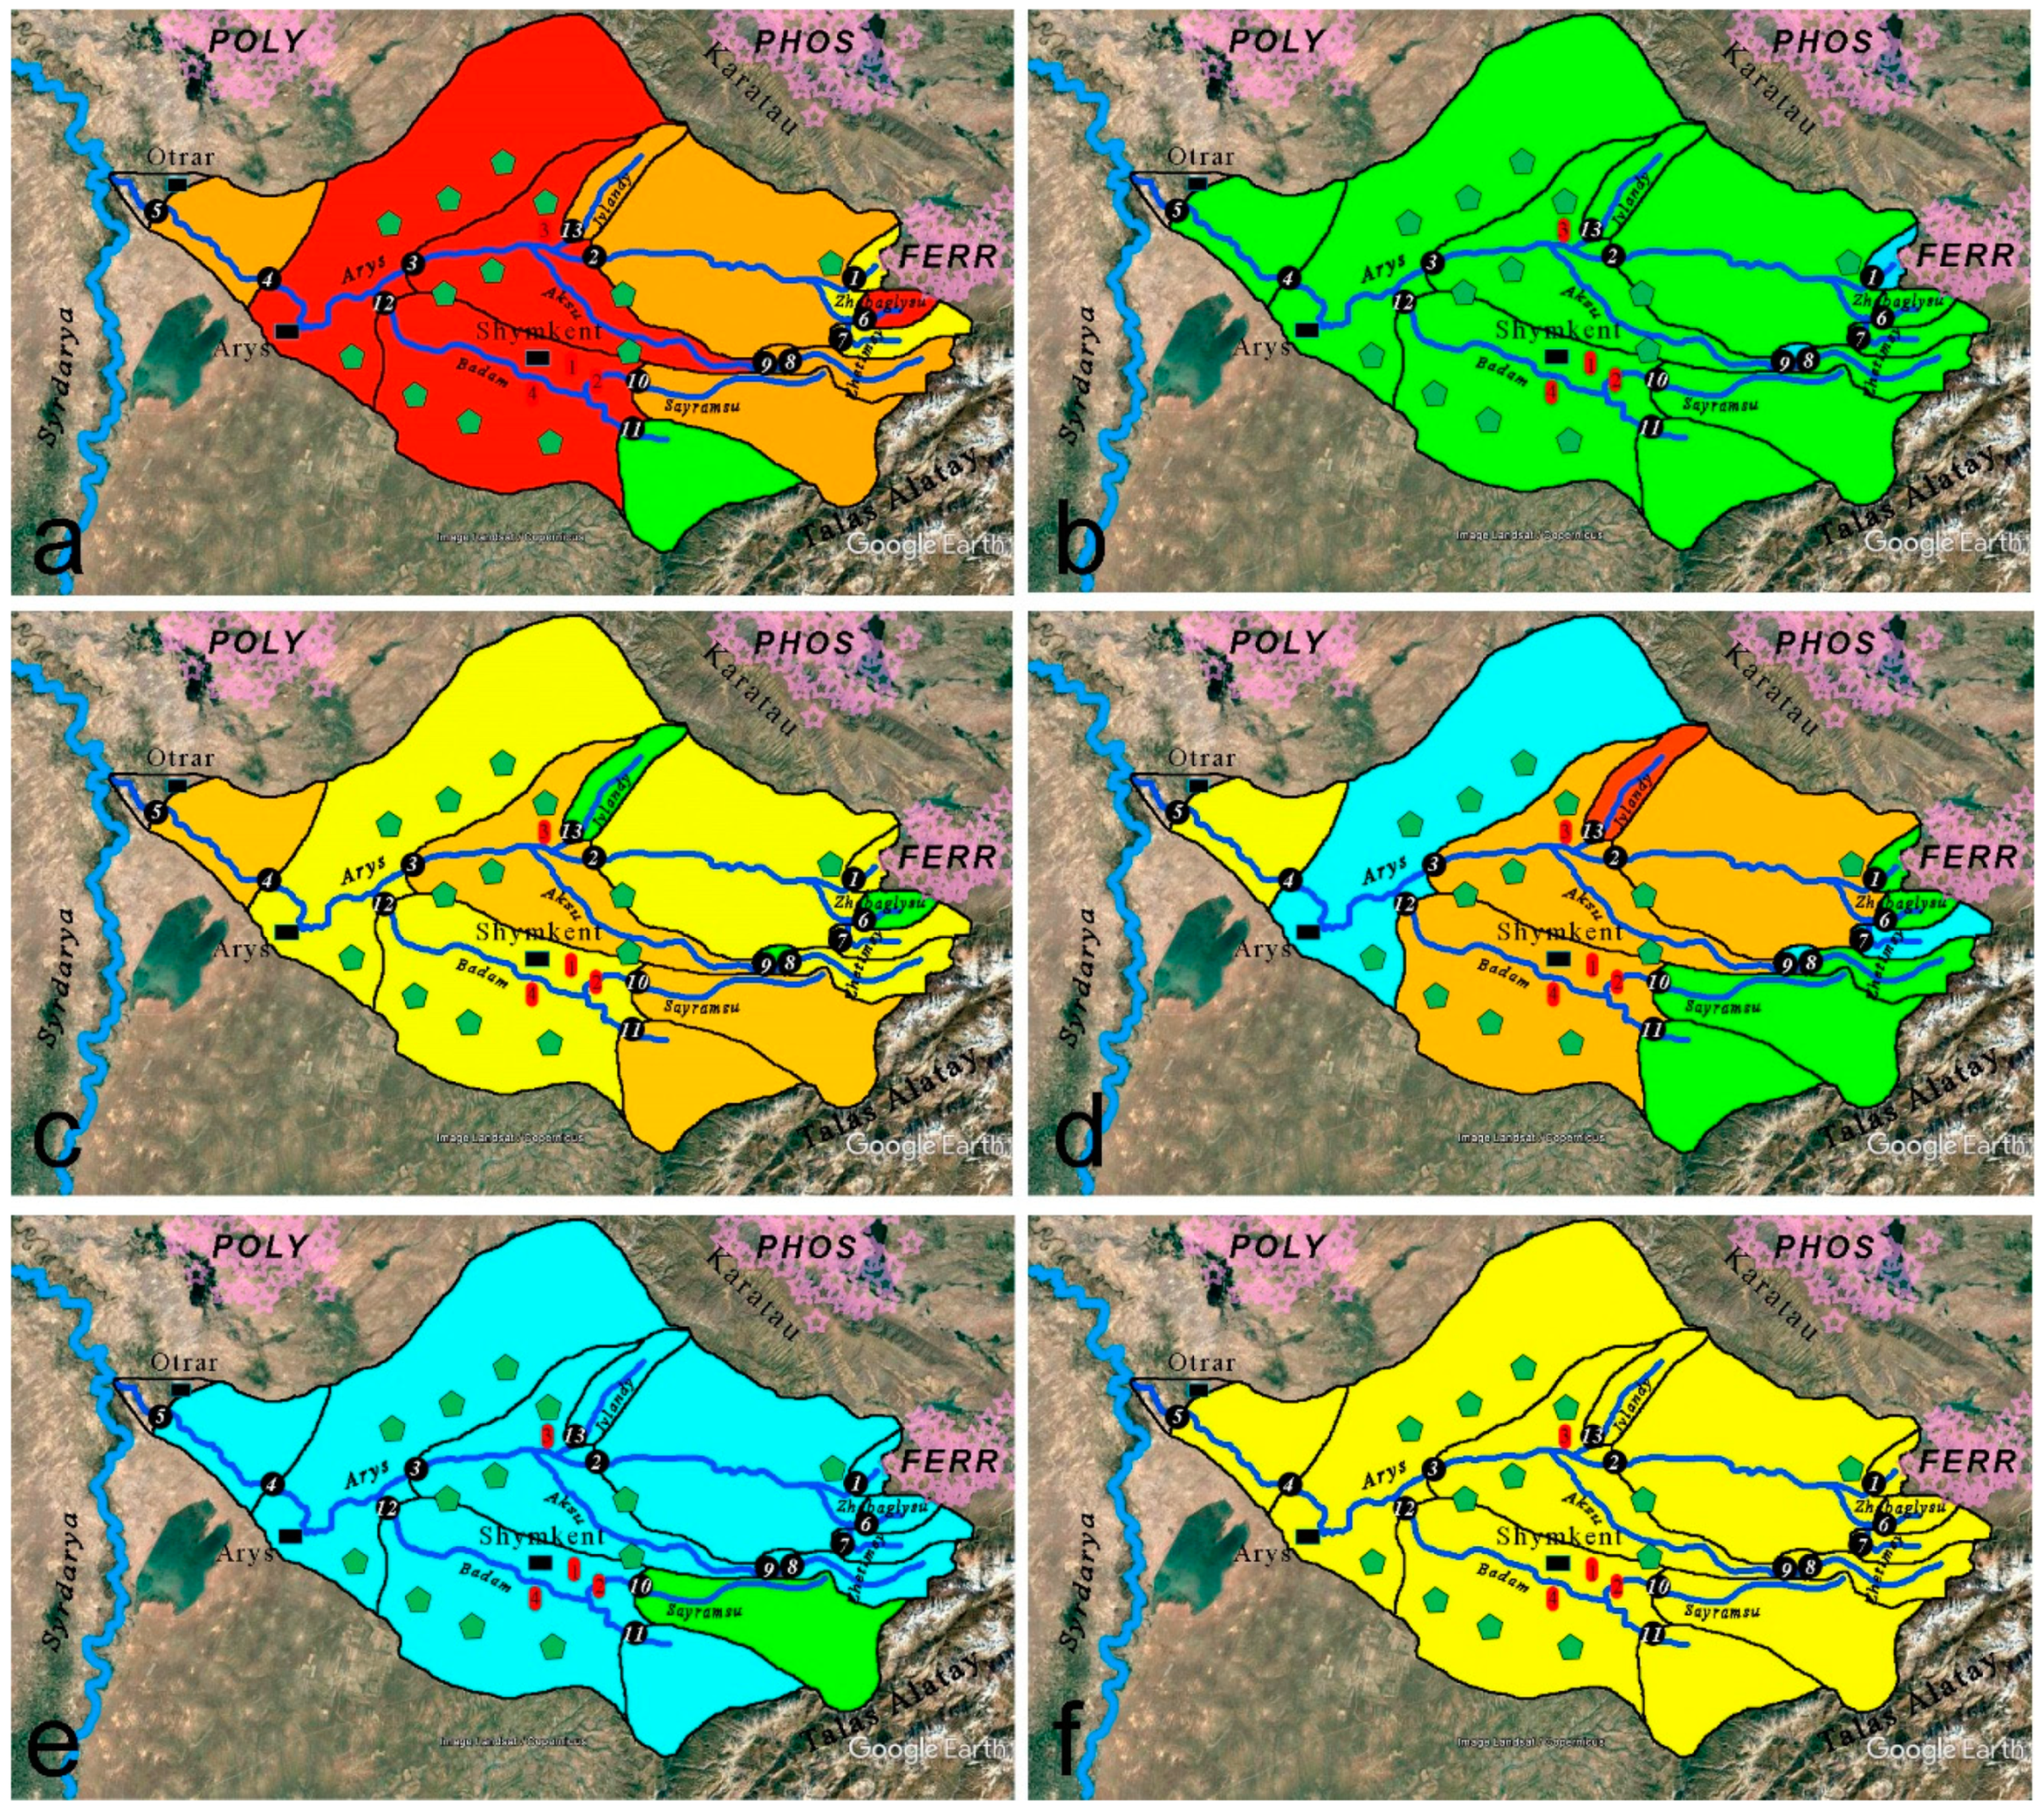
5.5. Ecological Mapping
6. Discussion
7. Conclusions
Author Contributions
Funding
Acknowledgments
Conflicts of Interest
References
- Solodukhin, V.P.; Poznyak, V.L.; Kazachevskiy, I.V.; Knyazev, B.B.; Lukashenko, S.N.; Khazhekber, S. Some peculiarities of the contamination with radionuclides and toxic elements of the Syrdarya river basin, Kazakhstan. J. Radioanal. Nucl. Chem. 2004, 259, 245–250. [Google Scholar] [CrossRef]
- Kadyrzhanov, K.K.; Barber, D.S.; Solodukhin, V.P.; Poznyak, V.L.; Kazachevskiy, I.V.; Knyazev, B.B.; Lukashenko, S.N.; Khazhekber, S.; Betsill, J.D.; Passell, H.D. Radionuclide contamination in the Syrdarya river basin of Kazakhstan Results of the Navruz Project. J. Radioanal. Nucl. Chem. 2005, 263, 197–205. [Google Scholar] [CrossRef]
- UNDP. Analysis of the Current Situation in the Field of Municipal Waste Management in 14 Cities of Kazakhstan Center “Promotion of Sustainable Development”; UNDP: Almaty, Kazakhstan, 2016; p. 124. [Google Scholar]
- Zhu, Y.; An, F.; Feng, W.; Zhang, H. Geological Evolution and Huge Ore-Forming Belts in the Core Part of the Central Asian Metallogenic Region. J. Earth Sci. 2016, 27, 491–506. [Google Scholar] [CrossRef]
- Lami, A.; Marchetto, A.; Musazzi, S.; Salerno, F.; Tartari, G.; Guilizzoni, P.; Rogora, M.; Tartari, G.A. Chemical and biological response of two small lakes in the Khumbu Valley, Himalayas (Nepal) to short-term variability and climatic change as detected by long-term monitoring and paleolimnological methods. Hydrobiologia 2010, 648, 189–205. [Google Scholar] [CrossRef]
- Sharma, R.C.; Kumar, R. Water quality assessment of sacred glacial Lake Satopanth of Garhwal Himalaya, India. Appl. Water Sci. 2017, 7, 4757–4764. [Google Scholar] [CrossRef] [Green Version]
- Kim, B.; Park, J.-H.; Hwang, G.; Jun, M.-S.; Choi, K. Eutrophication of reservoirs in South Korea. Limnology 2001, 2, 223–229. [Google Scholar] [CrossRef]
- Magai, S.D.; Vyshpol’skii, F.F. Combined use of surface and subsurface waters in the irrigated Arys—Turkestan massif in Southern Kazakhstan. Water Resour. 2015, 42, 116–123. [Google Scholar] [CrossRef]
- Krupa, E.G.; Romanova, S.M. Hydrochemistry of reservoirs of the Arys river basin in the territory of the South Kazakhstan region. News Natl. Acad. Sci. Repub. Kazakhstan 2017, 4, 77–89. [Google Scholar]
- Barinova, S.S.; Krupa, E.G. Diversity and Ecology of Periphytonic Algae in the Arys River Basin, Kazakhstan. J. Ecol. Nat. Resour. 2017, 1, 1–14. [Google Scholar] [CrossRef]
- Krupa, E.G.; Mademarova, N.A.; Ainabaeva, N. Periphyton of the Shardara reservoir and the Kyzylkum canal. News Natl. Acad. Sci. Repub. Kazakhstan. Ser. Biol. Med. 2016, 6, 216–223. [Google Scholar]
- Barinova, S.; Krupa, E. Critical environmental factors for photosynthetic organisms of the Shardara Reservoir, Kazakhstan. Bull. Adv. Sci. Res. 2017, 2, 17–27. [Google Scholar]
- Barinova, S.; Krupa, E. Bioindication of Ecological State and Water Quality by Phytoplankton in the Shardara Reservoir, Kazakhstan. Environ. Ecol. Res. 2017, 5, 73–92. [Google Scholar] [CrossRef]
- Zhuzbayeva, A.; Atici, T. Algae and water qualities of Badam Dam Reservoir (Kazakhstan). Biol. Divers. Conserv. 2016, 9, 34–43. [Google Scholar]
- The Directive 2000/60/EP of the European Parliament and of the Council Establishing a Framework for Community Action in the Field of Water Policy. Off. J. Eur. Commun. 327. Available online: https://www.eea.europa.eu/policy-documents/directive-2000-60-ec-of (accessed on 12 December 2019).
- Lobo, E.A.; Heinrich, C.G.; Marilia, S.; Carlos, E.W.; Luc, E. Diatoms as Bioindicators in Rivers. In River Algae; Necchi, J., Ed.; Springer International Publishing: Basel, Switzerland, 2016; p. 245. [Google Scholar] [CrossRef]
- Romanova, E.P.; Goshkaderya, V.A.; Rotar, Y.M.; Kulakov, R.G. Species diversity of zooplankton of the Sok River. Samar. Luka 2007, 16, 547–558. [Google Scholar]
- Sługocki, Ł.; Czerniawski, R.; Kowalska-Góralska, M.; Senze, M.; Reis, A.; Carrola, J.; Teixeira, C. The Impact of Land Use Transformations on Zooplankton Communities in a Small Mountain River (The Corgo River, Northern Portugal). Int. J. Environ. Res. Public Health 2019, 16, 20. [Google Scholar] [CrossRef] [Green Version]
- Mahdy, A.; Hilt, S.; Filiz, N.; Beklioğlu, M.; Hejzlar, J.; Özkundakci, D.; Papastergiadou, E.; Scharfenberger, U.; Šorf, M.; Stefanidis, K.; et al. Effects of water temperature on summer periphyton biomass in shallow lakes: A pan-European mesocosm experiment. Hydrobiologia 2015, 77, 499–510. [Google Scholar] [CrossRef] [Green Version]
- Wang, X.; Zheng, B.; Liu, L.; Li, L. Use of Diatoms in River Health Assessment. Annu. Res. Rev. Biol. 2014, 4, 4054–4074. [Google Scholar] [CrossRef]
- Timmerman, J.G.; Adriaanse, M.; Breukel, R.M.A.; van Oirschot, M.C.M.; Ottens, J.J. Guidelines for water quality monitoring and assessment of transboundary rivers. Eur. Water Pollut. Control 1997, 7, 21–30. [Google Scholar]
- Evers, M. Integrative river basin management: Challenges and methodologies within the German planning system. Environ. Earth Sci. 2016, 75, 1085. [Google Scholar] [CrossRef] [Green Version]
- Soranno, P.A.; Hubler, S.L.; Carpenter, S.R.; Lathrop, R.C. Phosphorus loads to surface waters: A simple model to account for spatial pattern of land use. Ecol. Appl. 1996, 6, 865–878. [Google Scholar] [CrossRef]
- Barinova, S. Ecological mapping in application to aquatic ecosystems bioindication: Problems and methods. J. Environ. Sci. Nat. Resour. 2017, 3, 1–7. [Google Scholar] [CrossRef] [Green Version]
- Rijswick, M.; Gilissen, H.K.; Kempen, J. The need for international and regional transboundary cooperation in European river basin management as a result of new approaches in EC water law. Era Forum 2010, 11, 129–157. [Google Scholar] [CrossRef] [Green Version]
- Zinzani, A. Irrigation Management Transfer and WUAs’ dynamics: Evidence from the South-Kazakhstan Province. Environ. Earth Sci. 2015, 73, 765–777. [Google Scholar] [CrossRef]
- III-VI National Communication of the Republic of Kazakhstan to the UN Framework Convention on Climate Change; Plus Form: Astana, Kazakhstan, 2013; p. 275. Available online: https://unfccc.int/files/national_reports/annex_i_natcom_/application/pdf/kaz_nc3,4,5,6_eng.pdf (accessed on 12 December 2019).
- Whitton, B.A.; Roth, E.; Friedrich, G. (Eds.) Use of Algae for Monitoring Rivers; Institut für Botanik Univ. Press: Innsbruck, Austria, 1991; p. 196. [Google Scholar]
- ISO 8467:1993. Water Quality. Determination of Permanganate Index; ANSI: Washington, DC, USA, 1993; Available online: https://www.iso.org/obp/ui/#iso:std:iso:8467:ed-2:v1:en (accessed on 12 December 2019).
- Semenov, A.D. (Ed.) Guideline for Chemical Analysis of Surface Water; Gidrometeoizdat: Leningrad, Russia, 1977; p. 541. (In Russian) [Google Scholar]
- Fomin, G.S. Water. Control of Chemical, Bacterial and Radiation Safety According to International Standards; NGO “Alternative”: Moscow, Russia, 1995; p. 618. (In Russian) [Google Scholar]
- Guidance on Hydrobiological Monitoring of Surface Ecosystems; Hydrometeoizdat: St. Petersburg, Russia, 1992; p. 318. (In Russian)
- Komárek, J.; Anagnostidis, K. Cyanoprokaryota 1. Teil: Chroococcales. In Süsswasserflora von Mitteleuropa. Band 19/1; Ettl, H., Gärtner, G., Heynig, H., Mollenhauer, E., Eds.; Gustav Fisher: Jena, Germany, 1999; p. 548. [Google Scholar]
- Komárek, J.; Anagnostidis, K. Cyanoprokaryota 2. Teil: Oscillatoriales. In Süßwasserflora von Mitteleuropa, Band 19/2; Büdel, B., Krienitz, L., Gärtner, G., Schager, M., Eds.; Spektrum Akademischer Verlag, Elsevier GmbH: München, Germany, 2005; p. 759. [Google Scholar]
- Krammer, K.; Lange-Bertalot, H. Bacillariophyceae 1. Teil: Naviculaceae. In Süsswasserflora von Mitteleuropa. Band 2/1; Ettl, H., Gerloff, J., Heynig, H., Mollenhauer, D., Eds.; Gustav Fisher: Jena, Germany, 1986; p. 876. [Google Scholar]
- Krammer, K.; Lange-Bertalot, H. Bacillariophyceae 2.Teil: Bacillariaceae, Epithemiaceae, Surirellaceae. In Süsswasserflora von Mitteleuropa. Band 2/2; Ettl, H., Gerloff, J., Heynig, H., Mollenhauer, D., Eds.; Gustav Fisher: Jena, Germany, 1988; p. 596. [Google Scholar]
- Krammer, K.; Lange-Bertalot, H. Bacillariophyceae 3. Teil: Centrales, Fragilariaceae, Eunotiaceae. In Süsswasserflora von Mitteleuropa. Band 2/3; Ettl, H., Gerloff, J., Heynig, H., Mollenhauer, D., Eds.; Gustav Fisher: Jena, Germany, 1991; p. 598. [Google Scholar]
- Krammer, K.; Lange-Bertalot, H. Bacillariophyceae 4. Teil: Achnantaceae. Kritische Ergänzungen zu Navicula (Lineolatae) und Gomphonema. In Süsswasserflora von Mitteleuropa. Band 2/4; Ettl, H., Gerloff, J., Heynig, H., Mollenhauer, D., Eds.; Gustav Fisher: Jena, Germany, 1991; p. 468. [Google Scholar]
- Sládeček, V. Diatoms as indicators of organic pollution. Acta Hydrochim. Hydrobiol. 1986, 14, 555–566. [Google Scholar] [CrossRef]
- Pantle, E.; Buck, H. Die biologische Überwachung der Gewässer und die Darstellung der Ergebnisse. Gas-Und Wasserfach 1955, 96, 604. [Google Scholar]
- Romanenko, V.D.; Oksiyuk, O.P.; Zhukinsky, V.N.; Stolberg, F.V.; Lavrik, V.I. Environmental Assessment of the Impact of Hydraulic Engineering on Water Bodies; Naukova Dumka: Kiev, Ukraine, 1990; p. 256. [Google Scholar]
- Barinova, S. On the Classification of Water Quality from an Ecological Point of View. Int. J. Environ. Sci. Nat. Resour. 2017, 2, 1–8. [Google Scholar] [CrossRef]
- Barinova, S.S.; Medvedeva, L.A.; Anissimova, O.V. Diversity of Algal Indicators in Environmental Assessment; Pilies Studio Publisher: Tel Aviv, Israel, 2006; p. 498. (In Russian) [Google Scholar]
- McAleece, N.; Gage, J.D.G.; Lambshead, P.J.D.; Paterson, G.L.J. BioDiversity Professional Statistics Analysis Software; Scottish Association for Marine Science and the Natural History Museum London: London, UK, 1997. [Google Scholar]
- Negro, A.I.; De Hoyos, C.; Aldasoro, J.J. Diatom and desmid relationships with the environment in mountain lakes and mires of NW Spain. Hydrobiologia 2003, 505, 1–13. [Google Scholar] [CrossRef]
- Niedrist, G.H.; Cantonati, M.; Füreder, L. Environmental harshness mediates the quality of periphyton and chironomid body mass in alpine streams. Freshw. Sci. 2018, 37, 519–533. [Google Scholar] [CrossRef]
- Krupa, E.G.; Barinova, S.M.; Romanova, S.M.; Malybekov, A.B. Hydrobiological assessment of the high mountain Kolsay Lakes (Kungey Alatau, Southeastern Kazakhstan) ecosystems in climatic gradient. Br. J. Environ. Clim. Chang. 2016, 6, 259–278. [Google Scholar] [CrossRef]
- El-Kassas, H.Y.; Gharib, S.M. Phytoplankton abundance and structure as indicator of water quality in the drainage system of the Burullus Lagoon, southern Mediterranean coast. Egypt Environ. Monit. Assess. 2016, 188, 530. [Google Scholar] [CrossRef]
- Lalit, K.; Pandey, T.; Han, J.P. Gaur Response of a phytoplanktonic assemblage to copper and zinc enrichment in microcosm. Ecotoxicology 2015, 24, 573–582. [Google Scholar] [CrossRef]
- Cattaneo, A.; Couillard, Y.; Wunsam, S.; Courcelles, M. Diatom taxonomic and morphological changes as indicators of metal pollution and recovery in Lac Dufault (Quebec, Canada). J. Paleolimnol. 2004, 32, 163–175. [Google Scholar] [CrossRef]
- Thakur, R.K.; Jindal, R.; Singh, U.B.; Ahluwalia, A.S. Plankton diversity and water quality assessment of three freshwater lakes of Mandi (Himachal Pradesh, India) with special reference to planktonic indicators. Environ. Monit. Assess. 2013, 185, 8355–8373. [Google Scholar] [CrossRef] [PubMed]
- Gowen, R.J.; Paterson, R.F.; Mitchell, E.; Stewart, B.M.; McNeill, S.; Glibert, P.M.; Davidson, K. Nitrogen dynamics and phytoplankton community structure: The role of organic nutrients Grigorios Moschonas. Biogeochemistry 2017, 134, 125–145. [Google Scholar] [CrossRef] [Green Version]
- Rimet, F.; Gomà, J.; Cambra, J.; Bertuzzi, E.; Cantonati, M.; Cappelletti, C.; Tison, J. Benthic diatoms in western European streams with altitudes above 800 M: Characterisation of the main assemblages and correspondence with ecoregions. Diatom Res. 2007, 22, 147–188. [Google Scholar] [CrossRef]
- Eliseev, V.I. On the origin of loesses of Central Asia and Kazakhstan. Quat. Study Comm. Bull. 1973, 40, 52–68. [Google Scholar]
- Abollino, O.; Giacomino, A.; Malandrino, M.; Mentasti, E. The Efficiency of Vermiculite as Natural Sorbent for Heavy Metals. Application to a Contaminated Soil. Water Air Soil Pollut. 2007, 181, 149–160. [Google Scholar] [CrossRef]
- Klimov, E.S.; Kalyukova, E.N.; Buzaeva, M.V. Sorption Properties of Natural Sorbent Silica Clay in Relation to Nickel Cations. Russ. J. Appl. Chem. 2010, 83, 1080–1082. [Google Scholar] [CrossRef]
- Murray, H.H. Clay sorbents: The mineralogy, processing and applications. Acta Geodyn. Geomater. 2005, 2, 131–138. [Google Scholar]
- Zhong, Z.; Chen, Z.; Xu, Y.; Ren, C.; Yang, G.; Han, X.; Ren, G.; Feng, Y. Relationship between soil organic carbon stocks and clay content under different climatic conditions in Central China. Forests 2018, 9, 598. [Google Scholar] [CrossRef] [Green Version]
- Barinova, S.; Sivaci, R. Experimental approach to a lake ecosystem assessment in the Great Lota, Turkey. Experiment 2013, 9, 566–586. [Google Scholar]
- Barinova, S.; Tavassi, M.; Glassman, H.; Nevo, E. Algal indication of pollution in the Lower Jordan River, Israel. Appl. Ecol. Environ. Res. 2010, 8, 19–38. [Google Scholar] [CrossRef]
- Barinova, S.S.; Klochenko, P.D.; Belous, Y.P. Algae as Indicators of the Ecological State of Water Bodies: Methods and Prospects. Hydrobiol. J. 2015, 51, 3–21. [Google Scholar] [CrossRef]
- Barinova, S.; Krupa, E.; Kadyrova, U. Spatial dynamics of species richness of phytoplankton of Lake Balkhash (Kazakhstan) in the gradient of abiotic factors. Transylv. Rev. Syst. Ecol. Res. Wetl. Divers. 2017, 19, 1–18. [Google Scholar]
- Bilous, O.; Barinova, S.; Klochenko, P. Phytoplankton of the upper reaches of the Southern Bug River as indicator of its ecological status. Hydrobiol. J. 2012, 48, 39–51. [Google Scholar]
- Khuram, I.; Barinova, S.; Ahmad, N.; Ullah, A.; Din, S.U.; Jan, S.; Hamayun, M. Ecological assessment of water quality in the Kabul River, Pakistan, using statistical methods. Oceanol. Hydrobiol. Stud. 2017, 46, 140–153. [Google Scholar] [CrossRef]
- Krupa, E.G. Zooplankton of the Syr Darya River as an Indicator of Anthropogenic Impact. Ecol. Hydrofauna Transbound. Basins Kazakhstan Almaty 2008, 92–112. [Google Scholar]


| Water Quality Class | Rank | Color Code | N-NH4+ mg/L | N-NO2− mg/L | N-NO3− mg/L | PI, mg O/L | Secchi Transparency, m | Sládeček’s Saprobity SI |
|---|---|---|---|---|---|---|---|---|
| I—very pure | 1 | blue | <0.05 | 0 | <0.05 | <2.0 | >3.00 | <0.5 |
| II—pure | 2 | green | 0.05–0.10 | 0.001–0.002 | 0.05–0.20 | 2.0–4.0 | 0.75–3.00 | 0.5–1.0 |
| II—pure | 3 | green | 0.11–0.20 | 0.003–0.005 | 0.21–0.50 | 4.1–6.0 | 0.55–0.70 | 1.0–1.5 |
| III—moderate | 4 | yellow | 0.21–0.30 | 0.006–0.010 | 0.51–1.00 | 6.1–8.0 | 0.45–0.50 | 1.5–2.0 |
| III—moderate | 5 | yellow | 0.31–0.50 | 0.011–0.020 | 1.01–1.50 | 8.1–10.0 | 0.35–0.40 | 2.0–2.5 |
| IV—polluted | 6 | orange | 0.51–1.00 | 0.021–0.050 | 1.51–2.00 | 10.1–15.0 | 0.25–0.30 | 2.5–3.0 |
| IV—polluted | 7 | orange | 1.01–2.50 | 0.051–0.100 | 2.01–2.50 | 15.1–20.0 | 0.15–0.20 | 3.0–3.5 |
| V—very polluted | 8 | red | 2.51–5.00 | 0.101–0.300 | 2.51–4.00 | 20.1–25.0 | 0.05–0.10 | 3.5–4.0 |
| V—very polluted | 9 | red | >5.00 | >0.300 | >4.00 | >25.0 | <0.005 | >4.0 |
| River Name | No of Station | North | East | Altitude, m a.s.l. | Depth, m | Secchi Transparency, m | Tempe-rature, °C | Color of Water |
|---|---|---|---|---|---|---|---|---|
| Arys | 1 | 42°30′37.0 | 70°37′14.6 | 1135 | 0.10–0.15 | 0.05 | 22.2 | brown |
| Arys | 2 | 42°34′50.91 | 69°58′20.57 | 494 | 0.7–0.8 | 0.2 | 23.1 | greenish |
| Arys | 3 | 42°35′13.8 | 69°18′31.6 | 289 | 1.5–2.0 | 0.1 | 23.0 | light brown |
| Arys | 4 | 42°27′52.2 | 69°57′02.5 | 231 | 1.0–1.5 | 0.1 | 24.9 | clayey |
| Arys | 5 | 42°41′16.26 | 68°27′13.18 | 205 | 1.5–2.0 | 0.2 | 27.2 | clayey |
| Jabaglysu | 6 | 42°25′11.3 | 70°33′00.7 | 1330 | 1.3–1.4 | 0.1 | 13.9 | light gray |
| Jetimsay | 7 | 42°24′18.7 | 70°32′50.1 | 1513 | 0.3–0.4 | 0.3–0.4 | 10.2 | colorless |
| Aksu | 8 | 42°20′06.3 | 70°27′10.1 | 1469 | 1.5–1.8 | 0.2 | 12.2 | whitish |
| *spring | 9 | 42°20′06.3 | 70°27′10.1 | 1469 | 0.10–0.15 | to the bottom | 10.8 | colorless |
| Sayramsu | 10 | 42°15′50.14 | 69°57′22.96 | 873 | 1.5 | 0.2 | 14.5 | light brown |
| Badam | 11 | 42°06′02.7 | 69°57′48.2 | 960 | 0.7–0.8 | 0.7–0.8 | 15.6 | light gray |
| Badam | 12 | 42°30′08.6 | 69°04′14.2 | 251 | 1.5–2.0 | 0.1 | 23.2 | clayey |
| Jilandy | 13 | 42°35′56.2 | 70°14′25.3 | 723 | 0.2–0.3 | 0.2–0.3 | 17.0 | greenish |
| RIVER NAME | No of Station | TDS, mg/L | PI, mg O/L | N-NO2−, mg/L | N-NO3−, mg/L | N-NH4+, mg/L | Index SI |
|---|---|---|---|---|---|---|---|
| Arys | 1 | 215.3 | 4.62 | 0.018 | 0.443 | 0.039 | 1.82 |
| Arys | 2 | 382.3 | 3.00 | 0.008 | 2.060 | 0.008 | 1.86 |
| Arys | 3 | 410.2 | 2.00 | 0.030 | 2.115 | 0.023 | 1.84 |
| Arys | 4 | 440.7 | 3.20 | 0.008 | 0.000 | 0.023 | 1.91 |
| Arys | 5 | 526.0 | 2.83 | 0.033 | 1.267 | 0.016 | 1.74 |
| Jabaglysu | 6 | 160.1 | 2.60 | 0.002 | 0.319 | 0.031 | 2.03 |
| Jetimsay | 7 | 239.9 | 2.20 | 0.009 | 0.001 | 0.023 | 1.74 |
| Aksu | 8 | 164.6 | 2.08 | 0.006 | 0.233 | 0.039 | 1.62 |
| spring | 9 | 198.2 | 1.72 | 0.002 | 0.002 | 0.070 | 1.56 |
| Sayramsu | 10 | 161.8 | 2.22 | 0.032 | 0.373 | 0.054 | 2.11 |
| Badam | 11 | 187.4 | 2.24 | 0.030 | 0.194 | 0.039 | 1.72 |
| Badam | 12 | 415.6 | 3.02 | 0.010 | 1.936 | 0.047 | 1.62 |
| Jilandy | 13 | 521.5 | 4.44 | 0.005 | 2.946 | 0.047 | 1.95 |
| No of Station | Transparency | PI | N-NO2− | N-NO3− | N-NH4+ | Index SI | WESI |
|---|---|---|---|---|---|---|---|
| 1 | 5 | 3 | 5 | 3 | 1 | 4 | 1.33 |
| 2 | 7 | 2 | 4 | 7 | 1 | 4 | 0.57 |
| 3 | 8 | 2 | 6 | 7 | 1 | 4 | 0.57 |
| 4 | 8 | 2 | 4 | 1 | 1 | 4 | 4.00 |
| 5 | 7 | 2 | 6 | 5 | 1 | 4 | 0.80 |
| 6 | 8 | 2 | 2 | 3 | 1 | 5 | 1.67 |
| 7 | 5 | 2 | 4 | 1 | 1 | 4 | 4.00 |
| 8 | 7 | 2 | 4 | 3 | 1 | 4 | 1.33 |
| 9 | 7 | 1 | 2 | 1 | 2 | 4 | 4.00 |
| 10 | 7 | 2 | 6 | 3 | 2 | 5 | 1.67 |
| 11 | 2 | 2 | 6 | 2 | 1 | 4 | 2.00 |
| 12 | 8 | 2 | 4 | 6 | 1 | 4 | 0.67 |
| 13 | 6 | 3 | 3 | 8 | 1 | 4 | 0.50 |
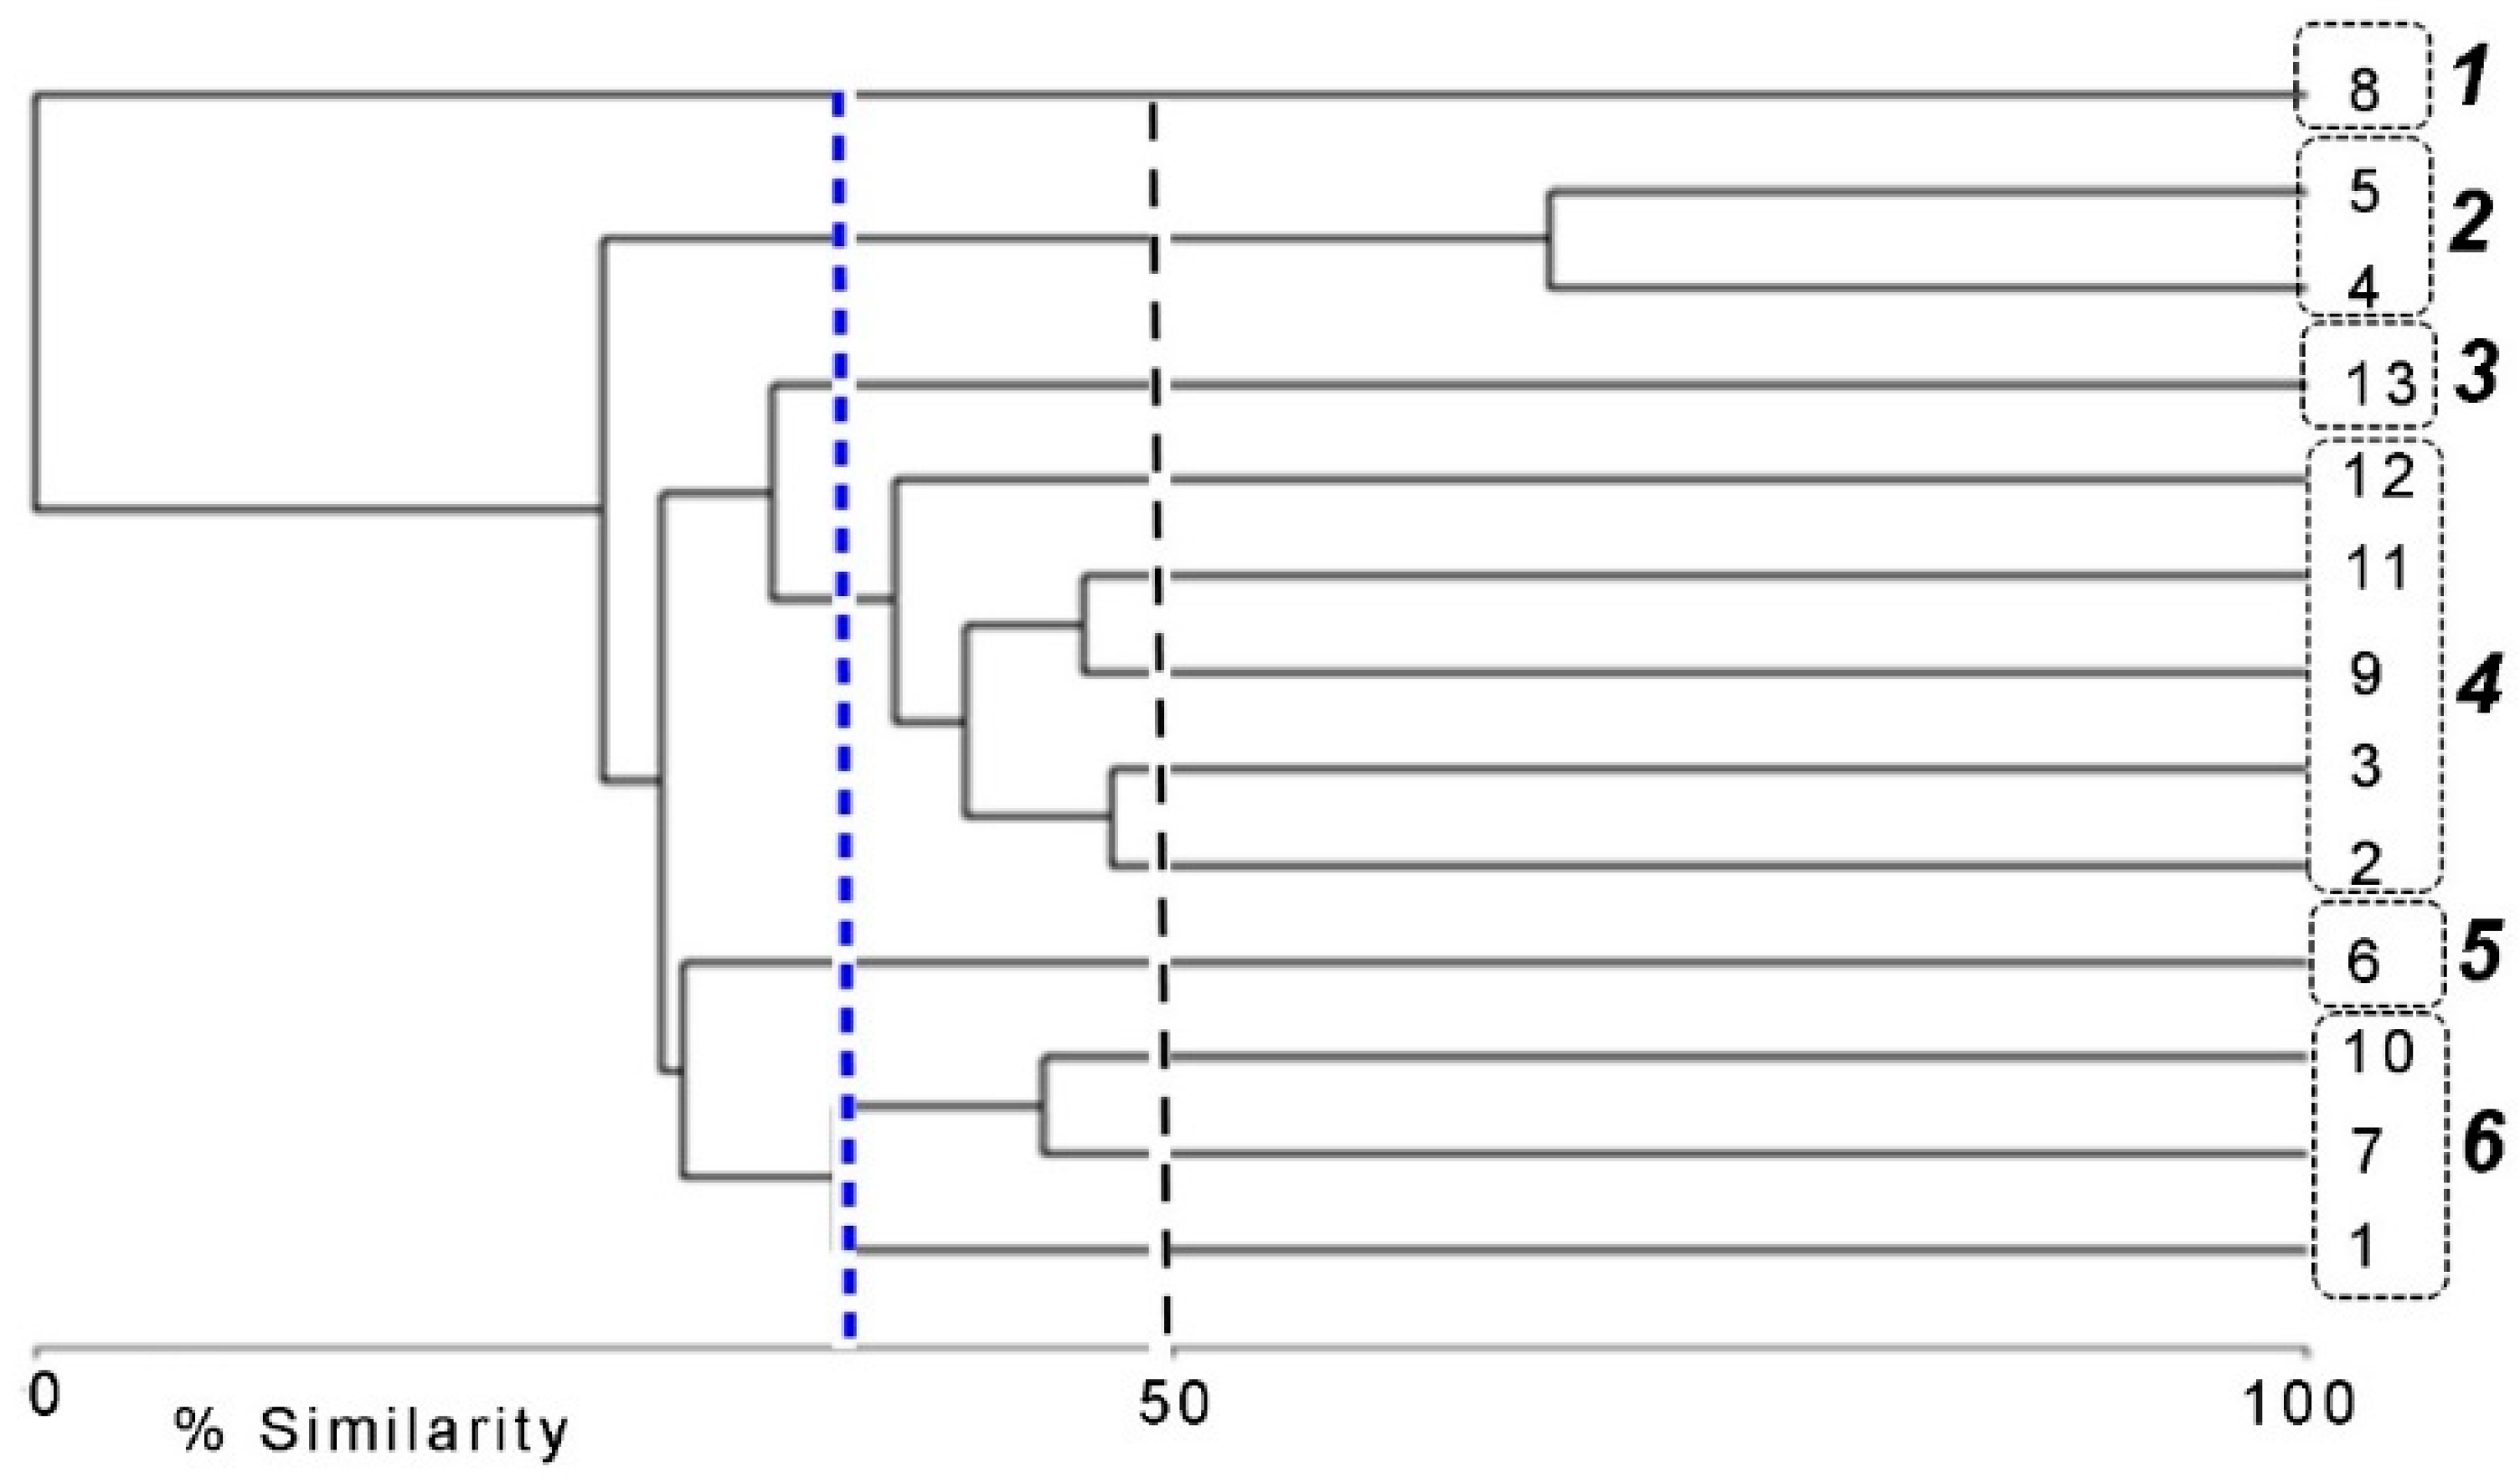
| Cluster Number | Stations | Name | Common Species | Number of Species | TDS, mg/L | Altitude, m a.s.l. |
|---|---|---|---|---|---|---|
| 1 | 8 | Aksu | Anathece clathrata (W.West and G.S.West) Komárek, Kastovsky and Jezberová | 3 | 164.6 | 1469 |
| 2 | 4,5 | Arys, downstream | Stigeoclonium sp., Ulnaria ulna (Nitzsch) P.Compère, Nitzschia palea (Kützing) W.Smith | 10 | 440.7–526.0 | 1469 |
| 3 | 13 | Jilandy | Ulnaria ulna (Nitzsch) P.Compère, Stigeoclonium sp., Rhoicosphenia abbreviata (C.Agardh) Lange-Bertalot | 17 | 521.5 | 723 |
| 4 | 2,3,9, 11,12 | Arys, middle reaches, Badam, spring | Diatoma vulgaris Bory, Mougeotia sp., Diatoma hyemalis (Roth) Heiberg, Ulnaria ulna (Nitzsch) P.Compère | 52 | 187.4–415.6 | 251–960, 1469 |
| 5 | 6 | Jabaglysu | Lyngbya aestuarii Liebman ex Gomont, Oscillatoria curviceps C.Agardh ex Gomont, Klebsormidium subtile (Kützing) Mikhailyuk, Glaser, Holzinger and Karsten | 5 | 160.1 | 1330 |
| 6 | 1,7, 10 | Arys, upstream, Jetimsay, Sayramsu | Encyonema elginense (Krammer) D.G.Mann, Pseudanabaena limnetica (Lemmermann) Komárek, Navicula cryptocephala Kützing, Eolimna minima (Grunow) Lange-Bertalot and W.Schiller | 19 | 161.8–239.9 | 873–1513 |
© 2019 by the authors. Licensee MDPI, Basel, Switzerland. This article is an open access article distributed under the terms and conditions of the Creative Commons Attribution (CC BY) license (http://creativecommons.org/licenses/by/4.0/).
Share and Cite
Krupa, E.G.; Barinova, S.S.; Romanova, S.M. Ecological Mapping in Assessing the Impact of Environmental Factors on the Aquatic Ecosystem of the Arys River Basin, South Kazakhstan. Diversity 2019, 11, 239. https://doi.org/10.3390/d11120239
Krupa EG, Barinova SS, Romanova SM. Ecological Mapping in Assessing the Impact of Environmental Factors on the Aquatic Ecosystem of the Arys River Basin, South Kazakhstan. Diversity. 2019; 11(12):239. https://doi.org/10.3390/d11120239
Chicago/Turabian StyleKrupa, Elena G., Sophia S. Barinova, and Sophia M. Romanova. 2019. "Ecological Mapping in Assessing the Impact of Environmental Factors on the Aquatic Ecosystem of the Arys River Basin, South Kazakhstan" Diversity 11, no. 12: 239. https://doi.org/10.3390/d11120239