
A Multi-Gene Signature of Non-Muscle-Invasive Bladder Cancer Identifies Patients Who Respond to Immunotherapies Including Bacillus Calmette–Guérin and Immune Checkpoint Inhibitors

Abstract
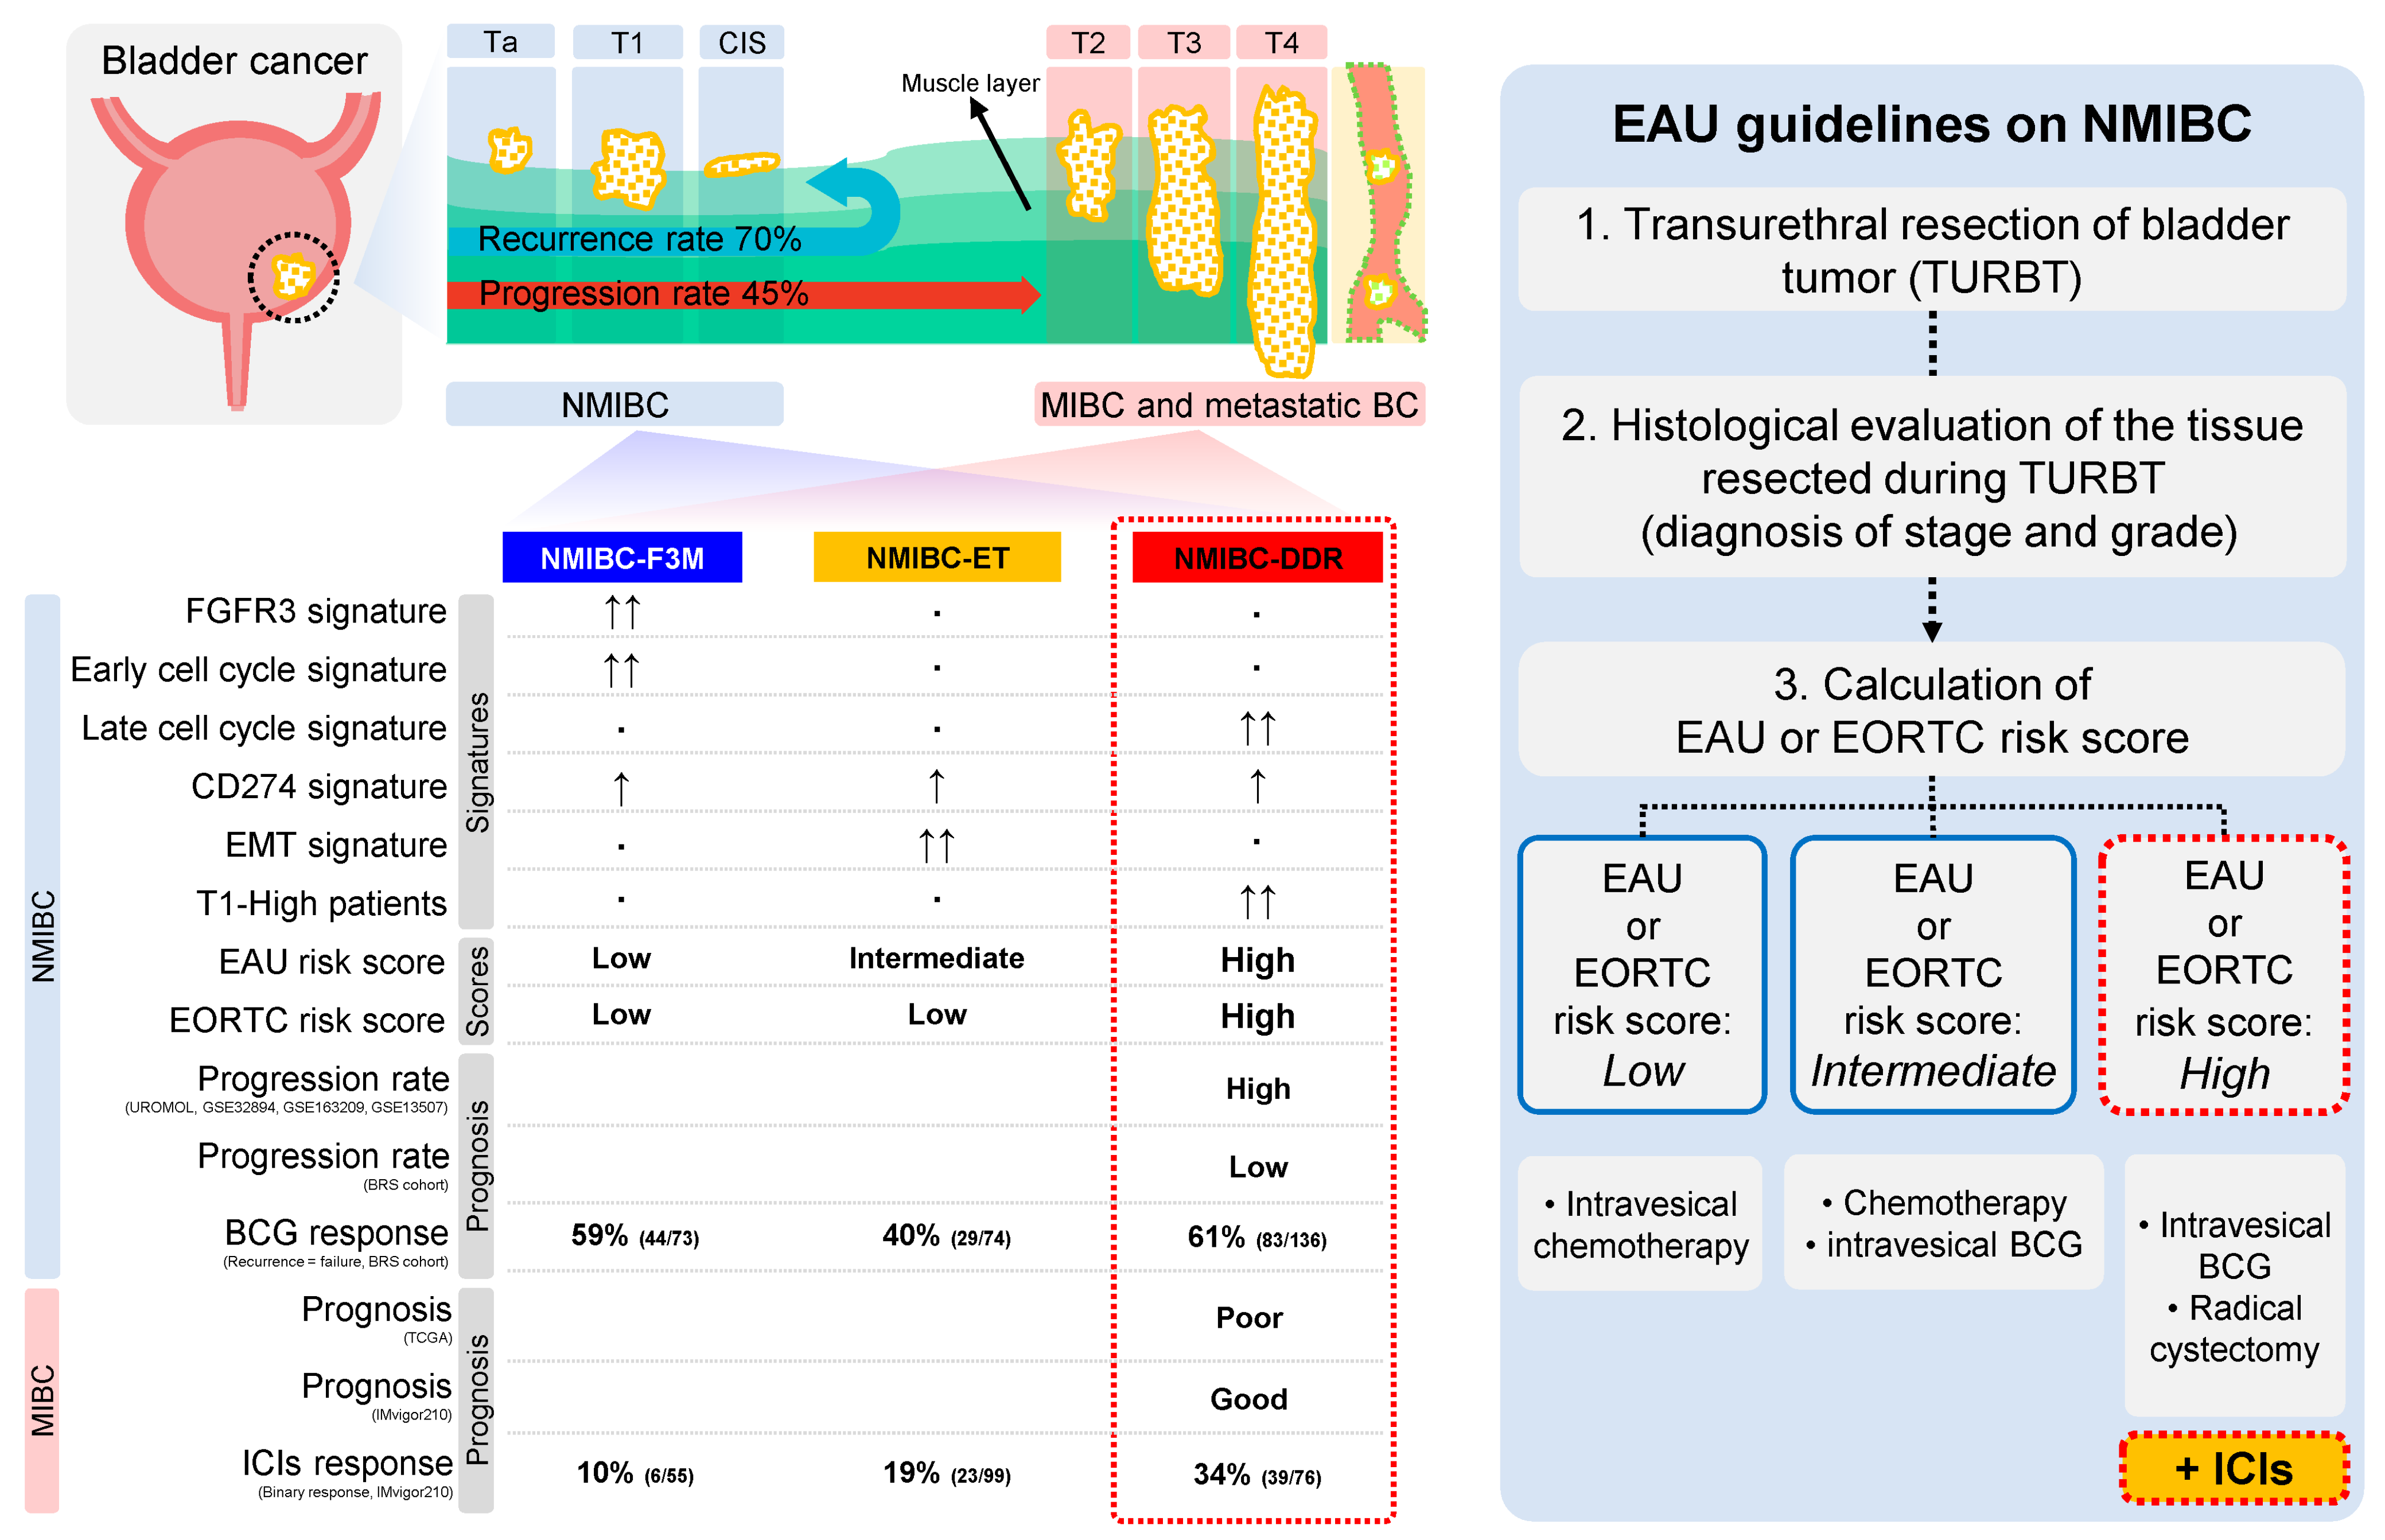
:1. Introduction
2. Results
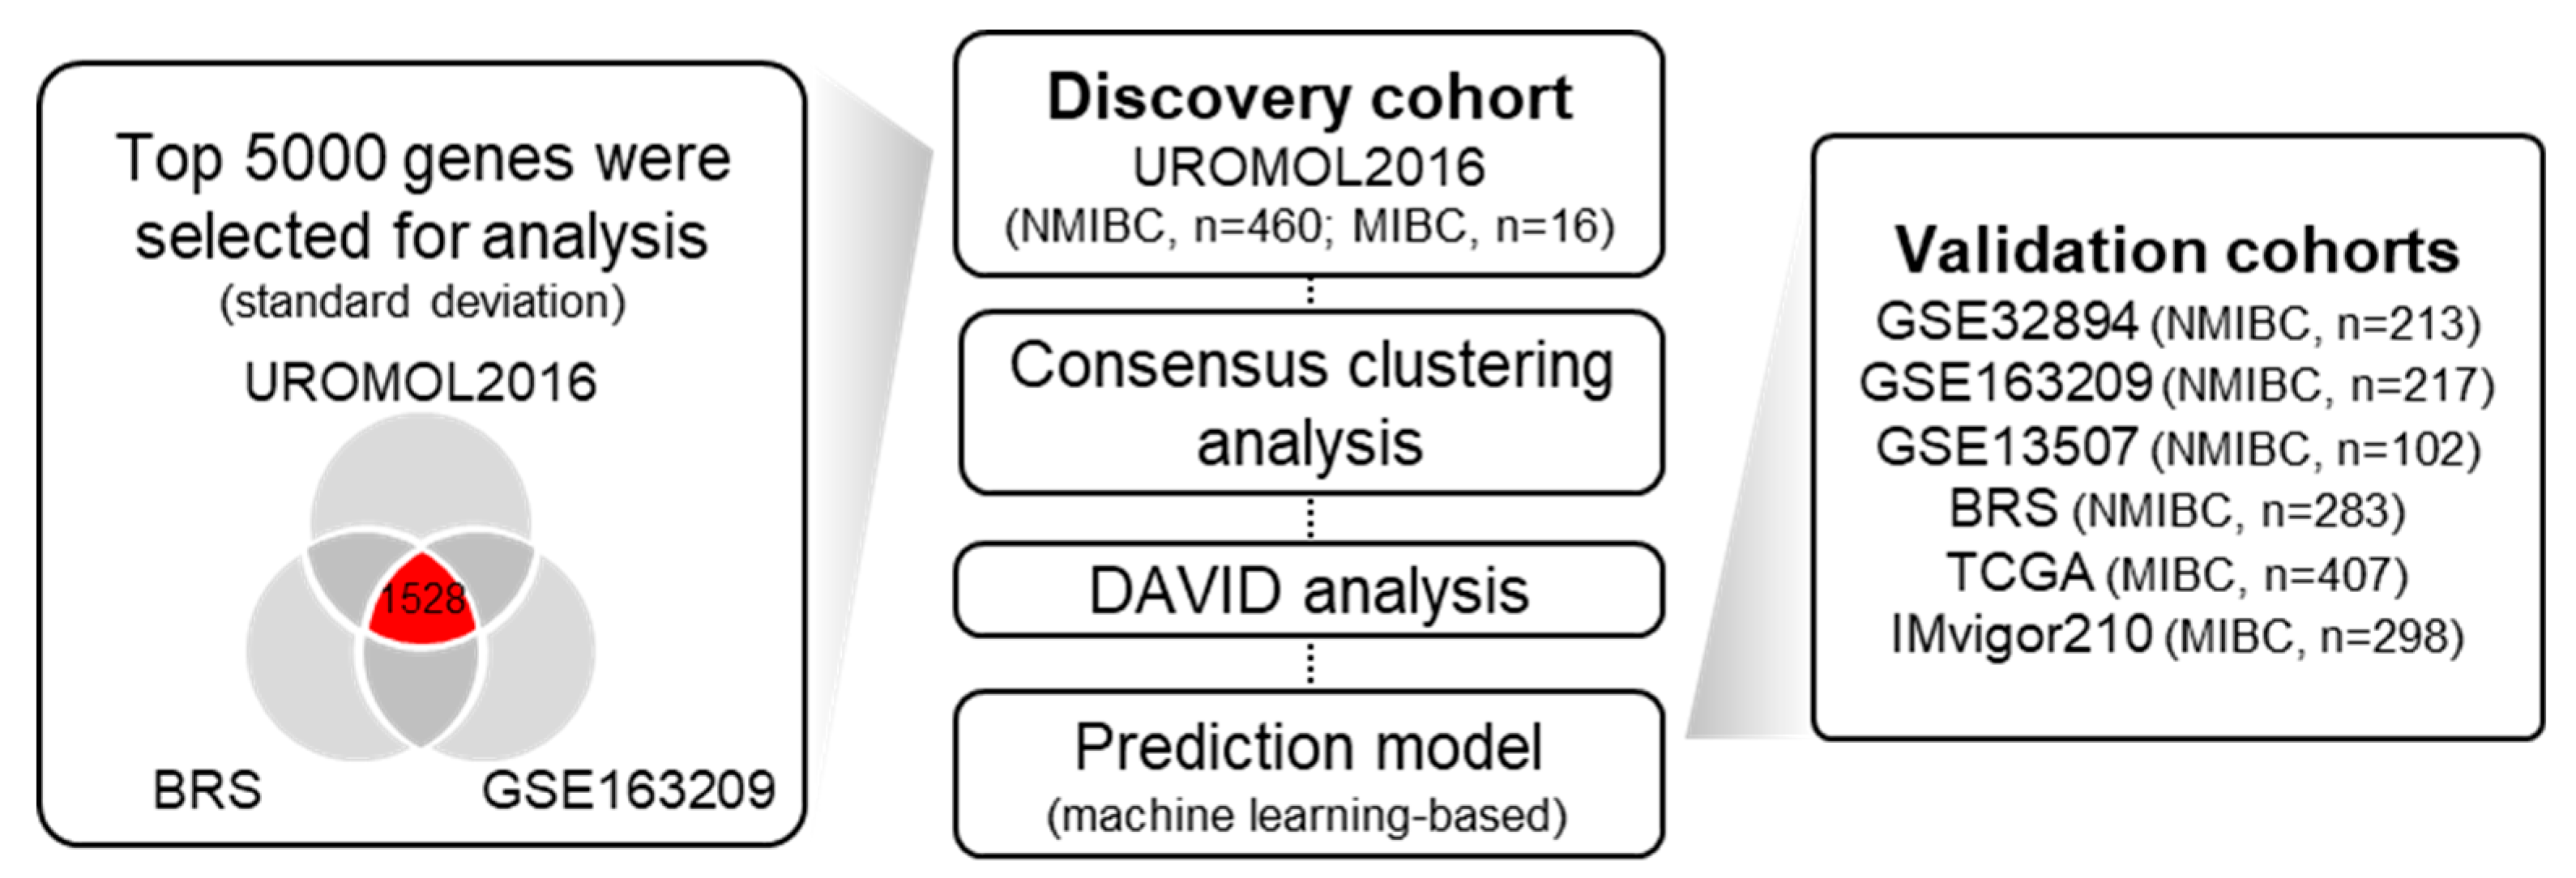
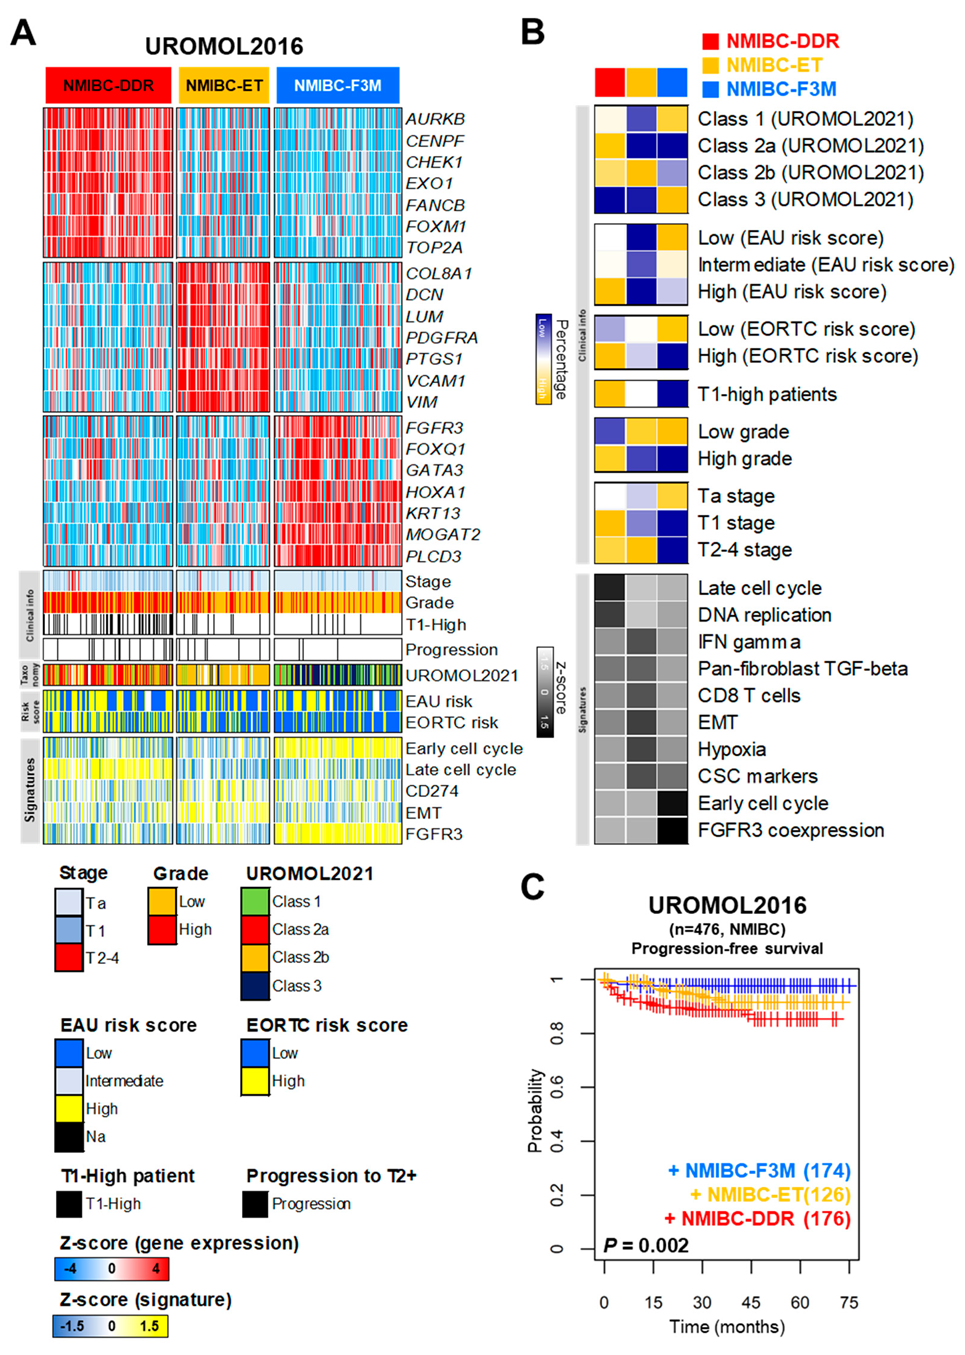
2.1. Identification of Distinct Molecular Subtypes of NMIBC
2.2. Characteristics of Distinct Molecular Subtypes of NMIBC
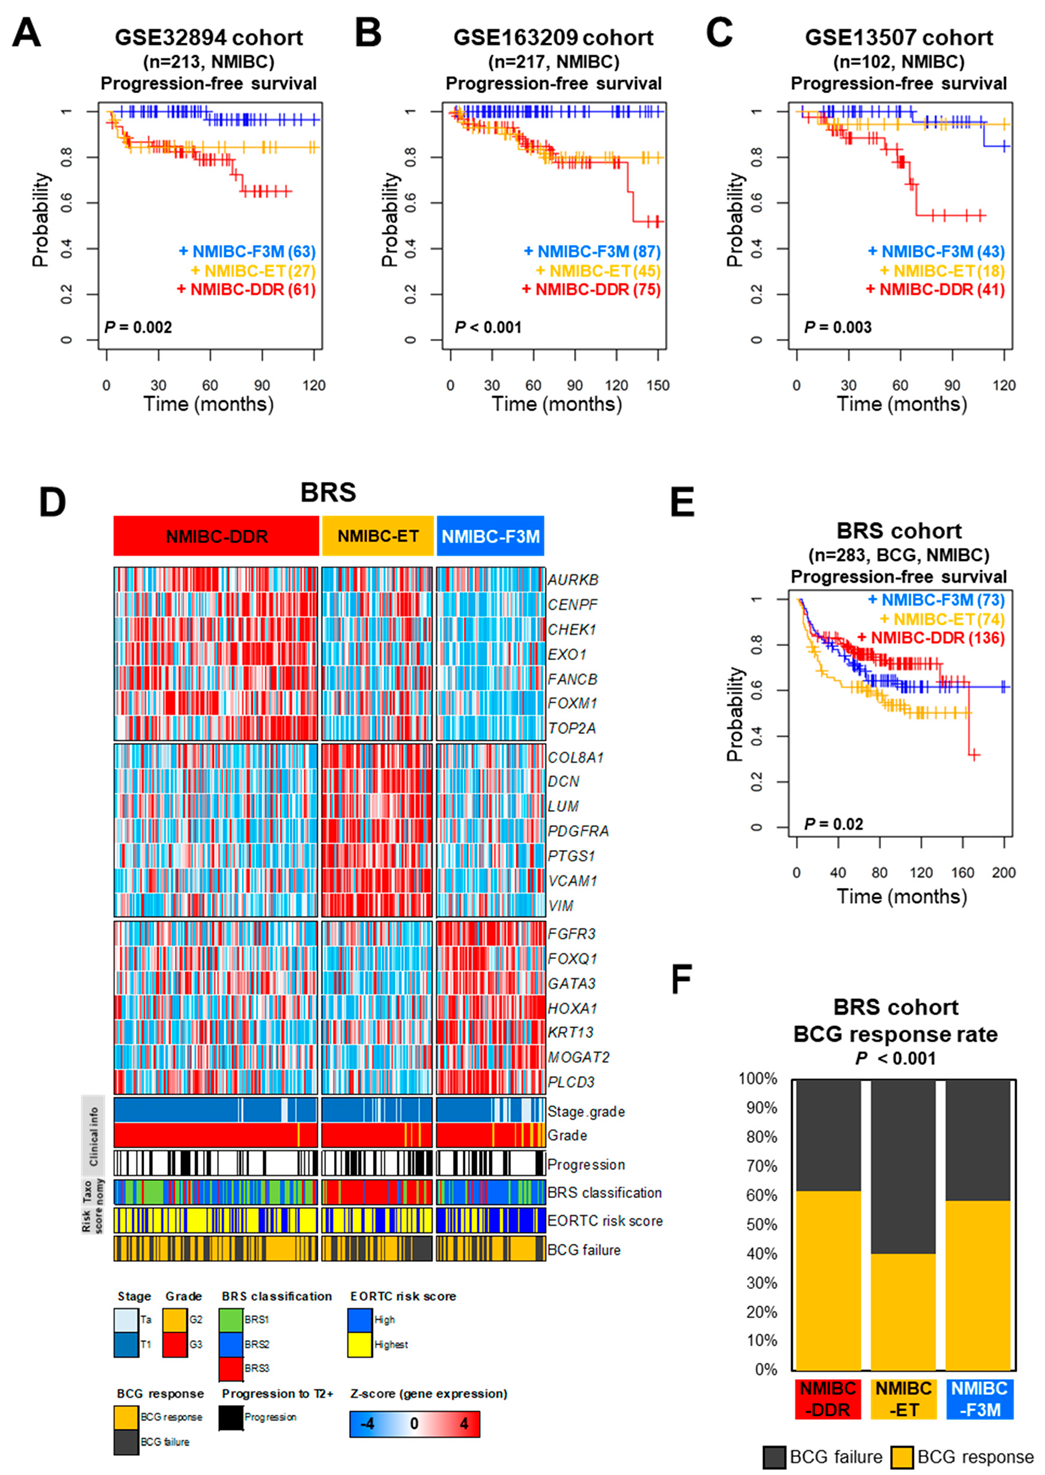
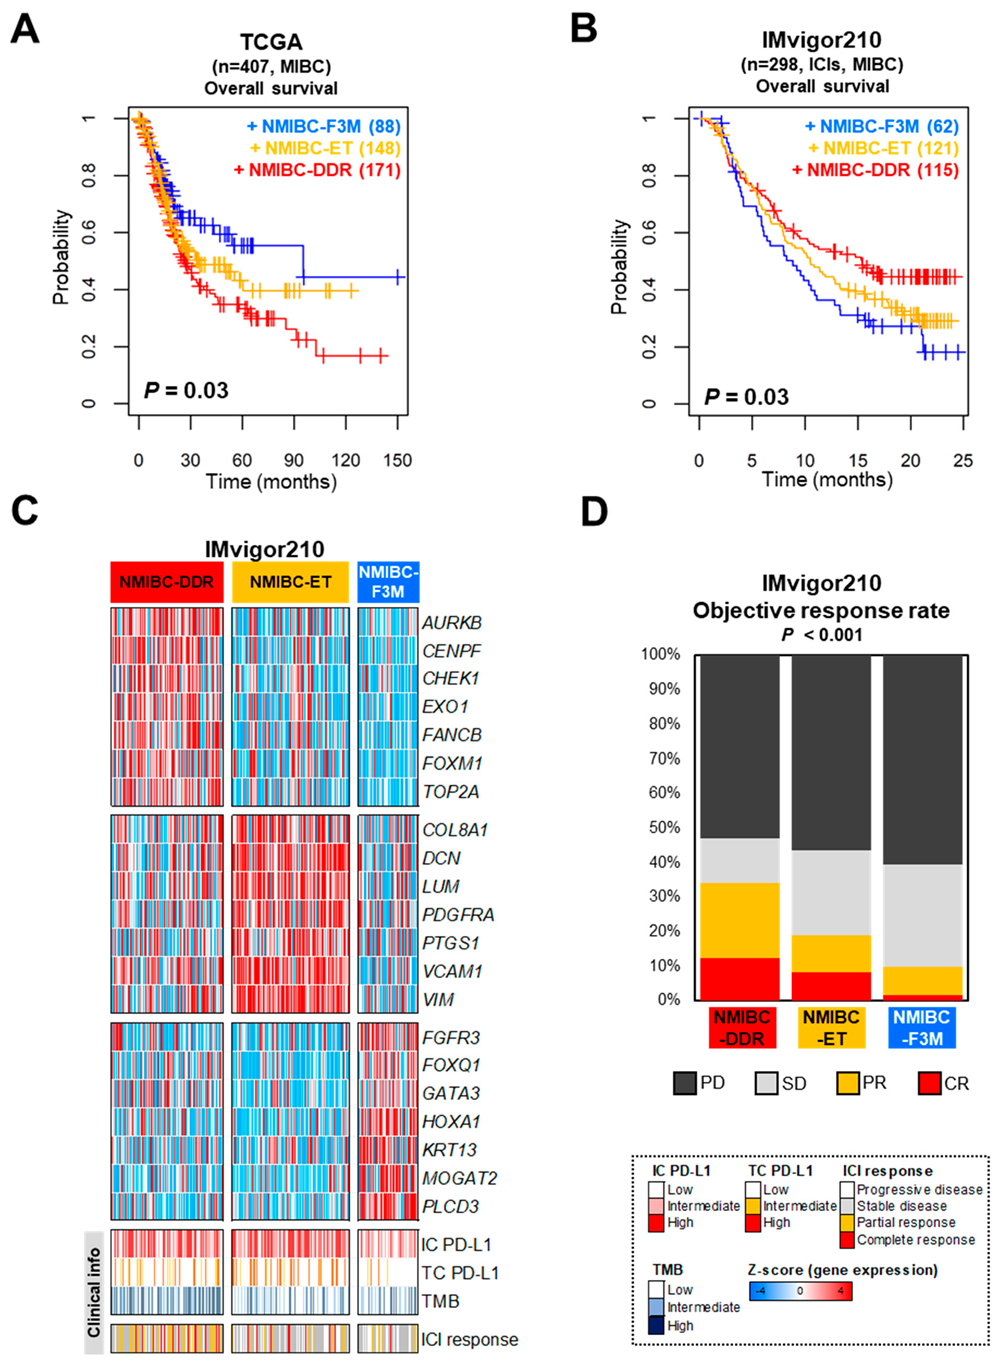
2.3. Prognostic Impact of Distinct Molecular Subtypes of NMIBC
2.4. NMIBC-DDR Was Associated with a Better Response to Immunotherapy Such as BCG and Immune Checkpoint Inhibitor Treatment
2.5. Comparison of Prognostic Relevance of Clinical Risk Factors and Molecular Subtypes of NMIBC
3. Discussion
4. Materials and Methods
4.1. Public Datasets of NMIBC and MIBC Patients
4.2. Processing of Transcriptomic Data and Clustering Analysis
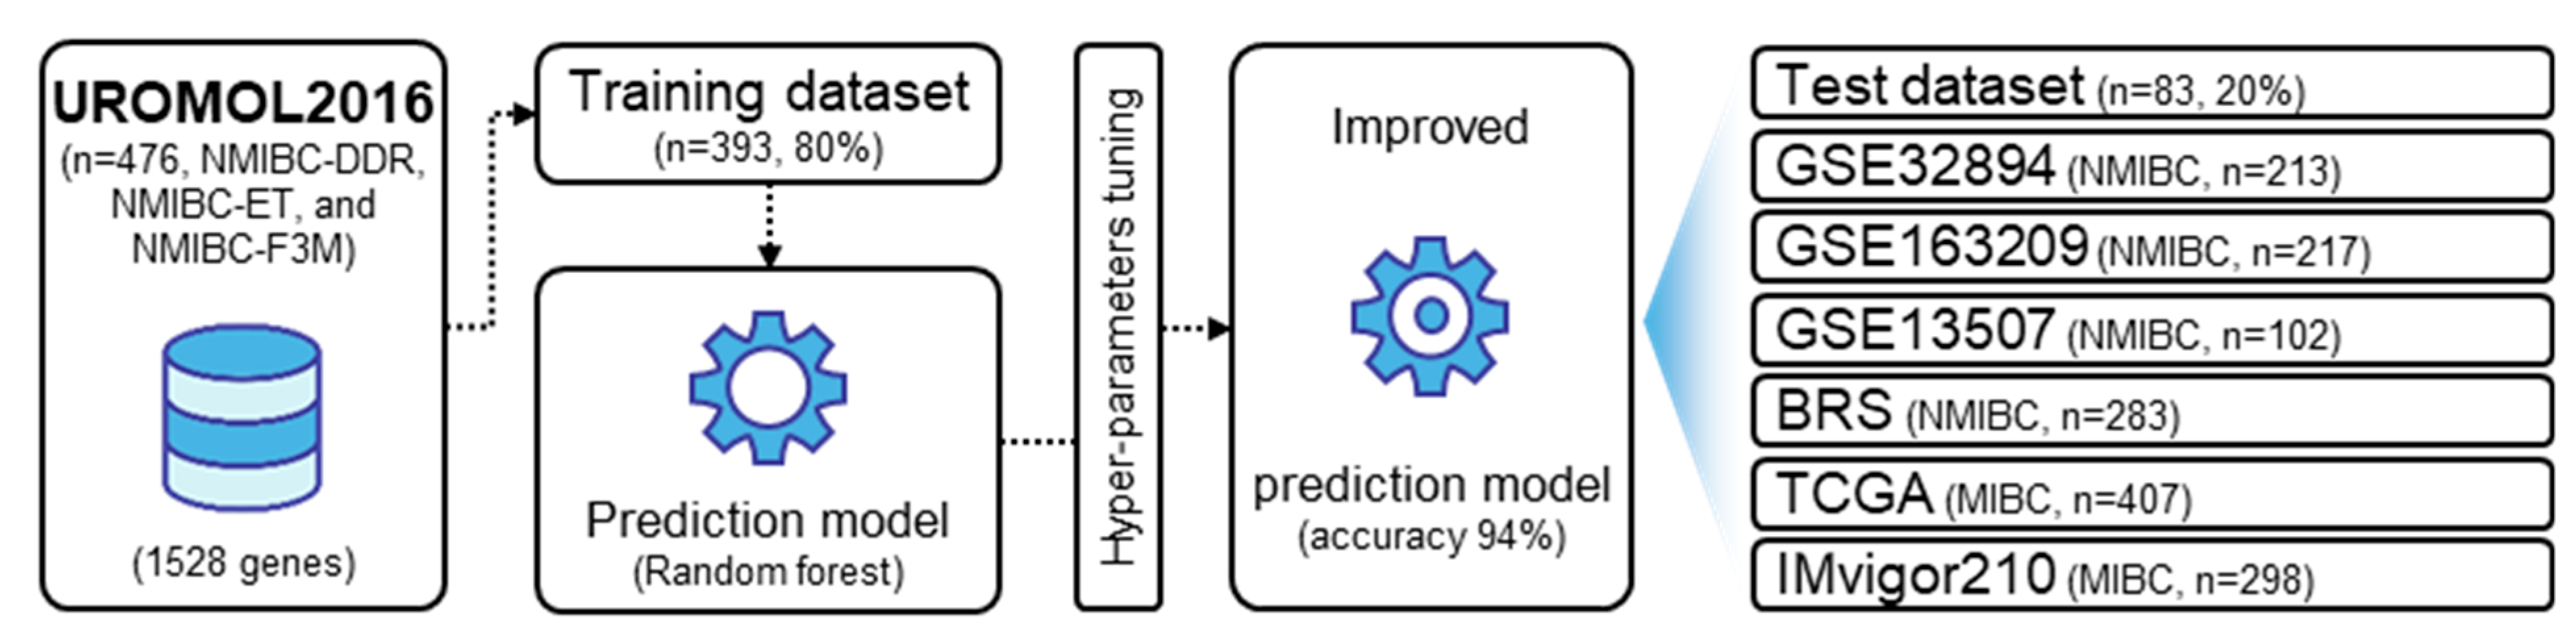
4.3. Development of Prediction Model Based on the Multi-Gene Signature
4.4. Biological Pathway and Statistical Analysis
4.5. Data Availability
5. Conclusions
Supplementary Materials
Author Contributions
Funding
Institutional Review Board Statement
Informed Consent Statement
Data Availability Statement
Conflicts of Interest
References
- Siegel, R.L.; Giaquinto, A.N.; Jemal, A. Cancer statistics, 2024. CA Cancer J. Clin. 2024, 74, 12–49. [Google Scholar] [CrossRef] [PubMed]
- Tran, L.; Xiao, J.-F.; Agarwal, N.; Duex, J.E.; Theodorescu, D. Advances in bladder cancer biology and therapy. Nat. Rev. Cancer 2021, 21, 104–121. [Google Scholar] [CrossRef] [PubMed]
- Gontero, P.; Compérat, E.; Dominguez Escrig, J.L.; Liedberg, F.; Mariappan, P.; Masson-Lecomte, A.; Mostafid, A.H.; van Rhijn, B.W.G.; Rouprêt, M.; Seisen, T.; et al. EAU Guidelines on Non-muscle-Invasive Bladder-Cancer. In Proceedings of the EAU Annual Congress, Milan, Italy, 10 March 2023. [Google Scholar]
- Chou, R.; Selph, S.; Buckley, D.I.; Fu, R.; Griffin, J.C.; Grusing, S.; Gore, J.L. Intravesical Therapy for the Treatment of Nonmuscle Invasive Bladder Cancer: A Systematic Review and Meta-Analysis. J. Urol. 2017, 197, 1189–1199. [Google Scholar] [CrossRef] [PubMed]
- Messing, E.M.; Julián, E. The BCG Shortage. Bladder Cancer 2017, 3, 227–228. [Google Scholar] [CrossRef] [PubMed]
- Morales, A.; Siemens, D.R.; Koti, M. At a time of global BCG shortage, attempts at optimizing BCG dose and schedule is no longer the answer. Urol. Oncol. 2021, 39, 137–138. [Google Scholar] [CrossRef] [PubMed]
- Namkoong, H.; Horita, N.; Ebina-Shibuya, R. Concern over a COVID-19-related BCG shortage. Int. J. Tuberc. Lung Dis. 2020, 24, 642–643. [Google Scholar] [CrossRef] [PubMed]
- Chung, R.; McKiernan, J.; Arpaia, N.; Marabelle, A.; Rouanne, M. Neo-Adjuvant immunotherapies: Bladder cancer as a platform for drug development targeting mucosal immunity. Eur. J. Cancer 2023, 187, 58–64. [Google Scholar] [CrossRef] [PubMed]
- Perera, M.; Papa, N.; Christidis, D.; McGrath, S.; Manning, T.; Roberts, M.; Bolton, D.; Lawrentschuk, N.; Sengupta, S. The impact of the global bacille Calmette-Guerin shortage on treatment patterns: Population-based data. BJU Int. 2018, 121, 169–172. [Google Scholar] [CrossRef] [PubMed]
- Shibue, T.; Weinberg, R.A. EMT, CSCs, and drug resistance: The mechanistic link and clinical implications. Nat. Rev. Clin. Oncol. 2017, 14, 611–629. [Google Scholar] [CrossRef]
- Liu, T.; Han, C.; Wang, S.; Fang, P.; Ma, Z.; Xu, L.; Yin, R. Cancer-associated fibroblasts: An emerging target of anti-cancer immunotherapy. J. Hematol. Oncol. 2019, 12, 86. [Google Scholar] [CrossRef]
- Yan, Y.; Huang, Z.; Cai, J.; Tang, P.; Zhang, F.; Tan, M.; Shen, B. Identification of a novel immune microenvironment signature predicting survival and therapeutic options for bladder cancer. Aging 2020, 13, 2780–2802. [Google Scholar] [CrossRef] [PubMed]
- Li, P.; Hao, S.; Ye, Y.; Wei, J.; Tang, Y.; Tan, L.; Liao, Z.; Zhang, M.; Li, J.; Gui, C.; et al. Identification of an Immune-Related Risk Signature Correlates with Immunophenotype and Predicts Anti-PD-L1 Efficacy of Urothelial Cancer. Front. Cell Dev. Biol. 2021, 9, 646982. [Google Scholar] [CrossRef]
- Chen, X.; Xu, R.; He, D.; Zhang, Y.; Chen, H.; Zhu, Y.; Cheng, Y.; Liu, R.; Zhu, R.; Gong, L.; et al. CD8+ T effector and immune checkpoint signatures predict prognosis and responsiveness to immunotherapy in bladder cancer. Oncogene 2021, 40, 6223–6234. [Google Scholar] [CrossRef] [PubMed]
- Strickler, J.H.; Hanks, B.A.; Khasraw, M. Tumor Mutational Burden as a Predictor of Immunotherapy Response: Is More Always Better? Clin. Cancer Res. 2021, 27, 1236–1241. [Google Scholar] [CrossRef] [PubMed]
- Mariathasan, S.; Turley, S.J.; Nickles, D.; Castiglioni, A.; Yuen, K.; Wang, Y.; Kadel Iii, E.E.; Koeppen, H.; Astarita, J.L.; Cubas, R.; et al. TGFbeta attenuates tumour response to PD-L1 blockade by contributing to exclusion of T cells. Nature 2018, 554, 544–548. [Google Scholar] [CrossRef] [PubMed]
- Hedegaard, J.; Lamy, P.; Nordentoft, I.; Algaba, F.; Høyer, S.; Ulhøi, B.P.; Vang, S.; Reinert, T.; Hermann, G.G.; Mogensen, K.; et al. Comprehensive Transcriptional Analysis of Early-Stage Urothelial Carcinoma. Cancer Cell 2016, 30, 27–42. [Google Scholar] [CrossRef] [PubMed]
- Lindskrog, S.V.; Prip, F.; Lamy, P.; Taber, A.; Groeneveld, C.S.; Birkenkamp-Demtröder, K.; Jensen, J.B.; Strandgaard, T.; Nordentoft, I.; Christensen, E.; et al. An integrated multi-omics analysis identifies prognostic molecular subtypes of non-muscle-invasive bladder cancer. Nat. Commun. 2021, 12, 2301. [Google Scholar] [CrossRef] [PubMed]
- Sjodahl, G.; Lauss, M.; Lövgren, K.; Chebil, G.; Gudjonsson, S.; Veerla, S.; Patschan, O.; Aine, M.; Fernö, M.; Ringnér, M.; et al. A molecular taxonomy for urothelial carcinoma. Clin. Cancer Res. 2012, 18, 3377–3386. [Google Scholar] [CrossRef]
- Hurst, C.D.; Cheng, G.; Platt, F.M.; Castro, M.A.; Marzouka, N.-A.S.; Eriksson, P.; Black, E.V.; Alder, O.; Lawson, A.R.; Lindskrog, S.V.; et al. Stage-stratified molecular profiling of non-muscle-invasive bladder cancer enhances biological, clinical, and therapeutic insight. Cell Rep. Med. 2021, 2, 100472. [Google Scholar] [CrossRef]
- Lee, J.S.; Leem, S.-H.; Lee, S.-Y.; Kim, S.-C.; Park, E.-S.; Kim, S.-K.; Kim, Y.-J.; Kim, W.-J.; Chu, I.-S. Expression signature of E2F1 and its associated genes predict superficial to invasive progression of bladder tumors. J. Clin. Oncol. 2010, 28, 2660–2667. [Google Scholar] [CrossRef]
- De Jong, F.C.; de Jong, F.C.; Laajala, T.D.; Hoedemaeker, R.F.; Jordan, K.R.; van der Made, A.C.; Boevé, E.R.; van der Schoot, D.K.; Nieuwkamer, B.; Janssen, E.A.; et al. Non-muscle-invasive bladder cancer molecular subtypes predict differential response to intravesical Bacillus Calmette-Guerin. Sci. Transl. Med. 2023, 15, eabn4118. [Google Scholar] [CrossRef] [PubMed]
- Dobin, A.; Davis, C.A.; Schlesinger, F.; Drenkow, J.; Zaleski, C.; Jha, S.; Batut, P.; Chaisson, M.; Gingeras, T.R. STAR: Ultrafast universal RNA-seq aligner. Bioinformatics 2013, 29, 15–21. [Google Scholar] [CrossRef] [PubMed]
- Liao, Y.; Smyth, G.K.; Shi, W. featureCounts: An efficient general purpose program for assigning sequence reads to genomic features. Bioinformatics 2014, 30, 923–930. [Google Scholar] [CrossRef]
- Wilkerson, M.D.; Hayes, D.N. ConsensusClusterPlus: A class discovery tool with confidence assessments and item tracking. Bioinformatics 2010, 26, 1572–1573. [Google Scholar] [CrossRef] [PubMed]


| Variable | UROMOL2016 | GSE32894 | GSE163209 | GSE13507 | BRS | TCGA | IMvigor210 |
|---|---|---|---|---|---|---|---|
| Total | 476 (100) | 213 (100) | 217 (100) | 102 (100) | 283 (100) | 407 (100) | 298 (100) |
| Sex | |||||||
| Male | 367 (77.1) | 158 (74.2) | 159 (73.3) | 86 (84.3) | 227 (80.2) | 301 (73.9) | 233 (78.2) |
| Female | 109 (22.9) | 55 (25.8) | 58 (26.7) | 16 (15.7) | 56 (19.8) | 106 (26.1) | 65 (21.8) |
| Grade | |||||||
| NA | 0 | 1 (0.5) | 0 | 0 | 0 | 3 (0.1) | 298 (100) |
| PUNLMP | 7 (1.5) | 0 | 0 | 0 | 0 | 0 | 0 |
| Low or G1 and G2 | 277 (58.2) | 139 (65.3) | 77 (35.5) | 85 (83.3) | 15 (5.3) | 21 (5.8) | 0 |
| High or G3 and G4 | 192 (40.3) | 73 (34.2) | 140 (64.5) | 17 (16.7) | 268 (94.7) | 383 (94.1) | 0 |
| Stage | |||||||
| CIS | 3 (0.6) | 0 | 0 | 0 | 0 | 0 | 0 |
| Ta | 345 (72.5) | 116 (54.5) | 113 (52.1) | 23 (22.5) | 38 (13.4) | 0 | 0 |
| T1 | 112 (23.5) | 97 (45.5) | 104 (47.9) | 79 (77.5) | 245 (86.6) | 0 | 0 |
| T2-4 | 16 (3.4) | 0 | 0 | 0 | 0 | 407 (100) | 298 (100) |
| Progression | |||||||
| No | 445 (93.5) | 191 (89.7) | 200 (92.2) | 91 (89.2) | 187 (66.1) | NA | NA |
| Yes | 31 (6.5) | 22 (10.3) | 17 (7.8) | 11 (10.8) | 96 (33.9) | NA | NA |
| Death | |||||||
| No | NA | NA | NA | NA | NA | 229 (56.3) | 110 (36.9) |
| Yes | NA | NA | NA | NA | NA | 178 (43.7) | 188 (63.1) |
| Treatment (BCG or ICIs) | BCG | ICIs | |||||
| No | NA | NA | NA | NA | 0 | NA | 0 |
| Yes | NA | NA | NA | NA | 283 (100) | NA | 298 (100) |
| Variable Disease Progression in the UROMOL Cohort | Univariate | Multivariate | ||||||
|---|---|---|---|---|---|---|---|---|
| hazardRatio | ciLower | ciUpper | p-Value | hazardRatio | ciLower | ciUpper | p-Value | |
| Gender | ||||||||
| Male (Ref.) vs. Female | 1.20 | 0.54 | 2.68 | 0.660 | ||||
| Age | ||||||||
| ≤69 (Ref.) vs. >69 | 2.49 | 1.14 | 5.40 | 0.021 | ||||
| Tumor size | ||||||||
| ≤3 cm (Ref.) vs. >3 cm | 1.03 | 0.50 | 2.13 | 0.930 | ||||
| Stage | ||||||||
| Ta (Ref.) vs. T1 | 9.11 | 4.19 | 19.81 | <0.001 | ||||
| Grade | ||||||||
| Low (Ref.) vs. High | 4.31 | 1.98 | 9.38 | <0.001 | ||||
| Risk scores | ||||||||
| EAU Low (Ref.) vs. EAU High | 2.13 | 1.01 | 4.48 | 0.046 | ||||
| EORTC Low (Ref.) vs. EORTC High | 12.47 | 4.36 | 35.66 | <0.001 | 8.43 | 2.86 | 24.81 | <0.001 |
| Taxonomy | ||||||||
| Class 1, Class 2b, and Class 3 (Ref.) vs. Class 2a | 5.06 | 2.38 | 10.77 | <0.001 | ||||
| The multi-gene signature | ||||||||
| Other classes (Ref.) vs. NMIBC-DDR | 2.99 | 1.45 | 6.17 | 0.003 | 3.48 | 1.46 | 8.29 | 0.004 |
| Variable Disease progression in the BRS cohort | Univariate | Multivariate | ||||||
| hazardRatio | ciLower | ciUpper | p-value | hazardRatio | ciLower | ciUpper | p-value | |
| Gender | ||||||||
| Male (Ref.) vs. Female | 0.46 | 0.24 | 0.87 | 0.018 | ||||
| Age | ||||||||
| ≤69 (Ref.) vs. >69 | 1.89 | 1.26 | 2.85 | 0.002 | ||||
| Stage | ||||||||
| Ta (Ref.) vs. T1 | 1.11 | 0.61 | 1.99 | 0.727 | ||||
| Grade | ||||||||
| Low (Ref.) vs. High | 0.83 | 0.36 | 1.91 | 0.669 | ||||
| Risk scores | ||||||||
| EORTC High (Ref.) vs. EORTC Highest | 1.67 | 1.08 | 2.55 | 0.018 | 1.68 | 1.10 | 2.58 | 0.01 |
| Taxonomy | ||||||||
| BRS2 and BRS3 (Ref.) vs. BRS1 | 0.55 | 0.34 | 0.90 | 0.017 | ||||
| The multi-gene signature | ||||||||
| Other classes (Ref.) vs. NMIBC-DDR | 0.63 | 0.41 | 0.97 | 0.037 | 0.62 | 0.04 | 0.95 | 0.03 |
| Variable Overall survival in the IMvigor210 cohort | Univariate | Multivariate | ||||||
| hazardRatio | ciLower | ciUpper | p-value | hazardRatio | ciLower | ciUpper | p-value | |
| Gender | ||||||||
| Male (Ref.) vs. Female | 1.20 | 0.85 | 1.68 | 0.294 | ||||
| PD-L1 expression in immune cell | ||||||||
| IC0 and IC1 (Ref.) vs. IC2 | 0.57 | 0.41 | 0.78 | <0.001 | 0.56 | 0.41 | 0.78 | <0.001 |
| PD-L1 expression in tumor cell | ||||||||
| TC0 and TC1 (Ref.) vs. TC2 | 0.98 | 0.65 | 1.46 | 0.904 | ||||
| Tumor mutation burden | ||||||||
| TMB Low and Intermediate (Ref.) vs. TMB High | 0.52 | 0.36 | 0.74 | <0.001 | ||||
| The multi-gene signature | ||||||||
| Other classes (Ref.) vs. NMIBC-DDR | 0.69 | 0.51 | 0.94 | 0.019 | 0.69 | 0.51 | 0.94 | 0.018 |
Disclaimer/Publisher’s Note: The statements, opinions and data contained in all publications are solely those of the individual author(s) and contributor(s) and not of MDPI and/or the editor(s). MDPI and/or the editor(s) disclaim responsibility for any injury to people or property resulting from any ideas, methods, instructions or products referred to in the content. |
© 2024 by the authors. Licensee MDPI, Basel, Switzerland. This article is an open access article distributed under the terms and conditions of the Creative Commons Attribution (CC BY) license (https://creativecommons.org/licenses/by/4.0/).
Share and Cite
Baek, S.-W.; Leem, S.-H. A Multi-Gene Signature of Non-Muscle-Invasive Bladder Cancer Identifies Patients Who Respond to Immunotherapies Including Bacillus Calmette–Guérin and Immune Checkpoint Inhibitors. Int. J. Mol. Sci. 2024, 25, 3800. https://doi.org/10.3390/ijms25073800
Baek S-W, Leem S-H. A Multi-Gene Signature of Non-Muscle-Invasive Bladder Cancer Identifies Patients Who Respond to Immunotherapies Including Bacillus Calmette–Guérin and Immune Checkpoint Inhibitors. International Journal of Molecular Sciences. 2024; 25(7):3800. https://doi.org/10.3390/ijms25073800
Chicago/Turabian StyleBaek, Seung-Woo, and Sun-Hee Leem. 2024. "A Multi-Gene Signature of Non-Muscle-Invasive Bladder Cancer Identifies Patients Who Respond to Immunotherapies Including Bacillus Calmette–Guérin and Immune Checkpoint Inhibitors" International Journal of Molecular Sciences 25, no. 7: 3800. https://doi.org/10.3390/ijms25073800