
The Acute, Short-, and Long-Term Effects of Endurance Exercise on Skeletal Muscle Transcriptome Profiles
 , and
, and
Abstract
:1. Introduction
2. Results
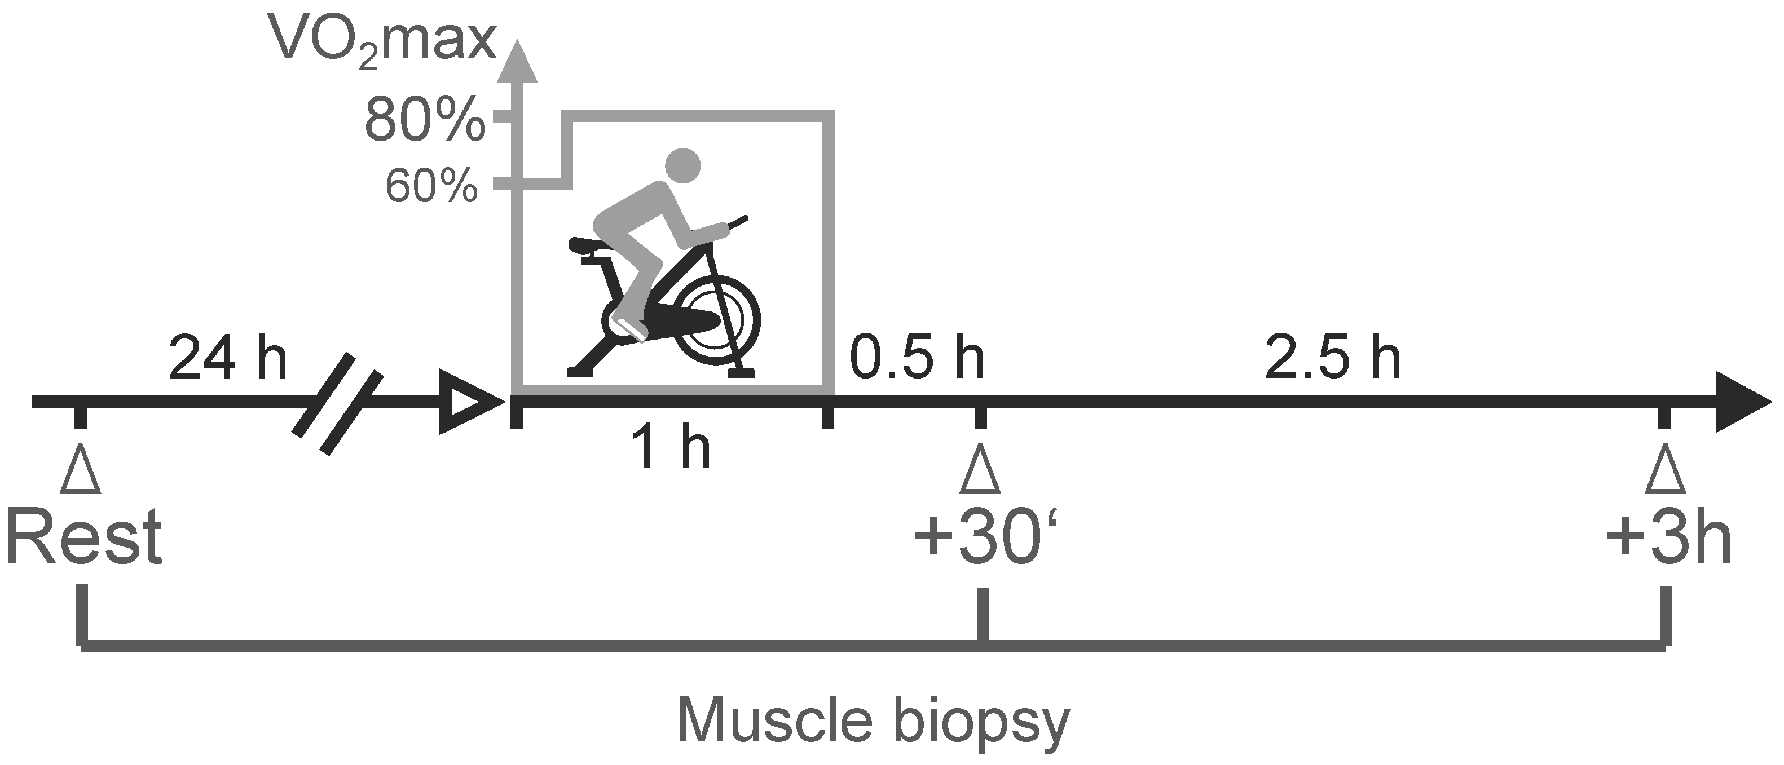
2.1. Study Design
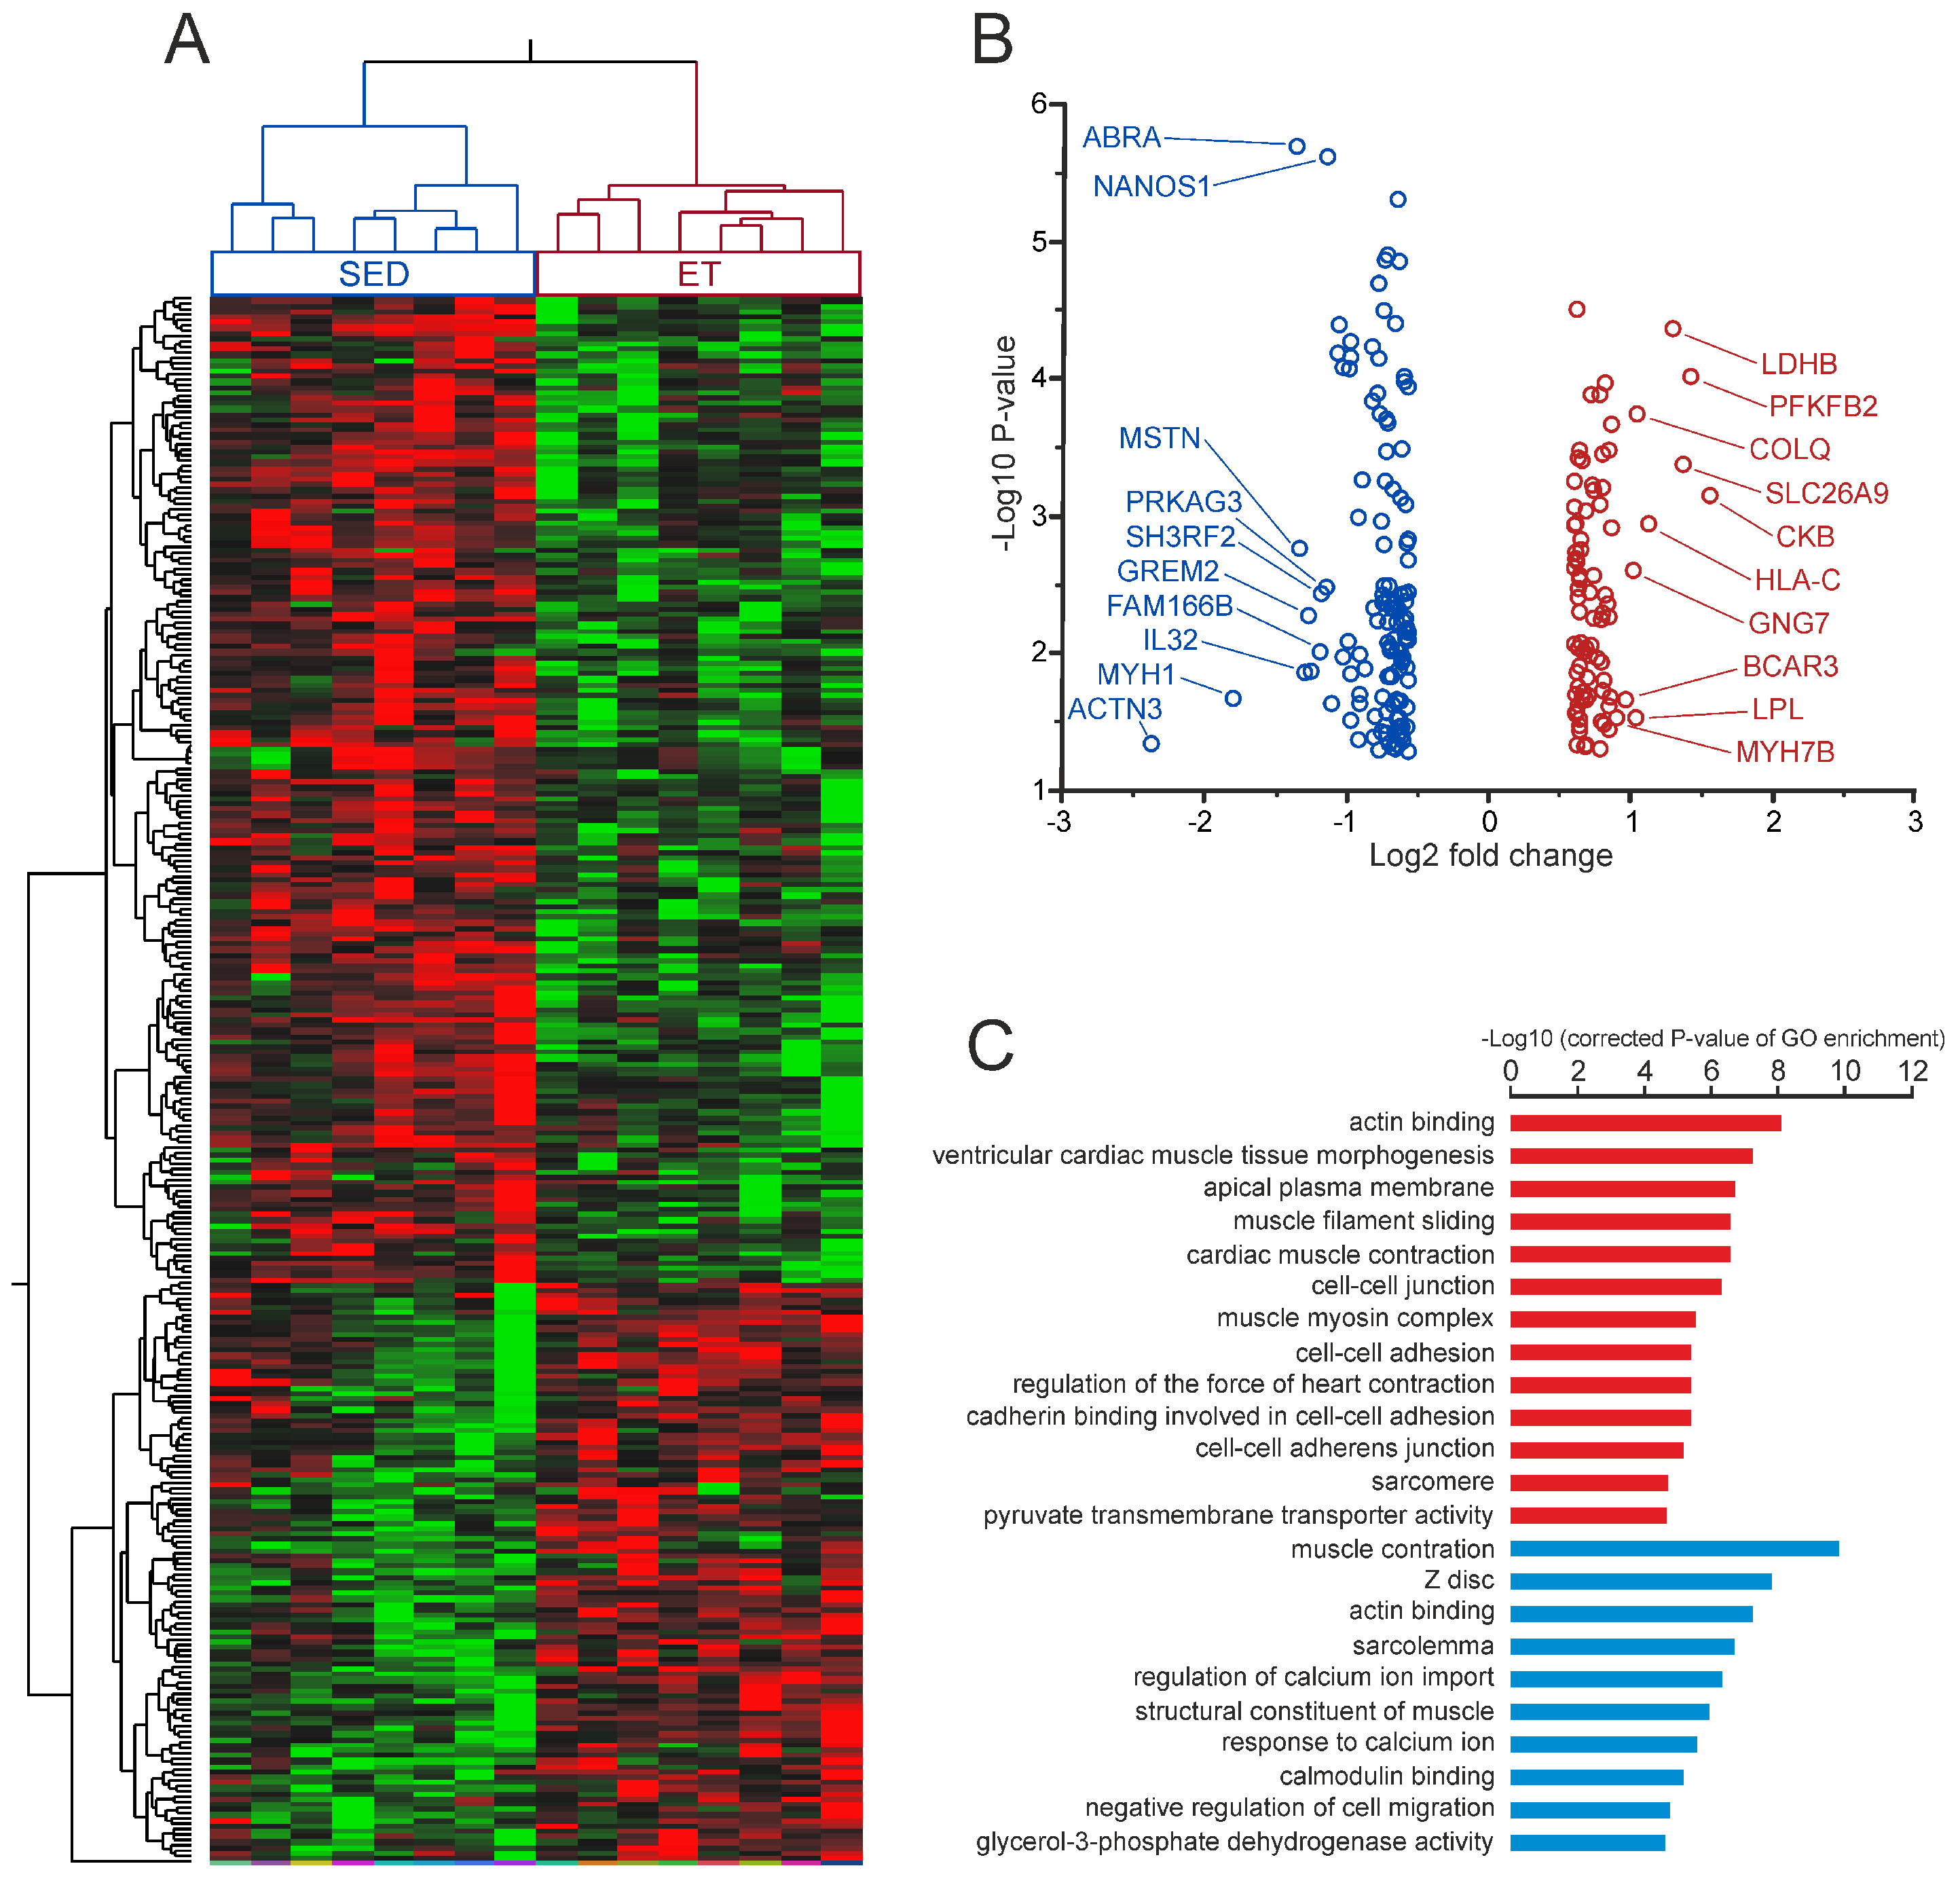
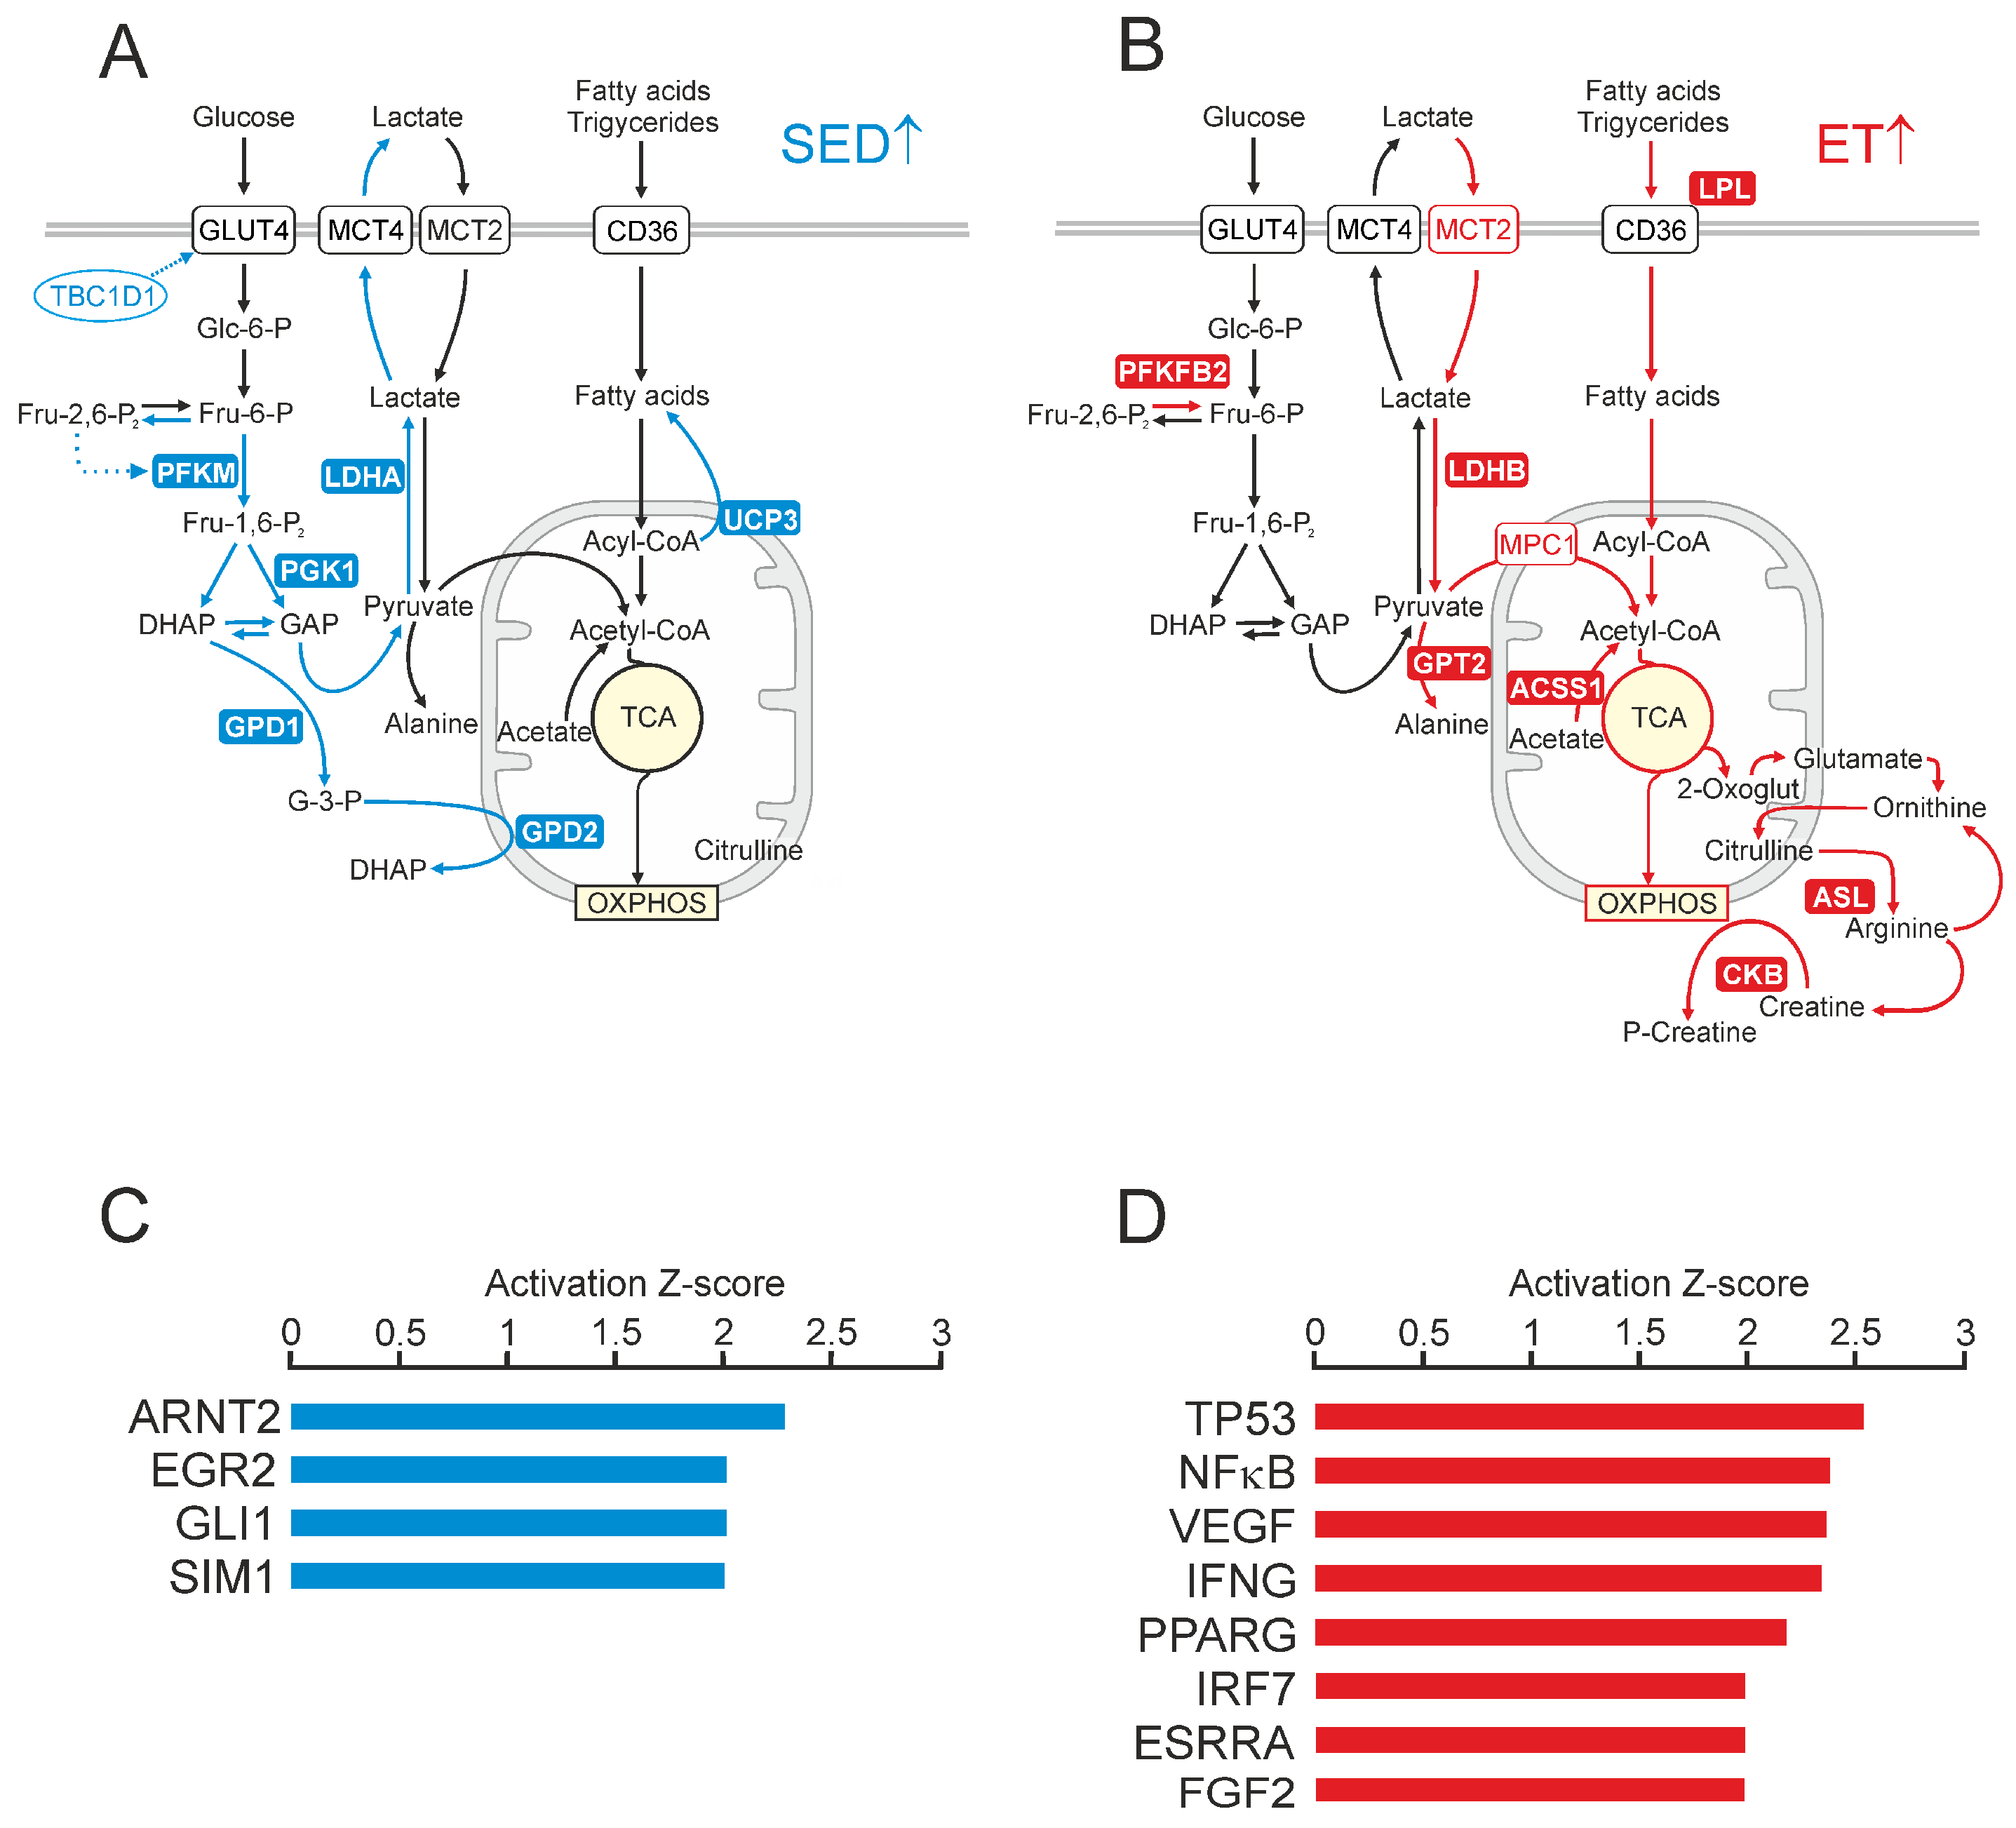
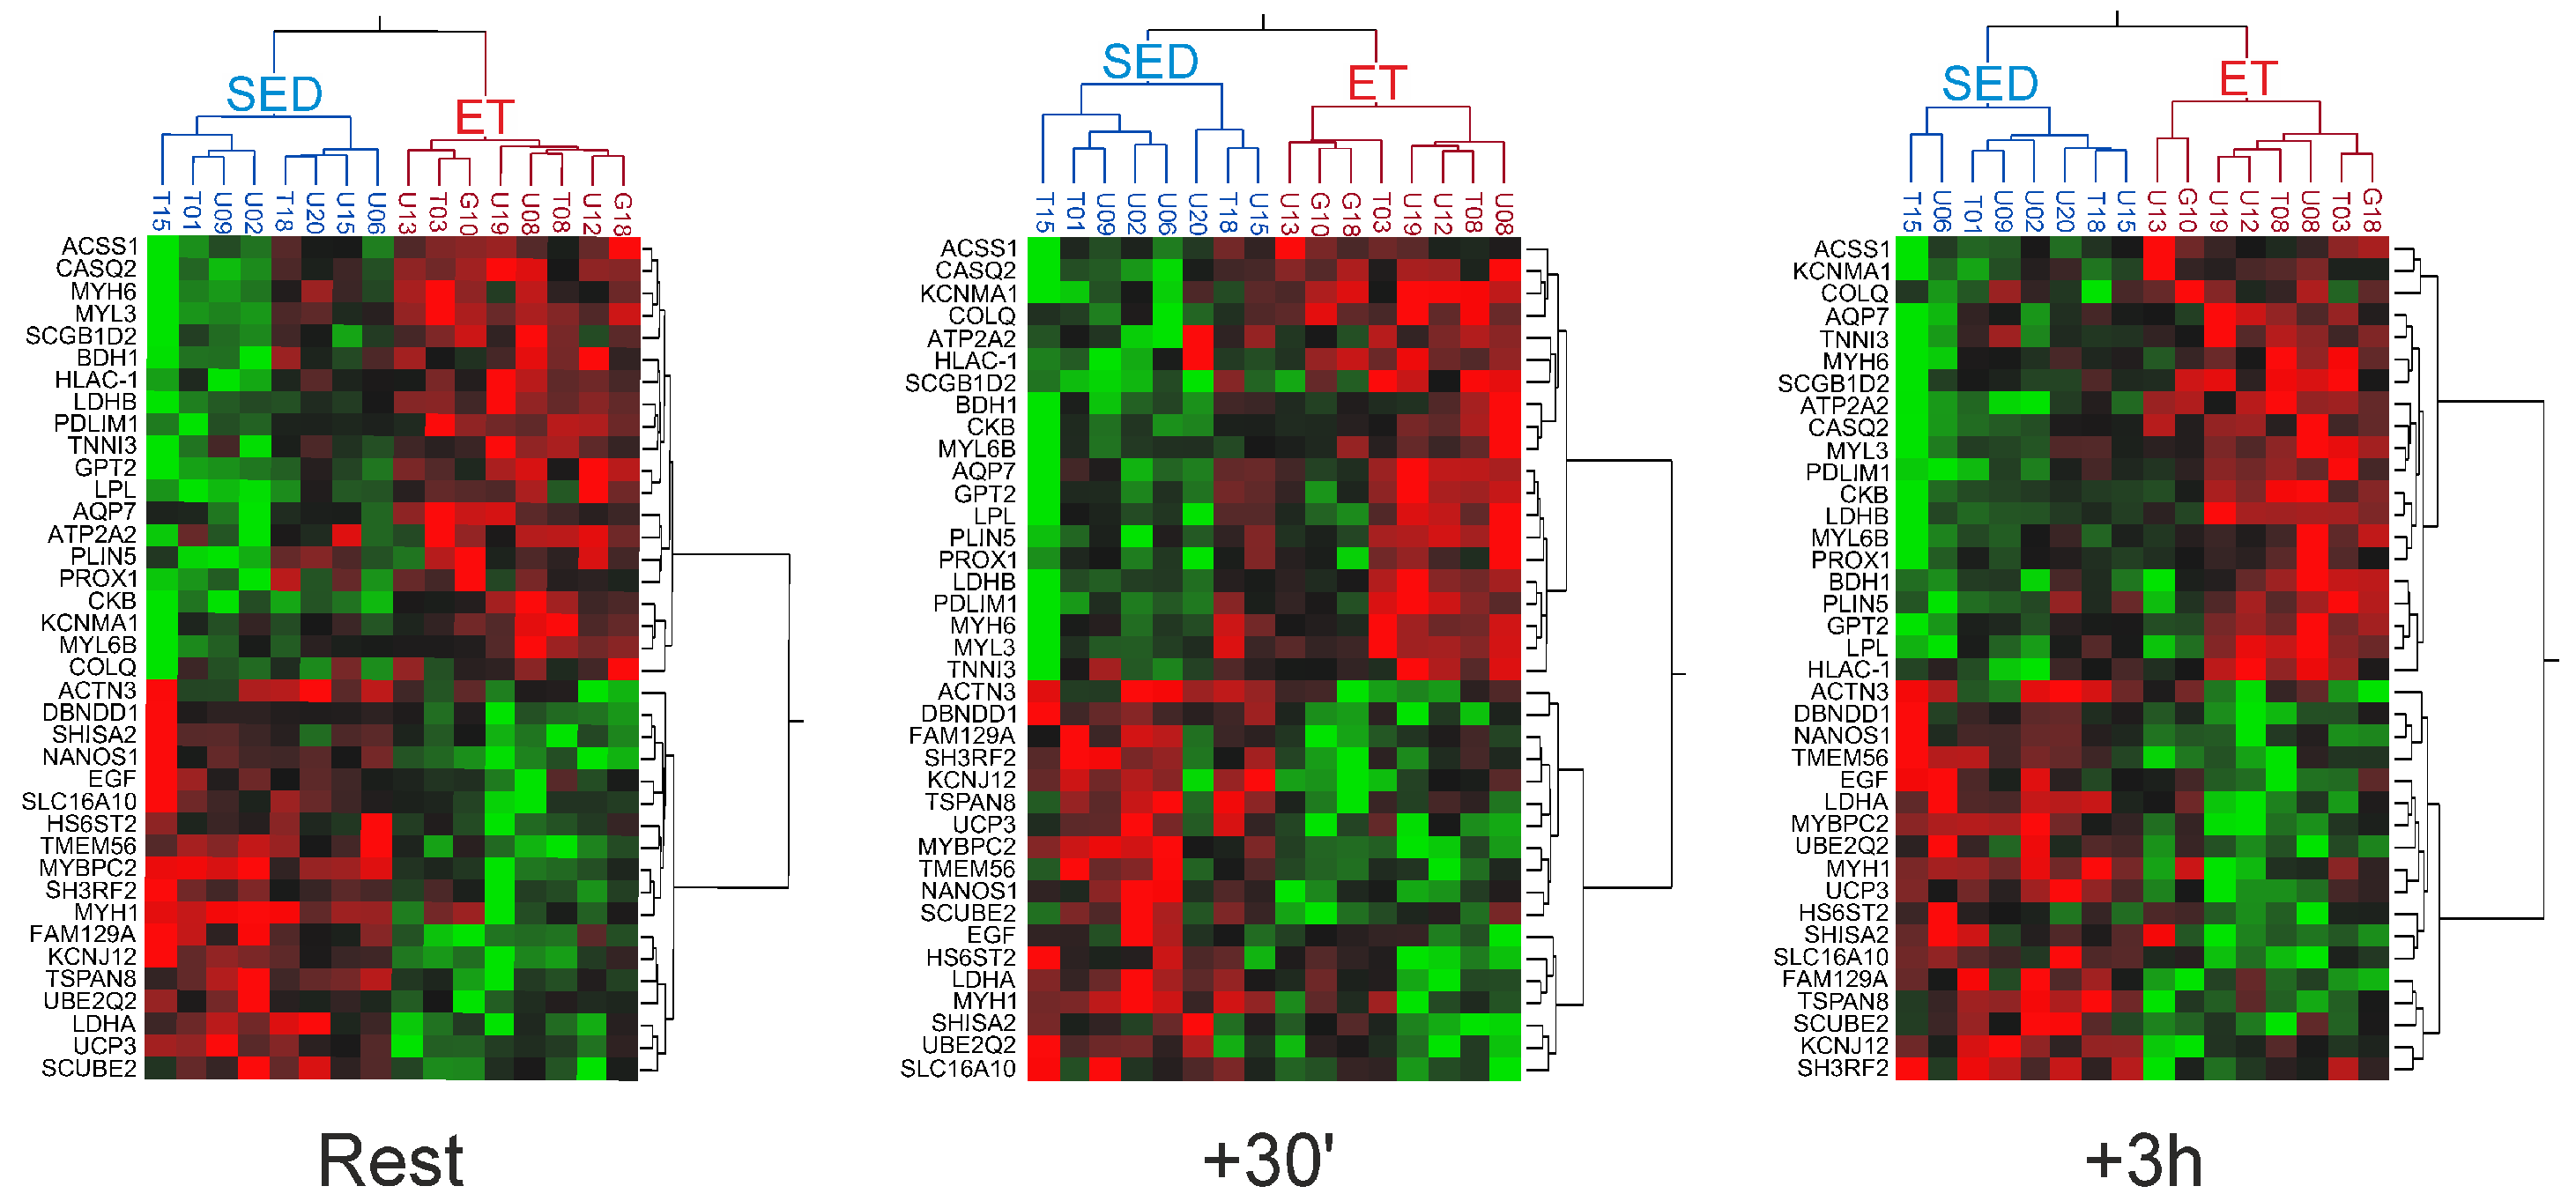
2.2. Differential Gene Expression Signatures between the Trained and Untrained Skeletal Muscle at Rest
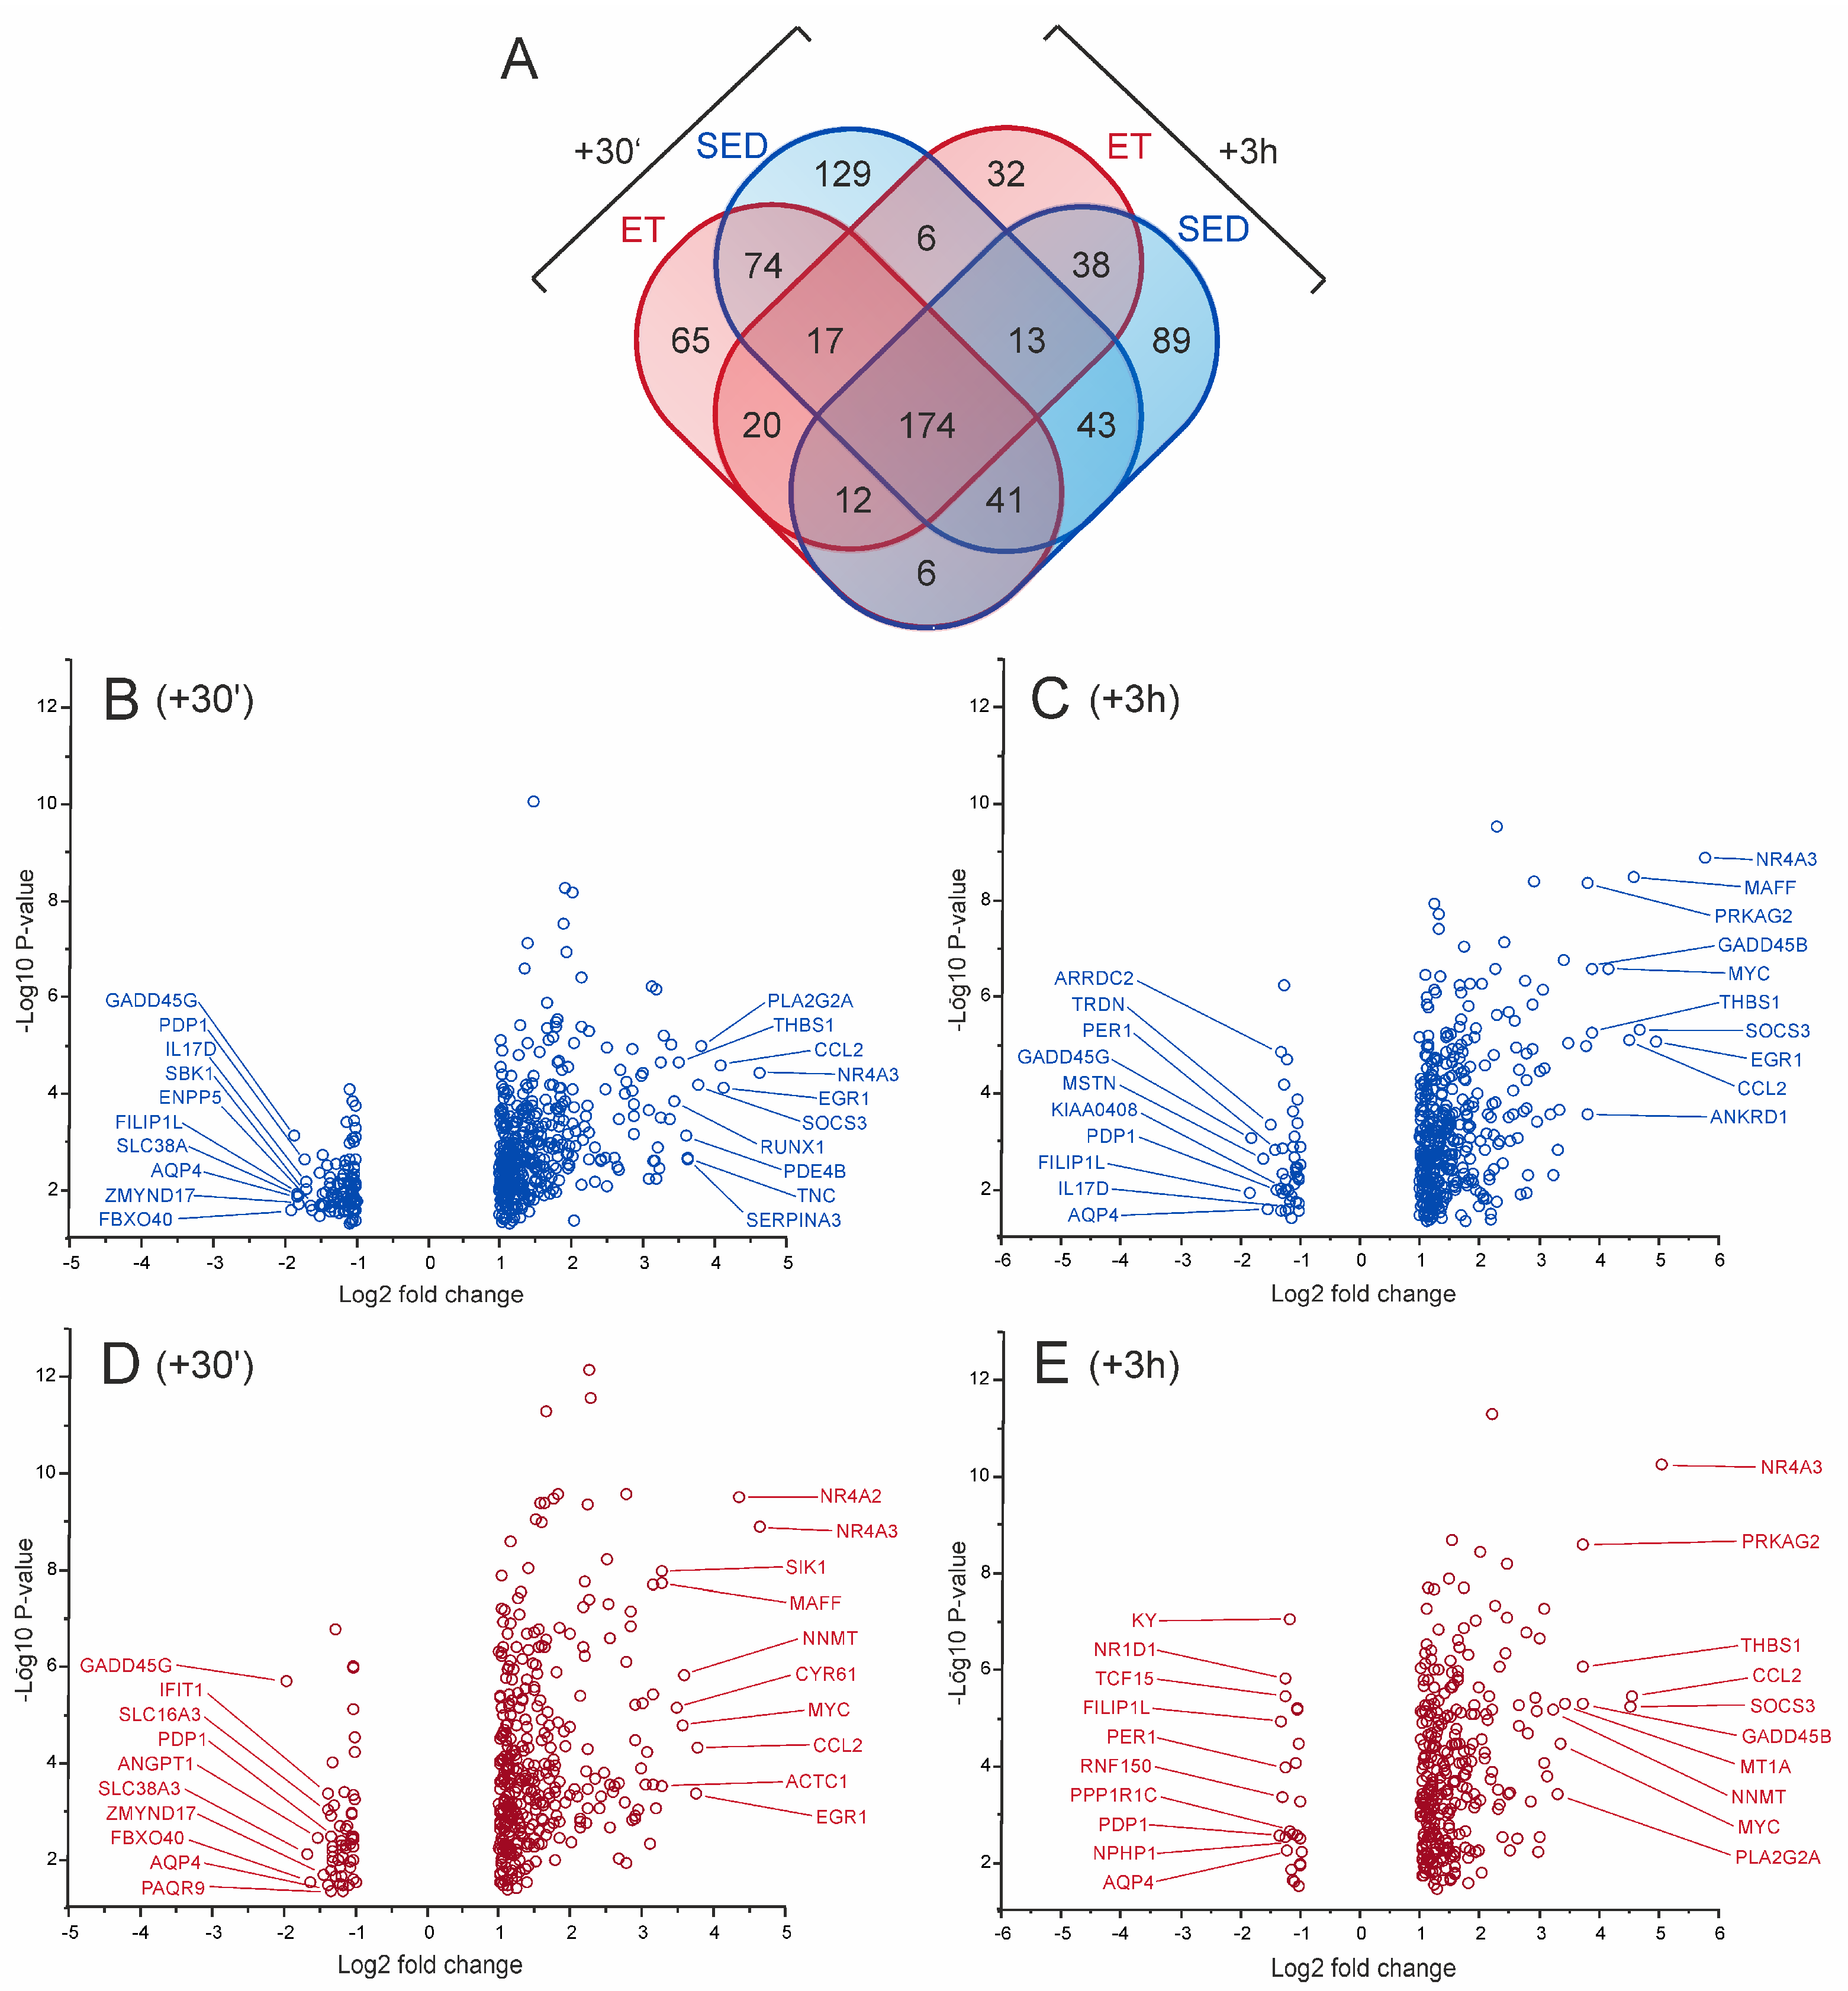
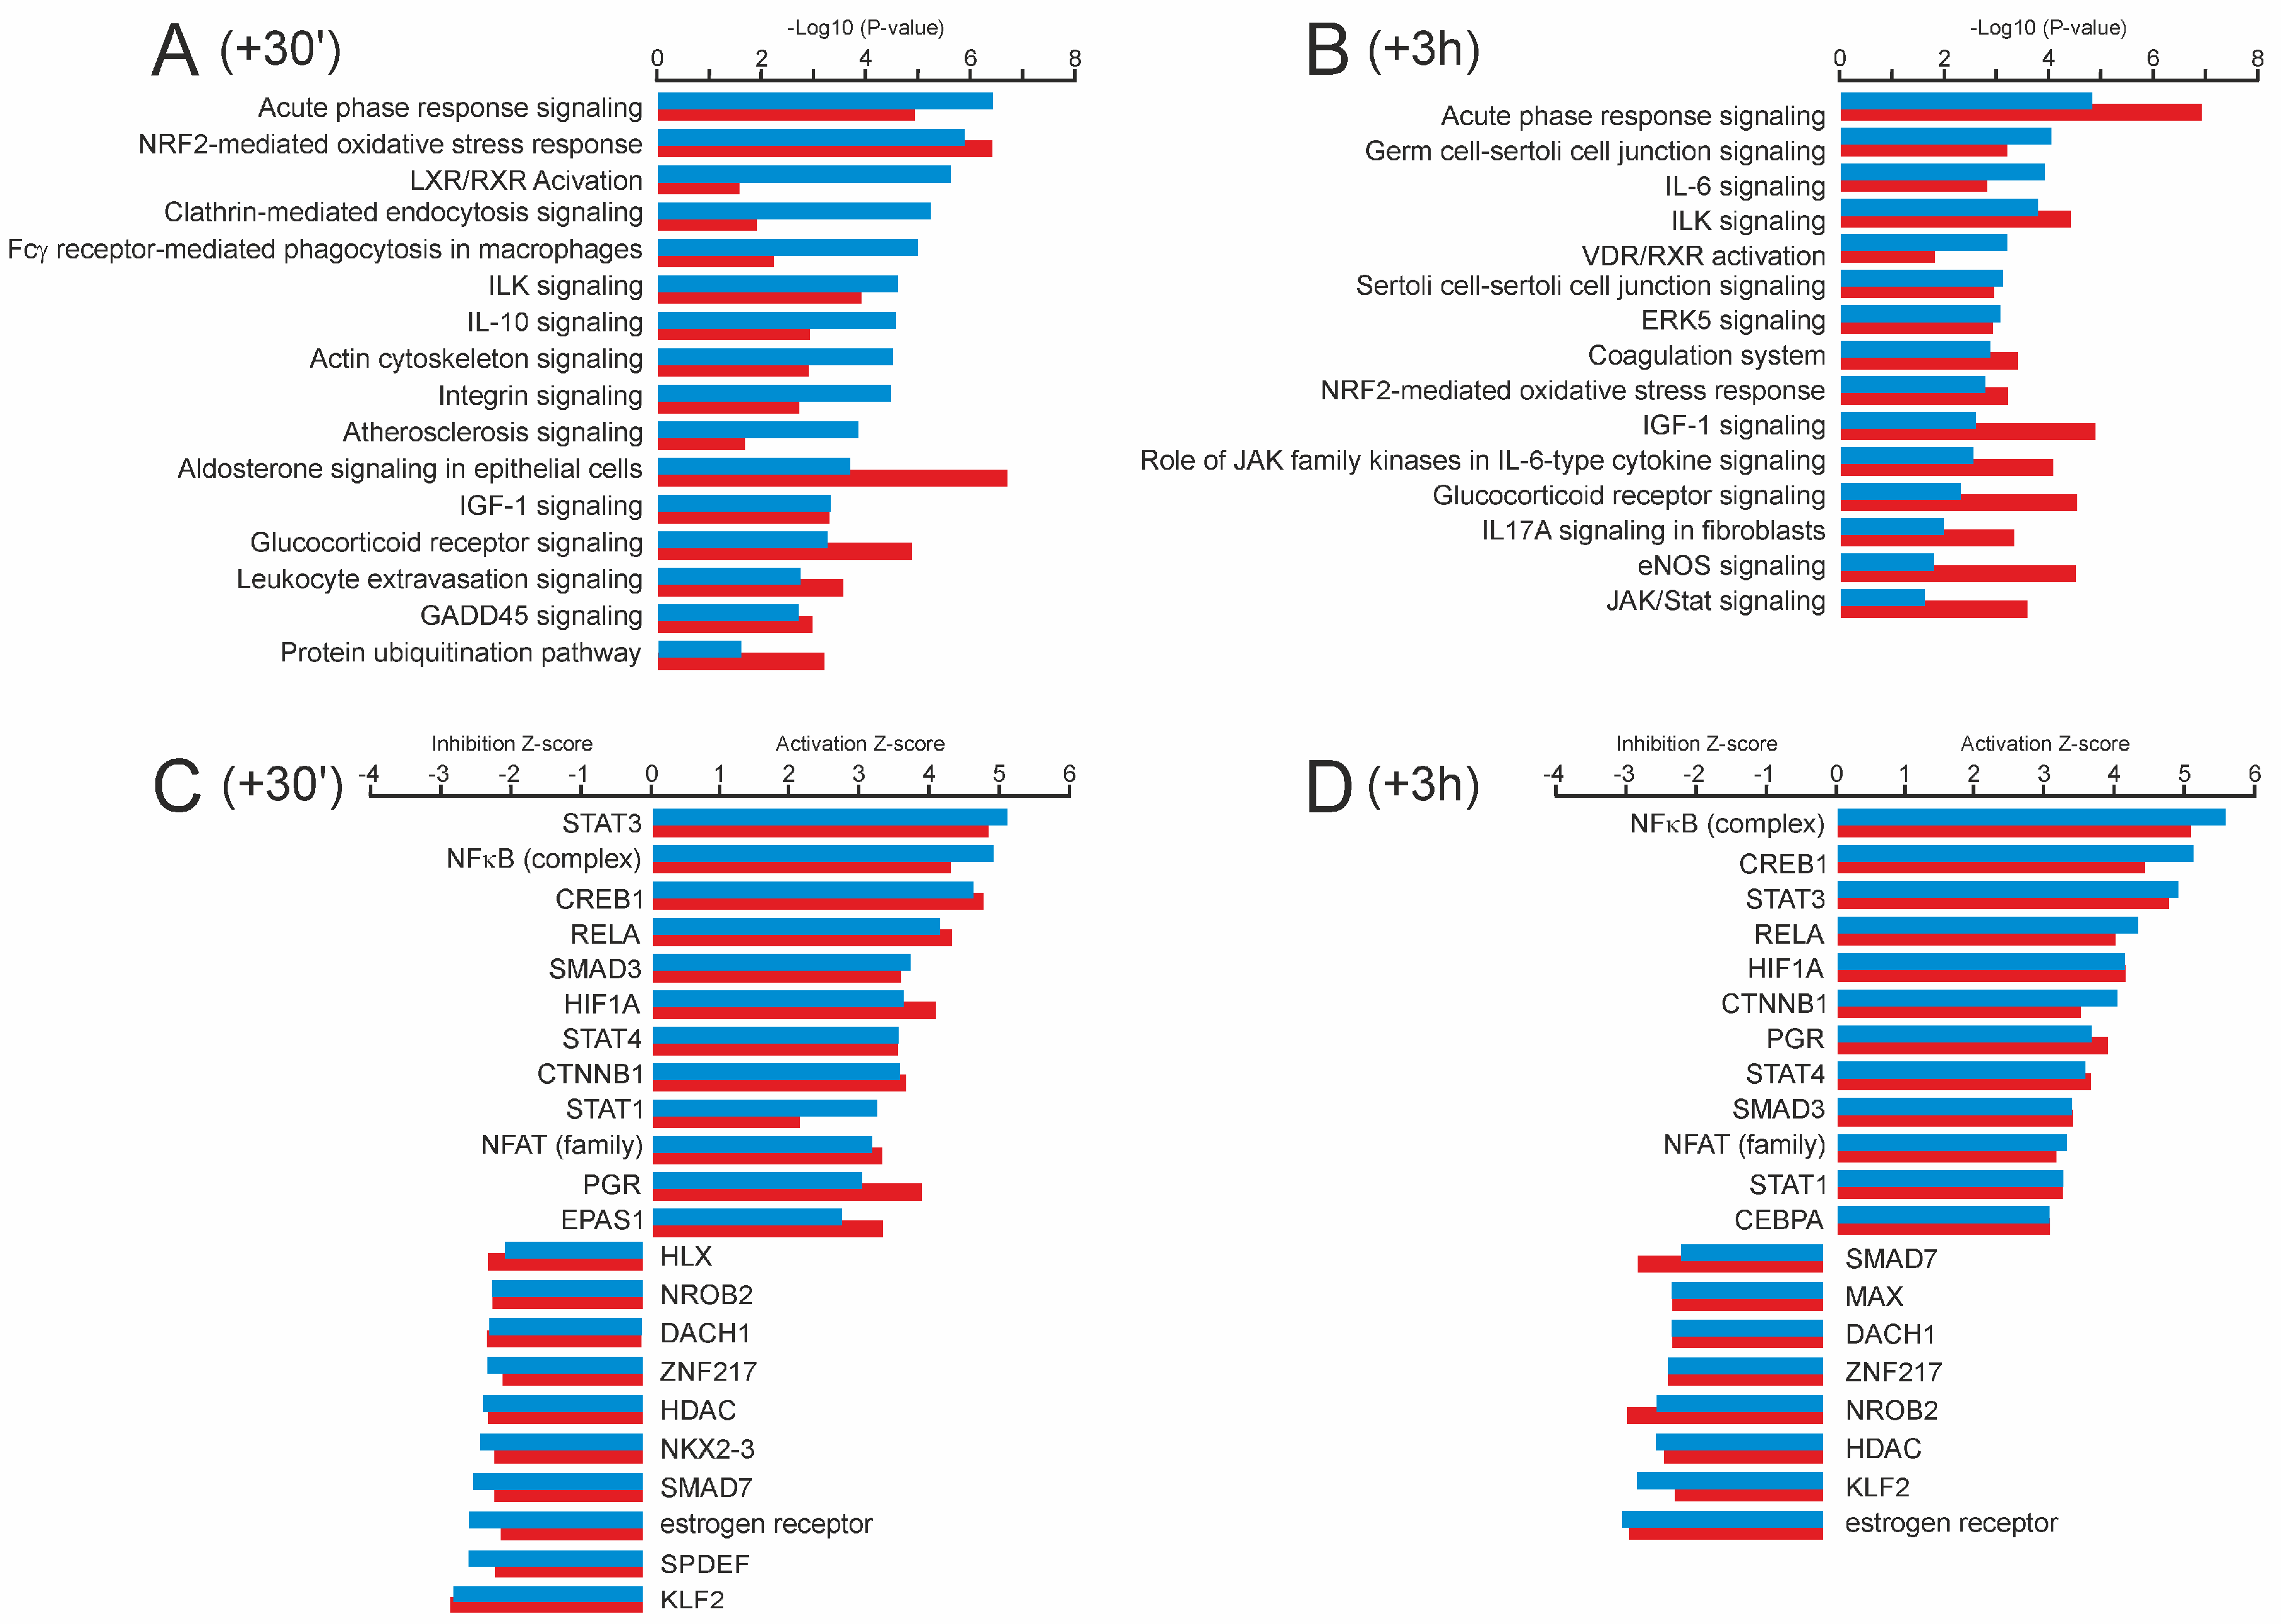
2.3. Gene Expression Responses of the Trained and Untrained Skeletal Muscle Following an Acute Bout of Endurance Exercise
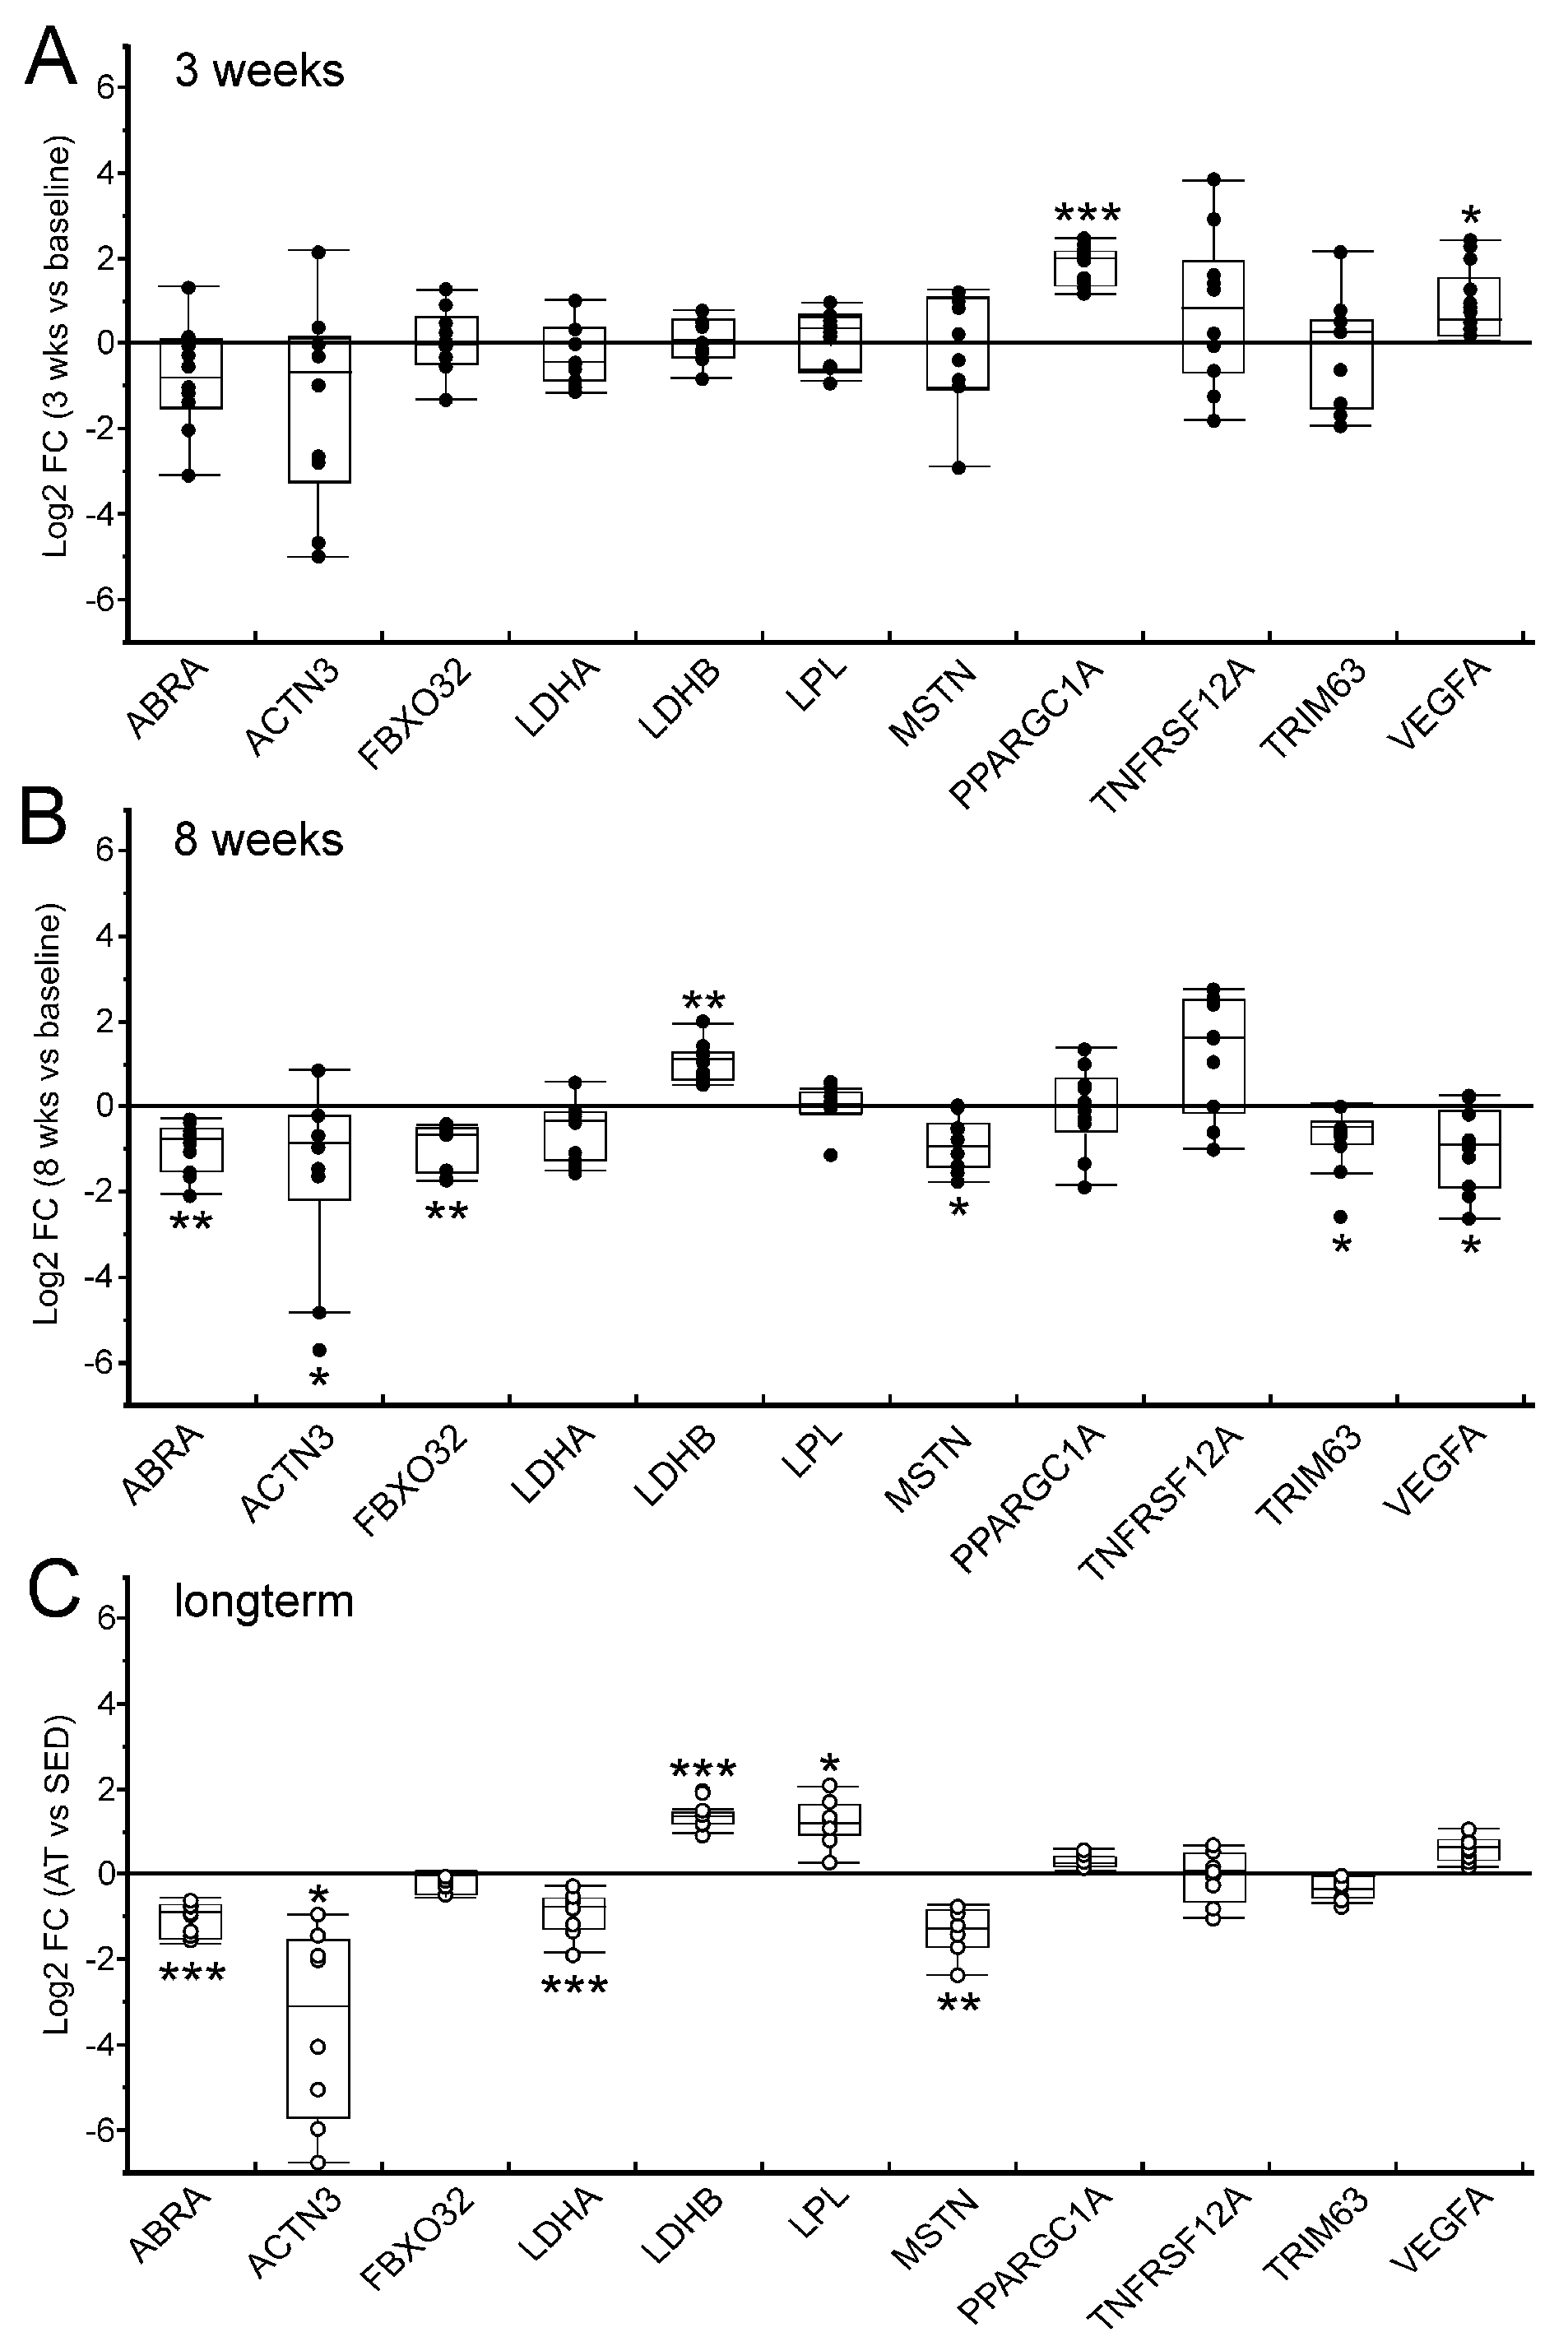
2.4. Expression Pattern of Selected Target Genes in the Untrained Skeletal Muscle in the Course of a Standardized Eight-Week Endurance Training Intervention
3. Discussion
4. Materials and Methods
4.1. Study Participants and Phenotyping
4.2. Acute Exercise Setup and Training Intervention
4.3. Muscle Biopsies and Microarray Analysis
4.4. Quantitative RT-PCR Analysis
4.5. Statistical Analysis
Supplementary Materials
Author Contributions
Funding
Institutional Review Board Statement
Informed Consent Statement
Data Availability Statement
Conflicts of Interest
Abbreviations
References
- Argiles, J.M.; Campos, N.; Lopez-Pedrosa, J.M.; Rueda, R.; Rodriguez-Manas, L. Skeletal Muscle Regulates Metabolism via Interorgan Crosstalk: Roles in Health and Disease. J. Am. Med. Dir. Assoc. 2016, 17, 789–796. [Google Scholar] [CrossRef]
- Chow, L.S.; Gerszten, R.E.; Taylor, J.M.; Pedersen, B.K.; van Praag, H.; Trappe, S.; Febbraio, M.A.; Galis, Z.S.; Gao, Y.; Haus, J.M.; et al. Exerkines in health, resilience and disease. Nat. Rev. Endocrinol. 2022, 18, 273–289. [Google Scholar] [CrossRef] [PubMed]
- Pillon, N.J.; Bilan, P.J.; Fink, L.N.; Klip, A. Cross-talk between skeletal muscle and immune cells: Muscle-derived mediators and metabolic implications. Am. J. Physiol. Endocrinol. Metab. 2013, 304, E453–E465. [Google Scholar] [CrossRef] [PubMed]
- Fluck, M. Functional, structural and molecular plasticity of mammalian skeletal muscle in response to exercise stimuli. J. Exp. Biol. 2006, 209, 2239–2248. [Google Scholar] [CrossRef] [PubMed]
- Hughes, D.C.; Ellefsen, S.; Baar, K. Adaptations to Endurance and Strength Training. Cold Spring Harb. Perspect. Med. 2018, 8, a029769. [Google Scholar] [CrossRef] [PubMed]
- Schiaffino, S.; Reggiani, C. Fiber types in mammalian skeletal muscles. Physiol. Rev. 2011, 91, 1447–1531. [Google Scholar] [CrossRef] [PubMed]
- Smith, J.A.B.; Murach, K.A.; Dyar, K.A.; Zierath, J.R. Exercise metabolism and adaptation in skeletal muscle. Nat. Rev. Mol. Cell Biol. 2023, 24, 607–632. [Google Scholar] [CrossRef] [PubMed]
- Beiter, T.; Niess, A.M.; Moser, D. Transcriptional memory in skeletal muscle. Don’t forget (to) exercise. J. Cell Physiol. 2020, 235, 5476–5489. [Google Scholar] [CrossRef]
- Egan, B.; Sharples, A.P. Molecular responses to acute exercise and their relevance for adaptations in skeletal muscle to exercise training. Physiol. Rev. 2023, 103, 2057–2170. [Google Scholar] [CrossRef]
- Furrer, R.; Hawley, J.A.; Handschin, C. The molecular athlete: Exercise physiology from mechanisms to medals. Physiol. Rev. 2023, 103, 1693–1787. [Google Scholar] [CrossRef]
- Kujala, U.M. Evidence on the effects of exercise therapy in the treatment of chronic disease. Br. J. Sports Med. 2009, 43, 550–555. [Google Scholar] [CrossRef] [PubMed]
- Catoire, M.; Mensink, M.; Boekschoten, M.V.; Hangelbroek, R.; Muller, M.; Schrauwen, P.; Kersten, S. Pronounced effects of acute endurance exercise on gene expression in resting and exercising human skeletal muscle. PLoS ONE 2012, 7, e51066. [Google Scholar] [CrossRef] [PubMed]
- Lindholm, M.E.; Giacomello, S.; Werne, S.B.; Fischer, H.; Huss, M.; Kjellqvist, S.; Sundberg, C.J. The Impact of Endurance Training on Human Skeletal Muscle Memory, Global Isoform Expression and Novel Transcripts. PLoS Genet. 2016, 12, e1006294. [Google Scholar] [CrossRef]
- Liu, D.; Sartor, M.A.; Nader, G.A.; Gutmann, L.; Treutelaar, M.K.; Pistilli, E.E.; Iglayreger, H.B.; Burant, C.F.; Hoffman, E.P.; Gordon, P.M. Skeletal muscle gene expression in response to resistance exercise: Sex specific regulation. BMC Genom. 2010, 11, 659. [Google Scholar] [CrossRef] [PubMed]
- Lundberg, T.R.; Fernandez-Gonzalo, R.; Tesch, P.A.; Rullman, E.; Gustafsson, T. Aerobic exercise augments muscle transcriptome profile of resistance exercise. Am. J. Physiol. Regul. Integr. Comp. Physiol. 2016, 310, R1279–R1287. [Google Scholar] [CrossRef] [PubMed]
- Mahoney, D.J.; Parise, G.; Melov, S.; Safdar, A.; Tarnopolsky, M.A. Analysis of global mRNA expression in human skeletal muscle during recovery from endurance exercise. FASEB J. 2005, 19, 1498–1500. [Google Scholar] [CrossRef]
- Nader, G.A.; von Walden, F.; Liu, C.; Lindvall, J.; Gutmann, L.; Pistilli, E.E.; Gordon, P.M. Resistance exercise training modulates acute gene expression during human skeletal muscle hypertrophy. J. Appl. Physiol. 2014, 116, 693–702. [Google Scholar] [CrossRef]
- Neubauer, O.; Sabapathy, S.; Ashton, K.J.; Desbrow, B.; Peake, J.M.; Lazarus, R.; Wessner, B.; Cameron-Smith, D.; Wagner, K.H.; Haseler, L.J.; et al. Time course-dependent changes in the transcriptome of human skeletal muscle during recovery from endurance exercise: From inflammation to adaptive remodeling. J. Appl. Physiol. 2014, 116, 274–287. [Google Scholar] [CrossRef]
- Padrao, A.I.; Ferreira, R.; Amado, F.; Vitorino, R.; Duarte, J.A. Uncovering the exercise-related proteome signature in skeletal muscle. Proteomics 2016, 16, 816–830. [Google Scholar] [CrossRef] [PubMed]
- Raue, U.; Trappe, T.A.; Estrem, S.T.; Qian, H.R.; Helvering, L.M.; Smith, R.C.; Trappe, S. Transcriptome signature of resistance exercise adaptations: Mixed muscle and fiber type specific profiles in young and old adults. J. Appl. Physiol. 2012, 112, 1625–1636. [Google Scholar] [CrossRef] [PubMed]
- Schild, M.; Ruhs, A.; Beiter, T.; Zugel, M.; Hudemann, J.; Reimer, A.; Krumholz-Wagner, I.; Wagner, C.; Keller, J.; Eder, K.; et al. Basal and exercise induced label-free quantitative protein profiling of m. vastus lateralis in trained and untrained individuals. J. Proteom. 2015, 122, 119–132. [Google Scholar] [CrossRef] [PubMed]
- Vissing, K.; Schjerling, P. Simplified data access on human skeletal muscle transcriptome responses to differentiated exercise. Sci. Data 2014, 1, 140041. [Google Scholar] [CrossRef] [PubMed]
- Weigert, C.; Lehmann, R.; Hartwig, S.; Lehr, S. The secretome of the working human skeletal muscle—A promising opportunity to combat the metabolic disaster? Proteom. Clin. Appl. 2014, 8, 5–18. [Google Scholar] [CrossRef] [PubMed]
- Schild, M.; Eichner, G.; Beiter, T.; Zugel, M.; Krumholz-Wagner, I.; Hudemann, J.; Pilat, C.; Kruger, K.; Niess, A.M.; Steinacker, J.M.; et al. Effects of Acute Endurance Exercise on Plasma Protein Profiles of Endurance-Trained and Untrained Individuals over Time. Mediat. Inflamm. 2016, 2016, 4851935. [Google Scholar] [CrossRef] [PubMed]
- Bizjak, D.A.; Zugel, M.; Treff, G.; Winkert, K.; Jerg, A.; Hudemann, J.; Mooren, F.C.; Kruger, K.; Niess, A.; Steinacker, J.M. Effects of Training Status and Exercise Mode on Global Gene Expression in Skeletal Muscle. Int. J. Mol. Sci. 2021, 22, 12578. [Google Scholar] [CrossRef]
- Staron, R.S.; Hagerman, F.C.; Hikida, R.S.; Murray, T.F.; Hostler, D.P.; Crill, M.T.; Ragg, K.E.; Toma, K. Fiber type composition of the vastus lateralis muscle of young men and women. J. Histochem. Cytochem. 2000, 48, 623–629. [Google Scholar] [CrossRef]
- Stuart, C.A.; Stone, W.L.; Howell, M.E.; Brannon, M.F.; Hall, H.K.; Gibson, A.L.; Stone, M.H. Myosin content of individual human muscle fibers isolated by laser capture microdissection. Am. J. Physiol. Cell Physiol. 2016, 310, C381–C389. [Google Scholar] [CrossRef]
- Delbono, O.; Meissner, G. Sarcoplasmic reticulum Ca2+ release in rat slow- and fast-twitch muscles. J. Membr. Biol. 1996, 151, 123–130. [Google Scholar] [CrossRef]
- Dhoot, G.K.; Perry, S.V. Distribution of polymorphic forms of troponin components and tropomyosin in skeletal muscle. Nature 1979, 278, 714–718. [Google Scholar] [CrossRef]
- Murgia, M.; Nogara, L.; Baraldo, M.; Reggiani, C.; Mann, M.; Schiaffino, S. Protein profile of fiber types in human skeletal muscle: A single-fiber proteomics study. Skelet. Muscle 2021, 11, 24. [Google Scholar] [CrossRef] [PubMed]
- Bicer, S.; Reiser, P.J. Myosin light chain isoform expression among single mammalian skeletal muscle fibers: Species variations. J. Muscle Res. Cell Motil. 2004, 25, 623–633. [Google Scholar] [CrossRef] [PubMed]
- Petchey, L.K.; Risebro, C.A.; Vieira, J.M.; Roberts, T.; Bryson, J.B.; Greensmith, L.; Lythgoe, M.F.; Riley, P.R. Loss of Prox1 in striated muscle causes slow to fast skeletal muscle fiber conversion and dilated cardiomyopathy. Proc. Natl. Acad. Sci. USA 2014, 111, 9515–9520. [Google Scholar] [CrossRef] [PubMed]
- Drexler, H.C.; Ruhs, A.; Konzer, A.; Mendler, L.; Bruckskotten, M.; Looso, M.; Gunther, S.; Boettger, T.; Kruger, M.; Braun, T. On marathons and Sprints: An integrated quantitative proteomics and transcriptomics analysis of differences between slow and fast muscle fibers. Mol. Cell Proteom. 2012, 11, M111. [Google Scholar] [CrossRef] [PubMed]
- Swoap, S.J.; Hunter, R.B.; Stevenson, E.J.; Felton, H.M.; Kansagra, N.V.; Lang, J.M.; Esser, K.A.; Kandarian, S.C. The calcineurin-NFAT pathway and muscle fiber-type gene expression. Am. J. Physiol. Cell Physiol. 2000, 279, C915–C924. [Google Scholar] [CrossRef] [PubMed]
- Vistisen, B.; Roepstorff, K.; Roepstorff, C.; Bonen, A.; van Deurs, B.; Kiens, B. Sarcolemmal FAT/CD36 in human skeletal muscle colocalizes with caveolin-3 and is more abundant in type 1 than in type 2 fibers. J. Lipid Res. 2004, 45, 603–609. [Google Scholar] [CrossRef] [PubMed]
- Deshmukh, A.S.; Steenberg, D.E.; Hostrup, M.; Birk, J.B.; Larsen, J.K.; Santos, A.; Kjobsted, R.; Hingst, J.R.; Scheele, C.C.; Murgia, M.; et al. Deep muscle-proteomic analysis of freeze-dried human muscle biopsies reveals fiber type-specific adaptations to exercise training. Nat. Commun. 2021, 12, 304. [Google Scholar] [CrossRef]
- Gautel, M.; Furst, D.O.; Cocco, A.; Schiaffino, S. Isoform transitions of the myosin binding protein C family in developing human and mouse muscles: Lack of isoform transcomplementation in cardiac muscle. Circ. Res. 1998, 82, 124–129. [Google Scholar] [CrossRef] [PubMed]
- Chemello, F.; Bean, C.; Cancellara, P.; Laveder, P.; Reggiani, C.; Lanfranchi, G. Microgenomic analysis in skeletal muscle: Expression signatures of individual fast and slow myofibers. PLoS ONE 2011, 6, e16807. [Google Scholar] [CrossRef]
- Mills, M.; Yang, N.; Weinberger, R.; Vander Woude, D.L.; Beggs, A.H.; Easteal, S.; North, K. Differential expression of the actin-binding proteins, alpha-actinin-2 and -3, in different species: Implications for the evolution of functional redundancy. Hum. Mol. Genet. 2001, 10, 1335–1346. [Google Scholar] [CrossRef]
- Cariou, B.; van Harmelen, K.; Duran-Sandoval, D.; van Dijk, T.H.; Grefhorst, A.; Abdelkarim, M.; Caron, S.; Torpier, G.; Fruchart, J.C.; Gonzalez, F.J.; et al. The farnesoid X receptor modulates adiposity and peripheral insulin sensitivity in mice. J. Biol. Chem. 2006, 281, 11039–11049. [Google Scholar] [CrossRef]
- Lindholm, M.E.; Marabita, F.; Gomez-Cabrero, D.; Rundqvist, H.; Ekstrom, T.J.; Tegner, J.; Sundberg, C.J. An integrative analysis reveals coordinated reprogramming of the epigenome and the transcriptome in human skeletal muscle after training. Epigenetics 2014, 9, 1557–1569. [Google Scholar] [CrossRef]
- Chapman, M.A.; Arif, M.; Emanuelsson, E.B.; Reitzner, S.M.; Lindholm, M.E.; Mardinoglu, A.; Sundberg, C.J. Skeletal Muscle Transcriptomic Comparison between Long-Term Trained and Untrained Men and Women. Cell Rep. 2020, 31, 107808. [Google Scholar] [CrossRef]
- Porporato, P.E.; Dhup, S.; Dadhich, R.K.; Copetti, T.; Sonveaux, P. Anticancer targets in the glycolytic metabolism of tumors: A comprehensive review. Front. Pharmacol. 2011, 2, 49. [Google Scholar] [CrossRef] [PubMed]
- Liang, X.; Liu, L.; Fu, T.; Zhou, Q.; Zhou, D.; Xiao, L.; Liu, J.; Kong, Y.; Xie, H.; Yi, F.; et al. Exercise Inducible Lactate Dehydrogenase B Regulates Mitochondrial Function in Skeletal Muscle. J. Biol. Chem. 2016, 291, 25306–25318. [Google Scholar] [CrossRef] [PubMed]
- Gan, Z.; Burkart-Hartman, E.M.; Han, D.H.; Finck, B.; Leone, T.C.; Smith, E.Y.; Ayala, J.E.; Holloszy, J.; Kelly, D.P. The nuclear receptor PPARbeta/delta programs muscle glucose metabolism in cooperation with AMPK and MEF2. Genes Dev. 2011, 25, 2619–2630. [Google Scholar] [CrossRef] [PubMed]
- Furrer, R.; Heim, B.; Schmid, S.; Dilbaz, S.; Adak, V.; Nordstrom, K.J.V.; Ritz, D.; Steurer, S.A.; Walter, J.; Handschin, C. Molecular control of endurance training adaptation in male mouse skeletal muscle. Nat. Metab. 2023, 5, 2020–2035. [Google Scholar] [CrossRef] [PubMed]
- Summermatter, S.; Santos, G.; Perez-Schindler, J.; Handschin, C. Skeletal muscle PGC-1alpha controls whole-body lactate homeostasis through estrogen-related receptor alpha-dependent activation of LDH B and repression of LDH A. Proc. Natl. Acad. Sci. USA 2013, 110, 8738–8743. [Google Scholar] [CrossRef] [PubMed]
- Valvona, C.J.; Fillmore, H.L.; Nunn, P.B.; Pilkington, G.J. The Regulation and Function of Lactate Dehydrogenase A: Therapeutic Potential in Brain Tumor. Brain Pathol. 2016, 26, 3–17. [Google Scholar] [CrossRef] [PubMed]
- Kim, J.W.; Tchernyshyov, I.; Semenza, G.L.; Dang, C.V. HIF-1-mediated expression of pyruvate dehydrogenase kinase: A metabolic switch required for cellular adaptation to hypoxia. Cell Metab. 2006, 3, 177–185. [Google Scholar] [CrossRef]
- Yarden, Y.; Sliwkowski, M.X. Untangling the ErbB signalling network. Nat. Rev. Mol. Cell Biol. 2001, 2, 127–137. [Google Scholar] [CrossRef]
- Mason, S.D.; Howlett, R.A.; Kim, M.J.; Olfert, I.M.; Hogan, M.C.; McNulty, W.; Hickey, R.P.; Wagner, P.D.; Kahn, C.R.; Giordano, F.J.; et al. Loss of skeletal muscle HIF-1alpha results in altered exercise endurance. PLoS Biol. 2004, 2, e288. [Google Scholar] [CrossRef]
- Ciano, M.; Mantellato, G.; Connolly, M.; Paul-Clark, M.; Willis-Owen, S.; Moffatt, M.F.; Cookson, W.; Mitchell, J.A.; Polkey, M.I.; Hughes, S.M.; et al. EGF receptor (EGFR) inhibition promotes a slow-twitch oxidative, over a fast-twitch, muscle phenotype. Sci. Rep. 2019, 9, 9218. [Google Scholar] [CrossRef]
- Wang, Y.X.; Feige, P.; Brun, C.E.; Hekmatnejad, B.; Dumont, N.A.; Renaud, J.M.; Faulkes, S.; Guindon, D.E.; Rudnicki, M.A. EGFR-Aurka Signaling Rescues Polarity and Regeneration Defects in Dystrophin-Deficient Muscle Stem Cells by Increasing Asymmetric Divisions. Cell Stem Cell 2019, 24, 419–432.e416. [Google Scholar] [CrossRef]
- Truong, T.H.; Ung, P.M.; Palde, P.B.; Paulsen, C.E.; Schlessinger, A.; Carroll, K.S. Molecular Basis for Redox Activation of Epidermal Growth Factor Receptor Kinase. Cell Chem. Biol. 2016, 23, 837–848. [Google Scholar] [CrossRef]
- Pedersen, S.B.; Kristensen, K.; Bruun, J.M.; Flyvbjerg, A.; Vinter-Jensen, L.; Richelsen, B. Systemic administration of epidermal growth factor increases UCP3 mRNA levels in skeletal muscle and adipose tissue in rats. Biochem. Biophys. Res. Commun. 2000, 279, 914–919. [Google Scholar] [CrossRef] [PubMed]
- Busiello, R.A.; Savarese, S.; Lombardi, A. Mitochondrial uncoupling proteins and energy metabolism. Front. Physiol. 2015, 6, 36. [Google Scholar] [CrossRef] [PubMed]
- Pohl, E.E.; Rupprecht, A.; Macher, G.; Hilse, K.E. Important Trends in UCP3 Investigation. Front. Physiol. 2019, 10, 470. [Google Scholar] [CrossRef] [PubMed]
- Russell, A.P.; Somm, E.; Praz, M.; Crettenand, A.; Hartley, O.; Melotti, A.; Giacobino, J.P.; Muzzin, P.; Gobelet, C.; Deriaz, O. UCP3 protein regulation in human skeletal muscle fibre types I, IIa and IIx is dependent on exercise intensity. J. Physiol. 2003, 550, 855–861. [Google Scholar] [CrossRef] [PubMed]
- Mogensen, M.; Bagger, M.; Pedersen, P.K.; Fernstrom, M.; Sahlin, K. Cycling efficiency in humans is related to low UCP3 content and to type I fibres but not to mitochondrial efficiency. J. Physiol. 2006, 571, 669–681. [Google Scholar] [CrossRef] [PubMed]
- Choi, C.S.; Fillmore, J.J.; Kim, J.K.; Liu, Z.X.; Kim, S.; Collier, E.F.; Kulkarni, A.; Distefano, A.; Hwang, Y.J.; Kahn, M.; et al. Overexpression of uncoupling protein 3 in skeletal muscle protects against fat-induced insulin resistance. J. Clin. Investig. 2007, 117, 1995–2003. [Google Scholar] [CrossRef] [PubMed]
- Aguer, C.; Fiehn, O.; Seifert, E.L.; Bezaire, V.; Meissen, J.K.; Daniels, A.; Scott, K.; Renaud, J.M.; Padilla, M.; Bickel, D.R.; et al. Muscle uncoupling protein 3 overexpression mimics endurance training and reduces circulating biomarkers of incomplete beta-oxidation. FASEB J. 2013, 27, 4213–4225. [Google Scholar] [CrossRef] [PubMed]
- Mourkioti, F.; Rosenthal, N. NF-kappaB signaling in skeletal muscle: Prospects for intervention in muscle diseases. J. Mol. Med. 2008, 86, 747–759. [Google Scholar] [CrossRef] [PubMed]
- Bakkar, N.; Ladner, K.; Canan, B.D.; Liyanarachchi, S.; Bal, N.C.; Pant, M.; Periasamy, M.; Li, Q.; Janssen, P.M.; Guttridge, D.C. IKKalpha and alternative NF-kappaB regulate PGC-1beta to promote oxidative muscle metabolism. J. Cell Biol. 2012, 196, 497–511. [Google Scholar] [CrossRef]
- Shintaku, J.; Peterson, J.M.; Talbert, E.E.; Gu, J.M.; Ladner, K.J.; Williams, D.R.; Mousavi, K.; Wang, R.; Sartorelli, V.; Guttridge, D.C. MyoD Regulates Skeletal Muscle Oxidative Metabolism Cooperatively with Alternative NF-kappaB. Cell Rep. 2016, 17, 514–526. [Google Scholar] [CrossRef]
- Bartlett, J.D.; Close, G.L.; Drust, B.; Morton, J.P. The emerging role of p53 in exercise metabolism. Sports Med. 2014, 44, 303–309. [Google Scholar] [CrossRef] [PubMed]
- Drake, J.C.; Wilson, R.J.; Yan, Z. Molecular mechanisms for mitochondrial adaptation to exercise training in skeletal muscle. FASEB J. 2016, 30, 13–22. [Google Scholar] [CrossRef]
- Saleem, A.; Hood, D.A. Acute exercise induces tumour suppressor protein p53 translocation to the mitochondria and promotes a p53-Tfam-mitochondrial DNA complex in skeletal muscle. J. Physiol. 2013, 591, 3625–3636. [Google Scholar] [CrossRef]
- Wattez, J.S.; Eury, E.; Hazen, B.C.; Wade, A.; Chau, S.; Ou, S.C.; Russell, A.P.; Cho, Y.; Kralli, A. Loss of skeletal muscle estrogen-related receptors leads to severe exercise intolerance. Mol. Metab. 2023, 68, 101670. [Google Scholar] [CrossRef]
- Agudelo, L.Z.; Femenia, T.; Orhan, F.; Porsmyr-Palmertz, M.; Goiny, M.; Martinez-Redondo, V.; Correia, J.C.; Izadi, M.; Bhat, M.; Schuppe-Koistinen, I.; et al. Skeletal muscle PGC-1alpha1 modulates kynurenine metabolism and mediates resilience to stress-induced depression. Cell 2014, 159, 33–45. [Google Scholar] [CrossRef]
- Hayden, M.S.; Ghosh, S. Regulation of NF-kappaB by TNF family cytokines. Semin. Immunol. 2014, 26, 253–266. [Google Scholar] [CrossRef]
- Alger, H.M.; Raben, N.; Pistilli, E.; Francia, D.L.; Rawat, R.; Getnet, D.; Ghimbovschi, S.; Chen, Y.W.; Lundberg, I.E.; Nagaraju, K. The role of TRAIL in mediating autophagy in myositis skeletal muscle: A potential nonimmune mechanism of muscle damage. Arthritis Rheum. 2011, 63, 3448–3457. [Google Scholar] [CrossRef]
- Bernardi, S.; Toffoli, B.; Tisato, V.; Bossi, F.; Biffi, S.; Lorenzon, A.; Zauli, G.; Secchiero, P.; Fabris, B. TRAIL reduces impaired glucose tolerance and NAFLD in the high-fat diet fed mouse. Clin. Sci. 2018, 132, 69–83. [Google Scholar] [CrossRef]
- Koliaki, C.; Katsilambros, N. Repositioning the Role of Tumor Necrosis Factor-Related Apoptosis-Inducing Ligand (TRAIL) on the TRAIL to the Development of Diabetes Mellitus: An Update of Experimental and Clinical Evidence. Int. J. Mol. Sci. 2022, 23, 3225. [Google Scholar] [CrossRef]
- Ameln, H.; Gustafsson, T.; Sundberg, C.J.; Okamoto, K.; Jansson, E.; Poellinger, L.; Makino, Y. Physiological activation of hypoxia inducible factor-1 in human skeletal muscle. FASEB J. 2005, 19, 1009–1011. [Google Scholar] [CrossRef]
- Gallego-Selles, A.; Galvan-Alvarez, V.; Martinez-Canton, M.; Garcia-Gonzalez, E.; Morales-Alamo, D.; Santana, A.; Gonzalez-Henriquez, J.J.; Dorado, C.; Calbet, J.A.L.; Martin-Rincon, M. Fast regulation of the NF-kappaB signalling pathway in human skeletal muscle revealed by high-intensity exercise and ischaemia at exhaustion: Role of oxygenation and metabolite accumulation. Redox Biol. 2022, 55, 102398. [Google Scholar] [CrossRef] [PubMed]
- Lindholm, M.E.; Rundqvist, H. Skeletal muscle hypoxia-inducible factor-1 and exercise. Exp. Physiol. 2016, 101, 28–32. [Google Scholar] [CrossRef] [PubMed]
- Li, J.; Li, Y.; Atakan, M.M.; Kuang, J.; Hu, Y.; Bishop, D.J.; Yan, X. The Molecular Adaptive Responses of Skeletal Muscle to High-Intensity Exercise/Training and Hypoxia. Antioxidants 2020, 9, 656. [Google Scholar] [CrossRef] [PubMed]
- Favier, F.B.; Britto, F.A.; Freyssenet, D.G.; Bigard, X.A.; Benoit, H. HIF-1-driven skeletal muscle adaptations to chronic hypoxia: Molecular insights into muscle physiology. Cell Mol. Life Sci. 2015, 72, 4681–4696. [Google Scholar] [CrossRef] [PubMed]
- Ma, B.; Hottiger, M.O. Crosstalk between Wnt/beta-Catenin and NF-kappaB Signaling Pathway during Inflammation. Front. Immunol. 2016, 7, 378. [Google Scholar] [CrossRef] [PubMed]
- D’Ignazio, L.; Bandarra, D.; Rocha, S. NF-kappaB and HIF crosstalk in immune responses. FEBS J. 2016, 283, 413–424. [Google Scholar] [CrossRef] [PubMed]
- Prescott, J.A.; Mitchell, J.P.; Cook, S.J. Inhibitory feedback control of NF-kappaB signalling in health and disease. Biochem. J. 2021, 478, 2619–2664. [Google Scholar] [CrossRef] [PubMed]
- Powers, S.K.; Deminice, R.; Ozdemir, M.; Yoshihara, T.; Bomkamp, M.P.; Hyatt, H. Exercise-induced oxidative stress: Friend or foe? J. Sport. Health Sci. 2020, 9, 415–425. [Google Scholar] [CrossRef] [PubMed]
- Merry, T.L.; Ristow, M. Mitohormesis in exercise training. Free Radic. Biol. Med. 2016, 98, 123–130. [Google Scholar] [CrossRef] [PubMed]
- Ngo, V.; Duennwald, M.L. Nrf2 and Oxidative Stress: A General Overview of Mechanisms and Implications in Human Disease. Antioxidants 2022, 11, 2345. [Google Scholar] [CrossRef]
- Bensellam, M.; Montgomery, M.K.; Luzuriaga, J.; Chan, J.Y.; Laybutt, D.R. Inhibitor of differentiation proteins protect against oxidative stress by regulating the antioxidant-mitochondrial response in mouse beta cells. Diabetologia 2015, 58, 758–770. [Google Scholar] [CrossRef]
- Consoli, V.; Sorrenti, V.; Grosso, S.; Vanella, L. Heme Oxygenase-1 Signaling and Redox Homeostasis in Physiopathological Conditions. Biomolecules 2021, 11, 589. [Google Scholar] [CrossRef]
- Beiter, T.; Hoene, M.; Prenzler, F.; Mooren, F.C.; Steinacker, J.M.; Weigert, C.; Niess, A.M.; Munz, B. Exercise, skeletal muscle and inflammation: ARE-binding proteins as key regulators in inflammatory and adaptive networks. Exerc. Immunol. Rev. 2015, 21, 42–57. [Google Scholar]
- Rubenstein, A.B.; Hinkley, J.M.; Nair, V.D.; Nudelman, G.; Standley, R.A.; Yi, F.; Yu, G.; Trappe, T.A.; Bamman, M.M.; Trappe, S.W.; et al. Skeletal muscle transcriptome response to a bout of endurance exercise in physically active and sedentary older adults. Am. J. Physiol. Endocrinol. Metab. 2022, 322, E260–E277. [Google Scholar] [CrossRef]
- Williams, K.; Carrasquilla, G.D.; Ingerslev, L.R.; Hochreuter, M.Y.; Hansson, S.; Pillon, N.J.; Donkin, I.; Versteyhe, S.; Zierath, J.R.; Kilpelainen, T.O.; et al. Epigenetic rewiring of skeletal muscle enhancers after exercise training supports a role in whole-body function and human health. Mol. Metab. 2021, 53, 101290. [Google Scholar] [CrossRef]
- Liu, Z.; Wang, C.; Liu, X.; Kuang, S. Shisa2 regulates the fusion of muscle progenitors. Stem Cell Res. 2018, 31, 31–41. [Google Scholar] [CrossRef] [PubMed]
- Smyth, G.K. Linear models and empirical bayes methods for assessing differential expression in microarray experiments. Stat. Appl. Genet. Mol. Biol. 2004, 3, 3. [Google Scholar] [CrossRef] [PubMed]
- Wrzodek, C.; Eichner, J.; Buchel, F.; Zell, A. InCroMAP: Integrated analysis of cross-platform microarray and pathway data. Bioinformatics 2013, 29, 506–508. [Google Scholar] [CrossRef]
- Chen, D.; Pan, X.; Xiao, P.; Farwell, M.A.; Zhang, B. Evaluation and identification of reliable reference genes for pharmacogenomics, toxicogenomics, and small RNA expression analysis. J. Cell Physiol. 2011, 226, 2469–2477. [Google Scholar] [CrossRef] [PubMed]
- Livak, K.J.; Schmittgen, T.D. Analysis of relative gene expression data using real-time quantitative PCR and the 2(-Delta Delta C(T)) Method. Methods 2001, 25, 402–408. [Google Scholar] [CrossRef] [PubMed]


| Physical Characteristics | Acute Exercise Performance | |||||
|---|---|---|---|---|---|---|
| Age (Years) | BMI (kg/m2) | VO2max (mL/min/kg) | Power Output at 80% VO2max (Watt) | Heart Rate at End (min−1) | Blood Lactate at End (mmol/L) | |
| SED (n = 8) | 22.6 ± 2.8 | 23.7 ± 3.7 | 40.3 ± 7.6 | 140 ± 40 | 180 ± 7 | 6.8 ± 3.2 |
| ET (n = 8) | 25.4 ± 3.8 | 22.9 ± 2.0 | 67.2 ± 8.9 *** | 260 ± 60 *** | 179 ± 9 | 7.4 ± 3.8 |
| Gene Symbol | Gene Title | Protein Function | Up-Regulated in | Fold Difference | p-Value | Preferential Fiber Type | Ref. |
|---|---|---|---|---|---|---|---|
| MYH7B | Myosin, heavy chain 7B, cardiac muscle, beta | Motor protein of myofilaments | ET↑ | 1.9 | 2.7 × 10⁻² | slow | [27] |
| ATP2A2 | ATPase, Ca++ transporting, cardiac muscle, slow twitch 2 | Sarcoplasmic reticulum calcium pump | ET↑ | 1.8 | 2.4 × 10⁻³ | slow | [28] |
| TNNI3 | Troponin I type 3 (cardiac) | Regulator of actin–myosin interaction | ET↑ | 1.8 | 4.7 × 10⁻³ | slow | [29] |
| KCNMA1 | Potassium large conductance calcium-activated channel, subfamily M, alpha member 1 | Regulator of muscle membrane potential | ET↑ | 1.8 | 2.6 × 10⁻³ | N/D | |
| CASQ2 | Calsequestrin 2 (cardiac muscle) | Calcium buffer in the sarcoplasmic reticulum | ET↑ | 1.8 | 9.2 × 10⁻⁴ | slow | [30] |
| MYL6B | Myosin, light chain 6B, alkali, smooth muscle, and non-muscle | Constituent of myofibrillar apparatus | ET↑ | 1.7 | 5.1 × 10⁻⁴ | slow | [31] |
| MYH6 | Myosin, heavy chain 6, cardiac muscle, alpha | Motor protein of myofilaments | ET↑ | 1.6 | 1.8 × 10⁻² | slow | [27] |
| PROX1 | Prospero homeobox 1 | Regulator of contractile protein gene expression | ET↑ | 1.6 | 8.8 × 10⁻³ | slow | [32] |
| MYL3 | Myosin, light chain 3, alkali; ventricular, skeletal, slow | Constituent of myofibrillar apparatus | ET↑ | 1.5 | 2.8 × 10⁻³ | slow | [27] |
| MYOM3 | Myomesin family, member 3 | Structural constituent of the sarcomere | ET↑ | 1.5 | 6.9 × 10⁻⁴ | slow | [33] |
| SLMAP | Sarcolemma associated protein | Regulator of excitation–contraction coupling | SED↑ | 1.5 | 6.7 × 10⁻³ | slow | [33] |
| SORBS2 | Sorbin and SH3 domain containing 2 | Assembly and maintenance of myofibrils | SED↑ | 1.6 | 3.5 × 10⁻² | N/D | |
| PPP3CA | Protein phosphatase 3, catalytic subunit, alpha isozyme | Calcineurin; regulator of muscle mass | SED↑ | 1.6 | 9.6 × 10⁻⁶ | fast | [34] |
| CAV3 | Caveolin 3 | Integral membrane component of caveolae | SED↑ | 1.6 | 4.7 × 10⁻² | fast | [35] |
| NEDD4 | Neural precursor cell expressed, developmentally down-regulated 4 | Mediator of skeletal muscle atrophy | SED↑ | 1.6 | 4.1 × 10⁻³ | N/D | |
| MYL5 | Myosin, light chain 5, regulatory | Constituent of myofibrillar apparatus | SED↑ | 1.6 | 3.6 × 10⁻³ | fast | [31] |
| KCNJ12 | Potassium inwardly rectifying channel, subfamily J, member 12 | Stabilization of the resting membrane potential | SED↑ | 1.6 | 8.0 × 10⁻³ | N/D | |
| VCL | Vinculin | Structural component of costameres | SED↑ | 1.6 | 1.3 × 10⁻² | slow/fast | [33] |
| DTNA | Dystrobrevin, alpha | Structural component of costameres | SED↑ | 1.6 | 1.3 × 10⁻² | fast | [33] |
| KIAA1161 | KIAA1161 | Putative regulator of myogenesis | SED↑ | 1.7 | 3.1 × 10⁻² | fast | [36] |
| MYBPC2 | Myosin binding protein C, fast type | Regulator of myofilament activation and relaxation | SED↑ | 1.7 | 2.3 × 10⁻⁵ | fast | [37] |
| FHL2 | Four and a half LIM domains 2 | Putative regulator of sarcomere assembly | SED↑ | 1.7 | 2.7 × 10⁻³ | slow | [38] |
| HOMER1 | Homer homolog 1 (Drosophila) | Regulator of transient receptor potential channel activity | SED↑ | 1.7 | 8.7 × 10⁻⁴ | N/D | |
| LMOD1 | Leiomodin 1 (smooth muscle) | Regulator of actin filament length | SED↑ | 1.9 | 2.1 × 10⁻² | N/D | |
| ABRA | Actin-binding Rho activating protein | Sarcomere-binding transcriptional regulator | SED↑ | 2.0 | 8.3 × 10⁻⁵ | N/D | |
| ATP2B2 | ATPase, Ca++ transporting, plasma membrane 2 | Plasma membrane calcium pump | SED↑ | 2.2 | 2.1 × 10⁻² | N/D | |
| MYH1 | Myosin, heavy chain 1, skeletal muscle, adult | Motor protein of myofilaments | SED↑ | 3.5 | 1.9 × 10⁻² | fast | [36] |
| ACTN3 | Actinin, alpha 3 | Structural component of sarcomeric Z line | SED↑ | 5.3 | 4.3 × 10⁻² | fast | [39] |
| Weight (kg) | BMI (kg/m2) | IAT (Watt/kg) | VO2max (mL/min/kg) | |
|---|---|---|---|---|
| pre (n = 10) | 79.5 ± 13.9 | 25.3 ± 4.4 | 1.6 ± 0.5 | 36.1 ± 6.3 |
| post (n = 10) | 79.2 ± 14.0 | 25.3 ± 4.3 | 2.0 ± 0.3 *** | 43.7 ± 6.4 *** |
Disclaimer/Publisher’s Note: The statements, opinions and data contained in all publications are solely those of the individual author(s) and contributor(s) and not of MDPI and/or the editor(s). MDPI and/or the editor(s) disclaim responsibility for any injury to people or property resulting from any ideas, methods, instructions or products referred to in the content. |
© 2024 by the authors. Licensee MDPI, Basel, Switzerland. This article is an open access article distributed under the terms and conditions of the Creative Commons Attribution (CC BY) license (https://creativecommons.org/licenses/by/4.0/).
Share and Cite
Beiter, T.; Zügel, M.; Hudemann, J.; Schild, M.; Fragasso, A.; Burgstahler, C.; Krüger, K.; Mooren, F.C.; Steinacker, J.M.; Nieß, A.M. The Acute, Short-, and Long-Term Effects of Endurance Exercise on Skeletal Muscle Transcriptome Profiles. Int. J. Mol. Sci. 2024, 25, 2881. https://doi.org/10.3390/ijms25052881
Beiter T, Zügel M, Hudemann J, Schild M, Fragasso A, Burgstahler C, Krüger K, Mooren FC, Steinacker JM, Nieß AM. The Acute, Short-, and Long-Term Effects of Endurance Exercise on Skeletal Muscle Transcriptome Profiles. International Journal of Molecular Sciences. 2024; 25(5):2881. https://doi.org/10.3390/ijms25052881
Chicago/Turabian StyleBeiter, Thomas, Martina Zügel, Jens Hudemann, Marius Schild, Annunziata Fragasso, Christof Burgstahler, Karsten Krüger, Frank C. Mooren, Jürgen M. Steinacker, and Andreas M. Nieß. 2024. "The Acute, Short-, and Long-Term Effects of Endurance Exercise on Skeletal Muscle Transcriptome Profiles" International Journal of Molecular Sciences 25, no. 5: 2881. https://doi.org/10.3390/ijms25052881