
OsMYB58 Negatively Regulates Plant Growth and Development by Regulating Phosphate Homeostasis
 , , and
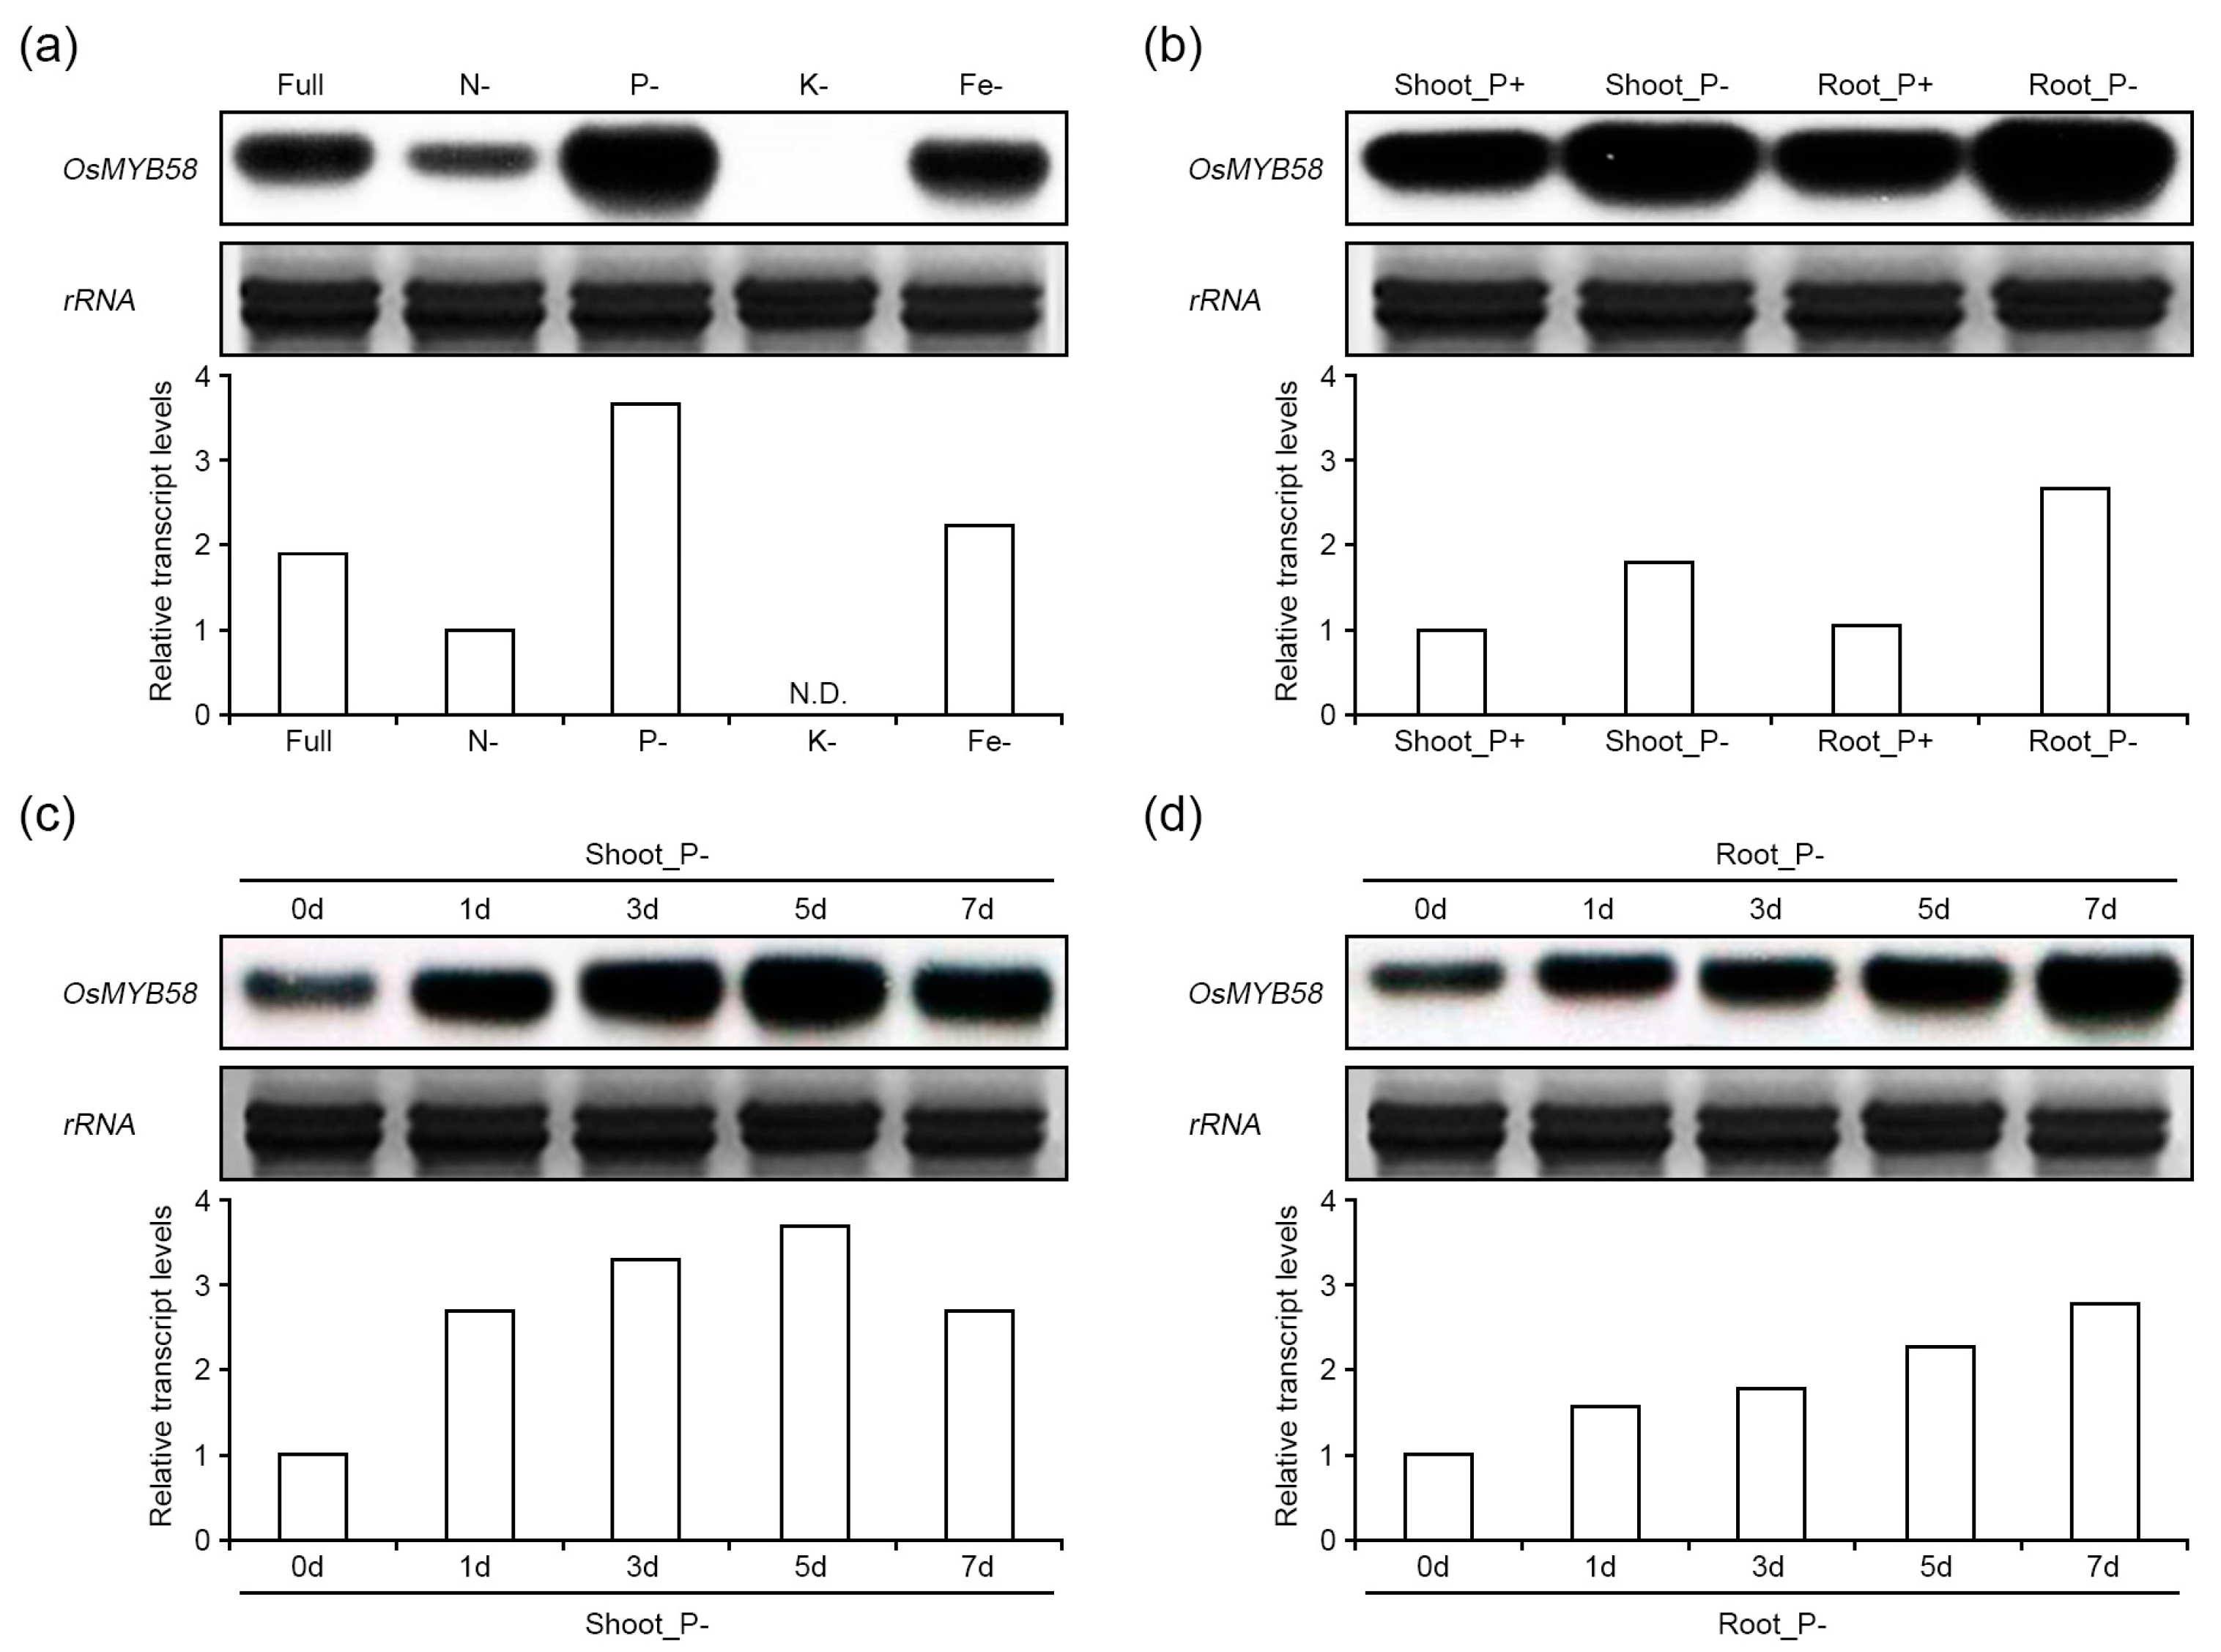
Abstract
:1. Introduction
2. Results
2.1. OsMYB58 Expression Is Enhanced under Phosphate-Deficient Conditions
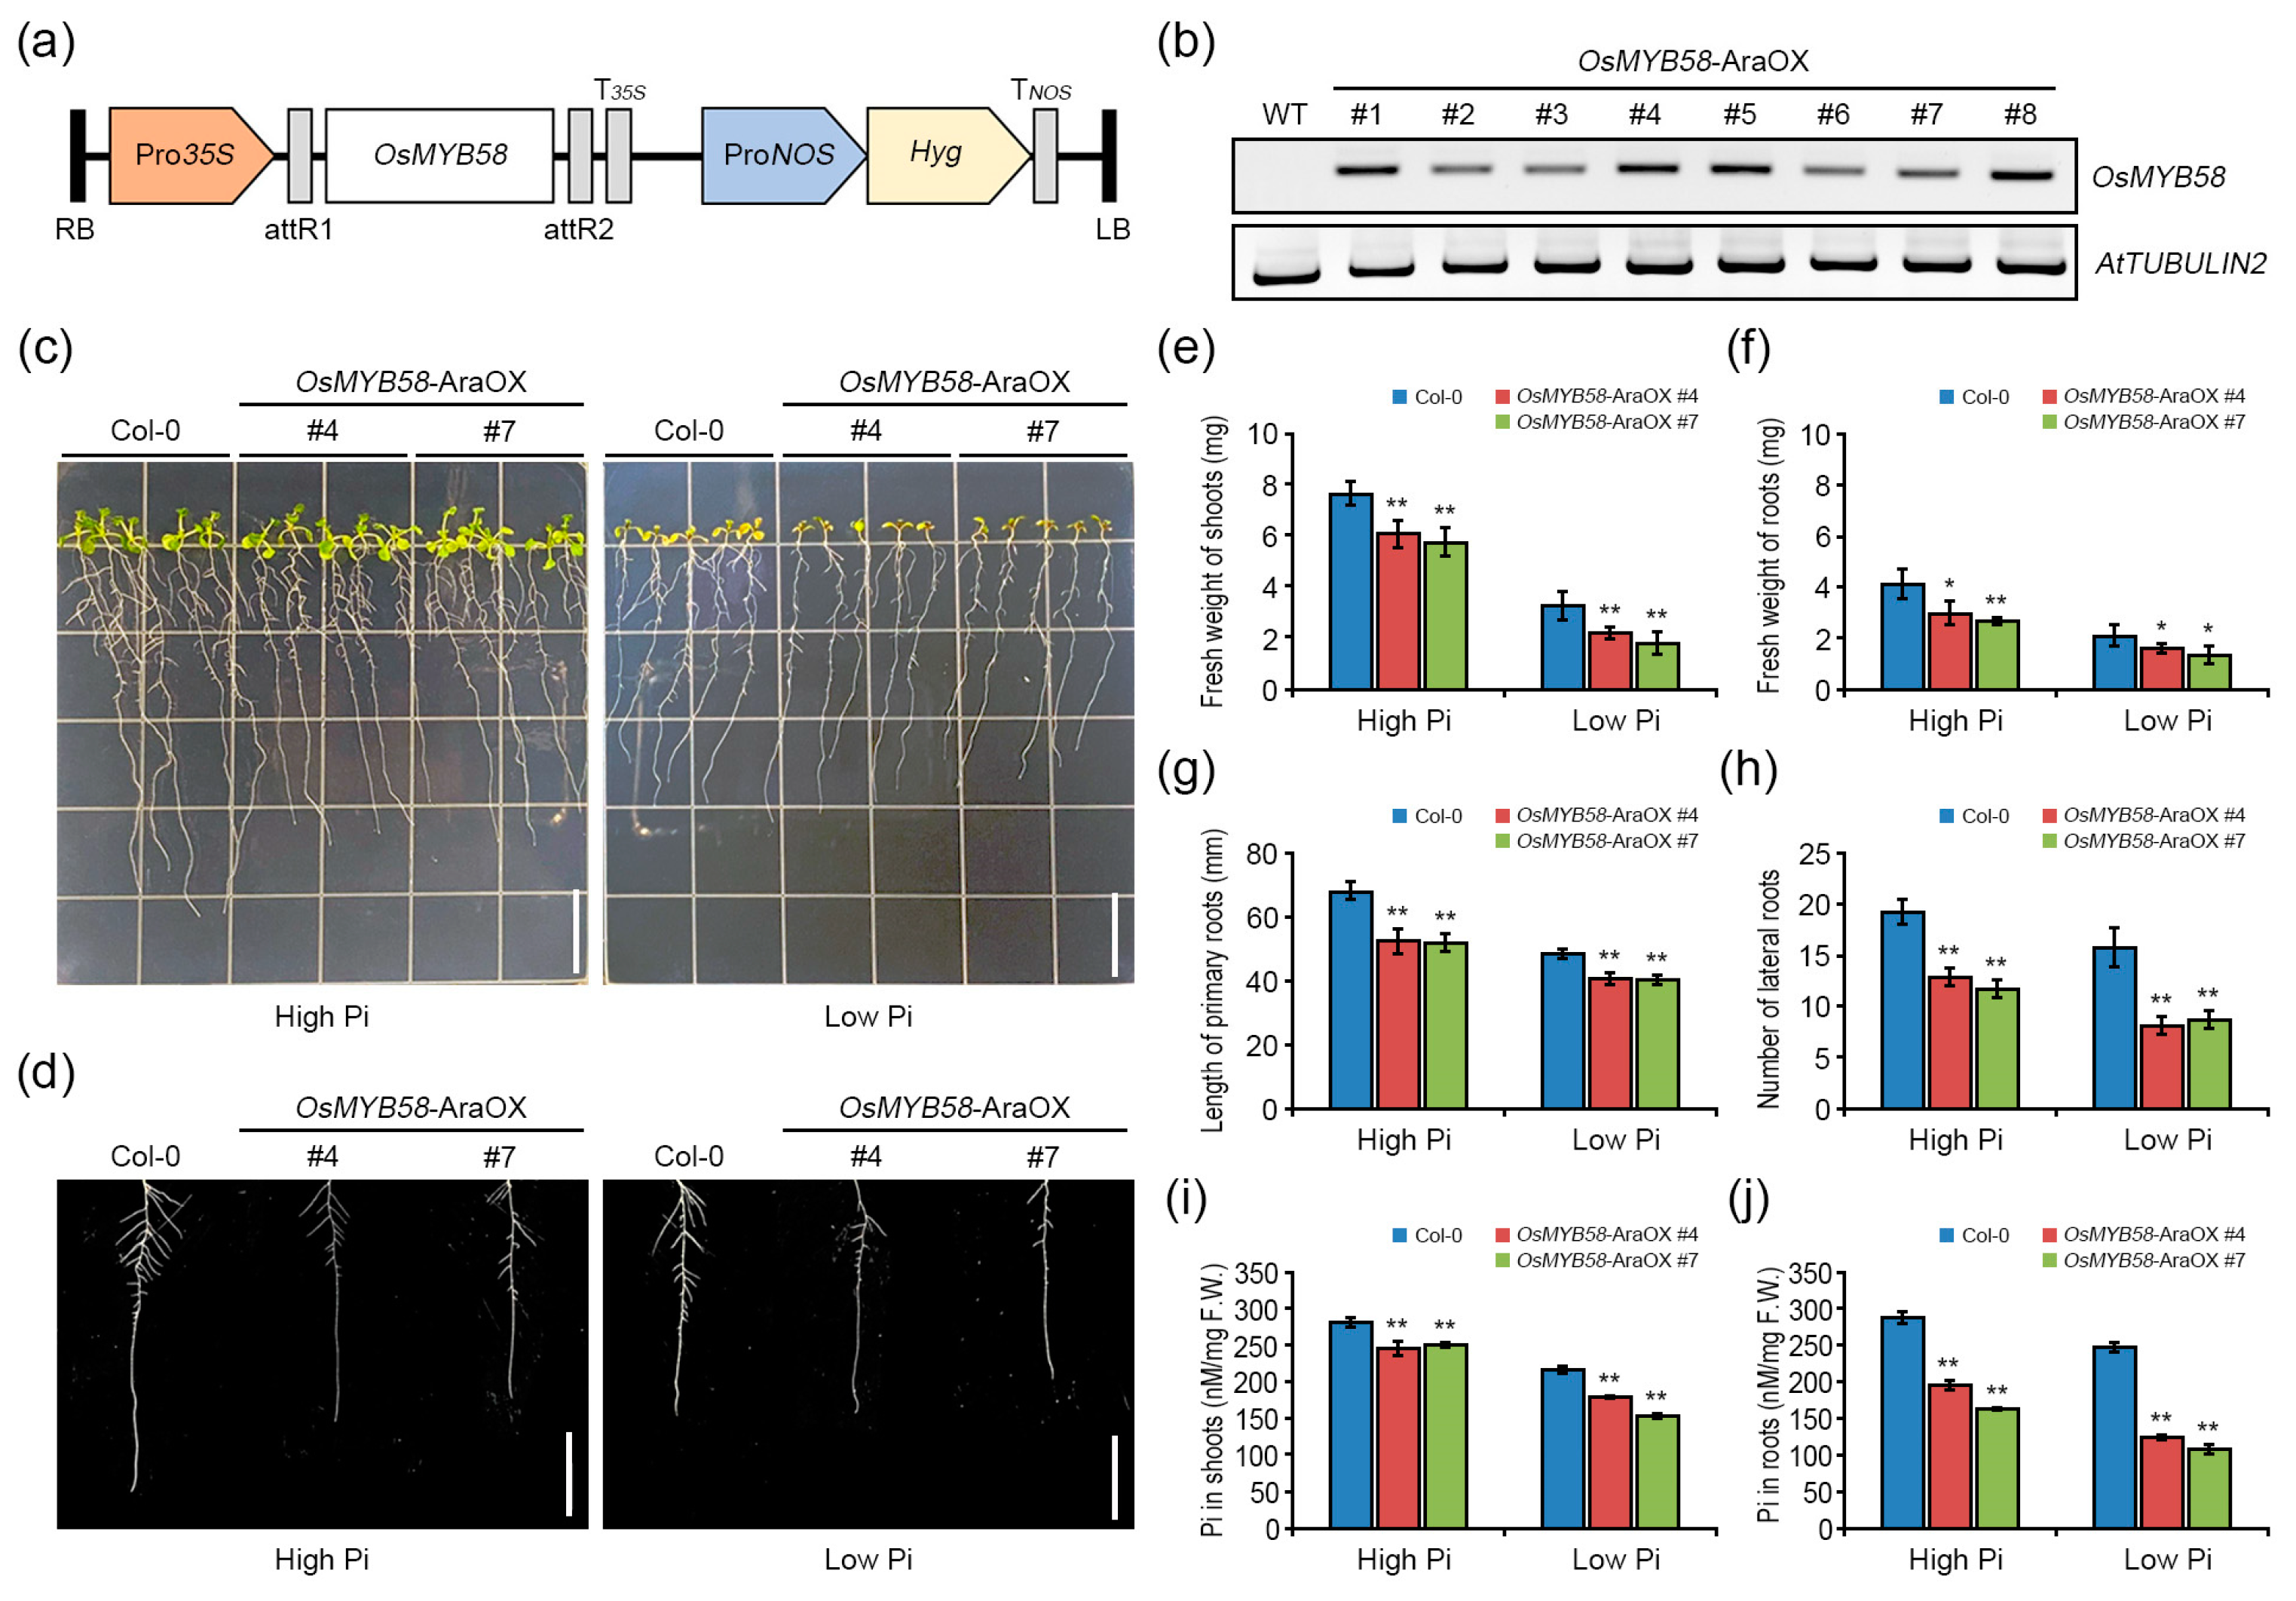
2.2. Heterologously Overexpressing OsMYB58 in Arabidopsis Disrupts Pi Homeostasis in Response to Pi Deficiency
2.3. OsMYB58 Modulates Plant Growth during the Pi Deficiency Response
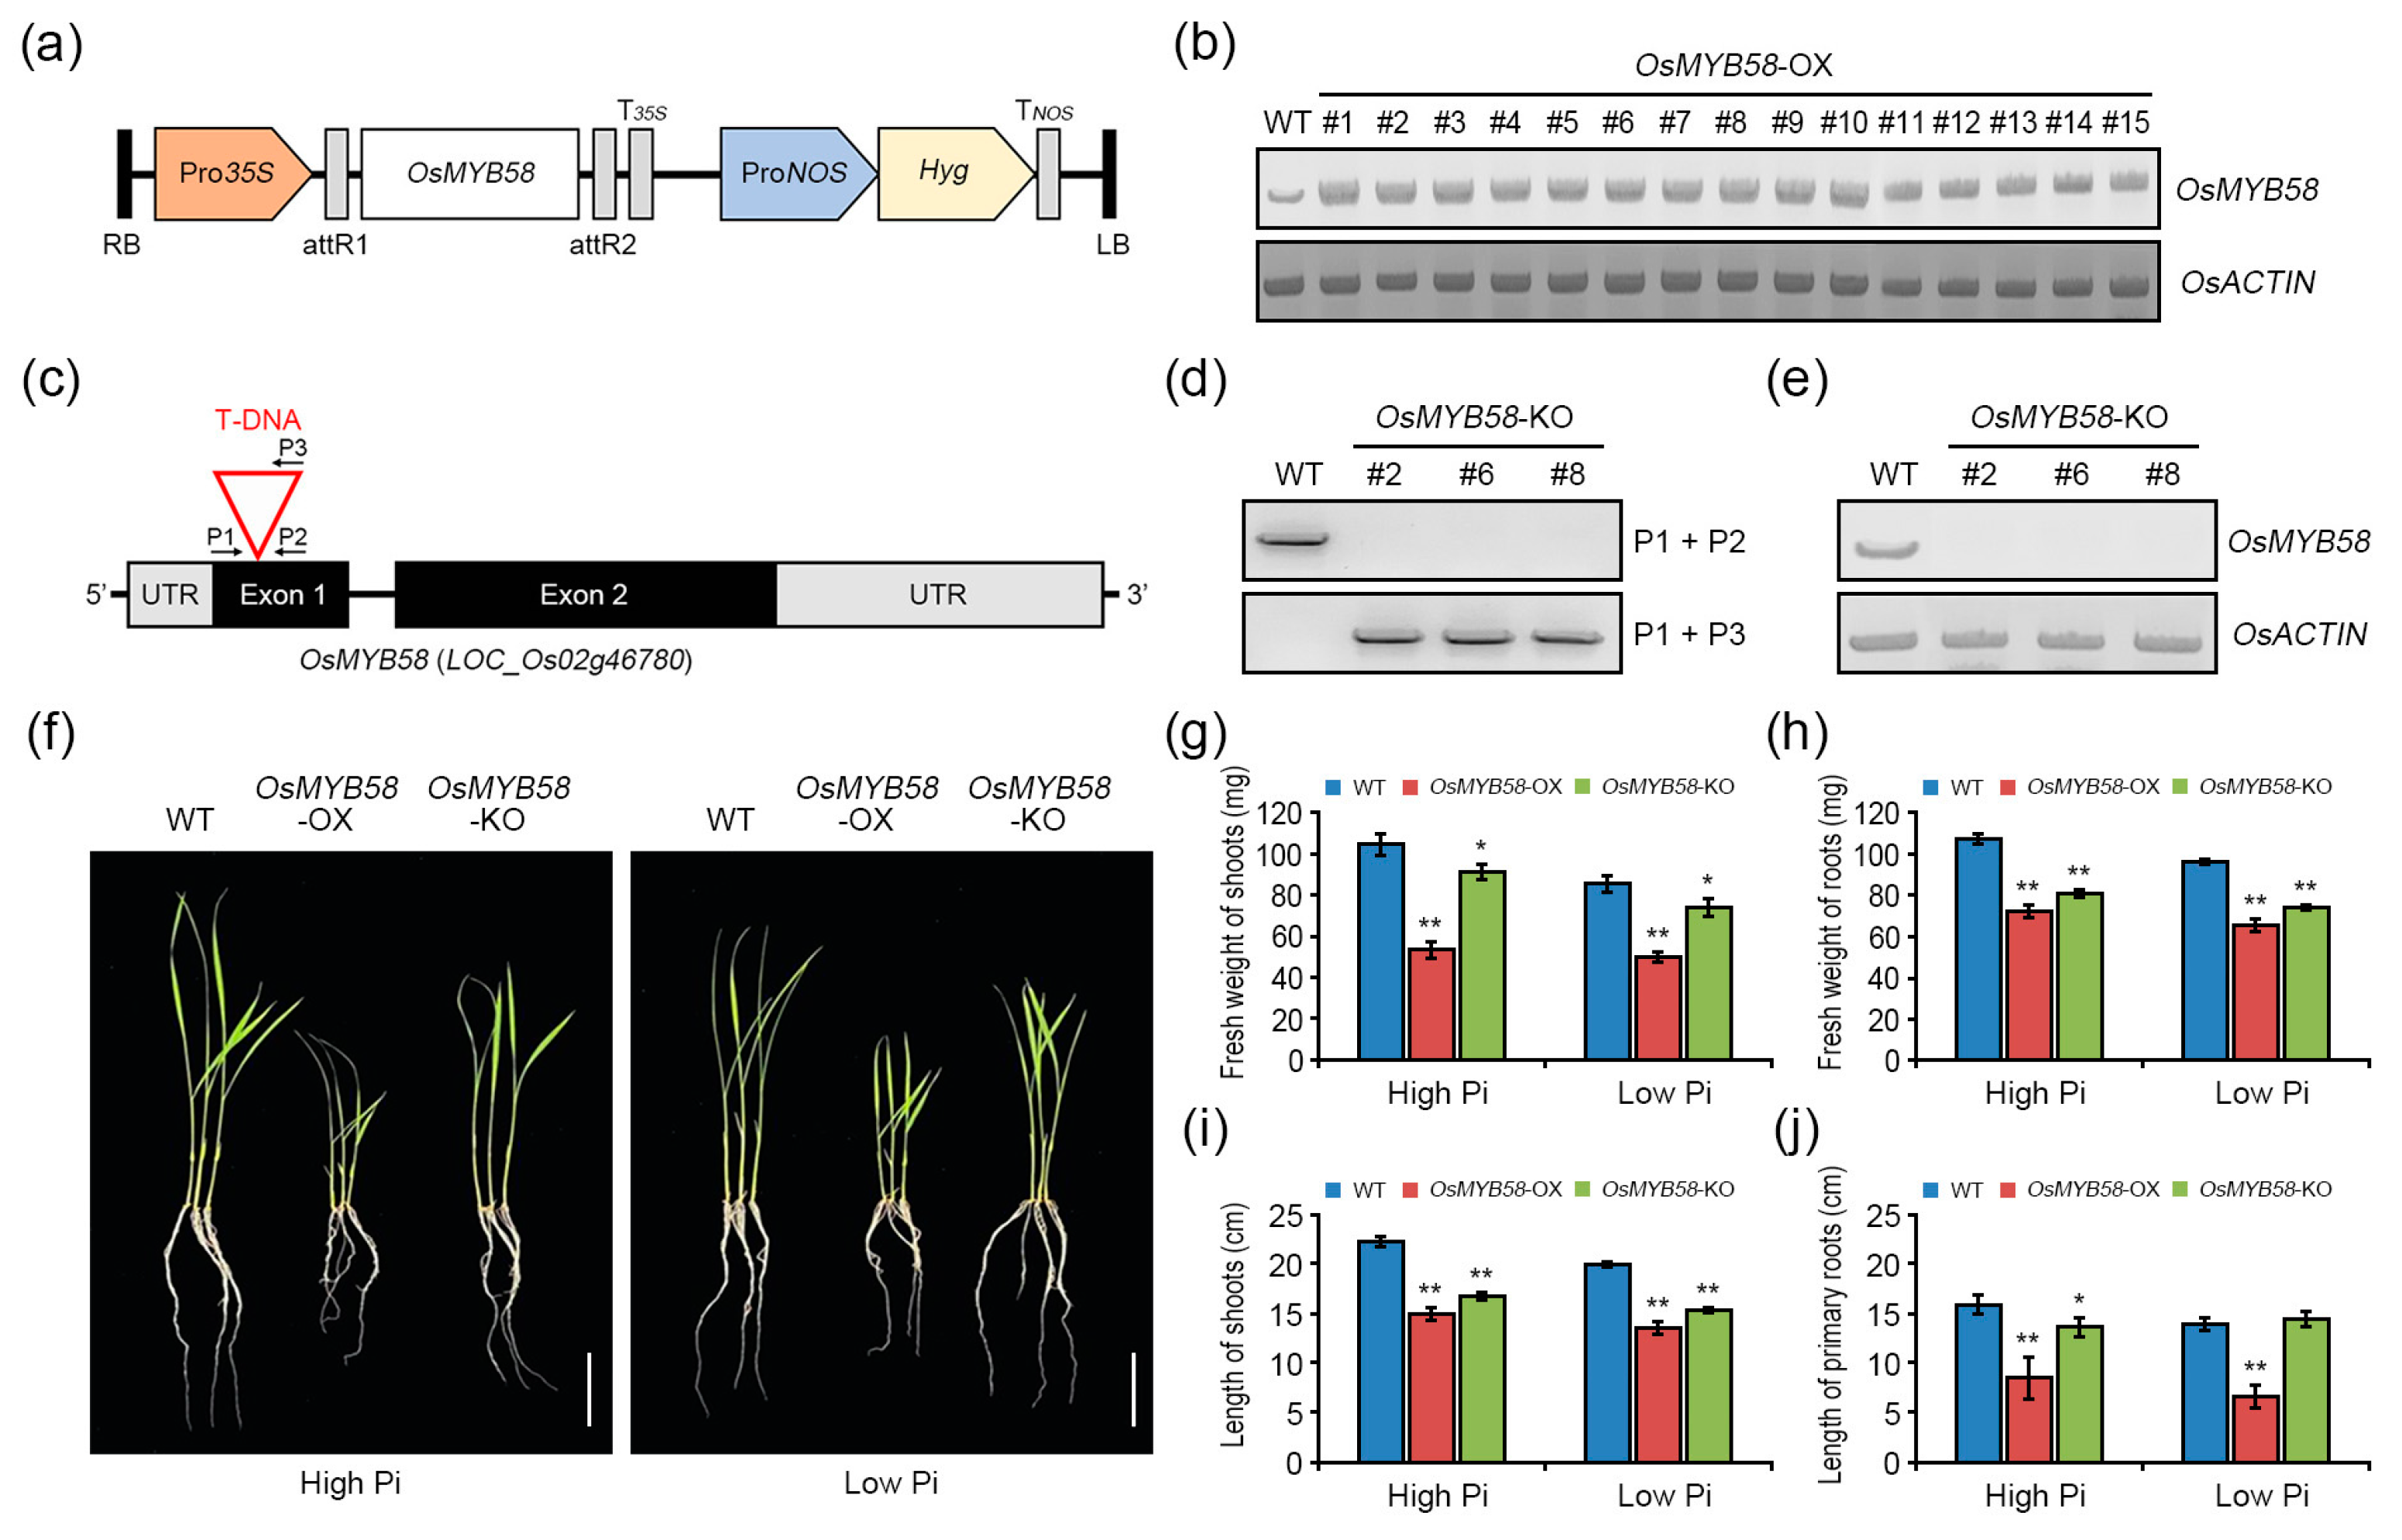
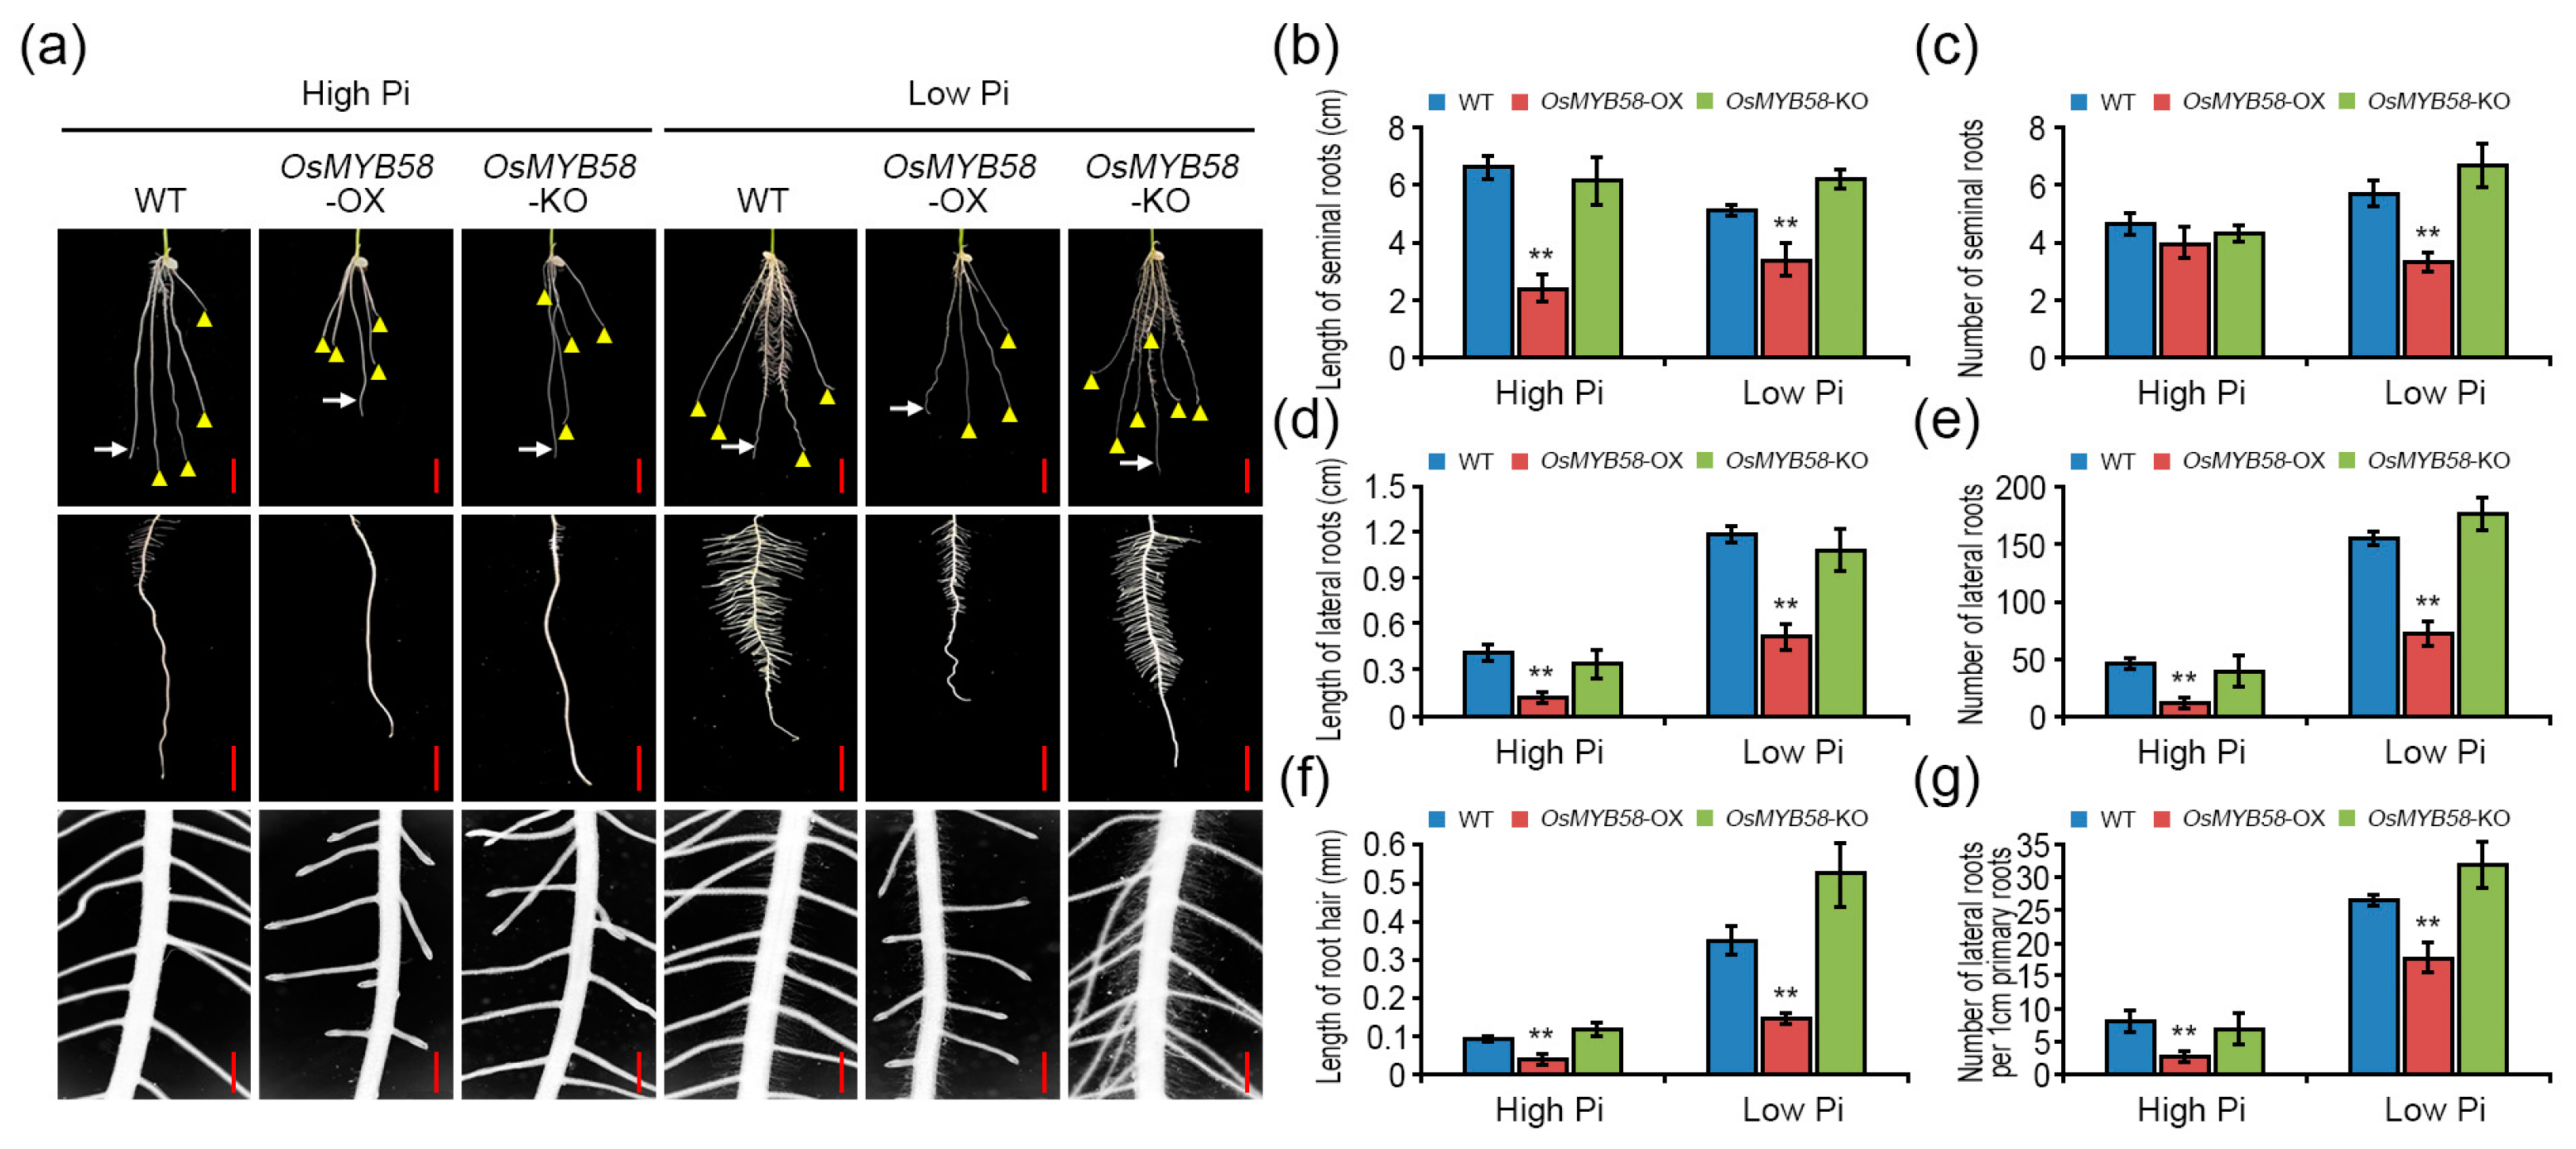
2.4. OsMYB58 Represses Root Development in Rice
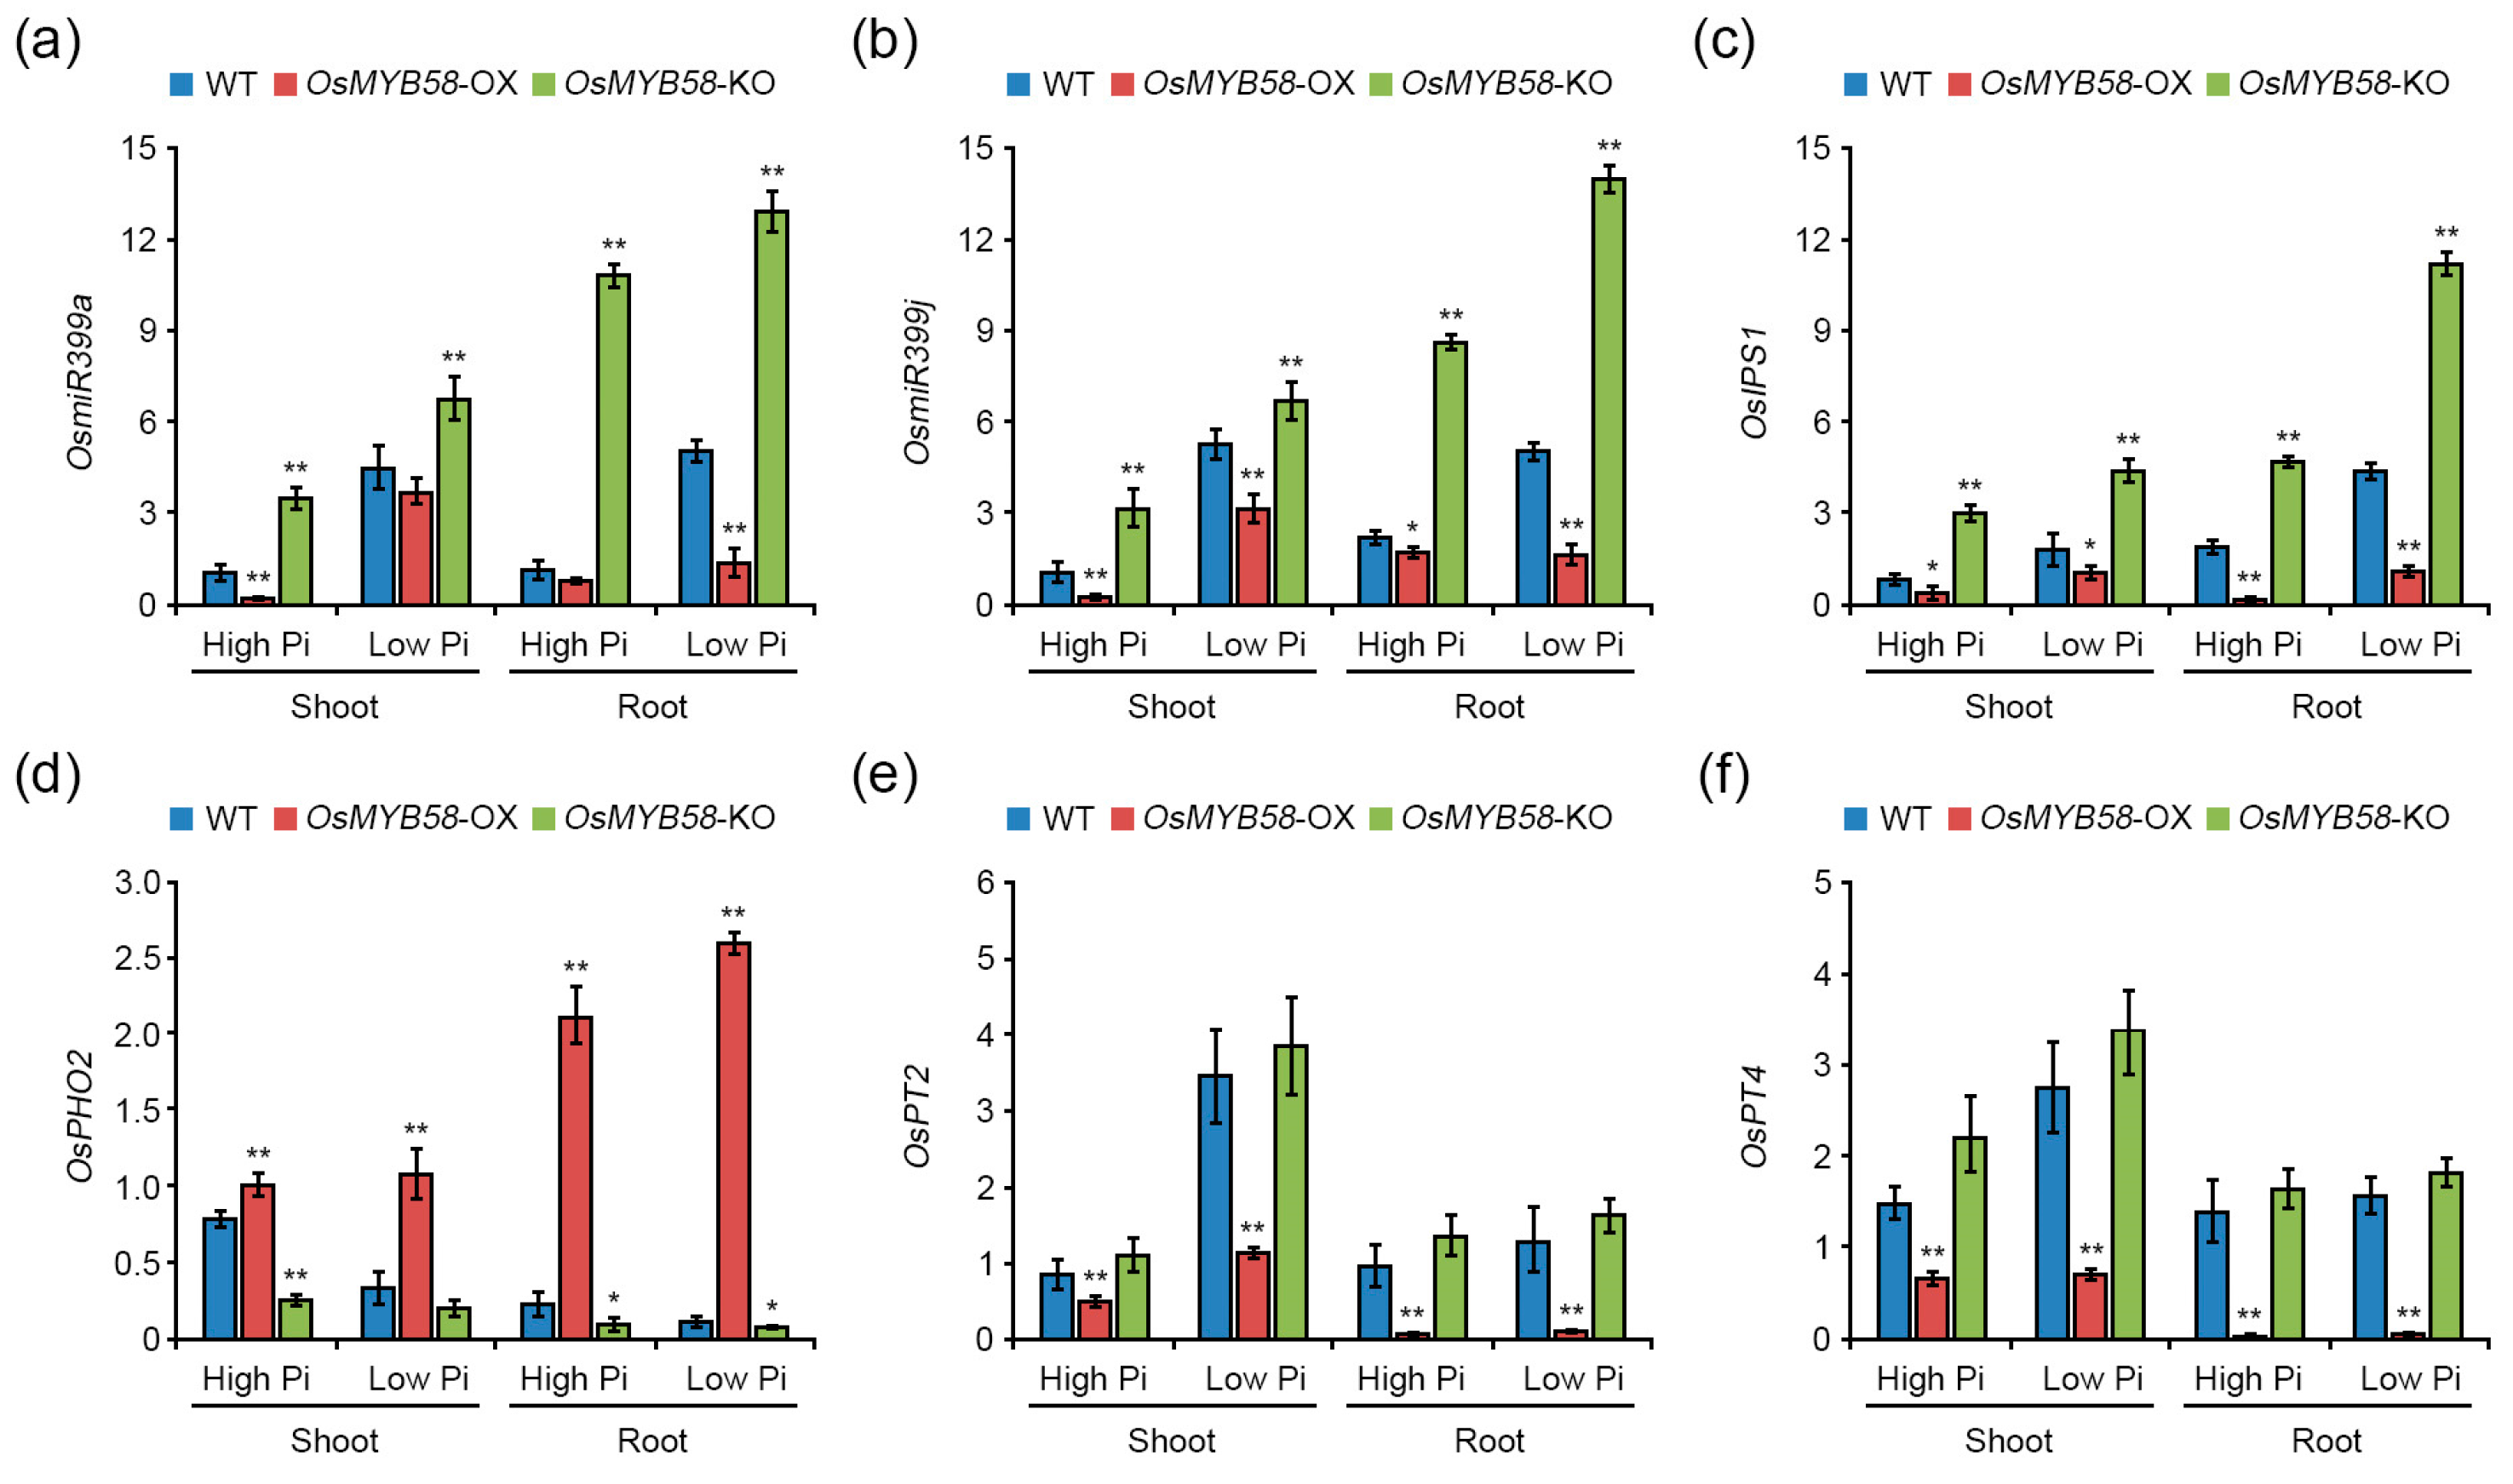
2.5. OsMYB58 Is Associated with Pi-Responsive Gene Expression
3. Discussion
3.1. OsMYB58 Is Associated with Plant Response to Pi Deficiency
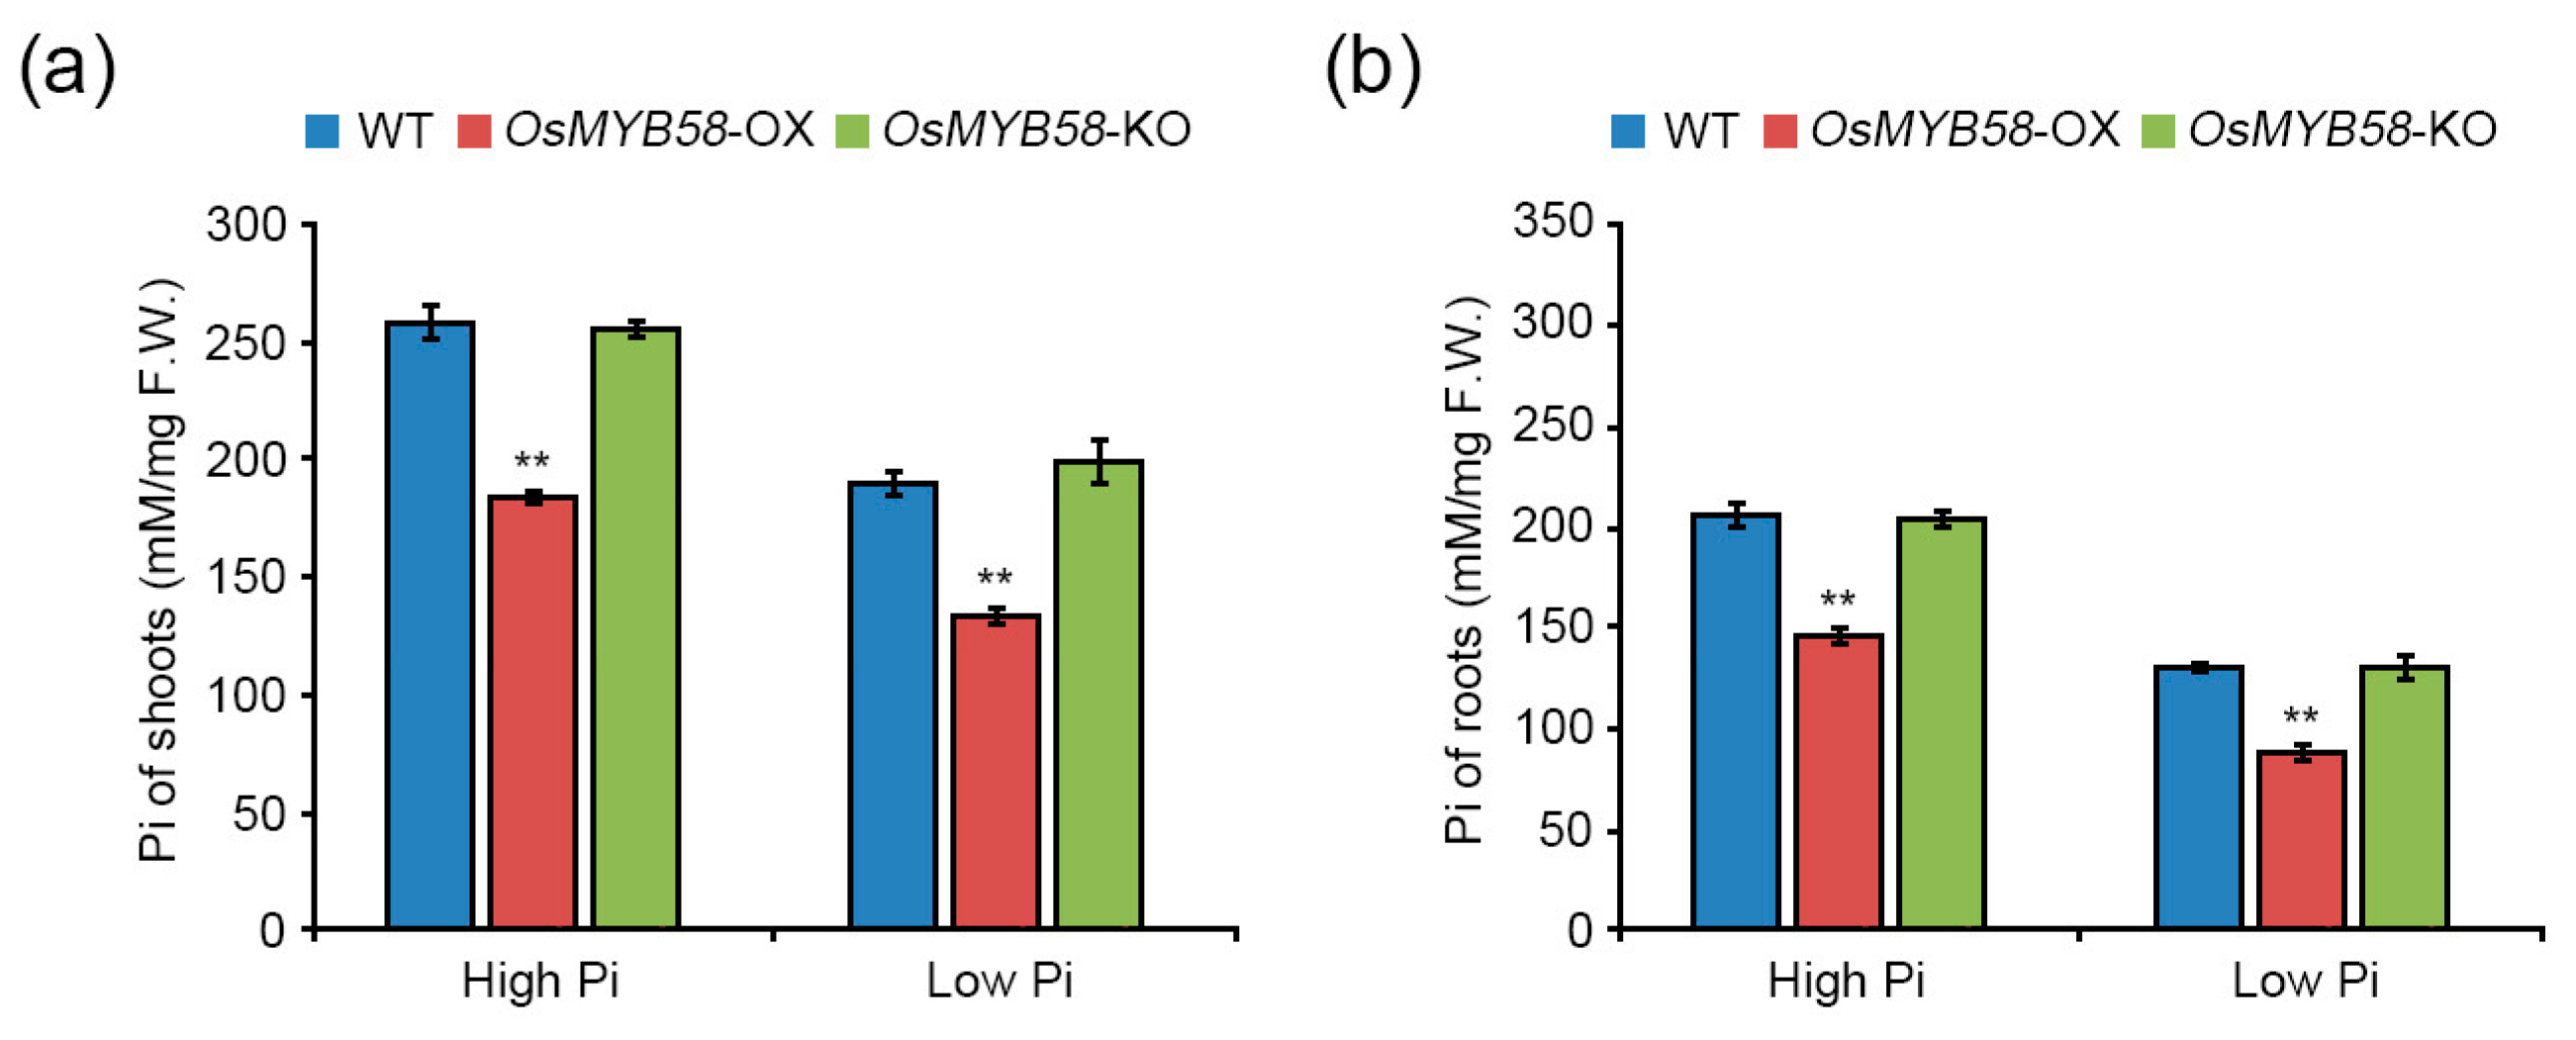
3.2. OsMYB58 Inhibits Plant Growth and Development by Disrupting Pi Homeostasis
3.3. OsMYB58 Is a Negative Regulator of Pi Starvation Signaling
4. Materials and Methods
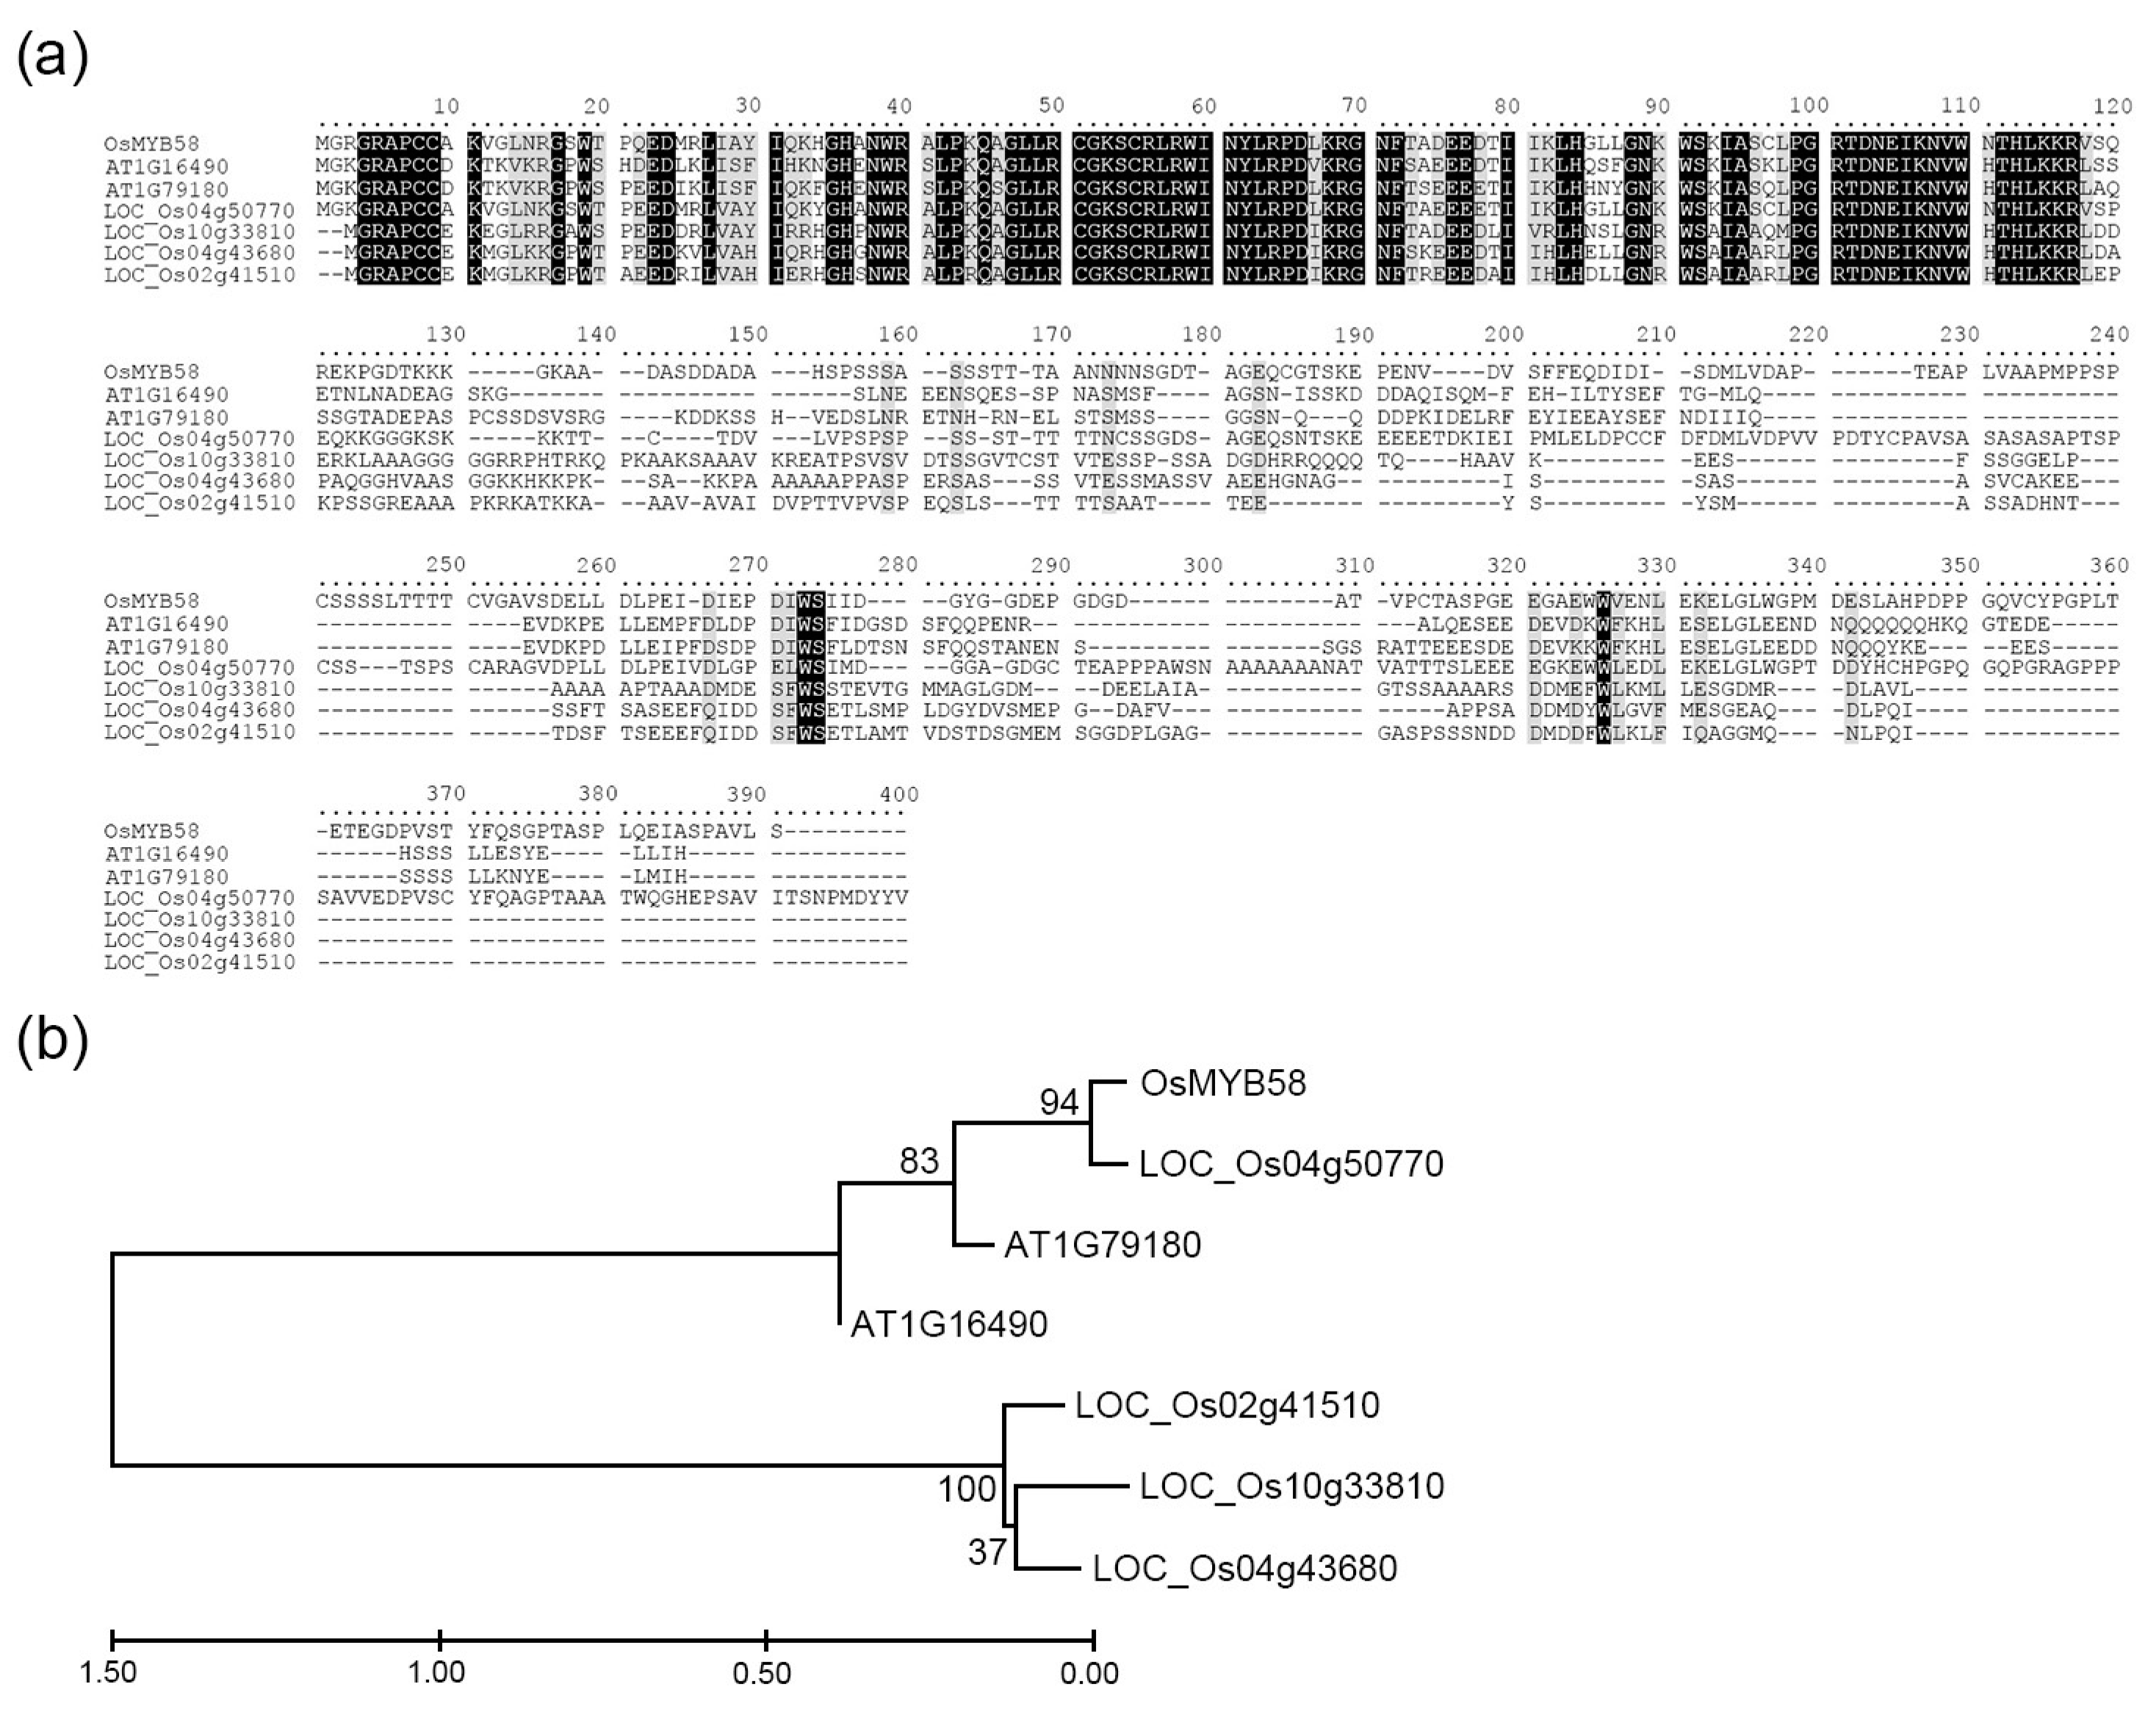
4.1. In Silico Analysis
4.2. Generation of MYB58 Transgenic Plants
4.3. Plant Materials and Growth Conditions
4.4. Northern Bolt and Gene Expression Analysis
4.5. Measurement of Inorganic Pi Content in Plants
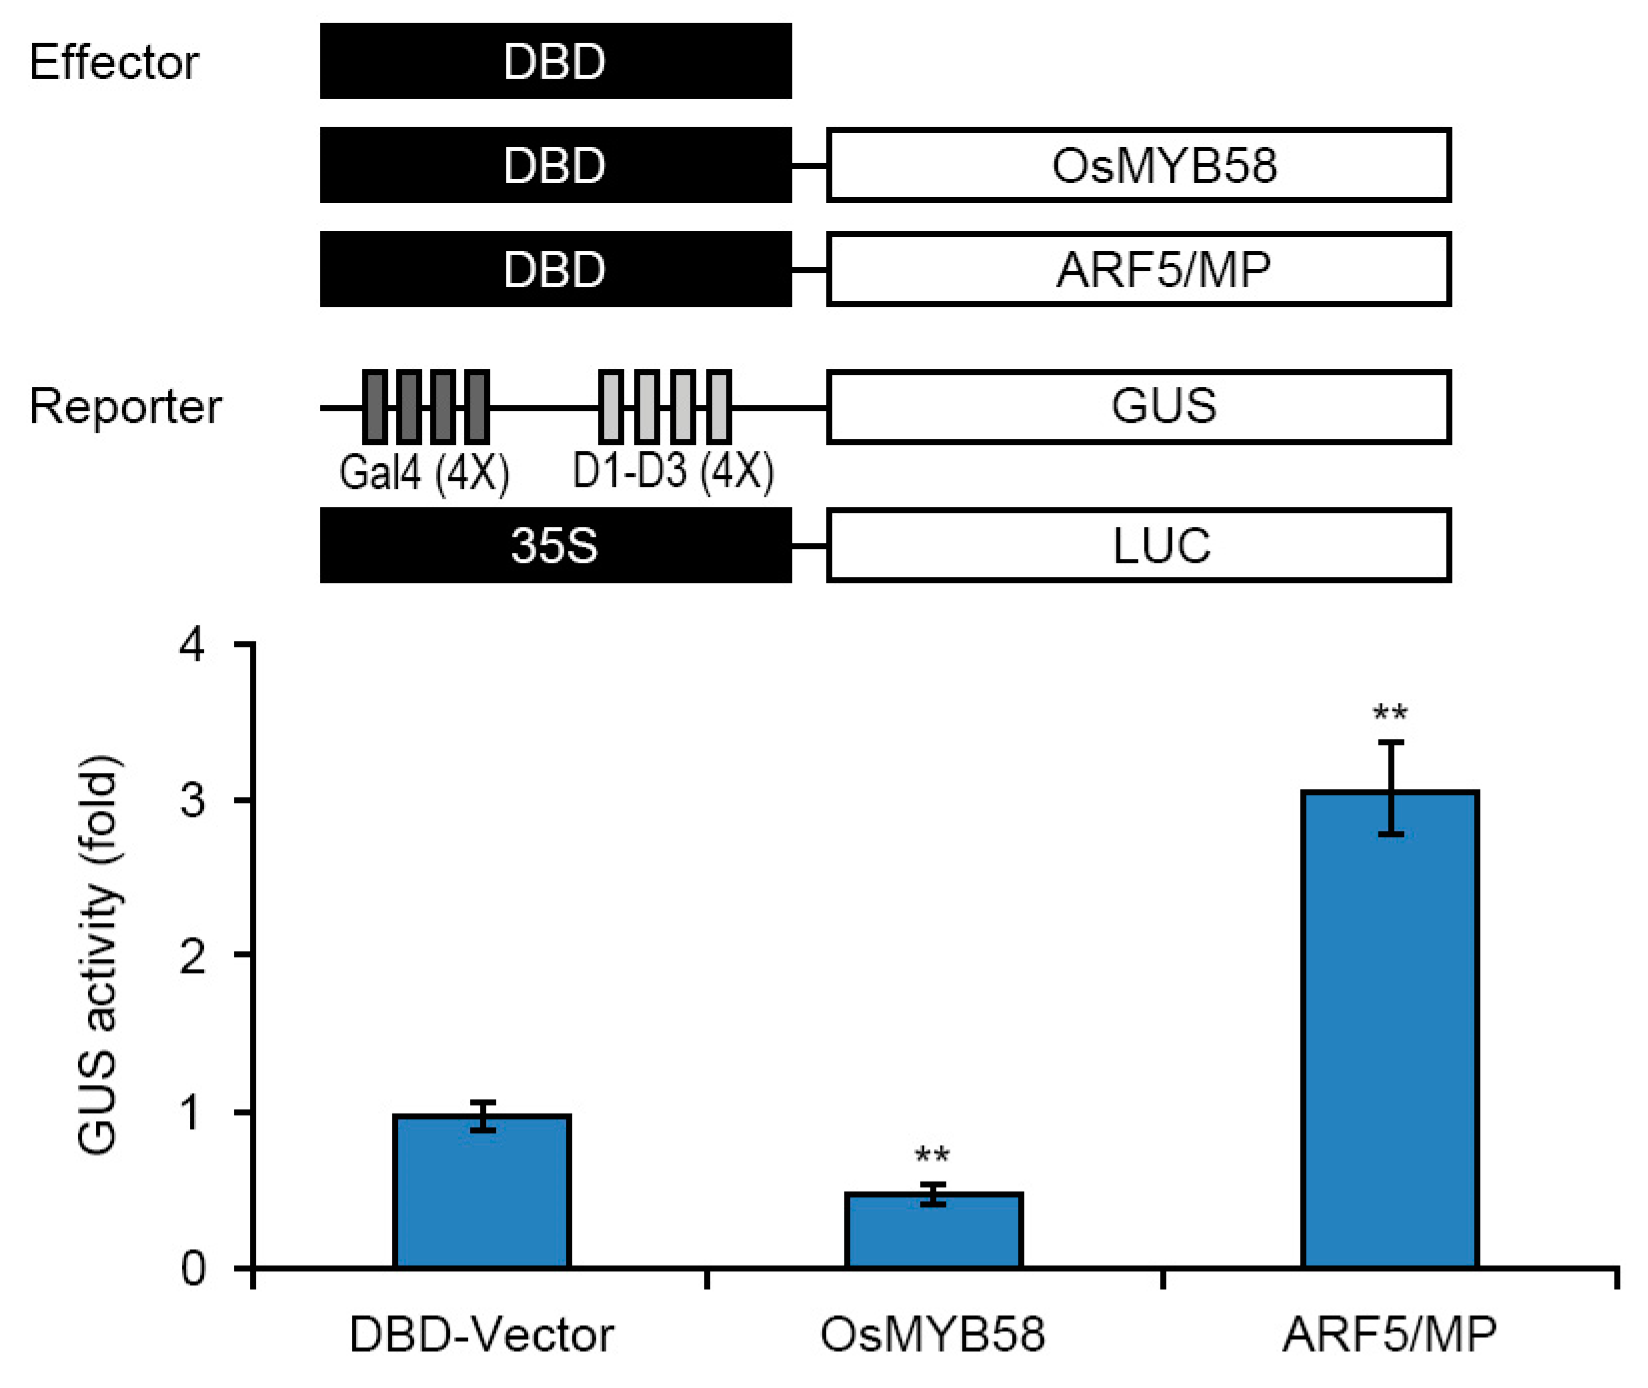
4.6. Transcriptional Activity Assay via Transient Expression of OsMYB58 in Arabidopsis Protoplasts
5. Conclusions
Supplementary Materials
Author Contributions
Funding
Institutional Review Board Statement
Informed Consent Statement
Data Availability Statement
Conflicts of Interest
References
- Raghothama, K.G. Phosphate acquisition. Annu. Rev. Plant Physiol. Plant Mol. Biol. 1999, 50, 665–693. [Google Scholar] [CrossRef] [PubMed]
- Jiang, M.; Caldararu, S.; Zaehle, S.; Ellsworth, D.S.; Medlyn, B.E. Towards a more physiological representation of vegetation phosphorus processes in land surface models. New Phytol. 2019, 222, 1223–1229. [Google Scholar] [CrossRef]
- Pratt, J.; Boisson, A.M.; Gout, E.; Bligny, R.; Douce, R.; Aubert, S. Phosphate (Pi) starvation effect on the cytosolic Pi concentration and Pi exchanges across the tonoplast in plant cells: An in vivo 31P-nuclear magnetic resonance study using methylphosphonate as a Pi analog. Plant Physiol. 2009, 151, 1646–1657. [Google Scholar] [CrossRef] [PubMed]
- Chiou, T.J.; Lin, S.I. Signaling network in sensing phosphate availability in plants. Annu. Rev. Plant Biol. 2011, 62, 185–206. [Google Scholar] [CrossRef] [PubMed]
- Shi, J.; Zhao, B.; Zheng, S.; Zhang, X.; Wang, X.; Dong, W.; Xie, Q.; Wang, G.; Xiao, Y.; Chen, F.; et al. A phosphate starvation response-centered network regulates mycorrhizal symbiosis. Cell 2021, 184, 5527–5540.e18. [Google Scholar] [CrossRef] [PubMed]
- Li, J.; Han, G.; Sun, C.; Sui, N. Research advances of MYB transcription factors in plant stress resistance and breeding. Plant Signal. Behav. 2019, 14, 1613131. [Google Scholar] [CrossRef] [PubMed]
- Ambawat, S.; Sharma, P.; Yadav, R.N.; Yadav, C.R. MYB transcription factor genes as regulators for plant responses: An overview. Physiol. Mol. Biol. Plants 2013, 19, 307–321. [Google Scholar] [CrossRef] [PubMed]
- Dubos, C.; Stracke, R.; Grotewold, E.; Weisshaar, B.; Martin, C.; Lepiniec, L. MYB transcription factors in Arabidopsis. Trends Plant Sci. 2010, 15, 573–581. [Google Scholar] [CrossRef]
- Wu, Y.; Wen, J.; Xia, Y.; Zhang, L.; Du, H. Evolution and functional diversification of R2R3-MYB transcription factors in plants. Hortic. Res. 2022, 9, uhac058. [Google Scholar] [CrossRef]
- Yang, A.; Dai, X.; Zhang, W.H. A R2R3-type MYB gene, OsMYB2, is involved in salt, cold, and dehydration tolerance in rice. J. Exp. Bot. 2012, 63, 2541–2556. [Google Scholar] [CrossRef]
- Zhao, Y.; Cheng, X.; Liu, X.; Wu, H.; Bi, H.; Xu, H. The Wheat MYB Transcription Factor TaMYB31 is involved in drought stress responses in Arabidopsis. Front. Plant Sci. 2018, 9, 1426. [Google Scholar] [CrossRef] [PubMed]
- Cao, X.; Xu, L.; Li, L.; Wan, W.; Jiang, J. TcMYB29a, an ABA-responsive R2R3-MYB transcriptional factor, upregulates taxol biosynthesis in Taxus chinensis. Front. Plant Sci. 2022, 13, 804593. [Google Scholar] [CrossRef] [PubMed]
- Fichman, Y.; Zandalinas, S.I.; Sengupta, S.; Burks, D.; Myers, R.J., Jr.; Azad, R.K.; Mittler, R. MYB30 orchestrates systemic reactive oxygen signaling and plant acclimation. Plant Physiol. 2020, 184, 666–675. [Google Scholar] [CrossRef] [PubMed]
- Wang, P.; Li, G.; Li, G.; Yuan, S.; Wang, C.; Xie, Y.; Guo, T.; Kang, G.; Wang, D. TaPHT1;9-4B and its transcriptional regulator TaMYB4-7D contribute to phosphate uptake and plant growth in bread wheat. New Phytol. 2021, 231, 1968–1983. [Google Scholar] [CrossRef]
- Wang, H.; Pak, S.; Yang, J.; Wu, Y.; Li, W.; Feng, H.; Yang, J.; Wei, H.; Li, C. Two high hierarchical regulators, PuMYB40 and PuWRKY75, control the low phosphorus driven adventitious root formation in Populus ussuriensis. Plant Biotechnol. J. 2022, 20, 1561–1577. [Google Scholar] [CrossRef] [PubMed]
- Kang, L.; Teng, Y.; Cen, Q.; Fang, Y.; Tian, Q.; Zhang, X.; Wang, H.; Zhang, X.; Xue, D. Genome-wide identification of R2R3-MYB transcription factor and expression analysis under abiotic stress in rice. Plants 2022, 11, 1928. [Google Scholar] [CrossRef]
- Dai, X.; Wang, Y.; Yang, A.; Zhang, W.H. OsMYB2P-1, an R2R3 MYB transcription factor, is involved in the regulation of phosphate-starvation responses and root architecture in rice. Plant Physiol. 2012, 159, 169–183. [Google Scholar] [CrossRef]
- Yang, W.T.; Baek, D.; Yun, D.J.; Hwang, W.H.; Park, D.S.; Nam, M.H.; Chung, E.S.; Chung, Y.S.; Yi, Y.B.; Kim, D.H. Overexpression of OsMYB4P, an R2R3-type MYB transcriptional activator, increases phosphate acquisition in rice. Plant Physiol. Biochem. 2014, 80, 259–267. [Google Scholar] [CrossRef]
- Gu, M.; Zhang, J.; Li, H.; Meng, D.; Li, R.; Dai, X.; Wang, S.; Liu, W.; Qu, H.; Xu, G. Maintenance of phosphate homeostasis and root development are coordinately regulated by MYB1, an R2R3-type MYB transcription factor in rice. J. Exp. Bot. 2017, 68, 3603–3615. [Google Scholar] [CrossRef]
- Yang, W.T.; Baek, D.; Yun, D.J.; Lee, K.S.; Hong, S.Y.; Bae, K.D.; Chung, Y.S.; Kwon, Y.S.; Kim, D.H.; Jung, K.H.; et al. Rice OsMYB5P improves plant phosphate acquisition by regulation of phosphate transporter. PLoS ONE 2018, 13, e0194628. [Google Scholar] [CrossRef]
- Hu, B.; Wang, W.; Deng, K.; Li, H.; Zhang, Z.; Zhang, L.; Chu, C. MicroRNA399 is involved in multiple nutrient starvation responses in rice. Front. Plant Sci. 2015, 6, 188. [Google Scholar] [CrossRef]
- Cuyas, L.; David, P.; de Craieye, D.; Ng, S.; Arkoun, M.; Plassard, C.; Faharidine, M.; Hourcade, D.; Degan, F.; Pluchon, S.; et al. Identification and interest of molecular markers to monitor plant Pi status. BMC Plant Biol. 2023, 23, 401. [Google Scholar] [CrossRef]
- Wang, F.; Deng, M.; Xu, J.; Zhu, X.; Mao, C. Molecular mechanisms of phosphate transport and signaling in higher plants. Semin. Cell Dev. Biol. 2018, 74, 114–122. [Google Scholar] [CrossRef]
- Wang, Z.; Hu, H.; Huang, H.; Duan, K.; Wu, Z.; Wu, P. Regulation of OsSPX1 and OsSPX3 on expression of OsSPX domain genes and Pi-starvation signaling in rice. J. Integr. Plant Biol. 2009, 51, 663–674. [Google Scholar] [CrossRef] [PubMed]
- Bari, R.; Datt Pant, B.; Stitt, M.; Scheible, W.R. PHO2, microRNA399, and PHR1 define a phosphate-signaling pathway in plants. Plant Physiol. 2006, 141, 988–999. [Google Scholar] [CrossRef] [PubMed]
- Wang, S.; Zhang, S.; Sun, C.; Xu, Y.; Chen, Y.; Yu, C.; Qian, Q.; Jiang, D.A.; Qi, Y. Auxin response factor (OsARF12), a novel regulator for phosphate homeostasis in rice (Oryza sativa). New Phytol. 2014, 201, 91–103. [Google Scholar] [CrossRef] [PubMed]
- Zhou, J.; Jiao, F.; Wu, Z.; Li, Y.; Wang, X.; He, X.; Zhong, W.; Wu, P. OsPHR2 is involved in phosphate-starvation signaling and excessive phosphate accumulation in shoots of plants. Plant Physiol. 2008, 146, 1673–1686. [Google Scholar] [CrossRef] [PubMed]
- Hu, B.; Zhu, C.; Li, F.; Tang, J.; Wang, Y.; Lin, A.; Liu, L.; Che, R.; Chu, C. LEAF TIP NECROSIS1 plays a pivotal role in the regulation of multiple phosphate starvation responses in rice. Plant Physiol. 2011, 156, 1101–1115. [Google Scholar] [CrossRef] [PubMed]
- Heuer, S.; Gaxiola, R.; Schilling, R.; Herrera-Estrella, L.; López-Arredondo, D.; Wissuwa, M.; Delhaize, E.; Rouached, H. Improving phosphorus use efficiency: A complex trait with emerging opportunities. Plant J. 2017, 90, 868–885. [Google Scholar] [CrossRef] [PubMed]
- Hirano, K.; Kondo, M.; Aya, K.; Miyao, A.; Sato, Y.; Antonio, B.A.; Namiki, N.; Nagamura, Y.; Matsuoka, M. Identification of transcription factors involved in rice secondary cell wall formation. Plant Cell Physiol. 2013, 54, 1791–1802. [Google Scholar] [CrossRef]
- Noda, S.; Koshiba, T.; Hattori, T.; Yamaguchi, M.; Suzuki, S.; Umezawa, T. The expression of a rice secondary wall-specific cellulose synthase gene, OsCesA7, is directly regulated by a rice transcription factor, OsMYB58/63. Planta 2015, 242, 589–600. [Google Scholar] [CrossRef]
- Jeon, J.S.; Lee, S.; Jung, K.H.; Jun, S.H.; Jeong, D.H.; Lee, J.; Kim, C.; Jang, S.; Yang, K.; Nam, J.; et al. DNA insertional mutagenesis for functional genomics in rice. Plant J. 2000, 22, 561–570. [Google Scholar] [CrossRef]
- Péret, B.; Desnos, T.; Jost, R.; Kanno, S.; Berkowitz, O.; Nussaume, L. Root architecture responses: In search of phosphate. Plant Physiol. 2014, 166, 1713–1723. [Google Scholar] [CrossRef]
- Péret, B.; Clément, M.; Nussaume, L.; Desnos, T. Root developmental adaptation to phosphate starvation: Better safe than sorry. Trends Plant Sci. 2011, 16, 442–450. [Google Scholar] [CrossRef] [PubMed]
- Rouached, H.; Arpat, A.B.; Poirier, Y. Regulation of phosphate starvation responses in plants: Signaling players and cross-talks. Mol. Plant 2010, 3, 288–299. [Google Scholar] [CrossRef] [PubMed]
- Gu, M.; Chen, A.; Sun, S.; Xu, G. Complex Regulation of Plant Phosphate Transporters and the Gap between Molecular Mechanisms and Practical Application: What Is Missing? Mol. Plant 2016, 9, 396–416. [Google Scholar] [CrossRef]
- Katiyar, A.; Smita, S.; Lenka, S.K.; Rajwanshi, R.; Chinnusamy, V.; Bansal, K.C. Genome-wide classification and expression analysis of MYB transcription factor families in rice and Arabidopsis. BMC Genom. 2012, 13, 544. [Google Scholar] [CrossRef]
- Wang, Z.; Ruan, W.; Shi, J.; Zhang, L.; Xiang, D.; Yang, C.; Li, C.; Wu, Z.; Liu, Y.; Yu, Y.; et al. Rice SPX1 and SPX2 inhibit phosphate starvation responses through interacting with PHR2 in a phosphate-dependent manner. Proc. Natl. Acad. Sci. USA 2014, 111, 14953–14958. [Google Scholar] [CrossRef] [PubMed]
- Wang, C.; Ying, S.; Huang, H.; Li, K.; Wu, P.; Shou, H. Involvement of OsSPX1 in phosphate homeostasis in rice. Plant J. 2009, 57, 895–904. [Google Scholar] [CrossRef]
- Wang, C.; Huang, W.; Ying, Y.; Li, S.; Secco, D.; Tyerman, S.; Whelan, J.; Shou, H. Functional characterization of the rice SPX-MFS family reveals a key role of OsSPX-MFS1 in controlling phosphate homeostasis in leaves. New Phytol. 2012, 196, 139–148. [Google Scholar] [CrossRef]
- Ai, P.; Sun, S.; Zhao, J.; Fan, X.; Xin, W.; Guo, Q.; Yu, L.; Shen, Q.; Wu, P.; Miller, A.J.; et al. Two rice phosphate transporters, OsPht1;2 and OsPht1;6, have different functions and kinetic properties in uptake and translocation. Plant J. 2009, 57, 798–809. [Google Scholar] [CrossRef] [PubMed]
- Liu, F.; Wang, Z.; Ren, H.; Shen, C.; Li, Y.; Ling, H.Q.; Wu, C.; Lian, X.; Wu, P. OsSPX1 suppresses the function of OsPHR2 in the regulation of expression of OsPT2 and phosphate homeostasis in shoots of rice. Plant J. 2010, 62, 508–517. [Google Scholar] [CrossRef] [PubMed]


Disclaimer/Publisher’s Note: The statements, opinions and data contained in all publications are solely those of the individual author(s) and contributor(s) and not of MDPI and/or the editor(s). MDPI and/or the editor(s) disclaim responsibility for any injury to people or property resulting from any ideas, methods, instructions or products referred to in the content. |
© 2024 by the authors. Licensee MDPI, Basel, Switzerland. This article is an open access article distributed under the terms and conditions of the Creative Commons Attribution (CC BY) license (https://creativecommons.org/licenses/by/4.0/).
Share and Cite
Baek, D.; Hong, S.; Kim, H.J.; Moon, S.; Jung, K.H.; Yang, W.T.; Kim, D.H. OsMYB58 Negatively Regulates Plant Growth and Development by Regulating Phosphate Homeostasis. Int. J. Mol. Sci. 2024, 25, 2209. https://doi.org/10.3390/ijms25042209
Baek D, Hong S, Kim HJ, Moon S, Jung KH, Yang WT, Kim DH. OsMYB58 Negatively Regulates Plant Growth and Development by Regulating Phosphate Homeostasis. International Journal of Molecular Sciences. 2024; 25(4):2209. https://doi.org/10.3390/ijms25042209
Chicago/Turabian StyleBaek, Dongwon, Soyeon Hong, Hye Jeong Kim, Sunok Moon, Ki Hong Jung, Won Tae Yang, and Doh Hoon Kim. 2024. "OsMYB58 Negatively Regulates Plant Growth and Development by Regulating Phosphate Homeostasis" International Journal of Molecular Sciences 25, no. 4: 2209. https://doi.org/10.3390/ijms25042209