Article

Prognostic Value of Gut Microbiome for Conversion from Mild Cognitive Impairment to Alzheimer’s Disease Dementia within 4 Years: Results from the AlzBiom Study

1
Section for Dementia Research, Hertie Institute for Clinical Brain Research, Department of Psychiatry and Psychotherapy, University of Tübingen, 72076 Tübingen, Germany
2
Department of Psychiatry and Psychotherapy, University of Tübingen, 72076 Tübingen, Germany
3
German Center for Neurodegenerative Diseases (DZNE), 72076 Tübingen, Germany
4
Department of Biology, Technische Universität Darmstadt, 64277 Darmstadt, Germany
5
SYNLAB MVZ Leinfelden-Echterdingen GmbH, Labor Dr. Bayer, 70771 Leinfelden-Echterdingen, Germany
6
Institute of Medical Microbiology and Hygiene, University of Tübingen, 72076 Tübingen, Germany
*
Authors to whom correspondence should be addressed.
Int. J. Mol. Sci. 2024, 25(3), 1906; https://doi.org/10.3390/ijms25031906
Submission received: 14 December 2023 / Revised: 26 January 2024 / Accepted: 27 January 2024 / Published: 5 February 2024

Abstract

:
Alterations in the gut microbiome are associated with the pathogenesis of Alzheimer’s disease (AD) and can be used as a diagnostic measure. However, longitudinal data of the gut microbiome and knowledge about its prognostic significance for the development and progression of AD are limited. The aim of the present study was to develop a reliable predictive model based on gut microbiome data for AD development. In this longitudinal study, we investigated the intestinal microbiome in 49 mild cognitive impairment (MCI) patients over a mean (SD) follow-up of 3.7 (0.6) years, using shotgun metagenomics. At the end of the 4-year follow-up (4yFU), 27 MCI patients converted to AD dementia and 22 MCI patients remained stable. The best taxonomic model for the discrimination of AD dementia converters from stable MCI patients included 24 genera, yielding an area under the receiver operating characteristic curve (AUROC) of 0.87 at BL, 0.92 at 1yFU and 0.95 at 4yFU. The best models with functional data were obtained via analyzing 25 GO (Gene Ontology) features with an AUROC of 0.87 at BL, 0.85 at 1yFU and 0.81 at 4yFU and 33 KO [Kyoto Encyclopedia of Genes and Genomes (KEGG) ortholog] features with an AUROC of 0.79 at BL, 0.88 at 1yFU and 0.82 at 4yFU. Using ensemble learning for these three models, including a clinical model with the four parameters of age, gender, body mass index (BMI) and Apolipoprotein E (ApoE) genotype, yielded an AUROC of 0.96 at BL, 0.96 at 1yFU and 0.97 at 4yFU. In conclusion, we identified novel and timely stable gut microbiome algorithms that accurately predict progression to AD dementia in individuals with MCI over a 4yFU period.

Graphical Abstract

1. Introduction

Mild cognitive impairment (MCI) is a common syndrome in elderly people, representing an intermediate clinical stage between the expected cognitive decline of normal aging and early features of dementia [1]. Longitudinal studies provide evidence for different patterns of progression of MCI patients, ranging from the development of Alzheimer’s disease (AD) dementia to the stabilization or even reversion of cognitive impairment [2]. In clinical practice, a combination of clinical, neuropsychological, biochemical and multimodal neuroimaging findings offers, at the MCI stage, substantial information on underlying pathologies, allowing for an early recognition of prodromal AD individuals. Early detection of MCI individuals at high risk for conversion to AD dementia is crucial for administering targeted early intervention and preventing cognitive decline. AD is the most common cause of dementia in the elderly. The neuropathology of AD is characterized by the accumulation of β amyloid (Aβ) plaques and tau-containing neurofibrillary tangles (NFTs), cortical atrophy and neuroinflammation including altered microglia function in the brain [3]. In particular, the mechanisms triggering these inflammatory changes in the brain are elusive.
A growing body of evidence suggests that the gut microbiome is linked to the pathogenesis of AD. Studies examining several animal models of AD have found altered gut microbiome composition—even before the presence of amyloid plaques in the brain and thus already at a very early stage of AD pathogenesis [4]. Gut bacteria seem to influence the development of AD pathology in the brain. Germ-free animal models of AD develop less amyloid and tau pathology in the brain compared to animal models of AD with an existing or replaced intestinal microbiome [5,6,7,8]. In addition, the transfer of healthy intestinal microbiota reduces plaque and the tangle load, ameliorates reactive glia and improves cognition [9]. These findings indicate that restoring gut microbial homeostasis may have beneficial effects on AD treatment. Human studies have also demonstrated altered gut microbiome composition in AD patients [10,11,12,13,14], in MCI patients [11,12] and even in individuals with preclinical AD [15]. Some of these studies indicate that the gut microbiome could be used as a diagnostic biomarker for the detection of AD patients [11,12,13,14,15]. However, longitudinal data of the gut microbiome and knowledge about its prognostic significance for the development and progression of AD are limited.
The aim of the present longitudinal study was to examine the predictive power of taxonomic and functional intestinal microbiome data and their combination with clinical data for conversion from MCI to AD dementia within 4yFU.

2. Results

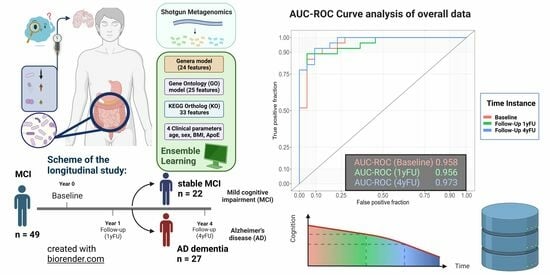
2.1. Discriminatory Ability of the Gut Microbiome between Stable MCI Patients and AD Dementia Converters

The clinical and demographic characteristics of the study sample are presented in Table 1, showing no significant differences in the clinical and demographic characteristics at baseline between stable MCI patients and AD dementia converters. As expected, AD dementia converters showed significantly lower MMSE values at 1yFU (p = 0.0108) and 4yFU (p < 0.0001) compared with stable MCI patients.
In order to evaluate whether the clinical or gut microbiome parameters were valid to predict conversion from MCI to AD dementia, we determined different logistic regression models and investigated their discriminatory potential using ROC analysis. The clinical model including age, gender, BMI and ApoE genotype yielded an area under the receiver operating characteristic curve (AUROC) of 0.69 at BL, 0.71 at 1yFU and 0.68 at 4yFU (Figure 1A).
The best taxonomic model for the discrimination of AD dementia converters from stable MCI patients included 24 genera, yielding an AUROC of 0.87 at BL, 0.92 at 1yFU and 0.95 at 4yFU (Figure 1B). The 24 genera included in the genera model are listed in Table 2.
The best models with functional data were obtained via analyzing 25 GO (Gene Ontology) features with an AUROC of 0.87 at BL, 0.85 at 1yFU and 0.81 at 4yFU (Figure 1C) and 33 KO (Kyoto Encyclopedia of Genes and Genomes [KEGG] ortholog) features with an AUROC of 0.79 at BL, 0.88 at 1yFU and 0.82 at 4yFU (Figure 1D).
The 33 KO features included in the KO model are listed in Table 3, and the 25 features included in the GO model are listed in Table 4.
Using ensemble learning for these three models, including a clinical model with the four parameters of age, gender, body mass index (BMI) and Apolipoprotein E (ApoE) genotype, yielded an AUROC of 0.96 at BL, 0.96 at 1yFU and 0.97 at 4yFU (Figure 2).

2.2. Longitudinal Development of Gut Microbiome

The longitudinal development (baseline, 1yFU, 4yFU) of the three most abundant features included in the models is depicted in Figure 3A–C. Within the genera model, including 24 features, the three most abundant genera in all participants at baseline are Clostridium (59.6%), Mediterranea (17.2%) and Erysipelatoclostridium (14.7%), accounting for 91.5% of all genera at baseline (Figure 3A).
Within the GO model, including 25 features, the three most abundant features in all participants at baseline are Phosphopyruvate hydratase activity (GO.0004634; 21.6%), cell surface binding (GO.0009986; 21.1%) and Acetyl-CoA metabolic process (GO.0006084; 19.4%), accounting for 62.1% of all features at baseline (Figure 3B).
Within the KO model, including 33 features, the three most abundant features in all participants at baseline are Guanosine monophosphate (GMP) synthase (K01951; 23.4%), Chorismate synthase (K01736; 13.5%) and ATP phosphoribosyltransferase (K00765; 12.0%), accounting for 48.9% of all features at baseline (Figure 3C).

3. Discussion

In the present study, we investigated the predictive power of taxonomic and functional intestinal microbiome data and their combination with clinical data for conversion from MCI to AD dementia within 4yFU. Within the taxonomic data, we identified a genera model with 24 features and within the functional data, we identified a GO model with 25 features and a KO model with 33 features showing the best results for the discrimination of AD dementia converters from stable MCI patients. These findings indicate that alterations in the bacterial taxa on a community level rather than single bacterial taxa and changes in functional networks rather than single functional parameters may be associated with AD dementia development in MCI patients.
The key idea of the present longitudinal study was to focus on the stability of model features over time, as the number of possible predictive models that could be developed for gut microbiome features is limitless and would have highly variable feature sets. This approach provided a limited set of trait biomarker candidates, which are stable over time in the examined cohort, as indicated by a stable predictive power of the models at all three time points. As a potential advantage of timely stable gut microbiome models, they could be used at a larger frame of disease development. A recent study has also identified a stable gut microbiome pattern in patients with Parkinson’s disease (PD) and in healthy controls over a period of 14 months [17].
In a next step, we compared the discriminatory ability of the different models used in the present study. We found that the taxonomic data worked comparably well like the functional data at baseline and slightly better at 1yFU and 4yFU. Any of the three examined microbiome models performed better than the clinical model with the 4 parameters: age, gender, BMI and ApoE. Finally, we were interested to examine if a combination of the genera model with the two functional models and the clinical model using an ensemble-learning approach provides superior discriminability compared to the included singular models. The ensemble model performed better than any of its included models separately at all three time points. Compared to the prognostic accuracy of the clinical model alone, the additional analysis of the microbiome data increased the prognostic accuracy by about 0.3 points at all three time points, underlining that the gut microbiome represents an innovative and meaningful prognostic supplement in AD.
When looking more specifically at the identified features of the taxonomic and functional models, it is convincing that these features may enhance the prognostic accuracy for conversion from MCI to AD dementia as previous studies have already linked some of them to the pathogenesis of AD [12,14,18,19]. In our genera model, 22 of the 24 taxa (91.7%) belong to the same 4 phyla: Pseudomonadota (formerly synonym Proteobacteria), Bacteroidota (formerly synonym Bacteroidetes), Actinomycetota (formerly synonym Actinobacteria) and Bacillota (formerly synonym Firmicutes). Six of the twenty-four taxa (25.0%) in our genera model belong to the phylum Pseudomonadota with significantly increased levels of Teredinibacter in AD dementia converters. The potential meaning of Pseudomonadota in AD has also already been shown in our previous study, where 62.5% of taxa with higher levels in AD patients compared to the healthy controls belonged to the phylum Pseudomonadota [14]. In addition, a second study found increased Pseudomonadota levels in AD patients, correlating with the severity of cognitive impairment [12]. Six of the twenty-four taxa (25.0%) in our genera model belong to the phylum Bacteroidota with significantly increased levels of Filimonas and decreased levels of Alkaliflexus and Geofilum in AD dementia converters. Bacteroidota and Pseudomonadota are Gram-negative bacteria, and lipopolysaccharides (LPS) on their surface can induce the activation of macrophages toward a pro-inflammatory phenotype [20,21]. In line with this, Bacteroidota and Pseudomonadota have been associated with several inflammatory intestinal and extra-intestinal diseases [20,22]. Inflammatory processes including altered microglia function in the brain play an important role in the pathogenesis of AD [23,24]. Therefore, gut microbial dysbiosis with up-regulation of pro-inflammatory bacteria such as Bacteroidota and Pseudomonadota could trigger these inflammatory changes and thus enhance conversion from MCI to AD dementia. In addition, Bacteroidota are a major producer of propionate, a short-chain fatty acid (SCFA) in the gut [25], which has been demonstrated to induce amyloid and tau pathology in animal models of AD [8,26]. Six of the twenty-four taxa (25.0%) in our genera model belong to the phylum Actinomycetota. Actinomycetota are Gram-positive bacteria and decreased levels have been described in AD patients [10]. Furthermore, Actinomycetota was the most abundant bacterial phylum in postmortem AD brain samples [18]. Four of the twenty-four taxa (16.7%) in our genera model belong to the phylum Bacillota with significantly increased levels of Erysipelatoclostridium in AD dementia converters. Erysipelatoclostridium belongs to the phylum Bacillota and is involved in the absorption of polyphenolic compounds in the gut [27]. A recent study showed a lower abundance of Erysipelatoclostridium in AD patients compared to normal controls [19]. In addition, a higher abundance of Erysipelatoclostridium in the gut has been described to be associated with better cognitive function in APP/PS1 mice [28] and with lower serum levels of phosphorylated tau (pTau)181 and glial fibrillary acidic protein (GFAP) in human AD patients [29]. Our findings of increased levels of Erysipelato clostridium in AD dementia converters could indicate a compensatory upregulation of this potential beneficial genus in the early development of AD.
Among the 33 features included in the KO model for discrimination between AD dementia converters and stable MCI patients, there were 7 mediators (K02474, K00765, K03270, K01923, K01736, K05350, K00281) producing different metabolites such as nucleotide sugars, amino acids and lipopolysaccharides. AD dementia converters showed significantly increased levels of K02474 and K00281, associated with amino sugar and nucleotide sugar metabolism and amino acid metabolism. The KO model included six mediators (K02405, K03408, K00575, K07718, K02398, K07814) of the two-component signal transduction system, connecting the input stimuli to the biofilm formation of bacteria [30]. AD dementia converters showed decreased levels of K07814. Biofilms are defined as microbes that are encapsulated in an extracellular, self-produced, biofilm matrix consisting, e.g., of functional amyloid or amyloid-like fibers, such as the amyloid curli [31]. Studies have shown that the immune system recognizes both bacterial amyloid curli and human amyloids through the same receptors, inducing inflammatory processes [32]. Recent work indicates that curli can participate in the self-assembly process of pathological human amyloids, which might also trigger amyloid pathology in AD [33]. Also, the four mediators (K02405, K02396, K02387, K02398) of flagellar assembly have been shown to be associated with directed bacterial mobility (chemotaxis). In addition, the KO model included three ATP-binding cassette (ABC) transporters (K17235, K02041, K02065), mediating the transport of arabino-oligosaccharide (AOS), phosphonate and phospholipid/cholesterol/gamma-HCH across the cellular lipid membranes in the brain parenchyma and especially at the blood–brain barrier (BBB). In line with this finding, ABC transporters have been described as key players in AD [34].
Among the 25 features included in the GO model for discrimination between AD dementia converters and stable MCI patients, there were 5 mediators (GO.0047536, GO.0016041, GO.0010133, GO.0003842, GO.0004657) associated with glutamate metabolism. Two of these five mediators (GO.0047536 and GO.0004657) showed significantly increased levels in AD dementia converters. Glutamate is the most abundant excitatory neurotransmitter in the mammalian central nervous system (CNS) and glutamate-mediated neurotoxicity has been implicated in the pathogenesis of AD [35].
This study has potential limitations. Firstly, this is a pilot study with a limited number of samples. The promising results should be replicated in a larger longitudinal follow-up study. Secondly, the follow-up measurements were performed after one and four years, but not after two and three years. Thirdly, no cerebrospinal fluid (CSF) was available in the study participants; therefore, we could not analyze the association between the gut microbiome and AD biomarkers in the CSF.
In conclusion, we identified novel gut microbiome algorithms able to accurately predict progression to AD dementia in individuals with MCI over a 4-year follow-up. The baseline models retained their predictive power at all three time points within 4 years, indicating that the identified gut microbiome signatures for AD development are stable over time. Combining the taxonomic, functional and clinical models yielded the best discriminatory ability between the two groups. The gut microbiome represents an innovative prognostic supplement and a promising area for the identification of new targets and for developing novel interventions against AD.

4. Materials and Methods

4.1. Participants

In the present study, we investigated the intestinal microbiome in 49 MCI patients participating at the AlzBiom study over a mean (SD) follow-up of 3.7 (0.6) years (Table 1). AlzBiom is an observational longitudinal study examining the intestinal microbiome at different stages of AD and in healthy controls and is performed in the Section for Dementia Research at the Department of Psychiatry and Psychotherapy in Tübingen [14]. All participants were examined at BL, at 1yFU (1.2 ± 0.2 years) and at 4yFU (3.7 ± 0.6 years). All participants underwent mini-mental state examination (MMSE) scoring [36] and clinical assessment of cognitive status by means of the Clinical Dementia Rating (CDR) scale [37,38]. Nutrition was assessed by using a Mediterranean diet score [16]. At the end of the 4yFU, 27 MCI patients converted to AD dementia and 22 MCI patients remained stable.
Patients with MCI were recruited from the Memory Clinic of the Department of Psychiatry and Psychotherapy at the University Hospital of Tübingen. All subjects underwent diagnostic work-up for dementia including physical, neurological and psychiatric examinations as well as brain imaging. According to current criteria, patients with MCI revealed cognitive deficits (corroborated by an informant) that did not interfere with activities of daily living and the absence of dementia [39,40]. MCI patients had a global CDR score of 0.5 and reported preserved function of daily living. AD patients fulfilled the NIA-AA core clinical criteria for probable AD dementia [41], had a global CDR score of ≥1.0 and impaired function of daily living. HCs had a global CDR score of 0 and reported preserved function of daily living.
The regional ethical committee approved the study and written informed consent was obtained from each individual.

4.2. Determination of Apolipoprotein E (ApoE) Genotype

The procedure for determining the Apolipoprotein E (ApoE) genotype was performed as previously described [42]. The ApoE ε4 positive genotype was assigned if at least one ε4 allele was present.

4.3. Stool Collection, DNA Extraction and Shotgun Metagenomic Sequencing

Stool samples were collected in a sterile plastic device (Commode Specimen Collection System, Thermo Fisher Scientific, Pittsburgh, PA, USA) using the DNA/RNA Shield Fecal Collection Tube R1101 (Zymo Research, Irvine, CA, USA) and immediately sent to our laboratory via post. Samples were stored at −20 °C and DNA was extracted on the same day using ZymoBiomics DNA Miniprep Kit D4300 (Zymo Research, Irvine, CA, USA). Shotgun metagenomic sequencing was carried out at Eurofins Genomics Germany GmbH (Konstanz, Germany) using the NEBNext Ultra DNA Library kit (New England Biolabs, Ipswich, MA, USA) for DNA library preparation and an Illumina HiSeq platform for sequencing. A paired-end sequencing approach with a targeted read length of 150 bp and an insert size of 550 bp was conducted. We aimed for a median sequencing depth of 40–50 million reads per sample.

4.4. Metagenomic Assembly

Trimmomatic (version 0.35) was used to acquire high-quality reads through adapter removing and through a sliding window trimming [43]. Reads were trimmed to a minimum length of 100 bp. Quality control of trimmed reads was performed with FastQC version 0.11.5 (https://www.bioinformatics.babraham.ac.uk/projects/fastqc/; accessed on 6 March 2023). We used SPAdes (version 3.9.0) to assemble metagenomic scaffolds with a minimum length of 1000 bp to ensure high-quality profiling [33].

4.5. Taxonomic Profiling

The host removal was performed using Kraken [44]. Taxonomic profiling was performed using MetaPhlAn (Metagenomic Phylogenetic Analysis) [45]. Read counts of input samples observed at taxa levels were collected and normalized by using the rarefy function implemented in the vegan bioconductor package (version 2.6-4) [46] to compare species richness from all samples in the analysis run. For our three metagenomic datasets, we achieved a median depth of 19,407,200 reads per sample (baseline), 30,486,200 reads per sample (follow-up 1) and 28,669,500 reads per sample (follow-up 2).

4.6. Functional Profiling

Functional profiling was performed using HUMAnN (the HMP Unified Metabolic Analysis Network) [47]. According to OUT and Phylogenetic Investigation of Communities by Reconstruction of Unobserved States (PICRUSt) [48], we identified the functional categories based on a comparison of the Kyoto Encyclopedia of Genes and Genomes (KEGG) ortholog (KO) (https://www.genome.jp/kegg/pathway.html; accessed on 6 March 2023) and of the Gene Ontology (GO) Resource (http://geneontology.org/; accessed on 6 March 2023).

4.7. Statistical Analysis

The statistical software package SPSS (version 23) was used for the analysis of demographic and clinical data. For all tests, we used the threshold of p < 0.05 for statistical significance. Levene’s test was used to proof the homogeneity of variances. T-tests for independent samples were used in case of continuous variables (i.e., age and BMI). The nonparametric Mann–Whitney U-test was conducted for the analysis of the MMSE and geriatric depression scale (GDS). The Pearson chi-square test was used for gender distribution, ApoE status and medication.
As features, we investigated taxonomic data (genera), functional data (KO and GO) and clinical meta data (age, gender, BMI, ApoE). Age, gender, BMI loss and ApoE are well-established risk factors for late-onset AD [49,50] and are also influencing gut microbiome composition [51,52,53]. Therefore, we decided to use an additional clinical model including these 4 parameters. Our aim was to find a predictive model for the outcomes based on feature abundances. As taxonomic and functional profiling of data from shotgun sequencing potentially results in many features, the first aim after a normalization step was to reduce the number of features. For that, we applied an ANOVA type statistic (ATS) [54]. The calculation was performed in R using the nparLD package (version 2.2) [55]. Here, the data from all three time instances were entered in the analysis. Taking the p-values from this test for sieving purposes, we were able to reduce the feature count to an appropriate number of about 30 features per model. With the outcomes and after suitable renormalization, we calculated the balances of the feature compositions at baseline and trained a logistic regression model. Best baseline models (Genera, KO, GO and clinical meta data) were then applied to the data from 1yFU and 4YFU using a logistic regression approach. Receiver operating characteristic (ROC) analysis was performed to examine the discriminatory ability of the intestinal microbiome among both groups. The longitudinal development (baseline, FU1, FU2) of the three most abundant features included in all models are shown using spaghetti plots. Finally, we joined the best performing models in an ensemble-learning model, as recently described [14]. This ensemble model was trained with baseline data and subsequently applied to data from 1yFU and 4YFU.
Data analysis was performed using customized R scripts and HeidiSQL (1.3) in connection with RMariaDB (1.1.1). The model training and its feature selection was coded in R scripts relying on mlr (2.18.0) package [56]. ROC curves were calculated employing OptimalCutpoints (1.1-4) and plotted with ggplot2 (3.3.5).

Author Contributions

C.L. is responsible for the study concept and design. C.L., I.H., S.M., M.W., S.P. and U.S. participated in the acquisition, analysis or interpretation of data, and in the critical revision of the manuscript. M.H.J.M. was involved in the manuscript revision. C.L. drafted the manuscript. U.S. performed the statistical analysis. All authors have read and agreed to the published version of the manuscript.

Funding

This study was supported in part by an AKF-Grant (374-1-0) from the University of Tübingen, a grant from the Forum Gesundheitsstandort BW (AZ: 32-5400/58/3) and by a grant from the Faber Foundation (D3030814) to C.L. We acknowledge support from the Open Access Publication Fund of the University of Tübingen.

Institutional Review Board Statement

This study was conducted in accordance with the Declaration of Helsinki, and approved by the Ethics Committee of the Medical Faculty of Eberhard-Karls-University and University Hospital Tübingen (protocol code 721/2015BO2, 07.08.2019).

Informed Consent Statement

Informed consent was obtained from all subjects involved in this study.

Data Availability Statement

The data sets presented in this study can be found at https://www.ebi.ac.uk/ena (accessed on 30 January 24), PRJEB72198.

Acknowledgments

We thank Viola Ueltzhöffer for the technical support of the study and Georgy Berezhnoy for creating the graphical abstract.

Conflicts of Interest

The authors declare no conflict of interest.

References

  1. Albert, M.S.; DeKosky, S.T.; Dickson, D.; Dubois, B.; Feldman, H.H.; Fox, N.C.; Gamst, A.; Holtzman, D.M.; Jagust, W.J.; Petersen, R.C.; et al. The diagnosis of mild cognitive impairment due to Alzheimer’s disease: Recommendations from the National Institute on Aging-Alzheimer’s Association workgroups on diagnostic guidelines for Alzheimer’s disease. Alzheimers Dement. 2011, 7, 270–279. [Google Scholar] [CrossRef] [PubMed]
  2. Mitchell, A.J.; Shiri-Feshki, M. Rate of progression of mild cognitive impairment to dementia--meta-analysis of 41 robust inception cohort studies. Acta Psychiatr. Scand. 2009, 119, 252–265. [Google Scholar] [CrossRef] [PubMed]
  3. Querfurth, H.W.; LaFerla, F.M. Alzheimer’s disease. N. Engl. J. Med. 2010, 362, 329–344. [Google Scholar] [CrossRef] [PubMed]
  4. Chen, Y.; Fang, L.; Chen, S.; Zhou, H.; Fan, Y.; Lin, L.; Li, J.; Xu, J.; Chen, Y.; Ma, Y.; et al. Gut Microbiome Alterations Precede Cerebral Amyloidosis and Microglial Pathology in a Mouse Model of Alzheimer’s Disease. BioMed Res. Int. 2020, 8456596. [Google Scholar] [CrossRef] [PubMed]
  5. Harach, T.; Marungruang, N.; Duthilleul, N.; Cheatham, V.; Mc Coy, K.D.; Frisoni, G.; Neher, J.J.; Fåk, F.; Jucker, M.; Lasser, T.; et al. Reduction of Abeta amyloid pathology in APPPS1 transgenic mice in the absence of gut microbiota. Sci. Rep. 2017, 7, 41802. [Google Scholar] [CrossRef] [PubMed]
  6. Dodiya, H.B.; Kuntz, T.; Shaik, S.M.; Baufeld, C.; Leibowitz, J.; Zhang, X.; Gottel, N.; Zhang, X.; Butovsky, O.; Gilbert, J.A.; et al. Sex-specific effects of microbiome perturbations on cerebral Aβ amyloidosis and microglia phenotypes. J. Exp. Med. 2019, 216, 1542–1560. [Google Scholar] [CrossRef]
  7. Dodiya, H.B.; Frith, M.; Sidebottom, A.; Cao, Y.; Koval, J.; Chang, E.; Sisodia, S.S. Synergistic depletion of gut microbial consortia, but not individual antibiotics, reduces amyloidosis in APPPS1-21 Alzheimer’s transgenic mice. Sci. Rep. 2020, 10, 8183. [Google Scholar] [CrossRef]
  8. Seo, D.O.; O’Donnell, D.; Jain, N.; Ulrich, J.D.; Herz, J.; Li, Y.; Lemieux, M.; Cheng, J.; Hu, H.; Serrano, J.R.; et al. ApoE isoform- and microbiota-dependent progression of neurodegeneration in a mouse model of tauopathy. Science 2023, 379, eadd1236. [Google Scholar] [CrossRef]
  9. Kim, M.S.; Kim, Y.; Choi, H.; Kim, W.; Park, S.; Lee, D.; Kim, D.K.; Kim, H.J.; Choi, H.; Hyun, D.W.; et al. Transfer of a healthy microbiota reduces amyloid and tau pathology in an Alzheimer’s disease animal model. Gut 2020, 69, 283–294. [Google Scholar] [CrossRef]
  10. Vogt, N.M.; Kerby, R.L.; Dill-McFarland, K.A.; Harding, S.J.; Merluzzi, A.P.; Johnson, S.C.; Carlsson, C.M.; Asthana, S.; Zetterberg, H.; Blennow, K.; et al. Gut microbiome alterations in Alzheimer’s disease. Sci. Rep. 2017, 7, 13537. [Google Scholar] [CrossRef]
  11. Li, B.; He, Y.; Ma, J.; Huang, P.; Du, J.; Cao, L.; Wang, Y.; Xiao, Q.; Tang, H.; Chen, S. Mild cognitive impairment has similar alterations as Alzheimer’s disease in gut microbiota. Alzheimers Dement. 2019, 15, 1357–1366. [Google Scholar] [CrossRef] [PubMed]
  12. Liu, P.; Wu, L.; Peng, G.; Han, Y.; Tang, R.; Ge, J.; Zhang, L.; Jia, L.; Yue, S.; Zhou, K.; et al. Altered microbiomes distinguish Alzheimer’s disease from amnestic mild cognitive impairment and health in a Chinese cohort. Brain Behav. Immun. 2019, 80, 633–643. [Google Scholar] [CrossRef]
  13. Ling, Z.; Zhu, M.; Yan, X.; Cheng, Y.; Shao, L.; Liu, X.; Jiang, R.; Wu, S. Structural and Functional Dysbiosis of Fecal Microbiota in Chinese Patients with Alzheimer’s Disease. Front. Cell Dev. Biol. 2020, 8, 634069. [Google Scholar] [CrossRef] [PubMed]
  14. Laske, C.; Müller, S.; Preische, O.; Ruschil, V.; Munk, M.H.J.; Honold, I.; Peter, S.; Schoppmeier, U.; Willmann, M. Signature of Alzheimer’s Disease in Intestinal Microbiome: Results from the AlzBiom Study. Front. Neurosci. 2022, 16, 792996. [Google Scholar] [CrossRef]
  15. Ferreiro, A.L.; Choi, J.; Ryou, J.; Newcomer, E.P.; Thompson, R.; Bollinger, R.M.; Hall-Moore, C.; Ndao, I.M.; Sax, L.; Benzinger, T.L.S.; et al. Gut microbiome composition may be an indicator of preclinical Alzheimer’s disease. Sci. Transl. Med. 2023, 15, eabo2984. [Google Scholar] [CrossRef] [PubMed]
  16. Panagiotakos, D.B.; Pitsavos, C.; Stefanadis, C. Dietary patterns: A Mediterranean diet score and its relation to clinical and biological markers of cardiovascular disease risk. Nutr. Metab. Cardiovasc. Dis. 2006, 16, 559–568. [Google Scholar] [CrossRef] [PubMed]
  17. Cerroni, R.; Pietrucci, D.; Teofani, A.; Chillemi, G.; Liguori, C.; Pierantozzi, M.; Unida, V.; Selmani, S.; Mercuri, N.B.; Stefani, A. Not just a Snapshot: An Italian Longitudinal Evaluation of Stability of Gut Microbiota Findings in Parkinson’s Disease. Brain Sci. 2022, 12, 739. [Google Scholar] [CrossRef] [PubMed]
  18. Emery, D.C.; Shoemark, D.K.; Batstone, T.E.; Waterfall, C.M.; Coghill, J.A.; Cerajewska, T.L.; Davies, M.; West, N.X.; Allen, S.J. 16S rRNA Next Generation Sequencing Analysis Shows Bacteria in Alzheimer’s Post-Mortem Brain. Front. Aging Neurosci. 2017, 9, 195. [Google Scholar] [CrossRef]
  19. Xi, J.; Ding, D.; Zhu, H.; Wang, R.; Su, F.; Wu, W.; Xiao, Z.; Liang, X.; Zhao, Q.; Hong, Z.; et al. Disturbed microbial ecology in Alzheimer’s disease: Evidence from the gut microbiota and fecal metabolome. BMC Microbiol. 2021, 21, 226. [Google Scholar] [CrossRef]
  20. Stojanov, S.; Berlec, A.; Štrukelj, B. The Influence of Probiotics on the Firmicutes/Bacteroidetes Ratio in the Treatment of Obesity and Inflammatory Bowel disease. Microorganisms 2020, 8, 1715. [Google Scholar] [CrossRef]
  21. Wang, J.; Chen, W.D.; Wang, Y.D. The Relationship Between Gut Microbiota and Inflammatory Diseases: The Role of Macrophages. Front. Microbiol. 2020, 11, 1065. [Google Scholar] [CrossRef]
  22. Rizzatti, G.; Lopetuso, L.R.; Gibiino, G.; Binda, C.; Gasbarrini, A. Proteobacteria: A Common Factor in Human Diseases. BioMed Res. Int. 2017, 2017, 9351507. [Google Scholar] [CrossRef]
  23. McGeer, P.L.; McGeer, E.G. The inflammatory response system of brain: Implications for therapy of Alzheimer and other neurodegenerative diseases. Brain Res. Brain Res. Rev. 1995, 21, 195–218. [Google Scholar] [CrossRef]
  24. Wyss-Coray, T. Inflammation in Alzheimer disease: Driving force, bystander or beneficial response? Nat. Med. 2006, 12, 1005–1015. [Google Scholar] [PubMed]
  25. Louis, P.; Flint, H.J. Formation of propionate and butyrate by the human colonic microbiota. Environ. Microbiol. 2017, 19, 29–41. [Google Scholar] [CrossRef] [PubMed]
  26. Colombo, A.V.; Sadler, R.K.; Llovera, G.; Singh, V.; Roth, S.; Heindl, S.; Sebastian Monasor, L.; Verhoeven, A.; Peters, F.; Parhizkar, S.; et al. Microbiota-derived short chain fatty acids modulate microglia and promote Aβ plaque deposition. eLife 2021, 10, 59826. [Google Scholar] [CrossRef] [PubMed]
  27. Senizza, A.; Rocchetti, G.; Mosele, J.I.; Patrone, V.; Callegari, M.L.; Morelli, L.; Lucini, L. Lignans and Gut Microbiota: An Interplay Revealing Potential Health Implications. Molecules 2020, 25, 5709. [Google Scholar] [CrossRef] [PubMed]
  28. Liu, J.; Yu, C.; Li, R.; Liu, K.; Jin, G.; Ge, R.; Tang, F.; Cui, S. High-altitude Tibetan fermented milk ameliorated cognitive dysfunction by modified gut microbiota in Alzheimer’s disease transgenic mice. Food Funct. 2020, 11, 5308–5319. [Google Scholar] [CrossRef]
  29. Suhocki, P.V.; Ronald, J.S.; Diehl, A.M.E.; Murdoch, D.M.; Doraiswamy, P.M. Probing gut-brain links in Alzheimer’s disease with rifaximin. Alzheimers Dement. 2022, 8, e12225. [Google Scholar] [CrossRef]
  30. Liu, C.; Sun, D.; Zhu, J.; Liu, W. Two-Component Signal Transduction Systems: A Major Strategy for Connecting Input Stimuli to Biofilm Formation. Front. Microbiol. 2018, 9, 3279. [Google Scholar] [CrossRef]
  31. Erskine, E.; MacPhee, C.E.; Stanley-Wall, N.R. Functional Amyloid and Other Protein Fibers in the Biofilm Matrix. J. Mol. Biol. 2018, 430, 3642–3656. [Google Scholar] [CrossRef] [PubMed]
  32. Tükel, C.; Wilson, R.P.; Nishimori, J.H.; Pezeshki, M.; Chromy, B.A.; Bäumler, A.J. Responses to amyloids of microbial and host origin are mediated through toll-like receptor 2. Cell Host Microbe 2009, 6, 45–53. [Google Scholar] [CrossRef] [PubMed]
  33. Miller, A.L.; Bessho, S.; Grando, K.; Tükel, Ç. Microbiome or Infections: Amyloid-Containing Biofilms as a Trigger for Complex Human Diseases. Front. Immunol. 2021, 12, 638867. [Google Scholar] [CrossRef] [PubMed]
  34. Pereira, C.D.; Martins, F.; Wiltfang, J.; da Cruz, E.S.O.A.B.; Rebelo, S. ABC Transporters Are Key Players in Alzheimer’s Disease. J. Alzheimers Dis. 2018, 61, 463–485. [Google Scholar] [CrossRef] [PubMed]
  35. Conway, M.E. Alzheimer’s disease: Targeting the glutamatergic system. Biogerontology 2020, 21, 257–274. [Google Scholar] [CrossRef] [PubMed]
  36. Folstein, M.F.; Folstein, S.E.; McHugh, P.R. “Mini-mental state”. A practical method for grading the cognitive state of patients for the clinician. J. Psychiatr. Res. 1975, 12, 189–198. [Google Scholar] [CrossRef]
  37. Morris, J.C. The Clinical Dementia Rating (CDR): Current version and scoring rules. Neurology 1993, 43, 2412–2414. [Google Scholar] [CrossRef]
  38. Morris, J.C. Clinical dementia rating: A reliable and valid diagnostic and staging measure for dementia of the Alzheimer type. Int. Psychogeriatr. 1997, 9 (Suppl. S1), 173–176; discussion 177–178. [Google Scholar] [CrossRef]
  39. Petersen, R.C. Mild cognitive impairment as a diagnostic entity. J. Intern. Med. 2004, 256, 183–194. [Google Scholar] [CrossRef]
  40. Negash, S.; Geda, Y.E.; Petersen, R.C. Neuropsychological characterization of mild cognitive impairment. Handb. Clin. Neurol. 2008, 88, 499–509. [Google Scholar]
  41. McKhann, G.M.; Knopman, D.S.; Chertkow, H.; Hyman, B.T.; Jack, C.R., Jr.; Kawas, C.H.; Klunk, W.E.; Koroshetz, W.J.; Manly, J.J.; Mayeux, R.; et al. The diagnosis of dementia due to Alzheimer’s disease: Recommendations from the National Institute on Aging-Alzheimer’s Association workgroups on diagnostic guidelines for Alzheimer’s disease. Alzheimers Dement. 2011, 7, 263–269. [Google Scholar] [CrossRef] [PubMed]
  42. Operto, G.; Molinuevo, J.L.; Cacciaglia, R.; Falcon, C.; Brugulat-Serrat, A.; Suárez-Calvet, M.; Grau-Rivera, O.; Bargalló, N.; Morán, S.; Esteller, M.; et al. Interactive effect of age and APOE-ε4 allele load on white matter myelin content in cognitively normal middle-aged subjects. Neuroimage Clin. 2019, 24, 101983. [Google Scholar] [CrossRef]
  43. Bolger, A.M.; Lohse, M.; Usadel, B. Trimmomatic: A flexible trimmer for Illumina sequence data. Bioinformatics 2014, 30, 2114–2120. [Google Scholar] [CrossRef] [PubMed]
  44. Wood, D.E.; Salzberg, S.L. Kraken: Ultrafast metagenomic sequence classification using exact alignments. Genome Biol. 2014, 15, R46. [Google Scholar] [CrossRef]
  45. Truong, D.T.; Franzosa, E.A.; Tickle, T.L.; Scholz, M.; Weingart, G.; Pasolli, E.; Tett, A.; Huttenhower, C.; Segata, N. MetaPhlAn2 for enhanced metagenomic taxonomic profiling. Nat. Methods 2015, 12, 902–903. [Google Scholar] [CrossRef] [PubMed]
  46. Oksanen, J.B.F.; Simpson, G.L.; Blanchet, F.G.; Kindt, R.; Legendre, P.; Minchin, P.R.; Ohara, R.B.; Solymos, P.; Stevens, M.H.H.; Szoecs, E.; et al. vegan: Community Ecology Package. 2022. Available online: https://github.com/vegandevs/vegan (accessed on 30 January 2024).
  47. Beghini, F.; McIver, L.J.; Blanco-Míguez, A.; Dubois, L.; Asnicar, F.; Maharjan, S.; Mailyan, A.; Manghi, P.; Scholz, M.; Thomas, A.M.; et al. Integrating taxonomic, functional, and strain-level profiling of diverse microbial communities with bioBakery 3. eLife 2021, 10, 65088. [Google Scholar] [CrossRef]
  48. Langille, M.G.; Zaneveld, J.; Caporaso, J.G.; McDonald, D.; Knights, D.; Reyes, J.A.; Clemente, J.C.; Burkepile, D.E.; Vega Thurber, R.L.; Knight, R.; et al. Predictive functional profiling of microbial communities using 16S rRNA marker gene sequences. Nat. Biotechnol. 2013, 31, 814–821. [Google Scholar] [CrossRef]
  49. Riedel, B.C.; Thompson, P.M.; Brinton, R.D. Age, APOE and sex: Triad of risk of Alzheimer’s disease. J. Steroid Biochem. Mol. Biol. 2016, 160, 134–147. [Google Scholar] [CrossRef]
  50. Kang, S.Y.; Kim, Y.J.; Jang, W.; Son, K.Y.; Park, H.S.; Kim, Y.S. Body mass index trajectories and the risk for Alzheimer’s disease among older adults. Sci. Rep. 2021, 11, 3087. [Google Scholar] [CrossRef]
  51. De la Cuesta-Zuluaga, J.; Kelley, S.T.; Chen, Y.; Escobar, J.S.; Mueller, N.T.; Ley, R.E.; McDonald, D.; Huang, S.; Swafford, A.D.; Knight, R.; et al. Age- and Sex-Dependent Patterns of Gut Microbial Diversity in Human Adults. mSystems 2019, 4, 10–1128. [Google Scholar] [CrossRef]
  52. Haro, C.; Rangel-Zúñiga, O.A.; Alcalá-Díaz, J.F.; Gómez-Delgado, F.; Pérez-Martínez, P.; Delgado-Lista, J.; Quintana-Navarro, G.M.; Landa, B.B.; Navas-Cortés, J.A.; Tena-Sempere, M.; et al. Intestinal Microbiota Is Influenced by Gender and Body Mass Index. PLoS ONE 2016, 11, e0154090. [Google Scholar] [CrossRef] [PubMed]
  53. Tran, T.T.T.; Corsini, S.; Kellingray, L.; Hegarty, C.; Le Gall, G.; Narbad, A.; Müller, M.; Tejera, N.; O’Toole, P.W.; Minihane, A.M.; et al. APOE genotype influences the gut microbiome structure and function in humans and mice: Relevance for Alzheimer’s disease pathophysiology. FASEB J. 2019, 33, 8221–8231. [Google Scholar] [CrossRef] [PubMed]
  54. Brunner, E.; Bathke, A.C.; Konietschke, F. Rank and Pseudo-Rank Procedures for Independent Observations in Factorial Designs; Springer: Berlin/Heidelberg, Germany, 2019. [Google Scholar]
  55. Noguchi, K.; Gel, Y.R.; Brunner, E.; Konietschke, F. nparLD: An R Software Package for the Nonparametric Analysis of Longitudinal Data in Factorial Experiments. J. Stat. Softw. 2012, 50, 1–23. [Google Scholar] [CrossRef]
  56. Bischl, B.; Lang, M.; Kotthoff, L.; Schiffner, J.; Richter, J.; Studerus, E.; Casalicchio, G.; Jones, Z.M. mlr: Machine Learning in R. J. Mach. Learn. Res. 2016, 17, 5938–5942. [Google Scholar]
Figure 1. (AD): ROC curves for discrimination between AD dementia converters (n = 27) and stable MCI patients (n = 22) within a follow-up of 4 years at baseline, at 1yFU (Follow Up 1) and 4yFU (Follow Up 2) based on (A) a clinical model with 4 features (age, gender, BMI, ApoE); (B) a genera model with 24 features; (C) a GO model with 25 features; and (D) a KO model with 33 features.
Ijms 25 01906 g001
Figure 2. ROC curves for discrimination between AD dementia converters (n = 27) and stable MCI patients (n = 22) within a follow-up of 4 years at baseline, at 1yFU (Follow Up 1) and 4yFU (Follow Up 2) based on ensemble learning including genera model, GO model, KO model and a clinical model with 4 features (age, gender, BMI, ApoE).
Ijms 25 01906 g002
Figure 3. (AC): Spaghetti plots of the three most abundant features in AD dementia converters (n = 27) and stable MCI patients (n = 22) within a follow-up of 4 years at baseline, at 1yFU (FU1) and 4yFU (FU2) in the (A) genera model; (B) GO model; and (C) KO model.
Ijms 25 01906 g003
Table 1. Clinical and demographic characteristics of individuals with stable mild cognitive impairment (MCI) and converters from MCI to mild dementia due to Alzheimer’s disease (AD).
Stable MCIAD Dementia Convertersp-Value
Number (n)22 27
Age, years, mean (SD)70.4 (6.9)72.9 (7.7)0.2492
Gender (m/f)10/128/190.3723
MMSE at baseline, mean (SD)26.9 (1.4)26.9 (1.8)0.9569
MMSE at 1-year follow-up (1yFU), mean (SD)26.4 (1.8)24.4 (3.2)0.0108
MMSE at 4-year follow-up (4yFU), mean (SD)25.9 (1.4)20.2 (4.3)<0.0001
GDS, mean (SD)2.0 (1.6)2.4 (1.8)0.4493
Body mass index (BMI), mean (SD)25.1 (3.8)26.2 (4.7)0.3715
ApoE (e4/e4 carriers/single e4 carriers/non-e4-carriers; n)1/6/60/5/100.3757
Arterial hypertension (yes/no)6/1614/130.1433
Diabetes mellitus (yes/no)0/223/240.2423
Rheumatoid arthritis (yes/no)1/210/270.4490
NSAIDs (yes/no)6/168/190.8559
Anticoagulants (yes/no)0/220/27n.a.
Antihypertensives (yes/no)6/1613/140.1551
Antidiabetics (yes/no)0/221/260.9853
Statins (yes/no)4/187/200.7325
Antidepressants (yes/no)2/207/200.1595
AChE inhibitors (yes/no)1/214/230.3622
Mediterranean diet score [16]32.0 (5.1)30.1 (5.2)0.1141
Note: Values are expressed as mean (standard deviation). N: number; MCI: mild cognitive impairment; AD: Alzheimer’s disease patients; m/f: male/female; MMSE: mini-mental state examination; GDS: Geriatric Depression Scale; NSAIDs: nonsteroidal antiphlogistics; AChE: acetylcholinesterase.
Table 2. Genus and phylum of the 24 features included in the genera model for discrimination between AD dementia converters and stable MCI patients. * <0.05; ** <0.01; *** <0.001 https://www.ncbi.nlm.nih.gov/Taxonomy/Browser/wwwtax.cgi?id=2 (accessed on 9 November 2023).
GenusPhylumGenera Levels in AD Dementia Converters vs. Stable MCI Patients (↑ Increased, ↓ Decreased)
ClostridiumBacillota
ErysipelatoclostridiumBacillota↑ ***
MediterraneaBacteroidota
LawsonibacterBacillota
SebaldellaFusobacteriota↑ **
HaloglycomycesActinomycetota
ActinoalloteichusActinomycetota
ArsenicicoccusActinomycetota
SerinicoccusActinomycetota
KnoelliaActinomycetota
ProteiniclasticumBacillota
AlkaliflexusBacteroidota↓ *
GeofilumBacteroidota↓ *
FilimonasBacteroidota↑ **
TerrimonasBacteroidota
PriciaBacteroidota
LautropiaPseudomonadota
AcidiphiliumPseudomonadota
KomagataeibacterPseudomonadota
TeredinibacterPseudomonadota↑ **
MethyloglobulusPseudomonadota
OceanococcusPseudomonadota
PersephonellaAquificota↑ *
KutzneriaActinomycetota
Table 3. KO (Kyoto Encyclopedia of Genes and Genomes [KEGG] ortholog) labels, names and pathways of 33 features included in the KO model for discrimination between AD dementia converters and stable MCI patients. * <0.05; ** <0.01; https://www.genome.jp/kegg/pathway.html (accessed on 9 November 2023).
KO LabelNamePathways/Reaction MechanismsRelative Abundance of KO Values in AD Dementia Converters vs. Stable MCI Patients (↑ Increased, ↓ Decreased)
K02474UDP-N-acetyl-D-galactosamine dehydrogenaseMetabolism of amino sugar and nucleotide sugar
Biosynthesis of O-Antigen nucleotide sugar
Biosynthesis of nucleotide sugars
↑ *
K17235Arabinosaccharide transport system permease proteinATP-binding cassette (ABC) transporters
K02405RNA polymerase sigma factor for flagellar operon FliATwo-component system
Biofilm formation of pseudomonas aeruginosa, escherichia coli and vibrio cholerae
Flagellar assembly
K07742Uncharacterized proteinUnclassified↓ **
K02041Phosphonate transport system ATP-binding proteinABC transporters
K03826Putative acetyltransferaseProtein modification↓ *
K03706Transcriptional pleiotropic repressorSenses the intracellular pool of branched-chain amino acids
K01951Guanosine monophosphate (GMP) synthaseATP + xanthosine 5’-phosphate + L-glutamine + H2O ⇌ AMP + diphosphate + GMP + L-glutamate
Metabolism of purine, drugs and nucleotides
K02065Phospholipid/cholesterol/gamma-HCH transport system ATP-binding proteinABC transporters
K00765ATP phosphoribosyltransferaseHistidine metabolism
Metabolic pathways
Biosynthesis of secondary metabolites and
amino acids
K09789Pimeloyl-[acyl-carrier protein] methyl ester esteraseBiotin metabolism
Biosynthesis of cofactors
↑ *
K02654Leader peptidase (prepilin peptidase)/N-methyltransferaseFormation of pseudopili
K09766Uncharacterized proteinUnclassified
K03408Purine-binding chemotaxis protein CheWTwo-component system
Bacterial chemotaxis
K032703-deoxy-D-manno-octulosonate 8-phosphate phosphatase (KDO 8-P phosphatase)Biosynthesis of lipopolysaccharides and nucleotide sugars
Metabolic pathways
K02396Flagellar hook-associated protein 1Flagellar assembly
K01923Phosphoribosylaminoimidazole-succinocarboxamide synthasePurine metabolism
Biosynthesis of secondary metabolites
K01736Chorismate synthaseBiosynthesis of phenylalanine, tyrosine, tryptophan, secondary metabolites and amino acids
Metabolic pathways
K18928L-lactate dehydrogenase complex protein LldEConversion of pyruvate to lactate and back
K02387Flagellar basal-body rod protein FlgBFlagellar assembly
K00575Chemotaxis protein methyltransferase CheRTwo-component system
Bacterial chemotaxis
K07718Two-component system, sensor histidine kinase YesMTwo-component system
K06378Stage II sporulation protein AA (anti-sigma F factor antagonist)Regulation of DNA-templated transcription
Cellular spore formation
↓ *
K06023HPr kinase/phosphorylaseCatabolite repression in Gram-positive bacteria
Phosphorylates HPr, a phosphocarrier protein of a sugar transport and phosphorylation system at a serine residue
K05350Beta-glucosidaseMetabolism of cyanoamino acid, starch and sucrose
Degradation of flavonoids
Biosynthesis of various plant secondary metabolites
K00338NADH-quinone oxidoreductase subunit IOxidative phosphorylation
Metabolic pathways
↑ *
K00281Glycine dehydrogenaseMetabolism of glycine, serine, threonine, glyoxylate, dicarboxylate,
lipoic acid and carbon
Biosynthesis of secondary metabolites
↑ **
K06143Inner membrane proteinUnclassified↑ *
K01308Gamma-D-glutamyl-meso-diaminopimelate peptidaseEndopeptidase
K13652AraC family transcriptional regulatorBinds to the target DNA and regulates bacterial virulence by sensing small molecule inducers↑ *
K02398Negative regulator of flagellin synthesis FlgMTwo-component system
Biofilm formation of pseudomonas aeruginosa and escherichia coli
Flagellar assembly
K07814Putative two-component system response regulatorPutative two-component system response regulation↓ *
K01277Dipeptidyl-peptidase IIIIntracellular peptide catabolism
Table 4. GO (Gene Ontology) labels, names and pathways of 25 features included in the GO model for discrimination between AD dementia converters and stable MCI patients. * <0.05; ** <0.01; https://www.informatics.jax.org/vocab/gene_ontology/ https://amigo.geneontology.org/ (accessed on 9 November 2023).
GO LabelNAME/TERMDefinition/Reaction MechanismsRelative Abundance of GO Values in AD Dementia Converters vs. Stable MCI Patients (↑ Increased, ↓ Decreased)
GO.0050549Cyclohexyl-isocyanide hydratase activityN-cyclohexylformamide + H+ = cyclohexyl isocyanide + H2O↑ **
GO.0015716Organic phosphonate transportAlkylphosphonate transport↑ *
GO.00475362-aminoadipate transaminase activity2-oxoglutarate + L-2-aminoadipate = 2-oxoadipate + L-glutamate↑ **
GO.0006084Acetyl-CoA metabolic processKey intermediate in lipid and terpenoid biosynthesis↓ **
GO.0006694Steroid biosynthetic processFormation of steroids
GO.0009986Cell surface bindingComponent of the cell wall and/or plasma membrane↓ *
GO.0016999Antibiotic metabolic processAntibiotic metabolism↓ **
GO.0003935GTP cyclohydrolase II activityGTP + 3 H2O = 2,5-diamino-6-hydroxy-4-(5-phosphoribosylamino)-pyrimidine + diphosphate + formate + 3 H+↓ *
GO.0004634Phosphopyruvate hydratase activity2-phospho-D-glycerate = phosphoenolpyruvate + H2O
GO.0006399tRNA metabolic processtRNA metabolism
GO.0016854Racemase and epimerase activityConfiguration change in one or more chiral centers in a molecule
GO.0046405Glycerol dehydratase activityGlycerol = 3-hydroxypropanal + H2O
GO.005290723S rRNA (adenine(1618)-N(6))-methyltransferase activityS-adenosyl-L-methionine + adenine (1618) in 23S rRNA = S-adenosyl-L-homocysteine + rRNA containing N(6)-methyladenine (1618) in 23S rRNA↑ *
GO.0006974DNA damage responseCellular response to DNA damage↑ *
GO.2000143Negative regulation of DNA-templated transcription initiationLimitation of DNA-templated transcription initiation↑ *
GO.0002143tRNA wobble position uridine thiolationPost-transcriptional thiolation at the C2 position of an uridine residue at position 34 in the anticodon of a tRNA↑ **
GO.0019323Pentose catabolic processBreakdown of a pentose, any monosaccharide with a chain of five carbon atoms in the molecule↑ *
GO.0046104Thymidine metabolic processThymidine metabolism↑ *
GO.0016041Glutamate synthase (ferredoxin) activity2 L-glutamate + 2 oxidized ferredoxin = L-glutamine + 2-oxoglutarate + 2 reduced ferredoxin + 2 H+
GO.0016776Phosphotransferase activity, phosphate group as acceptorTransfer of a phosphorus-containing group from one compound (donor) to a phosphate group (acceptor)↑ *
GO.0033764Steroid dehydrogenase activity, acting on the CH-OH group of donors, NAD or NADP as acceptorOxidation-reduction (redox) reaction in which a CH-OH group acts as a hydrogen or electron donor and reduces NAD+ or NADP, and in which one substrate is a sterol derivative↑ *
GO.0010133Proline catabolic process to glutamateProline degradation to glutamate
GO.00038421-pyrroline-5-carboxylate dehydrogenase activityH2O + L-glutamate 5-semialdehyde + NAD+ = 2 H+ + L-glutamate + NADH
GO.0004657Proline dehydrogenase activityL-proline + acceptor = (S)-1-pyrroline-5-carboxylate + reduced acceptor (first of two enzymatic reactions in proline degradation to glutamate)↑ *
GO.0004775Succinate-CoA ligase (ADP-forming) activityATP + succinate + CoA = ADP + succinyl-CoA + phosphate↑ **
Disclaimer/Publisher’s Note: The statements, opinions and data contained in all publications are solely those of the individual author(s) and contributor(s) and not of MDPI and/or the editor(s). MDPI and/or the editor(s) disclaim responsibility for any injury to people or property resulting from any ideas, methods, instructions or products referred to in the content.

