Article

Identification of a Branch Number Locus in Soybean Using BSA-Seq and GWAS Approaches

Institute of Industrial Crops, Jiangsu Academy of Agricultural Sciences, Nanjing 210014, China
*
Authors to whom correspondence should be addressed.
Int. J. Mol. Sci. 2024, 25(2), 873; https://doi.org/10.3390/ijms25020873
Submission received: 30 November 2023 / Revised: 4 January 2024 / Accepted: 5 January 2024 / Published: 10 January 2024
(This article belongs to the Special Issue Molecular Genetics and Breeding Mechanisms in Crops 2.0)

Abstract

:
The determination of the soybean branch number plays a pivotal role in plant morphogenesis and yield components. This polygenic trait is subject to environmental influences, and despite its significance, the genetic mechanisms governing the soybean branching number remain incompletely understood. To unravel these mechanisms, we conducted a comprehensive investigation employing a genome-wide association study (GWAS) and bulked sample analysis (BSA). The GWAS revealed 18 SNPs associated with the soybean branch number, among which qGBN3 on chromosome 2 emerged as a consistently detected locus across two years, utilizing different models. In parallel, a BSA was executed using an F2 population derived from contrasting cultivars, Wandou35 (low branching number) and Ruidou1 (high branching number). The BSA results pinpointed a significant quantitative trait locus (QTL), designated as qBBN1, located on chromosome 2 by four distinct methods. Importantly, both the GWAS and BSA methods concurred in co-locating qGBN3 and qBBN1. In the co-located region, 15 candidate genes were identified. Through gene annotation and RT-qPCR analysis, we predicted that Glyma.02G125200 and Glyma.02G125600 are candidate genes regulating the soybean branch number. These findings significantly enhance our comprehension of the genetic intricacies regulating the branch number in soybeans, offering promising candidate genes and materials for subsequent investigations aimed at augmenting the soybean yield. This research represents a crucial step toward unlocking the full potential of soybean cultivation through targeted genetic interventions.

1. Introduction

Soybean is one of the most important economic crops and also serves as a primary source of plant-based protein and oilseeds, which are commonly employed in both human food and animal feed [1]. Because of constant increases in global population and the improvement of people’s living standards, the requirement for more soybeans has correspondingly increased. The genetic improvement of soybean varieties to enhance yields will become increasingly critical [2,3].
The strategies for increasing the production capabilities of soybeans include increasing the planting area of soybeans, encompassing approaches that intercrop with other crops, like maize, as well as planting soybeans on barren land [4]. Additionally, the related traits of yield components can be targeted. The former requires research on soybean stress, while the latter necessitates increased attention to the mechanism of soybean yield-related traits. Soybean presents as a typical pod crop, and its yield components are different from grain crops [5]. Soybean yield is governed by the pod number per plant, seed number per pod, and seed number. The number of branches directly affects the total pod number per plant in soybeans [6]. Branching plasticity reduces the branch number under dense planting, increasing the branch development relative to the land space per plant [7]. It is necessary to construct soybean varieties with an appropriate branch number according to typical cultivation practices.
The branch number is critical for increasing yield in soybeans, but its genetic regulatory mechanisms remain incompletely understood. Over the past decade, several approaches have been taken to characterize the genetic loci and genes responsible for branch numbers in soybeans. Using a recombinant inbred line (RIL) population for quantitative trait locus (QTL) is a typical method of characterizing the key loci related to the type in plants like legumes [8], rice [9], maize [10], and wheat [11]. Numerous branch number-related QTLs have been found in different linkage mapping populations [6,12,13,14,15,16,17,18]. With the development of the soybean reference genome and the increased usage of GWAS, some QTLs linked to soybean branching distributed on chromosomes 15, 17, 18, and 20 have been identified [19,20]. Shim et al. [6] performed QTL mapping for branch numbers with an RIL population and identified four related QTLs [6]. Two years later, they found a consistent QTL GmBRC1 through GWAS and verified that Glyma06g23410 is GmBRC1, which acts as a negative regulator of lateral branch development [21]. Sobhi et al. [22] determined that Glyma.06G208900 acted as a candidate gene controlling the branch number [22]. Liang et al. [23] identified a predominant association locus on chromosome 18, Dt2, which confers soybean branch number in a natural population containing a total of 2409 soybean accessions, and demonstrated that SoyZH13_18g242900 was a candidate gene for Dt2 [23].
To further characterize the associated genes for the branch number in soybeans, we performed a comprehensive study integrating two methods: GWAS and BSA-seq. Our study involved an association panel of 301 soybean varieties for the GWAS and an F2 population of 30 individuals with the most branches and 30 individuals with the least branches for the BSA-seq. We ultimately mapped a branch number QTL across a specific chromosomal interval on chromosome 2 (12.16–12.42 Mb), encompassing 15 candidate genes. Among these genes, Glyma.02G125200 and Glyma.02G125600 emerged as robust candidates for controlling branch numbers in soybeans. The findings of this study will enable breeders to gain valuable insights for the purpose of selecting soybean germplasm resources that exhibit a corresponding branch number through the utilization of marker-assisted selection. Additionally, these findings will assist in identifying novel genes that play a role in regulating soybean branching.

2. Results

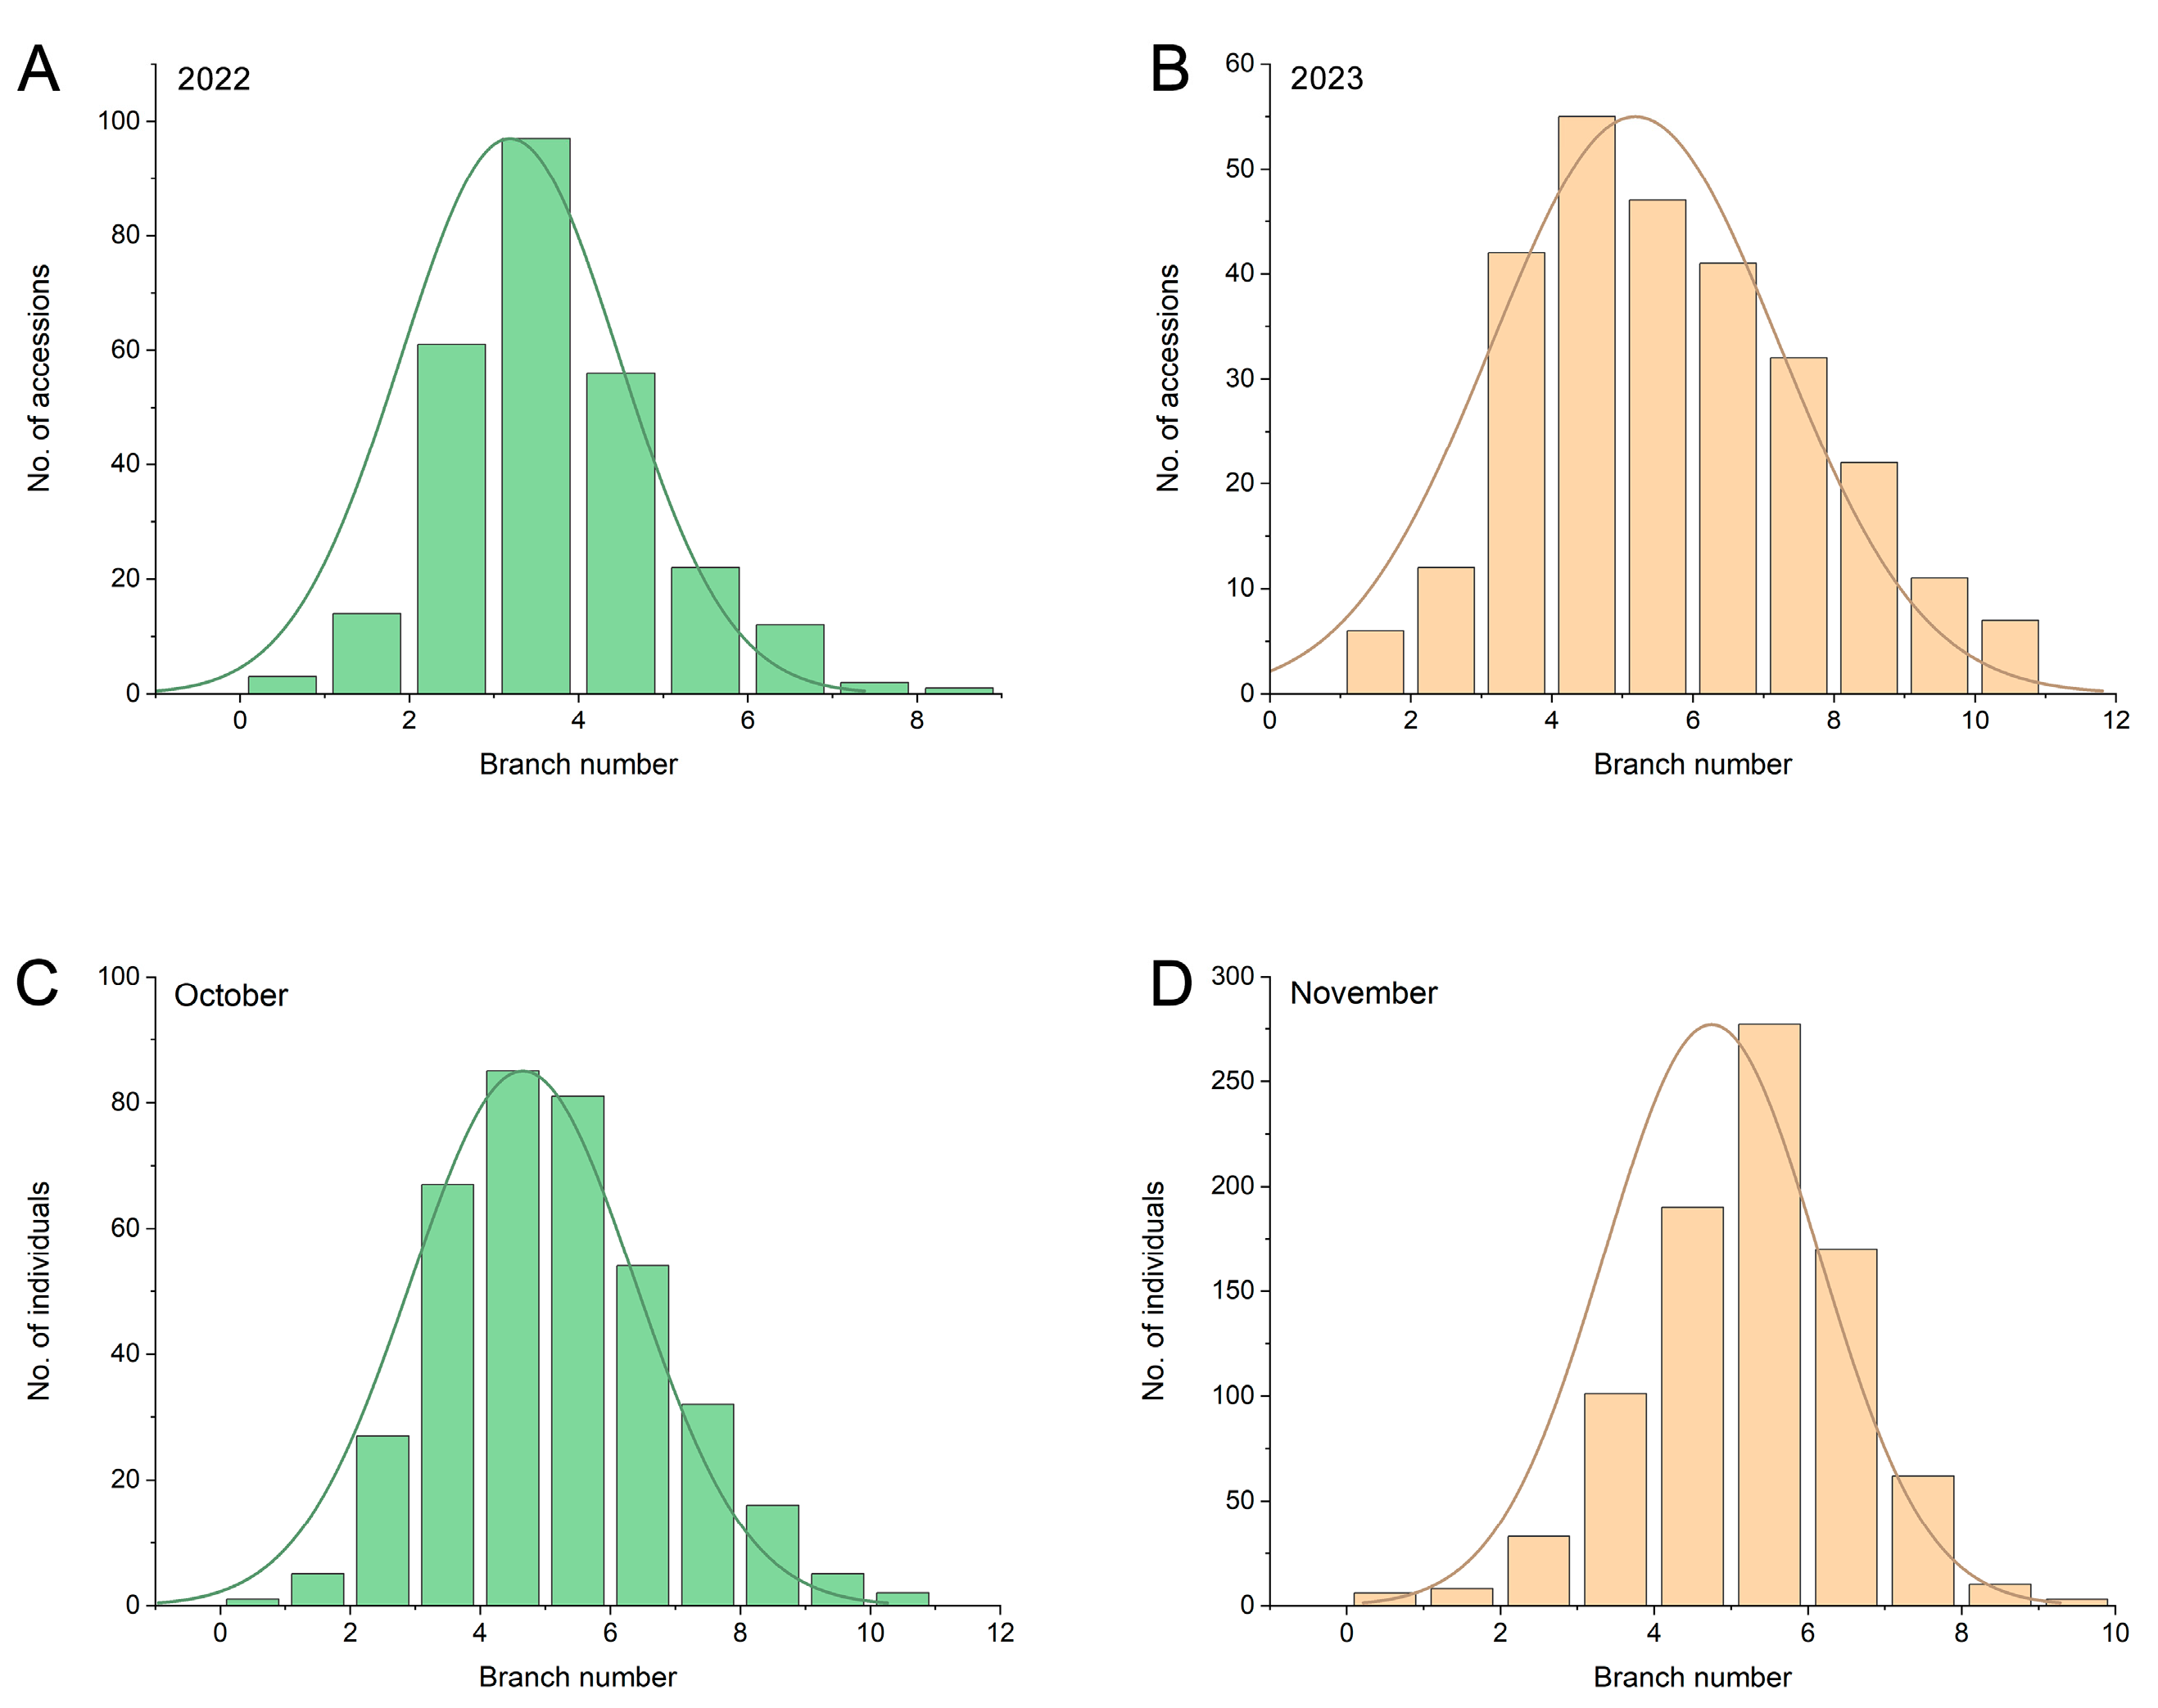
2.1. Evaluation of Branch Number in the Association Panel and F2 Population

We analyzed the average branch number of each accession in the association mapping panel for 2022 and 2023. Continuous variation and an approximately normal distribution were identified (Figure 1A,B). The branch number ranged from 0.17 to 8.33 in 2022 and from 0.67 to 10.17 in the association panel, with mean values of 3.18 and 5.20, respectively. A higher coefficient of variation (CV) was identified in 2022, 40.25%, whereas a higher SD was found in 2023, 2.07 (Table 1 and Table S1). For the F2 segregating population, the branch numbers of the female parent Ruidou1 and male parent Wandou35 were 6.1 ± 0.66 and 0.7 ± 0.74, respectively (Figure S1). An ANOVA on the phenotypic data from natural soybean populations in 2022 and 2023 was conducted, and the findings indicated a significant difference between the two years (p < 0.01). The population was collected in October and November 2022 based on the maturity, with 860 individuals harvested in October and 375 individuals harvested in November. We examined the number of branches per plant individually, and observed a range from 0 to 10 in the F2 population, with an average number of 4.72. Continuous alterations were found in both batches (Figure 1A,B, Table S2). Extreme pools were chosen from among the 860 individuals.

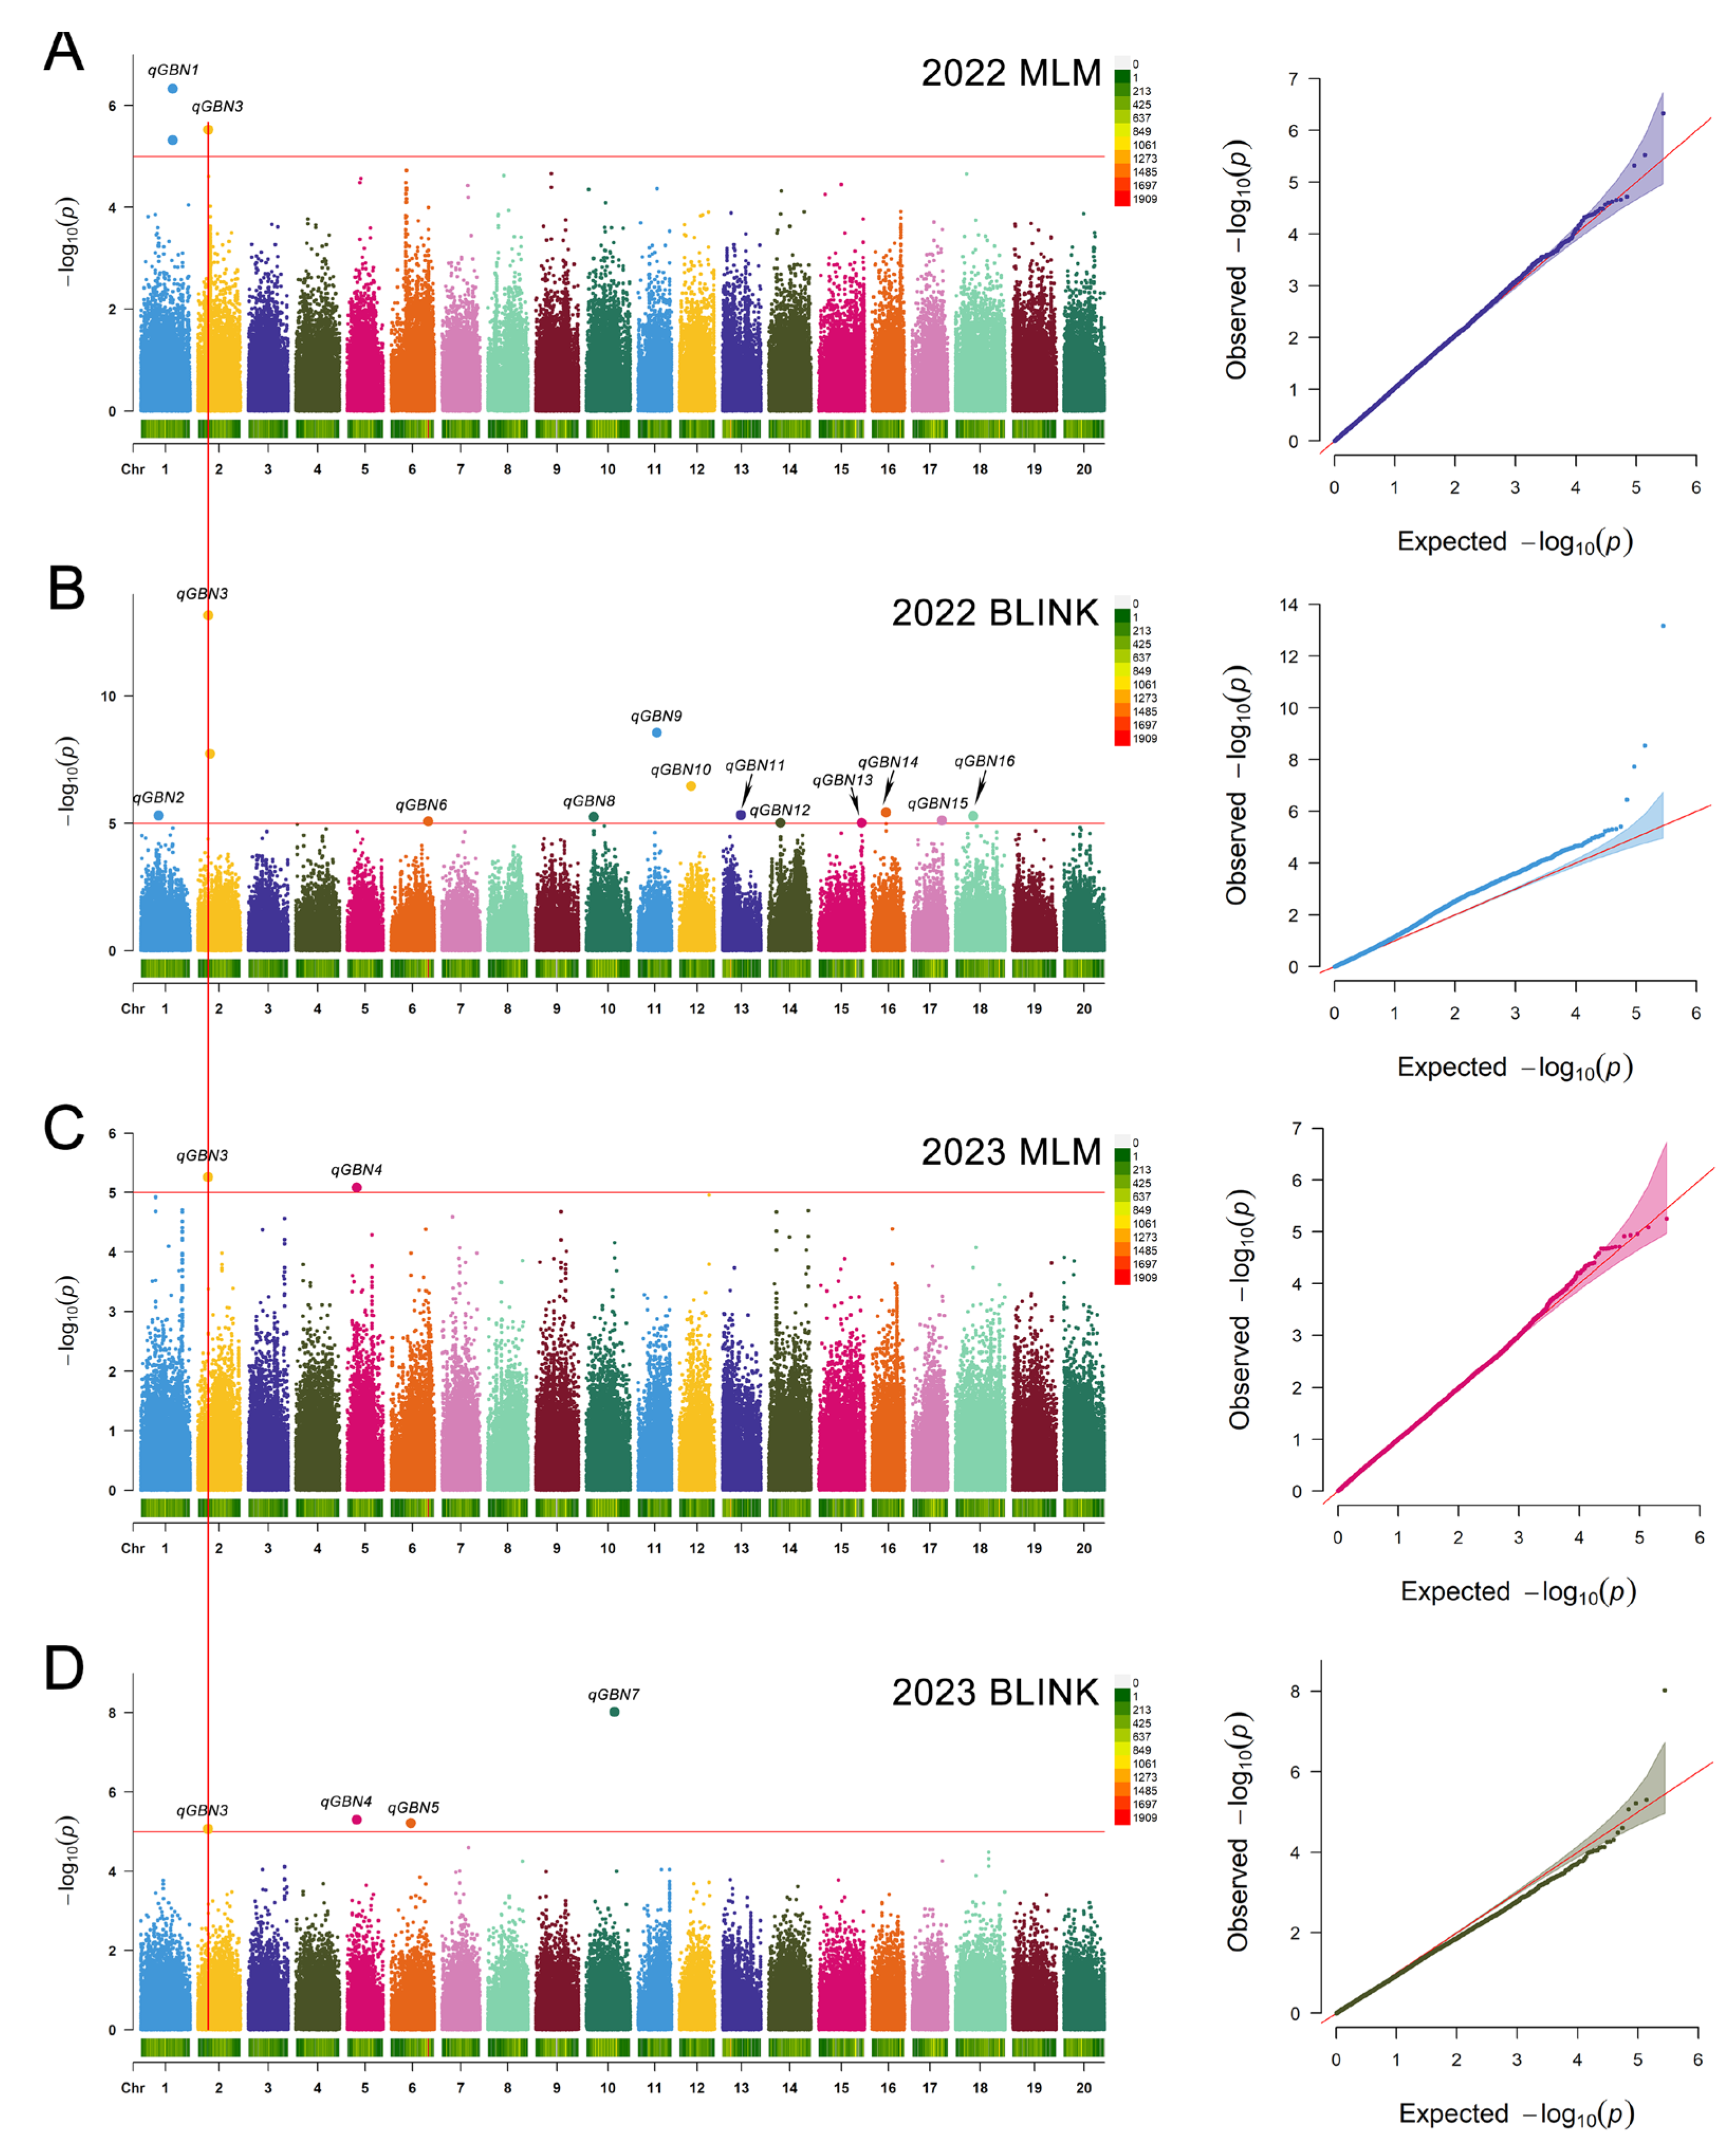
2.2. Genomic Regions of Branch Number Identified by GWAS

A total of 277,702 SNPs remained after filtering according to the selection criteria, which were employed to conduct GWAS for soybean branch numbers utilizing the MLM and BLINK models. According to a reasonable threshold (p ≤ 10−5), the GWAS revealed a total of 18 significant SNPs influencing the branch number, distributed on 13 chromosomes, including chromosomes 1, 2, 5, 6, 10, 11, 12, 13, 14, 15, 16, 17, and 18 (Table 2, Figure 2). Individual SNPs accounted for between 9.16 and 27.18% of the phenotypic variation. S02_1240704 and S02_1241353 were grouped based on the close proximity of the positions, much like S01_647060 and S01_647058. Therefore, a total of 16 QTLs were detected, noted as qGBN1-qGBN16. Among these QTLs, 13 were uniquely detected using only one approach, potentially due to environmental influences, three were co-identified when using different approaches, and qGBN3 was detected both at two years, suggesting that qGBN3 likely contained genes that regulate the number of soybean branches. The regions within 260 kb (12.16–12.42 M, Chr2) surrounding the S02_1240704 were employed as qGBN3 based on the linkage disequilibrium (LD) decay determined previously. A total of 27 candidate genes, encompassing known or putative functions associated with signal transduction, amino acid metabolism, and translation, were identified in the region (Table S3).

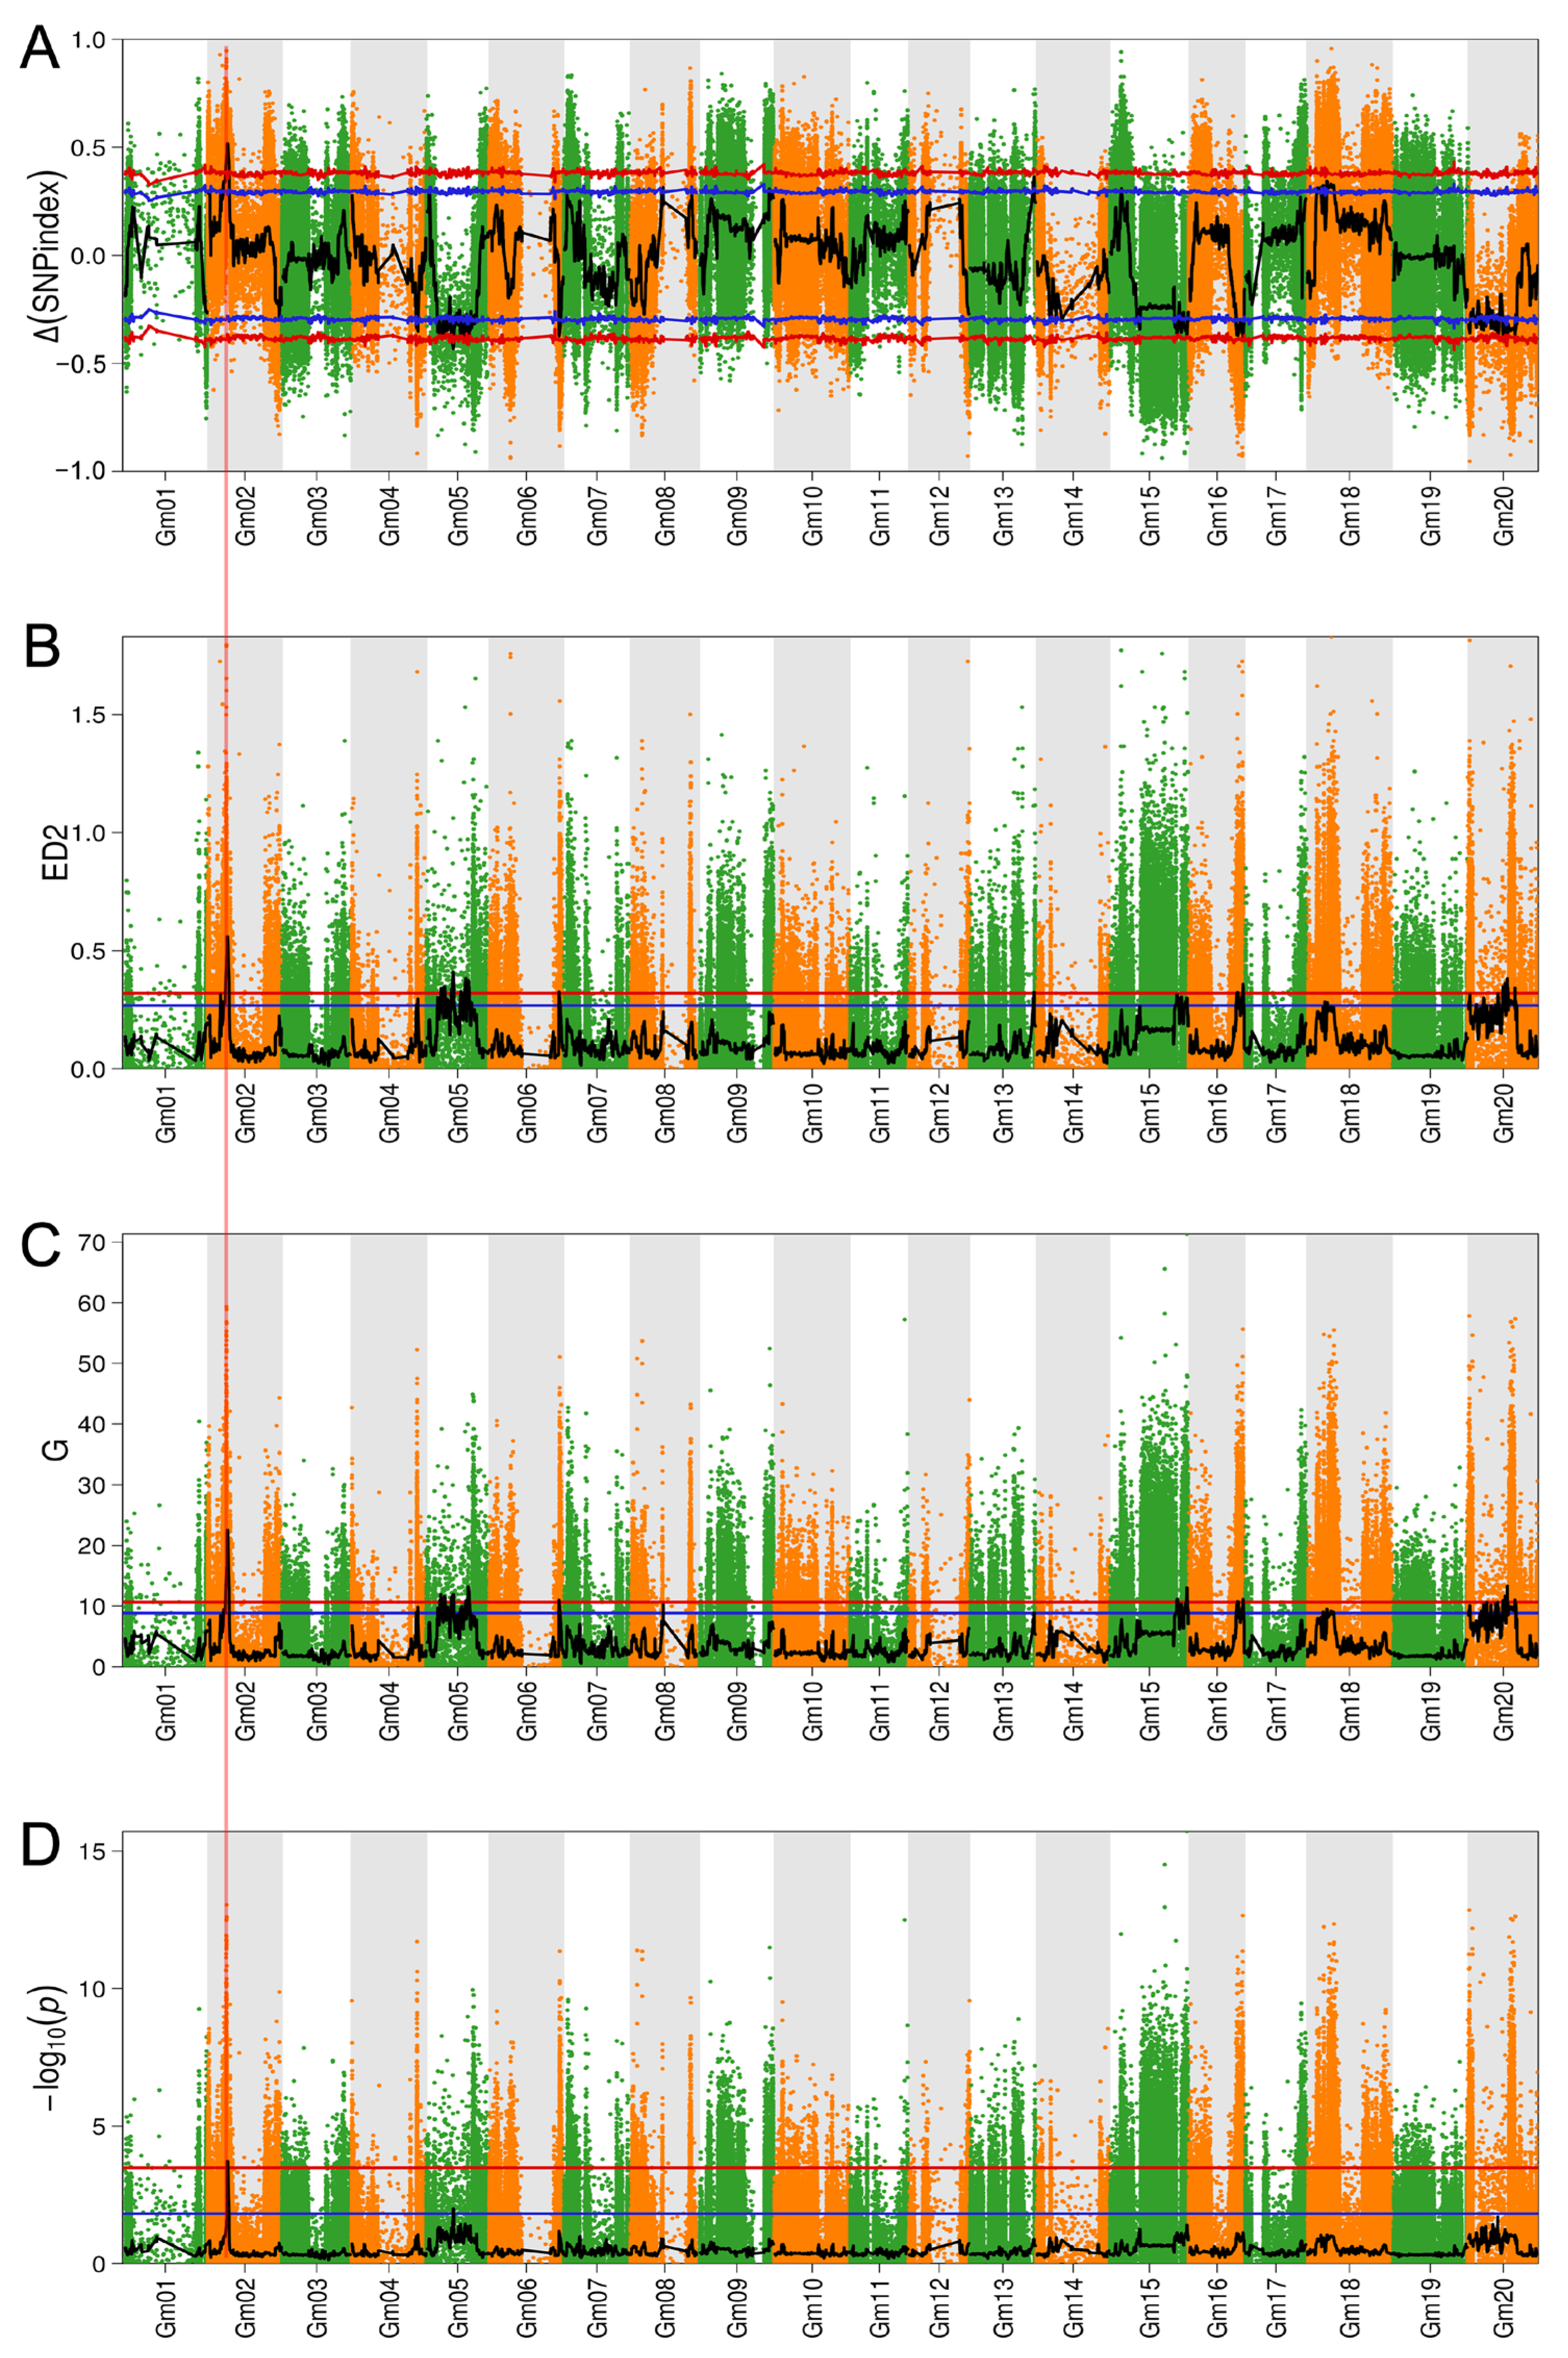
2.3. BSA-Seq-Based Identification of Branch Number-Associated Genomic Regions

The bulked-segregant analysis coupled with the whole-genome sequencing (BSA-seq) was employed to characterize the branch number locus. Genomic DNA was extracted from 30 F2 plants with extremely high branch numbers (7–8), 30 F2 plants with extremely low branch numbers (0–3), and the two parents for the BSA-seq analysis. A total of 162 Gb of high-quality, clean data were acquired. The sequencing depths of the parents and extreme phenotypic pools were 30× and 20×, respectively (Table S4). The high-quality reads were aligned with the WM 82.a4 sequence. A total of 662,900 high-quality SNPs and 104,868 high-quality InDels following filtering were utilized for the subsequent analysis. Four strategies: Δ(SNP-index) (Figure 3A), ED (Figure 3B), G-value (Figure 3C), and Fisher’s exact test (Figure 3D) association analyses were employed, and 18 genomic regions across multiple chromosomes exceeded the threshold (99% confidence interval or q-value < 0.01). These QTL loci were termed qBBN1-qBBN18, and among them, six are distributed on chromosome 5, and five are distributed on chromosome 20. qBBN1, qBBN3, qBBN4, qBBN6, qBBN7, and qBBN17 were identified through the use of three or more algorithms, and only qBBN1 was detected through the use of all four methods (Table 3). An assessment of the WM 82.a4 sequence suggested that the 88 genomic regions contained 1109 genes. We conducted gene ontology (GO) enrichment and Kyoto Encyclopedia of Genes and Genomes (KEGG) pathway analysis of these corresponding genes. From the GO enrichment findings, we identified genes that were mainly involved in biological processes such as carbon fixation, cellular respiration, signal transduction, and cell communication (Figure 4A and Figure S2). According to our KEGG pathway analysis, the significantly enriched pathways throughout these genes included carbon fixation in photosynthetic organisms, pyruvate metabolism, and carbon metabolism (Figure 4B and Figure S3).

2.4. Candidate Loci Identified by GWAS and BSA

According to the GWAS and BSA analysis, we identified that the QTL loci qGBN3 (12.16–12.42 Mb) characterized via GWAS and qBBN1 (12.18–13.36 Mb) identified through BSA on chromosome 2 were co-located. This suggested that this interval has a robust linkage with the soybean branch number. Furthermore, we narrowed down the genomic interval to a 140 kb region (12.18–12.42 Mb). There are 15 putative genes annotated by the Soybase database (SoyBase, http://www.soybase.org/, accessed on 12 August 2023) (Table 4).

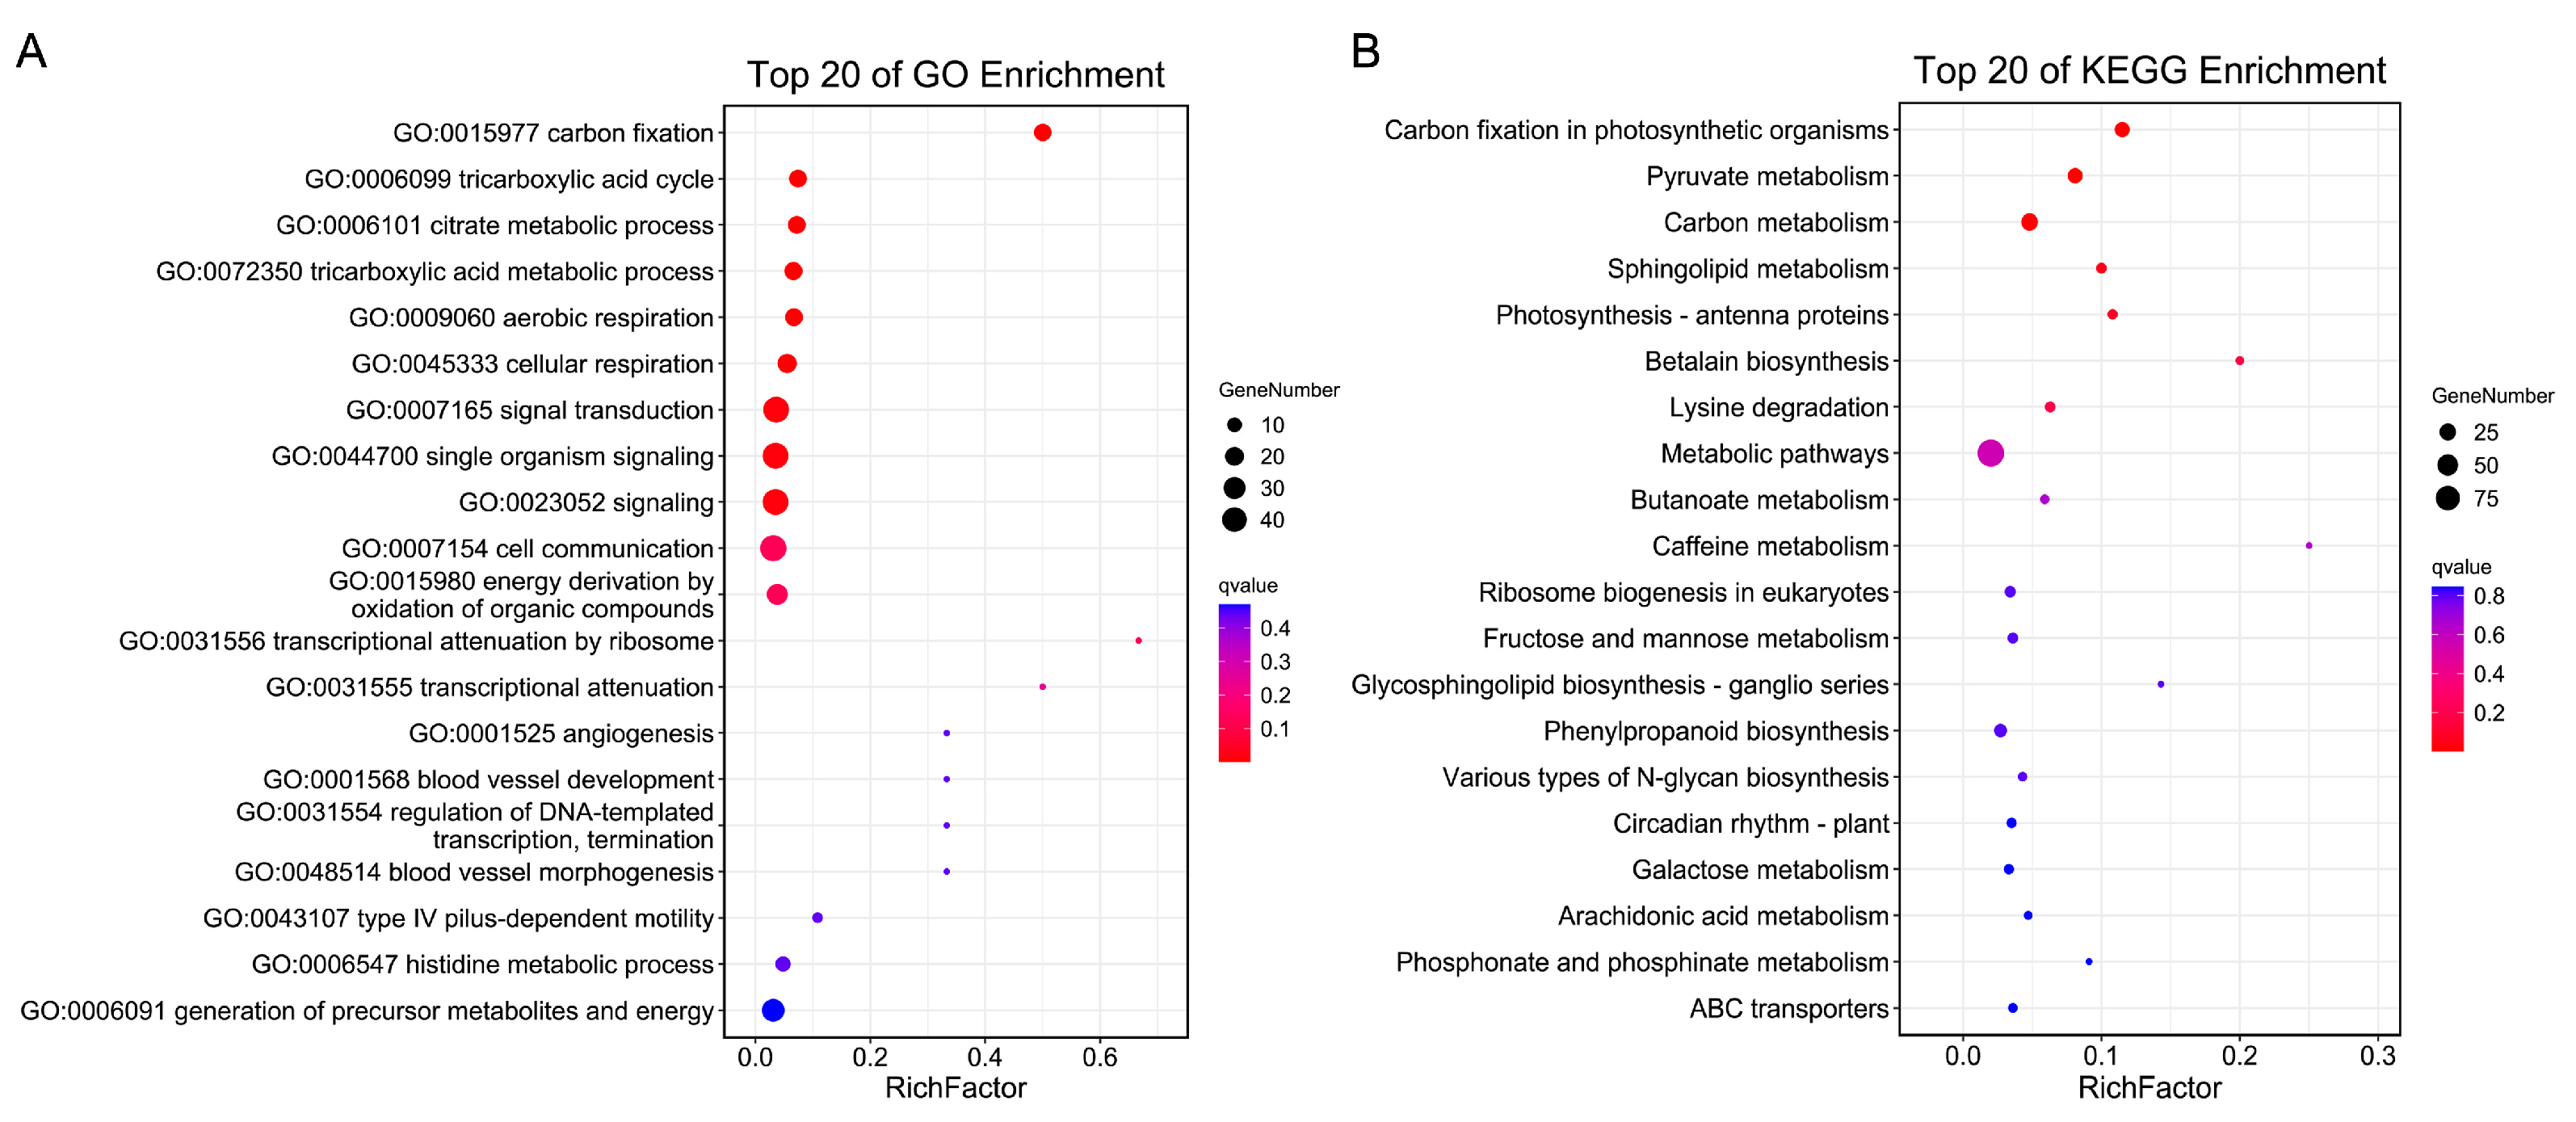
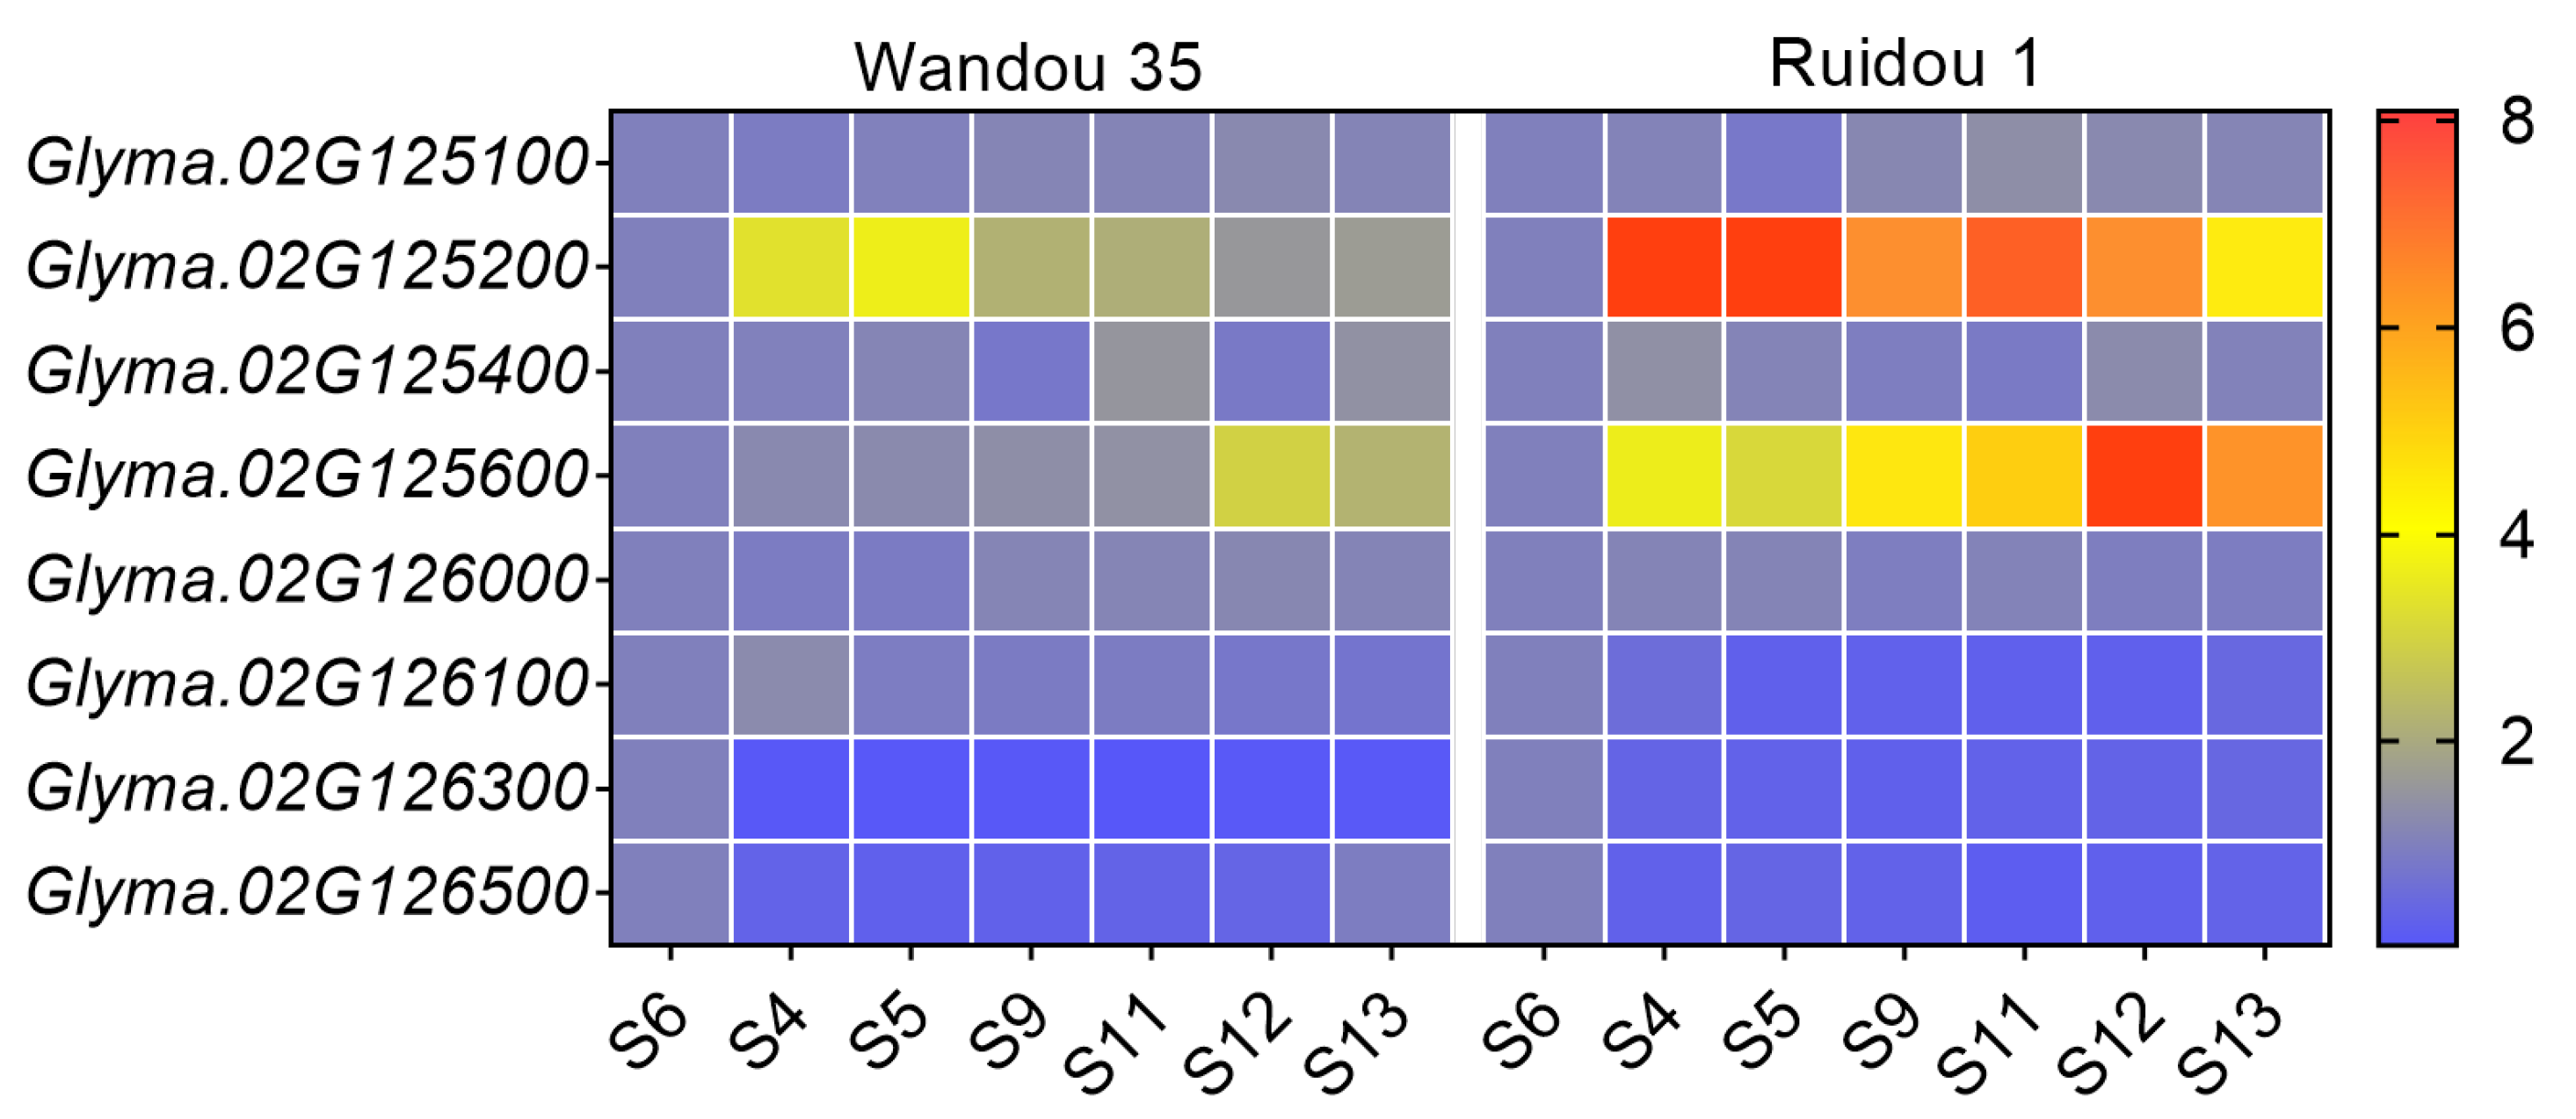
2.5. Candidate Gene Annotation and Expression Analysis

Based on the gene annotation, eight genes possessed functional annotations, while seven were unknown genes (Table 4). For instance, Glyma.02G125100 encodes a putative 2-oxoglutarate/Fe(II)-dependent dioxygenase-like protein, Glyma.02G125200 encodes a BHLH transcription factor, Glyma.02G125600 was annotated to perform a role as an auxin synthesis-related gene, while Glyma.02G126100 encodes a basic leucine zipper transcription (bZIP) factor-like protein. To characterize the significant gene influencing the branch number, we prioritized the genes with higher expression levels in the meristem-related tissues, as these genes may impact the formation and development of the soybean branches. The results of the RT-qPCR showed that Glyma.02G125200 and Glyma.02G125600 were highly expressed in the axillary bud tissues, especially in Wandou 35 (Figure 5). This indicates that Glyma.02G125200 and Glyma.02G125600 may have critical functions in branch development.

3. Discussion

The aerial segment of soybeans [Glycine max (L.) Merr.] is made up of the main stem and a variable number of branches, with leaves, flowers, and pods attached [13]. The number of soybean branches is important for the morphogenesis of soybean plants and is closely tied to the plant lodging resistance as well as the yield per plant. Moreover, the branch number can influence the population seed yield by impacting light utilization and ventilation. The extent of branching depends on various influences exerted by the growth environment, encompassing nutritional conditions, planting pattern, planting date, and, particularly, plant density [13,25]. The yield of various soybean varieties differs significantly under various planting densities [26]. Under low density, multi-branched varieties can acquire a high yield through increased branching, while under high density, branching decreases [22]. To remove the influence of density on soybean branching, all experiments in our study were carried out using a low and uniform density of 83,333 plants/ha. The branch number of the soybeans in the associated population was considerably variable (Figure 1).
Soybean branching is modulated by an intricate spatial–temporal mechanism, controlling the outgrowth of axillary buds following the initiation of axillary meristems [27]. An increasing number of QTLs regulating branch development have been characterized through the use of various mapping populations in soybeans [6,12,13,18]. However, the identified QTLs span various plausible genes due to the limited number of molecular markers and uneven distributions. The reference genome of a cultivated accession (Williams 82) was released in 2010 [28]. With the emergence and development of high-throughput sequencing technology alongside its high efficiency, the GWAS and BSA-seq methods have been widely employed in the analysis of the critical agronomic characteristics of various crops.
By integrating GWAS and BSA, we identified a novel QTL on chromosome 2 associated with the soybean number, qGBN3/qBBN1, which has been detected by different MLM and BLINK models over two years and four BSA algorithms (Figure 2 and Figure 3). This suggested that this overlap might be a necessary genetic component accounting for the number of soybean branches. We further narrowed the region of the co-located QTL to a precise range of 140 kb (12.18–12.42 Mb, Chr2). Moreover, the genome regions overlapping between this study and previous research were determined. These regions included qBBN8 (47.02–48.27 Mb, Chr6) and qGBN6 (44.28–44.48 Mb, Chr6), which were included within the Qsb 6 (40.46–48.30 Mb, Chr6); qGBN9 (8.49–22.59 Mb, Chr11) was similar to qBR11-1 (10.83–25.08 Mb, Chr11) [6,12]. This corroborated the accuracy and reliability of the correlation examination in this study.
Integrating the gene annotation and expression experiments, two candidate genes were considered to be potential candidates for regulating the soybean branch numbers. Glyma.02G125200 encodes a Basic Helix-Loop-Helix (bHLH) transcription factor known as bHLH49. The bHLH transcription factor family is one of the largest families of transcription factors that plays a crucial role in plant development. The loss of function of the bHLH homolog LAX1 in rice results in the abortion of panicle branching [29], indicating that Glyma.02G125200 may play a role in soybean branching. Glyma.02G125600 encodes an Indole-3-acetic acid-amido synthetase, known as GH3.1, which was involved in the plant hormone signal transduction pathway via KEGG annotation analysis. Gretchen Hagen3 (GH3) has dual roles in plant development and responses to biotic or abiotic stress [30]. The overexpression of the homologous genes, CsGH3.1 and CsGH3.1L in citrus resulted in the significant downregulation of the expression levels of the annotated auxin/indole-3-acetic acid family genes and elevated branching [31]. This suggests that auxin synthesis and transduction may be crucial for promoting the branch number of soybeans.
Notably, the expression level of Glyma.02G126100, encoding a bZIP family transcription factor in the meristematic tissues of Ruidou 1, was lower than in Wandou 35 (Figure 5). The bZIP domain transcription factors play an important role in plant external stress and development [32,33]. We could not exclude that Glyma.02G126100 operated as a candidate gene, which may have a negative regulatory influence on soybean branching. Further experiments, including gene editing and overexpression, will be necessary to confirm the function of these genes in the future.
This study represents a comprehensive contribution to our understanding of the genetic mechanism underlying branch number and its influence on the soybean yield. Identifying novel loci and candidate genes using a combination of GWAS and BSA allows for the development of a theoretical foundation for future studies on the genetic regulation of soybean branching. Overall, this study will be valuable in breeding high-yield soybeans and global food and oil security.

4. Materials and Methods

4.1. Plant Materials and Phenotypic Evaluation

A total of 301 soybean accessions from different Chinese provinces were collected to construct an association mapping panel. All materials were grown in Nanjing, Jiangsu Province, in 2022 and 2023. The experiment utilized a randomized complete block design with a single-row plot and three replicates. Each plot consisted of a single row, which was 3 m long, with 40 cm between rows and approximately 30 cm between plants. An F2 population composed of 1235 lines was developed from cross-breeding between Ruidou 1, a high branching number cultivar, and Wandou 35, with a low branch number. This F2 population and their parents were grown in Nanjing, Jiangsu province, in the summer of 2022. Again, the row length, spacing, and plant interval were 3 m, 40 cm, and 30 cm, respectively. The edge plants were removed, and the branch number of each plant was recorded as the number of effective branches upon the main stem with two or more nodes and at least one mature seed pod at harvest. For the association mapping panel, the average branch number of the six plants was obtained as the branch number of each accession. For the F2 population, we investigated 1235 individual soybean plants.

4.2. Statistical Analysis

In this study, SAS 9.2 software (SAS Software, Cary, NC, USA) was used to perform the Student’s t-test, and ANOVA was used to determine the significance differences of the phenotypic data from natural soybean populations in 2022 and 2023.

4.3. DNA Extraction and Whole-Genome Resequencing

For the F2 population, 30 individuals with the most branch numbers and 30 with the least branch numbers were chosen to develop two DNA mixed pools named “M_pool” and “F_pool,”, respectively. The “M pool” and “F pool” were developed by mixing equal amounts of high-quality DNA extracted from each individual leaf. The sequencing depth of mixed pools and parents were 50× and 30×, respectively.
The DNA libraries were sequenced using the Illumina sequencing platform by Genedenovo Biotechnology Co., Ltd. (Guangzhou, China). High-quality clean reads were contrasted with the reference genome utilizing BWA 0.7.1 [34]. The reference genome employed was the Glycine_max_v4.0 version of Williams 82 (https://www.ncbi.nlm.nih.gov/assembly/GCF_000004515.6/, accessed on 10 February 2023). To detect SNP and insertion/deletion (InDel) variants, we utilized GATK software v4.1 [35], and ANNOVAR software [36] to perform variant annotation and predict variant impact.

4.4. Genome-Wide Association Analyses

The genotypic data from 301 soybean materials were outlined in our previous study (not yet published). A total of 277,022 filtered high-quality SNPs spanning the entire genome, with a minimum allele frequency (MAF) ≥ 0.05, were employed to conduct the GWAS. The GWAS was performed using the mixed linear model (MLM) and Bayesian-information and Linkage-disequilibrium Iteratively Nested Keyway (BLINK) method, [37], using TASSEL 3.0 and GAPIT 3.0 [38,39]. At r2 = 0.1, the mean LD decay was 100 kb throughout all the chromosomes. A significance threshold of 1 × 10⁻⁵ was established to characterize significant associations [40]. Manhattan and quantile–quantile (QQ) plots were generated using the “CMplot” package in the R environment [41].

4.5. Bulk Segregant Sequencing Analyses

Four widely used analysis methods in BSA analysis were utilized, including Δ (SNP-index) statistics [42], the Euclidean distance (ED) algorithm [43], the G statistic, and the Fisher exact test [44,45]. The four methods we utilized were all based on a 1000 kb sliding window with a step size of 10 kb, applied to calculate the average and smooth the map. A 99% confidence level was chosen as the threshold for screening, and the window above the confidence level was defined as the area linked to the branch number. The intervals obtained using the four correlation analysis approaches were compared, and the overlapping interval was the QTL interval associated with the branch number. The genes and polymorphic sites in the candidate interval were annotated utilizing the website https://www.soybase.org/ (accessed on 12 August 2023).

4.6. Candidate Genes Identification and Description

In our study, the same intervals of BSA-seq and GWAS were the co-located QTL, and Soybase (https://www.soybase.org/, accessed on 29 November 2023) was then employed for gene annotation. Candidate genes were identified based on their expression patterns and homolog data of all genes within the co-located QTL.

4.7. Analyses of Gene Expression Patterns

Total RNA was extracted from the leaves and meristems of Ruidou 1 and Wandou 35 using TRIzol [46]. In total, seven RNA samples, including leaf at the trefoil stage (S6), leaf bud at the germination stage (S4), at the trefoil stage (S5), and at the flower bud differentiation stage (S9), flower bud (S11) and shoot meristem (S12) at flower bud differentiation stage, and flower bud at the flowering stage before flowering (S13) were acquired [24]. Three biological replicates were conducted, with the grains derived from three plants werew combined into one biological replicate. The primers used for RT-qPCR are listed in Table S5.

5. Conclusions

In this study, we utilized two methods, GWAS analysis and BSA seq, to co-locate a branch number QTL qGBN3/qBBN1 situated on chromosome 2. By conducting a functional annotation analysis and gene expression analysis on 15 candidate genes across the candidate region, we found two candidate genes, Glyma.02G125200 and Glyma.02G125600. Further functional analysis of these two genes will be conducted to uncover the regulatory mechanism of this gene in the soybean branch number.

Supplementary Materials

The following supporting information can be downloaded at https://www.mdpi.com/article/10.3390/ijms25020873/s1.

Author Contributions

Data curation, L.H., X.Z., X.Y., X.C. and C.X.; investigation, D.D.; methodology, X.C. and C.X.; validation, S.Z., Y.Y., G.W. and Y.H.; writing—original draft, D.D. All authors have read and agreed to the published version of the manuscript.

Funding

This research was funded by The Key Research and Development Program (Modern Agriculture) of Jiangsu Province (BE2023348), The Core Technology Development for Breeding Program of Jiangsu Province (JBGS-2021-014), and the Jiangsu Funding Program for Excellent Postdoctoral Talent.

Institutional Review Board Statement

Not applicable.

Informed Consent Statement

Not applicable.

Data Availability Statement

The data presented in this study are available on request from the corresponding author.

Conflicts of Interest

The authors declare no conflicts of interest.

References

  1. Hartman, G.L.; West, E.D.; Herman, T.K. Crops that feed the World 2. Soybean—Worldwide production, use, and constraints caused by pathogens and pests. Food Secur. 2011, 3, 5–17. [Google Scholar] [CrossRef]
  2. Ray, D.K.; Mueller, N.D.; West, P.C.; Foley, J.A. Yield Trends Are Insufficient to Double Global Crop Production by 2050. PLoS ONE 2013, 8, e66428. [Google Scholar] [CrossRef] [PubMed]
  3. Teng, P.; Caballero-Anthony, M.; Lassa, J.; Nair, T. Towards Asia 2025: Policy and technology imperatives. Summary of the main findings of the second international conference on Asian food security held in Singapore on 21–22 August 2014. Food Secur. 2015, 7, 159–165. [Google Scholar] [CrossRef]
  4. Zakaria, N.H.; Nordin, M.S.; Ibrahim, M.A.; Abdul Majid, F.A.; Zainuddin, Z. Genetic diversity and proteomic analysis of vegetable soybean (Glycine max (L.) Merrill) accessions grown in mineral and BRIS soils. Czech J. Genet. Plant Breed. 2023, 59, 14–22. [Google Scholar] [CrossRef]
  5. Pedersen, P.; Lauer, J.G. Soybean growth and development in various management systems and planting dates. Crop Sci. 2004, 44, 508–515. [Google Scholar] [CrossRef]
  6. Shim, S.; Kim, M.Y.; Ha, J.; Lee, Y.-H.; Lee, S.-H. Identification of QTLs for branching in soybean (Glycine max (L.) Merrill). Euphytica 2017, 213, 225. [Google Scholar] [CrossRef]
  7. Agudamu; Yoshihira, T.; Shiraiwa, T. Branch development responses to planting density and yield stability in soybean cultivars. Plant Prod. Sci. 2016, 19, 331–339. [Google Scholar] [CrossRef]
  8. Modi, M.R.; Katochi, M.; Thakur, N.; Gautam, M.; Chodhary, S.; Chahota, R.K. Mapping of genomic regions associated with dwarfing and the determinate growth habit in horsegram (Macrotyloma uniflorum). Czech J. Genet. Plant Breed. 2023, 59, 196–204. [Google Scholar] [CrossRef]
  9. Kulkarni, S.R.; Balachandran, S.M.; Ulaganathan, K.; Balakrishnan, D.; Praveen, M.; Prasad, A.S.H.; Fiyaz, R.A.; Senguttuvel, P.; Sinha, P.; Kale, R.R.; et al. Molecular mapping of QTLs for yield related traits in recombinant inbred line (RIL) population derived from the popular rice hybrid KRH-2 and their validation through SNP genotyping. Sci. Rep. 2020, 10, 13695. [Google Scholar] [CrossRef]
  10. Yin, S.; Li, P.; Xu, Y.; Xue, L.; Hao, D.; Liu, J.; Yang, T.; Yang, Z.; Xu, C. Logistic model-based genetic analysis for kernel filling in a maize RIL population. Euphytica 2018, 214, 86. [Google Scholar] [CrossRef]
  11. Hu, J.; Wang, X.; Zhang, G.; Jiang, P.; Chen, W.; Hao, Y.; Ma, X.; Xu, S.; Jia, J.; Kong, L.; et al. QTL mapping for yield-related traits in wheat based on four RIL populations. Theor. Appl. Genet. 2020, 133, 917–933. [Google Scholar] [CrossRef]
  12. Chen, Q.-S.; Zhang, Z.-C.; Liu, C.-Y.; Xin, D.-W.; Qiu, H.-M.; Shan, D.-P.; Shan, C.-Y.; Hu, G.-H. QTL Analysis of Major Agronomic Traits in Soybean. Agric. Sci. China 2007, 6, 399–405. [Google Scholar] [CrossRef]
  13. Sayama, T.; Hwang, T.-Y.; Yamazaki, H.; Yamaguchi, N.; Komatsu, K.; Takahashi, M.; Suzuki, C.; Miyoshi, T.; Tanaka, Y.; Xia, Z.; et al. Mapping and comparison of quantitative trait loci for soybean branching phenotype in two locations. Breed. Sci. 2010, 60, 380–389. [Google Scholar] [CrossRef]
  14. Yang, Y.; Lei, Y.; Bai, z.; Wei, Y.; Zhang, R. QTL Mapping and integration as well as candidate gene prediction for branch number in soybean. bioRxiv 2019. [Google Scholar] [CrossRef]
  15. Ran, H.; Rongxia, G.; Zhangxiong, L.; Xiaoli, Z.; Ruzhen, C.; Lijuan, Q. Mapping the qBN-c1-1 Locus to LG C1 for Soybean Branching Using Residual Heterozygous Lines Derived from a Segregation Population. Sci. Agric. Sin. 2009, 42, 1152–1157. [Google Scholar]
  16. Zhongwen, H.; Tuanjie, Z.; Deyue, Y.; Shouyi, C.; Junyi, G. Detection of QTLs of Yield Related Traits in Soybean. Sci. Agric. Sin. 2009, 42, 4155–4165. [Google Scholar]
  17. Zhu-li, Y.; Gui-quan, L.I. The QTL Analysis of Important Agronomic Traits on a RIL Population from a Cross between Jinda52 and Jinda57. Acta Agric. Boreali-Sin. 2010, 25, 88–92. [Google Scholar]
  18. Yao, D.; Liu, Z.Z.; Zhang, J.; Liu, S.Y.; Qu, J.; Guan, S.Y.; Pan, L.D.; Wang, D.; Liu, J.W.; Wang, P.W. Analysis of quantitative trait loci for main plant traits in soybean. Genet. Mol. Res. 2015, 14, 6101–6109. [Google Scholar] [CrossRef]
  19. Zhang, H.; Hao, D.; Sitoe, H.M.; Yin, Z.; Hu, Z.; Zhang, G.; Yu, D. Genetic dissection of the relationship between plant architecture and yield component traits in soybean (Glycine max) by association analysis across multiple environments. Plant Breed. 2015, 134, 564–572. [Google Scholar] [CrossRef]
  20. Fang, C.; Ma, Y.; Wu, S.; Liu, Z.; Wang, Z.; Yang, R.; Hu, G.; Zhou, Z.; Yu, H.; Zhang, M.; et al. Genome-wide association studies dissect the genetic networks underlying agronomical traits in soybean. Genome Biol. 2017, 18, 161. [Google Scholar] [CrossRef]
  21. Shim, S.; Ha, J.; Kim, M.Y.; Choi, M.S.; Kang, S.-T.; Jeong, S.-C.; Moon, J.-K.; Lee, S.-H. GmBRC1 is a Candidate Gene for Branching in Soybean (Glycine max (L.) Merrill). Int. J. Mol. Sci. 2019, 20, 135. [Google Scholar] [CrossRef]
  22. Lamlom, S.F.; Zhang, Y.; Su, B.; Wu, H.; Zhang, X.; Fu, J.; Zhang, B.; Qiu, L.-J. Map-based cloning of a novel QTL qBN-1 influencing branch number in soybean [Glycine max (L.) Merr.]. Crop J. 2020, 8, 793–801. [Google Scholar] [CrossRef]
  23. Liang, Q.; Chen, L.; Yang, X.; Yang, H.; Liu, S.; Kou, K.; Fan, L.; Zhang, Z.; Duan, Z.; Yuan, Y.; et al. Natural variation of Dt2 determines branching in soybean. Nat. Commun. 2022, 13, 6429. [Google Scholar] [CrossRef] [PubMed]
  24. Shen, Y.; Zhou, Z.; Wang, Z.; Li, W.; Fang, C.; Wu, M.; Ma, Y.; Liu, T.; Kong, L.-A.; Peng, D.-L.; et al. Global Dissection of Alternative Splicing in Paleopolyploid Soybean. Plant Cell 2014, 26, 996–1008. [Google Scholar] [CrossRef] [PubMed]
  25. Huang, X. Sowing Date and Planting Density on Growth and Development of Spring Soybean in Southern Xinjiang. Master’s Thesis, Tarim University, Xinjiang, China, 2023. [Google Scholar]
  26. Wu, Y.; Wang, E.; Gong, W.; Xu, L.; Zhao, Z.; He, D.; Yang, F.; Wang, X.; Yong, T.; Liu, J.; et al. Soybean yield variations and the potential of intercropping to increase production in China. Field Crop Res. 2023, 291, 108771. [Google Scholar] [CrossRef]
  27. Ghodrati, G. Study of genetic variation and broad sense heritability for some qualitative and quantitative traits in soybean (Glycine max L.) genotypes. Agric. Food Sci. 2013, 2, 31–35. [Google Scholar]
  28. Schmutz, J.; Cannon, S.B.; Schlueter, J.; Ma, J.; Mitros, T.; Nelson, W.; Hyten, D.L.; Song, Q.; Thelen, J.J.; Cheng, J.; et al. Genome sequence of the palaeopolyploid soybean. Nature 2010, 463, 178–183. [Google Scholar] [CrossRef]
  29. Komatsu, M.; Maekawa, M.; Shimamoto, K.; Kyozuka, J. The LAX1 and FRIZZY PANICLE 2 Genes Determine the Inflorescence Architecture of Rice by Controlling Rachis-Branch and Spikelet Development. Dev. Biol. 2001, 231, 364–373. [Google Scholar] [CrossRef]
  30. Staswick, P.E.; Serban, B.; Rowe, M.; Tiryaki, I.; Maldonado, M.n.T.; Maldonado, M.C.; Suza, W. Characterization of an Arabidopsis Enzyme Family That Conjugates Amino Acids to Indole-3-Acetic Acid. Plant Cell 2005, 17, 616–627. [Google Scholar] [CrossRef]
  31. Zou, X.; Long, J.; Zhao, K.; Peng, A.; Chen, M.; Long, Q.; He, Y.; Chen, S. Overexpressing GH3.1 and GH3.1L reduces susceptibility to Xanthomonas citri subsp. citri by repressing auxin signaling in citrus (Citrus sinensis Osbeck). PLoS ONE 2019, 14, e0220017. [Google Scholar] [CrossRef]
  32. Weiste, C.; Pedrotti, L.; Selvanayagam, J.; Muralidhara, P.; Fröschel, C.; Novák, O.; Ljung, K.; Hanson, J.; Dröge-Laser, W. The Arabidopsis bZIP11 transcription factor links low-energy signalling to auxin-mediated control of primary root growth. PLOS Genet. 2017, 13, e1006607. [Google Scholar] [CrossRef] [PubMed]
  33. E, Z.G.; Zhang, Y.P.; Zhou, J.H.; Wang, L. Roles of the bZIP gene family in rice. Genet. Mol. Res. 2014, 13, 3025–3036. [Google Scholar] [CrossRef] [PubMed]
  34. Li, H.; Durbin, R. Fast and accurate short read alignment with Burrows–Wheeler transform. Bioinformatics 2009, 25, 1754–1760. [Google Scholar] [CrossRef]
  35. McKenna, A.; Hanna, M.; Banks, E.; Sivachenko, A.; Cibulskis, K.; Kernytsky, A.; Garimella, K.; Altshuler, D.; Gabriel, S.; Daly, M.; et al. The Genome Analysis Toolkit: A MapReduce framework for analyzing next-generation DNA sequencing data. Genome Res. 2010, 20, 1297–1303. [Google Scholar] [CrossRef]
  36. Wang, K.; Li, M.; Hakonarson, H. ANNOVAR: Functional annotation of genetic variants from high-throughput sequencing data. Nucleic Acids Res. 2010, 38, e164. [Google Scholar] [CrossRef]
  37. Huang, M.; Liu, X.; Zhou, Y.; Summers, R.M.; Zhang, Z. BLINK: A package for the next level of genome-wide association studies with both individuals and markers in the millions. GigaScience 2018, 8, giy154. [Google Scholar] [CrossRef] [PubMed]
  38. Lipka, A.E.; Tian, F.; Wang, Q.; Peiffer, J.; Li, M.; Bradbury, P.J.; Gore, M.A.; Buckler, E.S.; Zhang, Z. GAPIT: Genome association and prediction integrated tool. Bioinformatics 2012, 28, 2397–2399. [Google Scholar] [CrossRef]
  39. Patterson, N.; Price, A.L.; Reich, D. Population Structure and Eigenanalysis. PLOS Genet. 2006, 2, e190. [Google Scholar] [CrossRef]
  40. Ren, W.; Zhao, L.; Liang, J.; Wang, L.; Chen, L.; Li, P.; Liu, Z.; Li, X.; Zhang, Z.; Li, J.; et al. Genome-wide dissection of changes in maize root system architecture during modern breeding. Nat. Plants 2022, 8, 1408–1422. [Google Scholar] [CrossRef]
  41. Yin, L.; Zhang, H.; Tang, Z.; Xu, J.; Yin, D.; Zhang, Z.; Yuan, X.; Zhu, M.; Zhao, S.; Li, X.; et al. rMVP: A Memory-efficient, Visualization-enhanced, and Parallel-accelerated Tool for Genome-wide Association Study. Genom. Proteom. Bioinf. 2021, 19, 619–628. [Google Scholar] [CrossRef] [PubMed]
  42. Fekih, R.; Takagi, H.; Tamiru, M.; Abe, A.; Natsume, S.; Yaegashi, H.; Sharma, S.; Sharma, S.; Kanzaki, H.; Matsumura, H.; et al. MutMap+: Genetic Mapping and Mutant Identification without Crossing in Rice. PLoS ONE 2013, 8, e68529. [Google Scholar] [CrossRef] [PubMed]
  43. Hill, J.T.; Demarest, B.L.; Bisgrove, B.W.; Gorsi, B.; Su, Y.-C.; Yost, H.J. MMAPPR: Mutation Mapping Analysis Pipeline for Pooled RNA-seq. Genome Res. 2013, 23, 687–697. [Google Scholar] [CrossRef] [PubMed]
  44. Fu, F.; Liu, X.; Wang, R.; Zhai, C.; Peng, G.; Yu, F.; Fernando, W.G.D. Fine mapping of Brassica napus blackleg resistance gene Rlm1 through bulked segregant RNA sequencing. Sci. Rep. 2019, 9, 14600. [Google Scholar] [CrossRef] [PubMed]
  45. Zhang, J.; Panthee, D.R. Next-generation sequencing-based bulked segregant analysis without sequencing the parental genomes. G3—Genes Genom. Genet. 2021, 12, jkab400. [Google Scholar] [CrossRef]
  46. He, L.; Li, M.; Chen, D.D.; Qian, Q.; Zeng, D.L.; Zhu, L. Rice Ferredoxins localize to chloroplasts/plastids and may function in different tissues. Plant Signal. Behav. 2021, 16, 1926813. [Google Scholar] [CrossRef]
Figure 1. Frequency distribution of branch numbers. Frequency distribution of branch numbers in 2022 (A), and 2023 (B) throughout the association panel, and October (C), and November (D) throughout the F2 population. The curve indicates the standard normal curve based on the phenotypic distribution.
Ijms 25 00873 g001
Figure 2. Manhattan and quantile–quantile plots of SNPs significantly linked to branch number using various models. (A) Bayesian information and Linkage-disequilibrium Iteratively Nested Keyway (BLINK) in 2022. (B) Mixed linear model (MLM) in 2022. (C) BLINK in 2023. (D) MLM in 2023.Manhattan plots: Different colors within the Manhattan plots represent different chromosomes across soybeans. The X-axis is the genomic position of the SNPs in the genome, and the Y-axis is the negative log base 10 of the p-values. The red horizontal line indicates the significance level. QQ plot: the Y-axis is the observed negative base 10 logarithm of the p-values, and the X-axis is the expected observed negative base 10 logarithm of the p-values. The red line represents the 45° centerline, and the gray area is the 95% confidence interval of the scattered points.
Ijms 25 00873 g002
Figure 3. Information of candidate loci across ten chromosomes based on BSA results. Distribution of Δ(SNP-index) (A), ED2 value (B), G′ value (C) and log-transformed Fisher’s exact test p-value distribution, –log10(p) (D) on soybean chromosomes. The scatter plot represents the original values, green and orange are used to distinguish chromosomes, and the black curve represents the fitted values. The blue line represents the 95% confidence interval, and the red line represents the 99% confidence interval, respectively.
Ijms 25 00873 g003
Figure 4. Gene enrichment analysis based on the BSA results. (A) Gene ontology enrichment using the top 20 significant terms. (B) KEGG pathway enrichment by using the top 20 significant pathways.
Ijms 25 00873 g004
Figure 5. RT-qPCR analysis of candidate genes. RT-qPCR analysis of candidate genes throughout different tissues of Ruidou 1 and Wandou 35. S4–S13 indicates different developmental stages of soybeans, as outlined by Shen [24]. S4, leaf bud at the germination stage; S5, leaf bud at the trefoil stage; S6, leaf at the trefoil stage; S9, leaf bud at the flower bud differentiation stage; S11, flower bud at flower bud differentiation stage; S12, shoot meristem at flower bud differentiation stage; S13, flower bud at the flowering stage before flowering.
Ijms 25 00873 g005
Table 1. Descriptive statistics for branch number of soybeans across the association mapping panel.
YearMeanSDCV (%)MinMaxKurtSkew
20223.181.2840.250.178.330.930.64
20235.202.0739.820.6710.170.640.93
Table 2. QTL and SNPs significantly linked to soybean branch number.
QTLSNPChromosomePositionp ValueR2Allelic VariationYearMethod
qGBN1S01_6470601375000284.69 × 10−711.65C/T2022MLM
S01_6470581374999944.79 × 10−69.82T/C2022MLM
qGBN2S11_3836021209965715.00 × 10−69.51T/A2022BLINK
qGBN3S02_12407042122647576.94 × 10−1427.18A/G2022BLINK
S02_12413532123240641.87 × 10−814.17C/T2022BLINK
S02_12407042122647572.99 × 10−69.77 2022MLM
S02_12407042122647575.56 × 10−69.32 2023MLM
S02_12407042122647578.57 × 10−69.25 2023BLINK
qGBN4S05_38937795111226035.02 × 10−69.55T/C2023BLINK
S05_38937795111226038.31 × 10−69.27 2023MLM
qGBN5S06_47721426235763586.07 × 10−69.66C/A2023BLINK
qGBN6S06_51372356443804118.54 × 10−69.25G/A2022BLINK
qGBN7S10_820332010333376279.46 × 10−914.86G/T2023BLINK
qGBN8S10_78045441085516865.73 × 10−69.30A/T2022BLINK
qGBN9S11_884903711225931472.81 × 10−915.85T/A2022BLINK
qGBN10S12_938837612137375933.51 × 10−712.17C/T2022BLINK
qGBN11S13_1027438013216825944.83 × 10−69.82G/A2022BLINK
qGBN12S14_1092187914139462649.64 × 10−69.25G/A2022BLINK
qGBN13S15_1253319915507701189.67 × 10−69.16A/G2022BLINK
qGBN14S16_1290315816165294393.82 × 10−610.02G/C2022BLINK
qGBN15S17_1396700317353442667.99 × 10−69.27C/A2022BLINK
qGBN16S18_1453596418209840585.30 × 10−69.51A/G2022BLINK
Table 3. QTLs linked to branch numbers identified using BSA-seq based on four methods.
QTLsChromosomeStart Position
(bp)
End Position
(bp)
PeakMethod
qBBN1Gm0211420001150200000.559684ED
Gm02114400011507000022.53829Gst
Gm0211530001150200000.517047Δ(SNP-index)
Gm0212280001133600000.003283Fisher
qBBN2Gm0585800011066000011.91817Gst
Gm059270001104300000.340816ED
qBBN3Gm05114500011297000011.65613Gst
Gm0511460001128500000.348614ED
Gm051157000112570000−0.37708Δ(SNP-index)
qBBN4Gm05162100011871000011.9553Gst
Gm0516210001189400000.411016ED
Gm051621000118910000−0.4334Δ(SNP-index)
qBBN5Gm052260000123850000−0.37968Δ(SNP-index)
Gm0522830001238800000.329834ED
qBBN6Gm0525240001272300000.383032ED
Gm052574000126750000−0.39135Δ(SNP-index)
Gm05260700012723000010.96294Gst
qBBN7Gm0527540001292800000.374127ED
Gm05278500012933000013.24474Gst
Gm052785000129220000−0.41289Δ(SNP-index)
qBBN8Gm06470200014827000011.02317Gst
Gm0647060001482400000.326973ED
qBBN9Gm1343170001442000000.325159ED
qBBN10Gm15449100014648000011.18481Gst
qBBN11Gm15513600015314000013.02159Gst
qBBN12Gm1632020001338900000.324992ED
Gm16324900013413000010.81712Gst
qBBN13Gm1636050001374700000.35877ED
Gm16361700013744000011.15172Gst
qBBN14Gm201984000120840000−0.38348Δ(SNP-index)
qBBN15Gm2023160001258500000.361823ED
Gm20233300012447000010.97986Gst
qBBN16Gm20246200012585000011.71612Gst
Gm202462000125660000−0.39685Δ(SNP-index)
qBBN17Gm2025860001277300000.381719ED
Gm20260200012761000013.35137Gst
Gm202617000127320000−0.39762Δ(SNP-index)
qBBN18Gm20314200013242000011.04967Gst
Gm2031420001324200000.341994ED
Table 4. Annotated genes from GWAS and BAS-seq co-located intervals.
GeneIDStart Position
(bp)
End Position
(bp)
SymbolAnnotation
Glyma.02G1251001222010712224403SRG12-oxoglutarate/Fe(II)-dependent dioxygenase-like
Glyma.02G1252001222617912230868BHLH49Transcription factor bHLH49 isoform X1
Glyma.02G1253001222990212230859--
Glyma.02G1254001224660012253822WIT2WPP domain-interacting tail-anchored protein 2-like isoform X4
Glyma.02G1255001226803012268302--
Glyma.02G1255511227925812279410--
Glyma.02G1256001230223712304986GH3.1Indole-3-acetic acid-amido synthetase GH3.1
Glyma.02G1257001230669712309236--
Glyma.02G1258001231443812315067--
Glyma.02G1259001231726912318465--
Glyma.02G1260001232154212323547IRT2Fe(2+) transport protein 1
Glyma.02G1261001236844012371047BZIP43Basic leucine zipper transcription factor-like protein
Glyma.02G1262001237575012376682--
Glyma.02G1263001238819512394795CPN60B4RuBisco large subunit-binding protein subunit beta
Glyma.02G1265001241232012413154SNAT2Serotonin N-acetyltransferase 2, chloroplastic
Disclaimer/Publisher’s Note: The statements, opinions and data contained in all publications are solely those of the individual author(s) and contributor(s) and not of MDPI and/or the editor(s). MDPI and/or the editor(s) disclaim responsibility for any injury to people or property resulting from any ideas, methods, instructions or products referred to in the content.

