
microRNA Detection via Nanostructured Biochips for Early Cancer Diagnostics
 , , , ,
  ,
,  and
and
Abstract
:1. Introduction
2. Role of miRNAs as Cancer Biomarkers and Gold Standard Techniques for Their Detection
2.1. Northern Blotting
2.2. Real-Time Quantitative Polymerase Chain Reaction (RT-qPCR)
2.3. Microarrays
2.4. miRNA-seq or Small RNA-seq
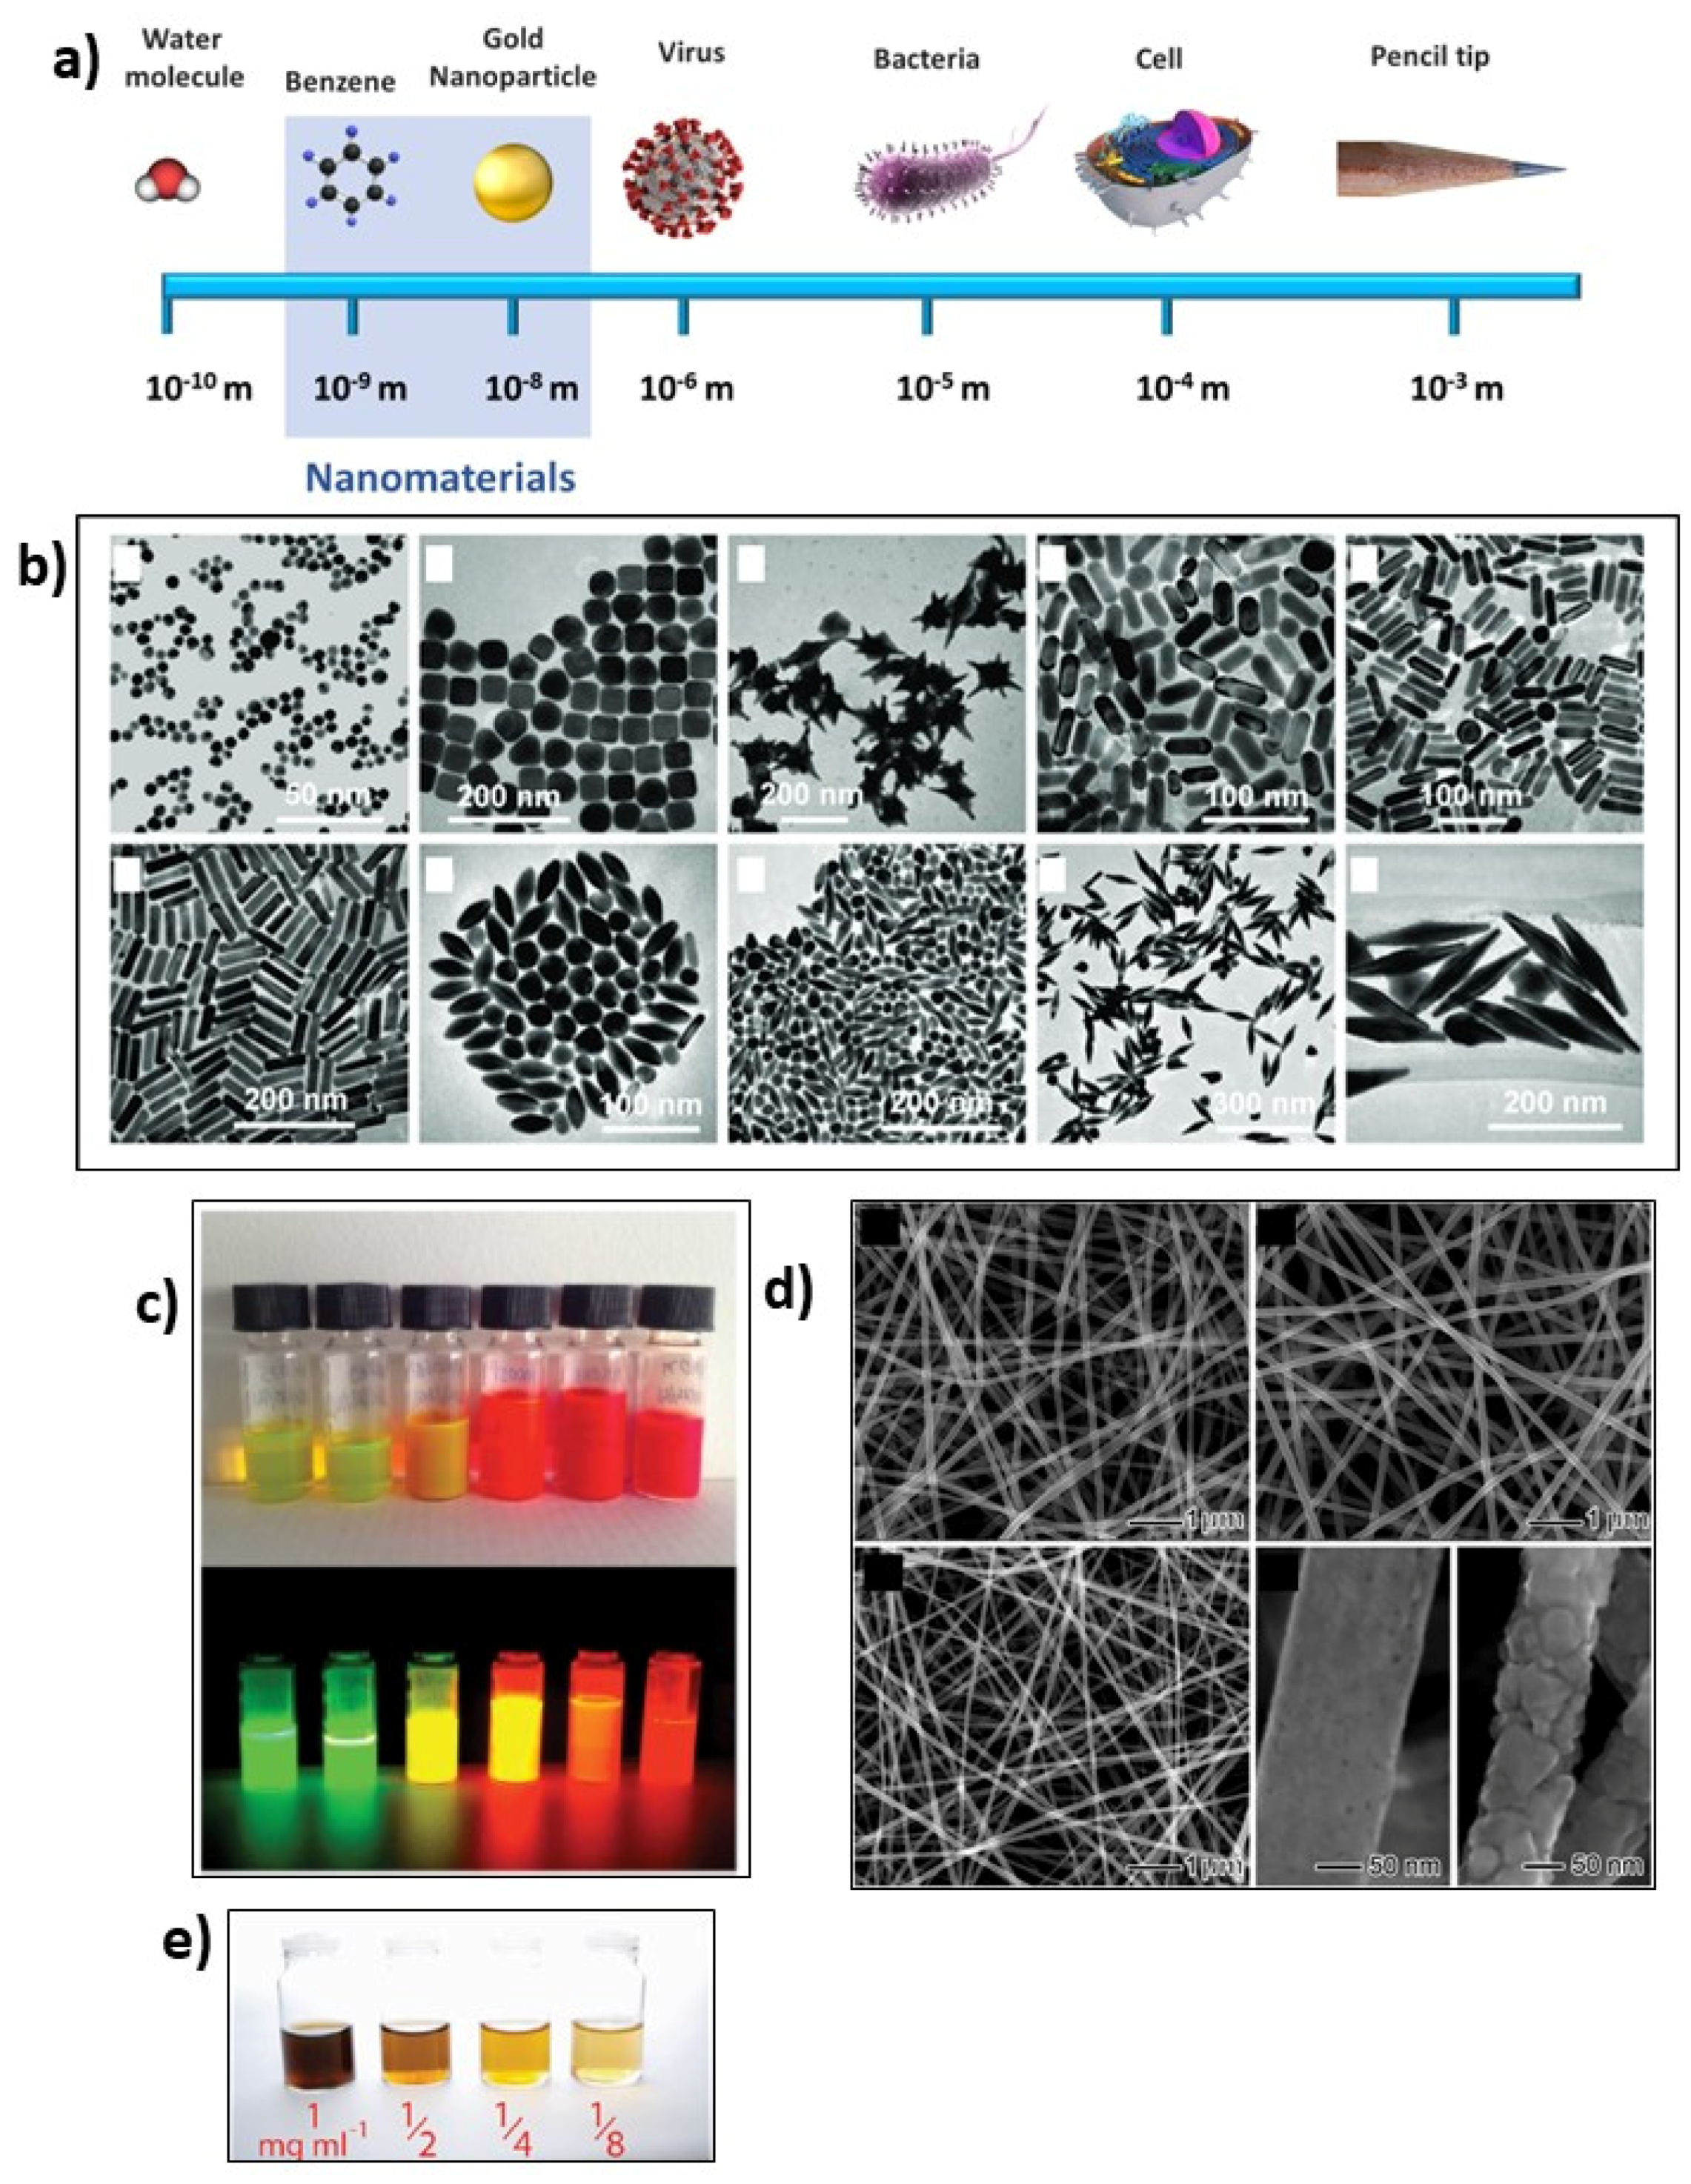
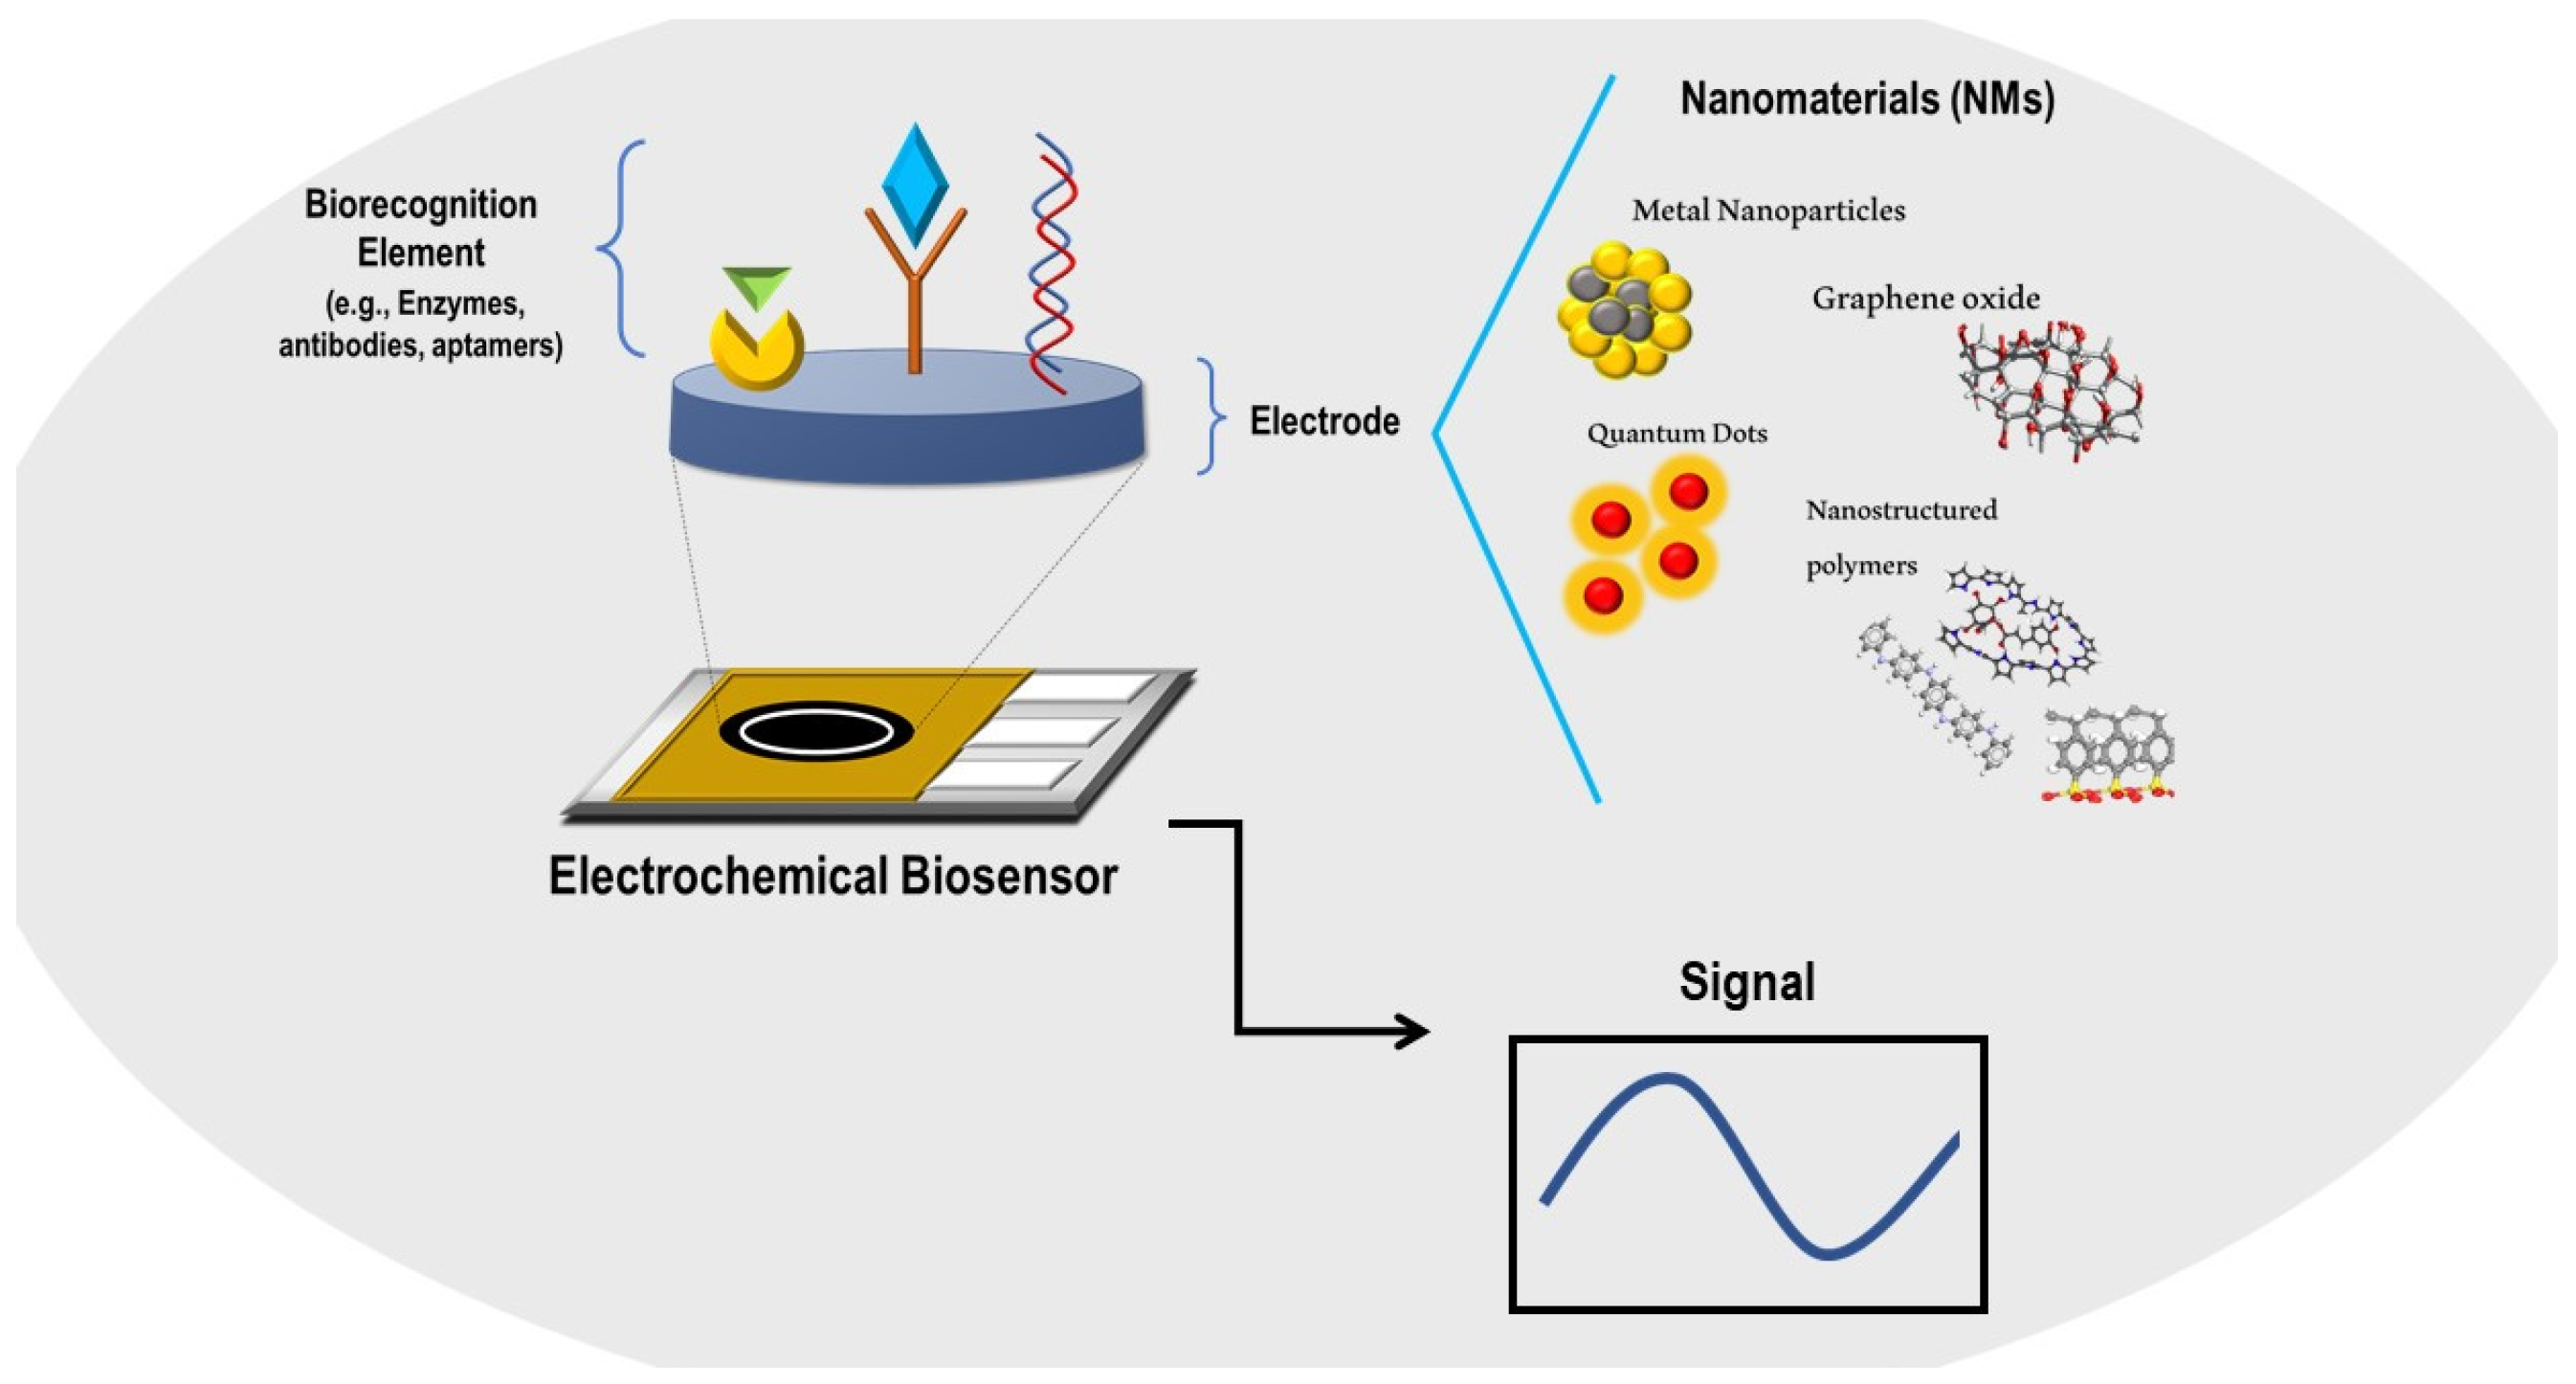
3. Nanostructured Biosensors and Nanomaterials
- -
- Zero-dimensional (0-D): the three dimensions are in the nanoscale range;
- -
- One-dimensional (1-D): just one (of the three) dimension is in the nanoscale range;
- -
- Two-dimensional (2-D): two (of the three) are in the nanoscale range;
- -
- Three-dimensional (3-D): bulky material, not in the nanoscale range [64].


| Nanomaterials (Nms) | Classification Based on Dimension | Chemical Structures | Properties | Detection Strategy | Advantages | References |
|---|---|---|---|---|---|---|
| Metallic Nanoparticles (MNPs) | Zero-dimensional (0-D) | Noble metal such as gold (Au) and silver (Ag), but also inorganic metal (e.g., copper Cu, platinum Pt) or metal oxide (magnetite Fe3O4) | Biocompatibility, antibacterial, conductive, and optical properties | Electrochemical, optical | Optimized synthesis process, easy surface functionalization, large surface area–volume ratio | [64,73,81,82,83,84,85,86,87,88,89,90] |
| Graphene Oxide (GO) | Two-dimensional (2-D) | Several surface functional groups: epoxy, hydroxyl, and carboxyl | Thermal, mechanical, electric, and electrochemical properties | Electrochemical, optical | Easy functionalization process | [64,74,91,92] |
| Quantum Dots (QDs) | Zero-dimensional (0-D) | Semiconductor nanocrystals usually composed by II-VI group elements (Cd, Se, S, Te) and III-V group elements (In, P, As) and IV-VI group elements (Pb, Se) | Optical and conductive properties | Electrochemical, optical | Large surface area–volume ratio | [64,75,93,94] |
| Nanostructured Polymers | One-dimensional (1-D), Two-dimensional (2-D), Three-dimensional (3-D) | Mixtures of different polymers, low molecular weight chemical compounds, colloidal nanocrystals, carbon nanotubes, etc., incorporated in nanofibers or polymeric matrix | Conductivity, biocompatibility, mechanical, thermal, electronic, optical, and magnetic properties | Electrochemical, optical | Large surface area–volume ratio, fast mass-transport, easy functionalization, easy combination with nanoparticles and other NMs | [64,76,95,96,97] |
4. MiRNA Detection via Nanostructured Biosensor: Molecular Amplification Techniques
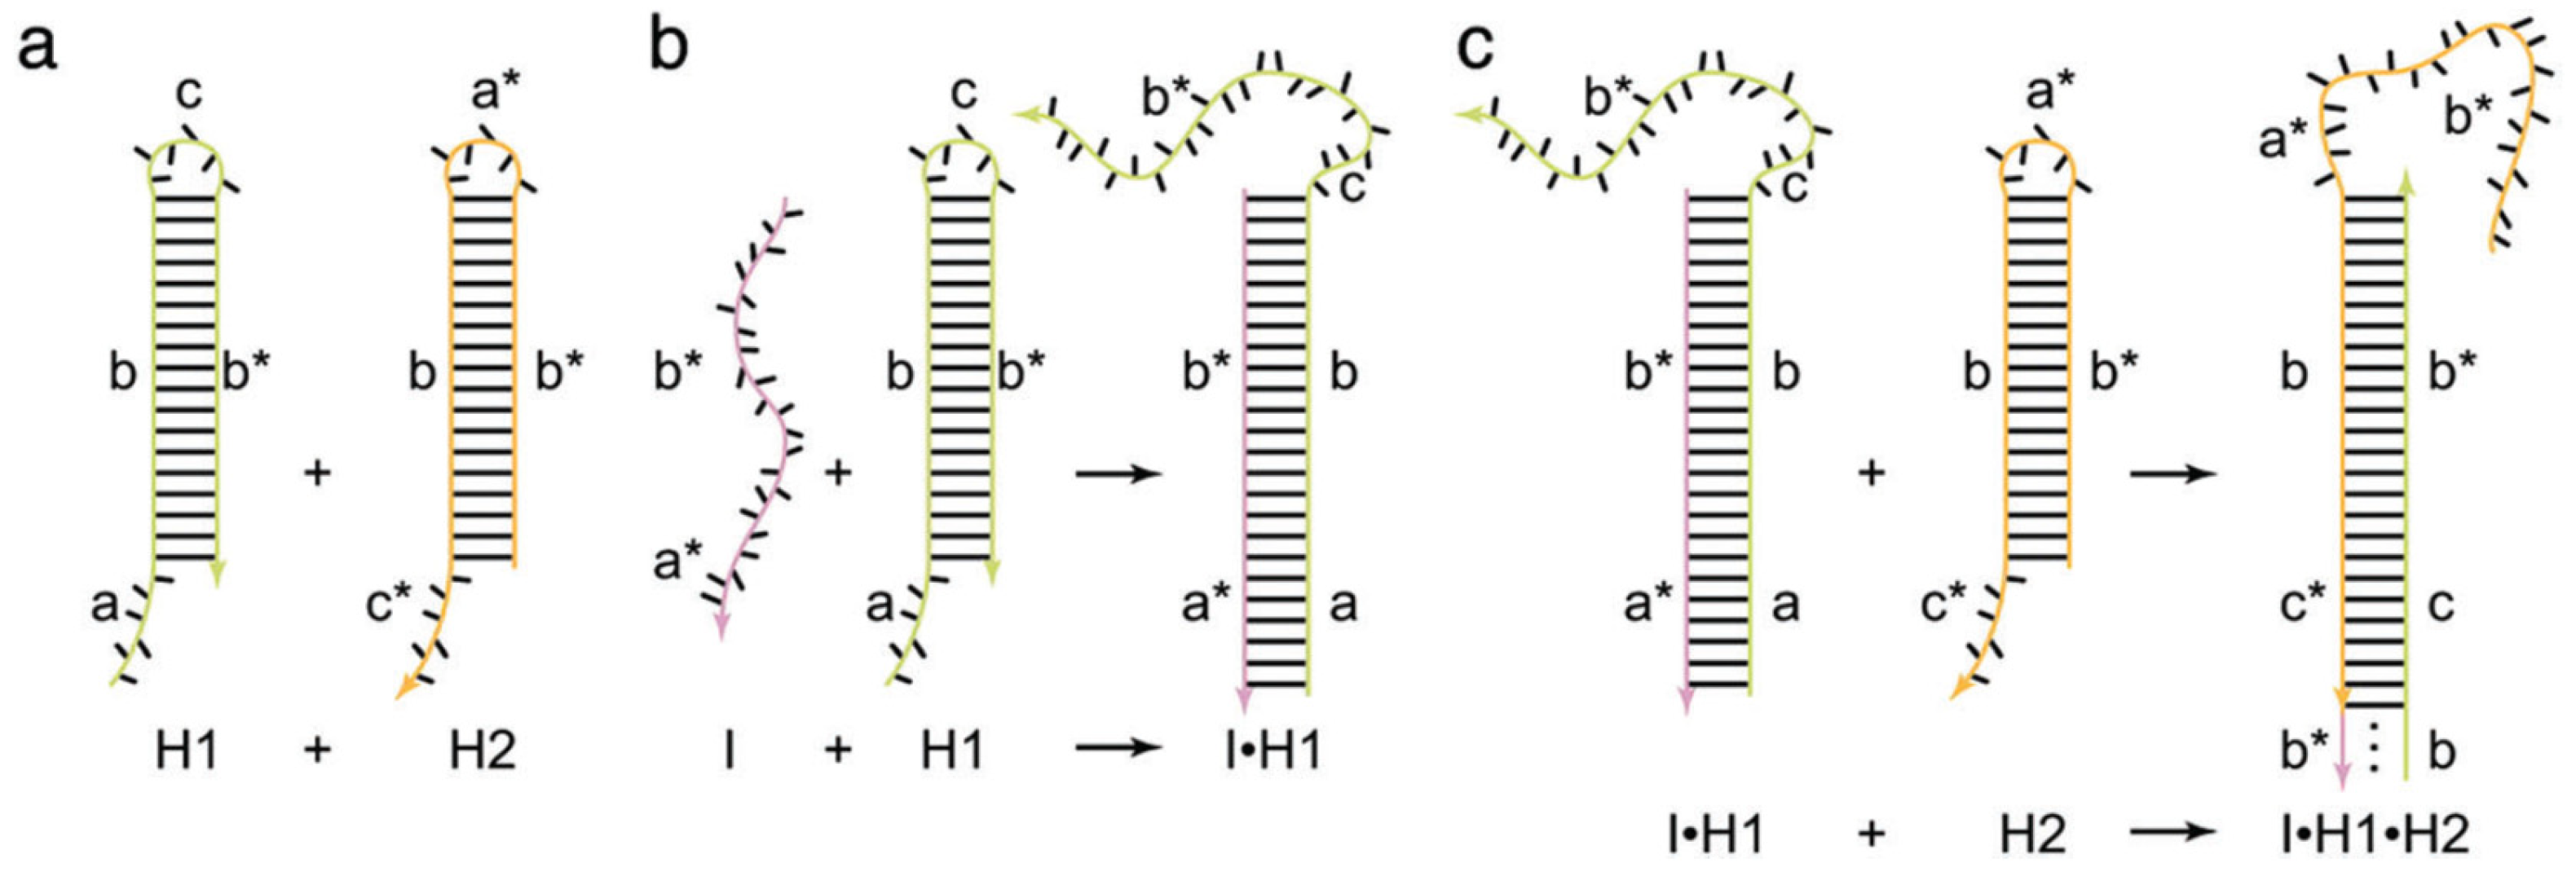
4.1. Hybridization Chain Reaction
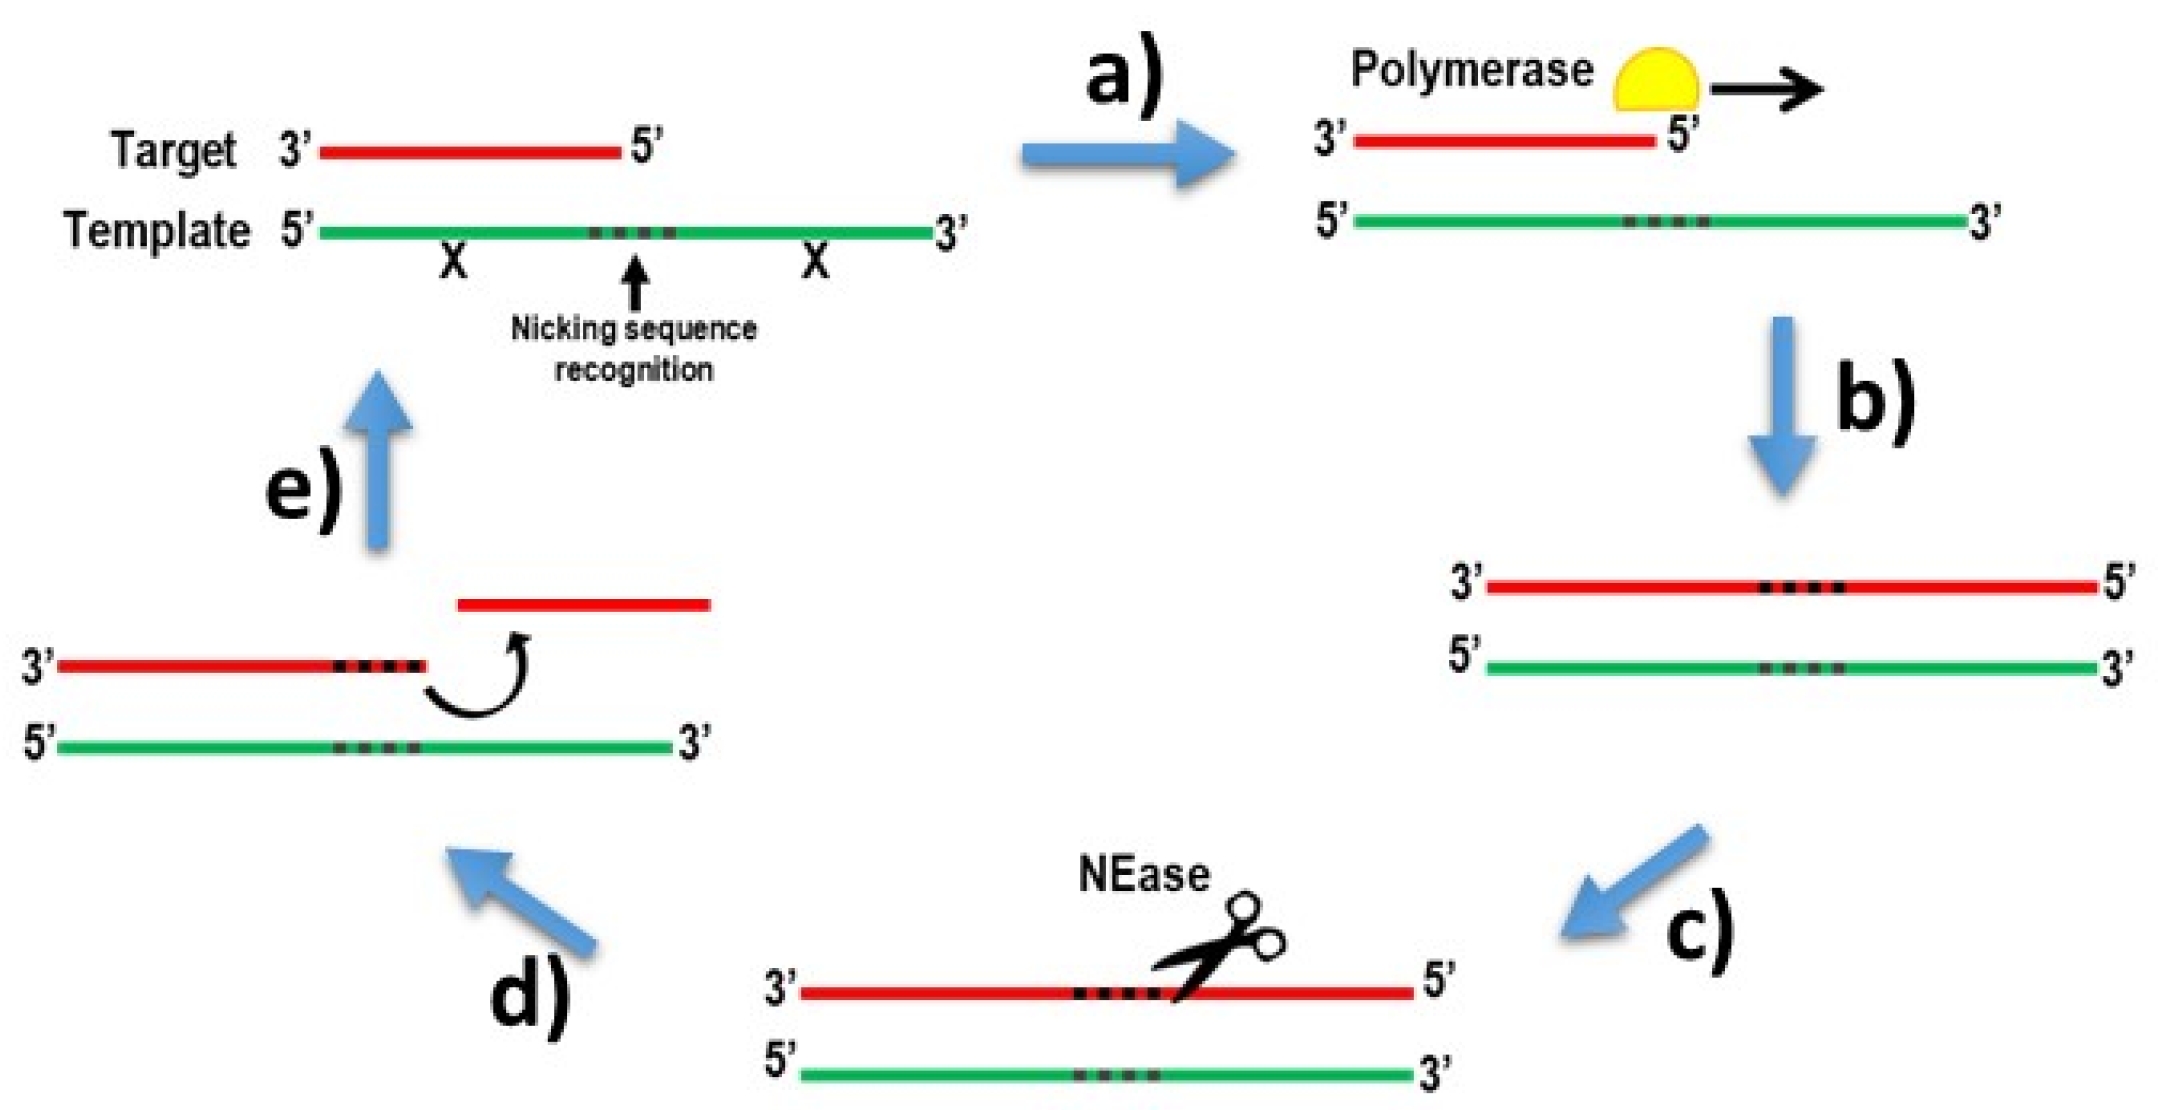
4.1.1. Exponential Amplification Reaction
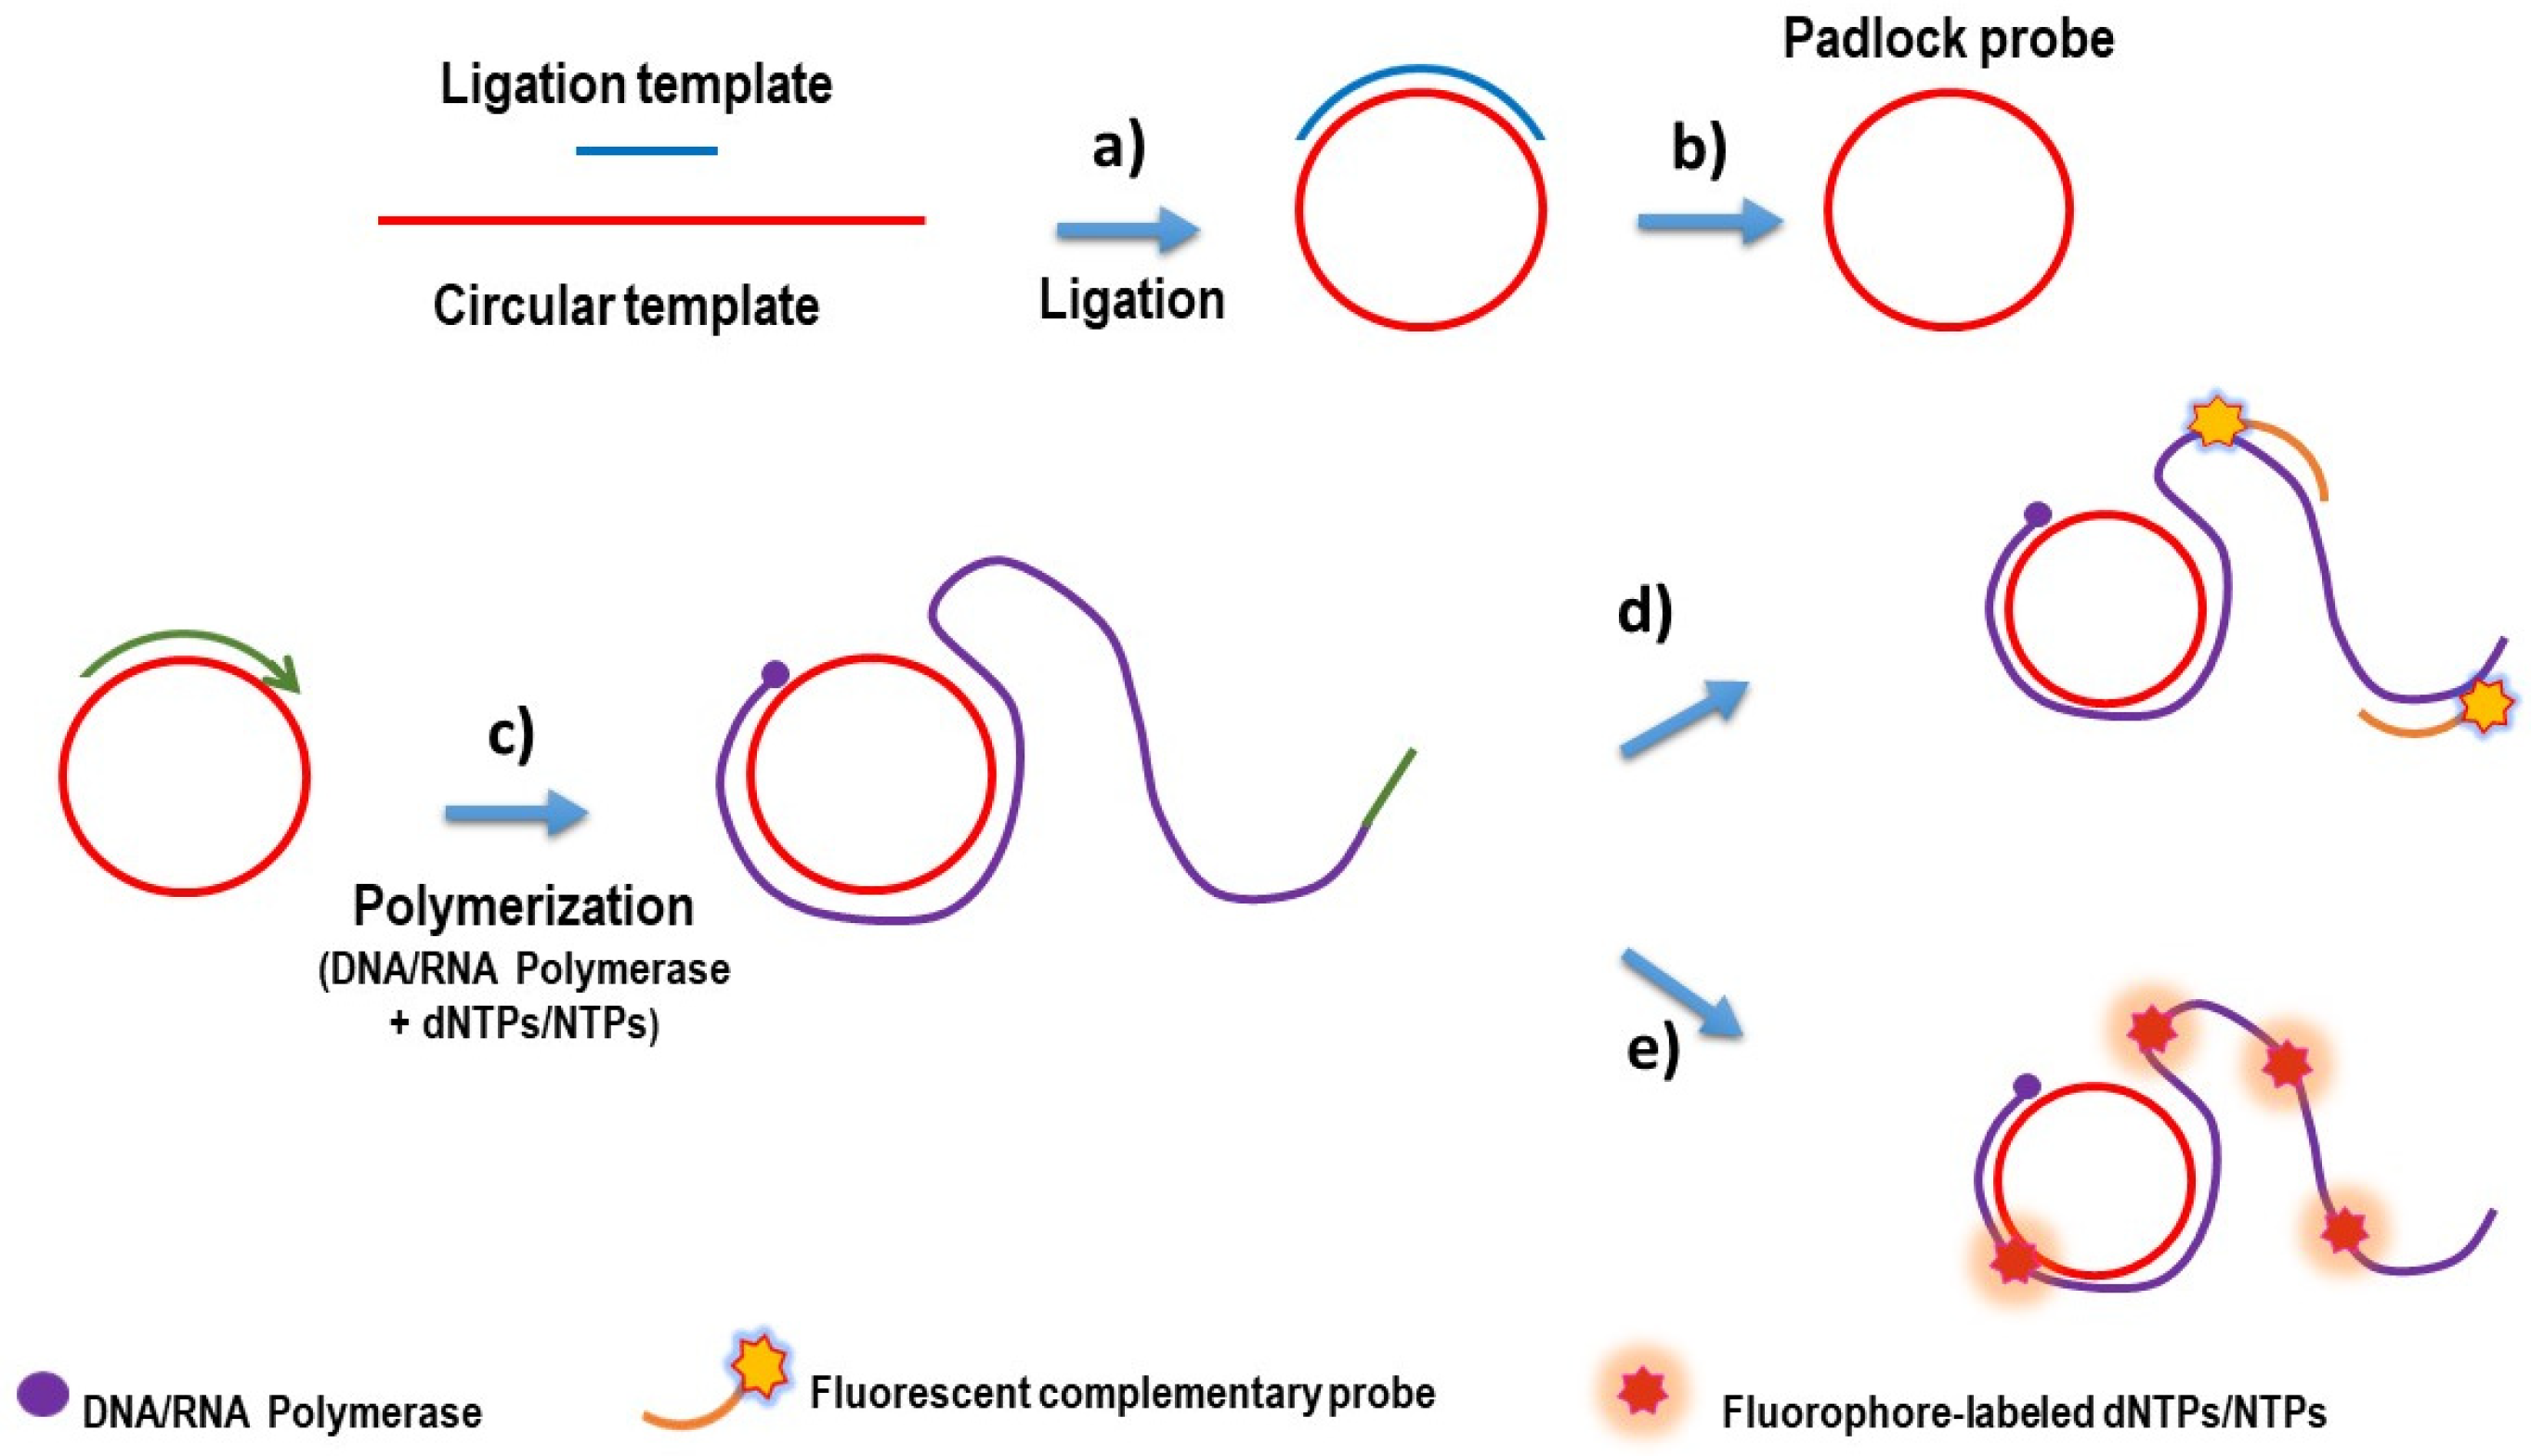
4.1.2. Rolling Cycle Amplification
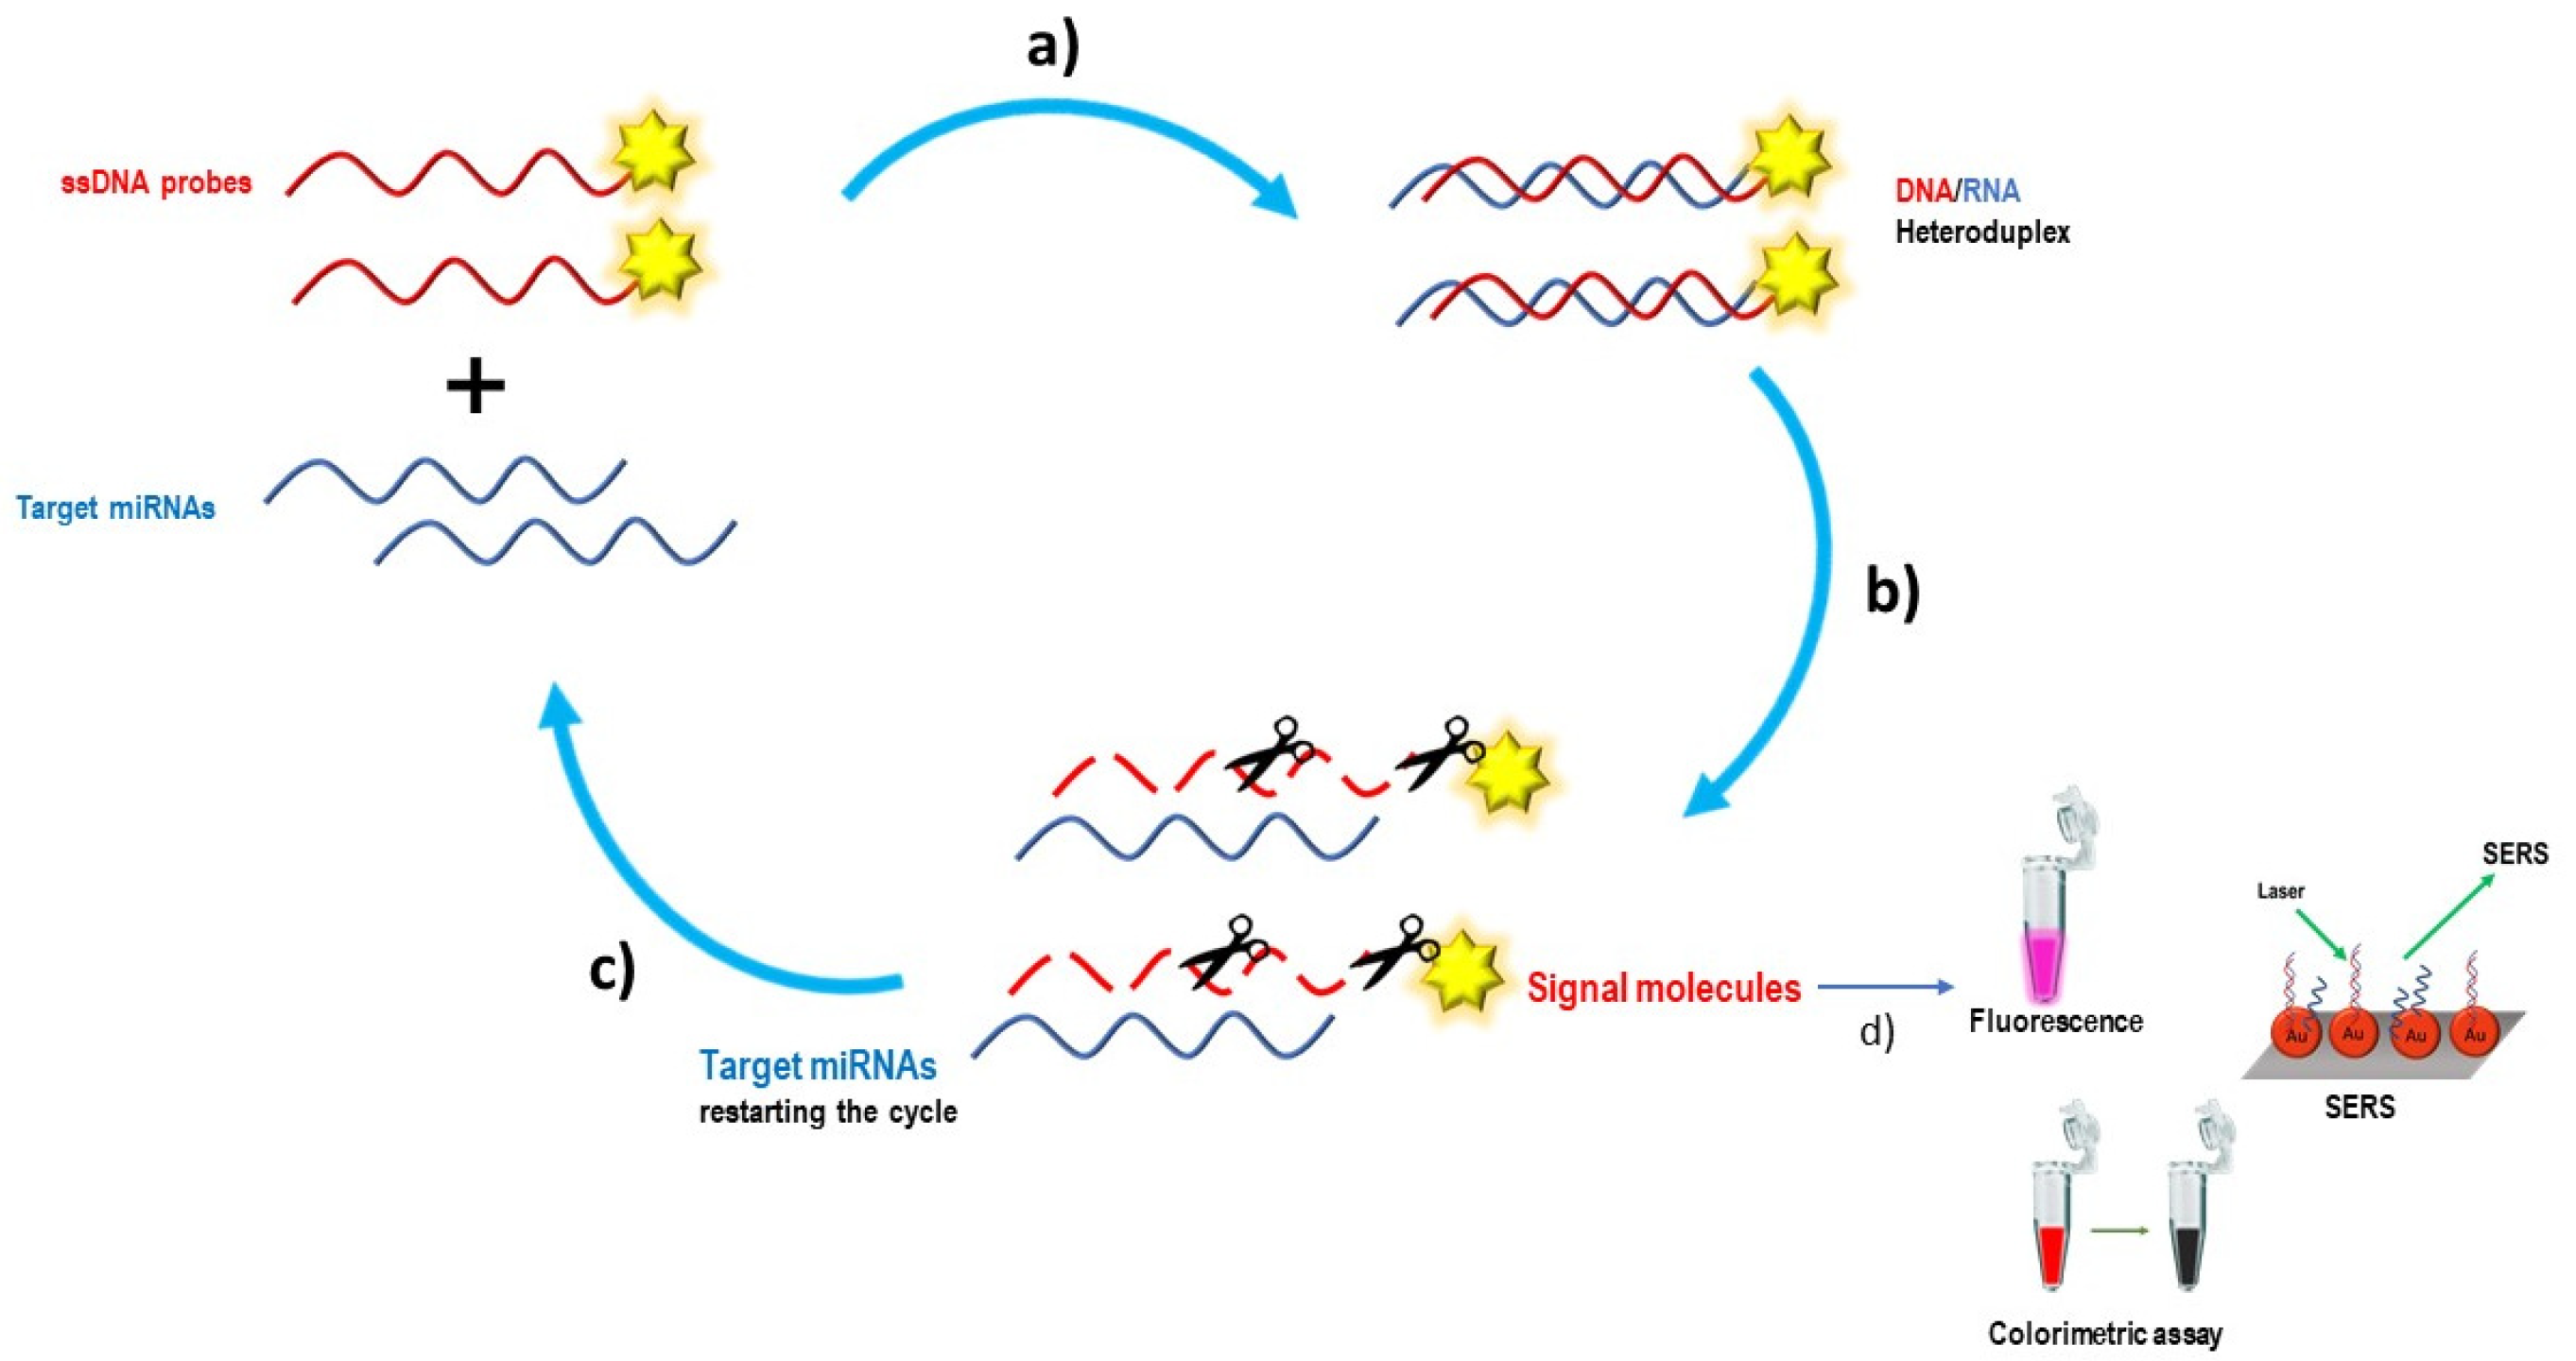
4.1.3. Duplex-Specific Nuclease
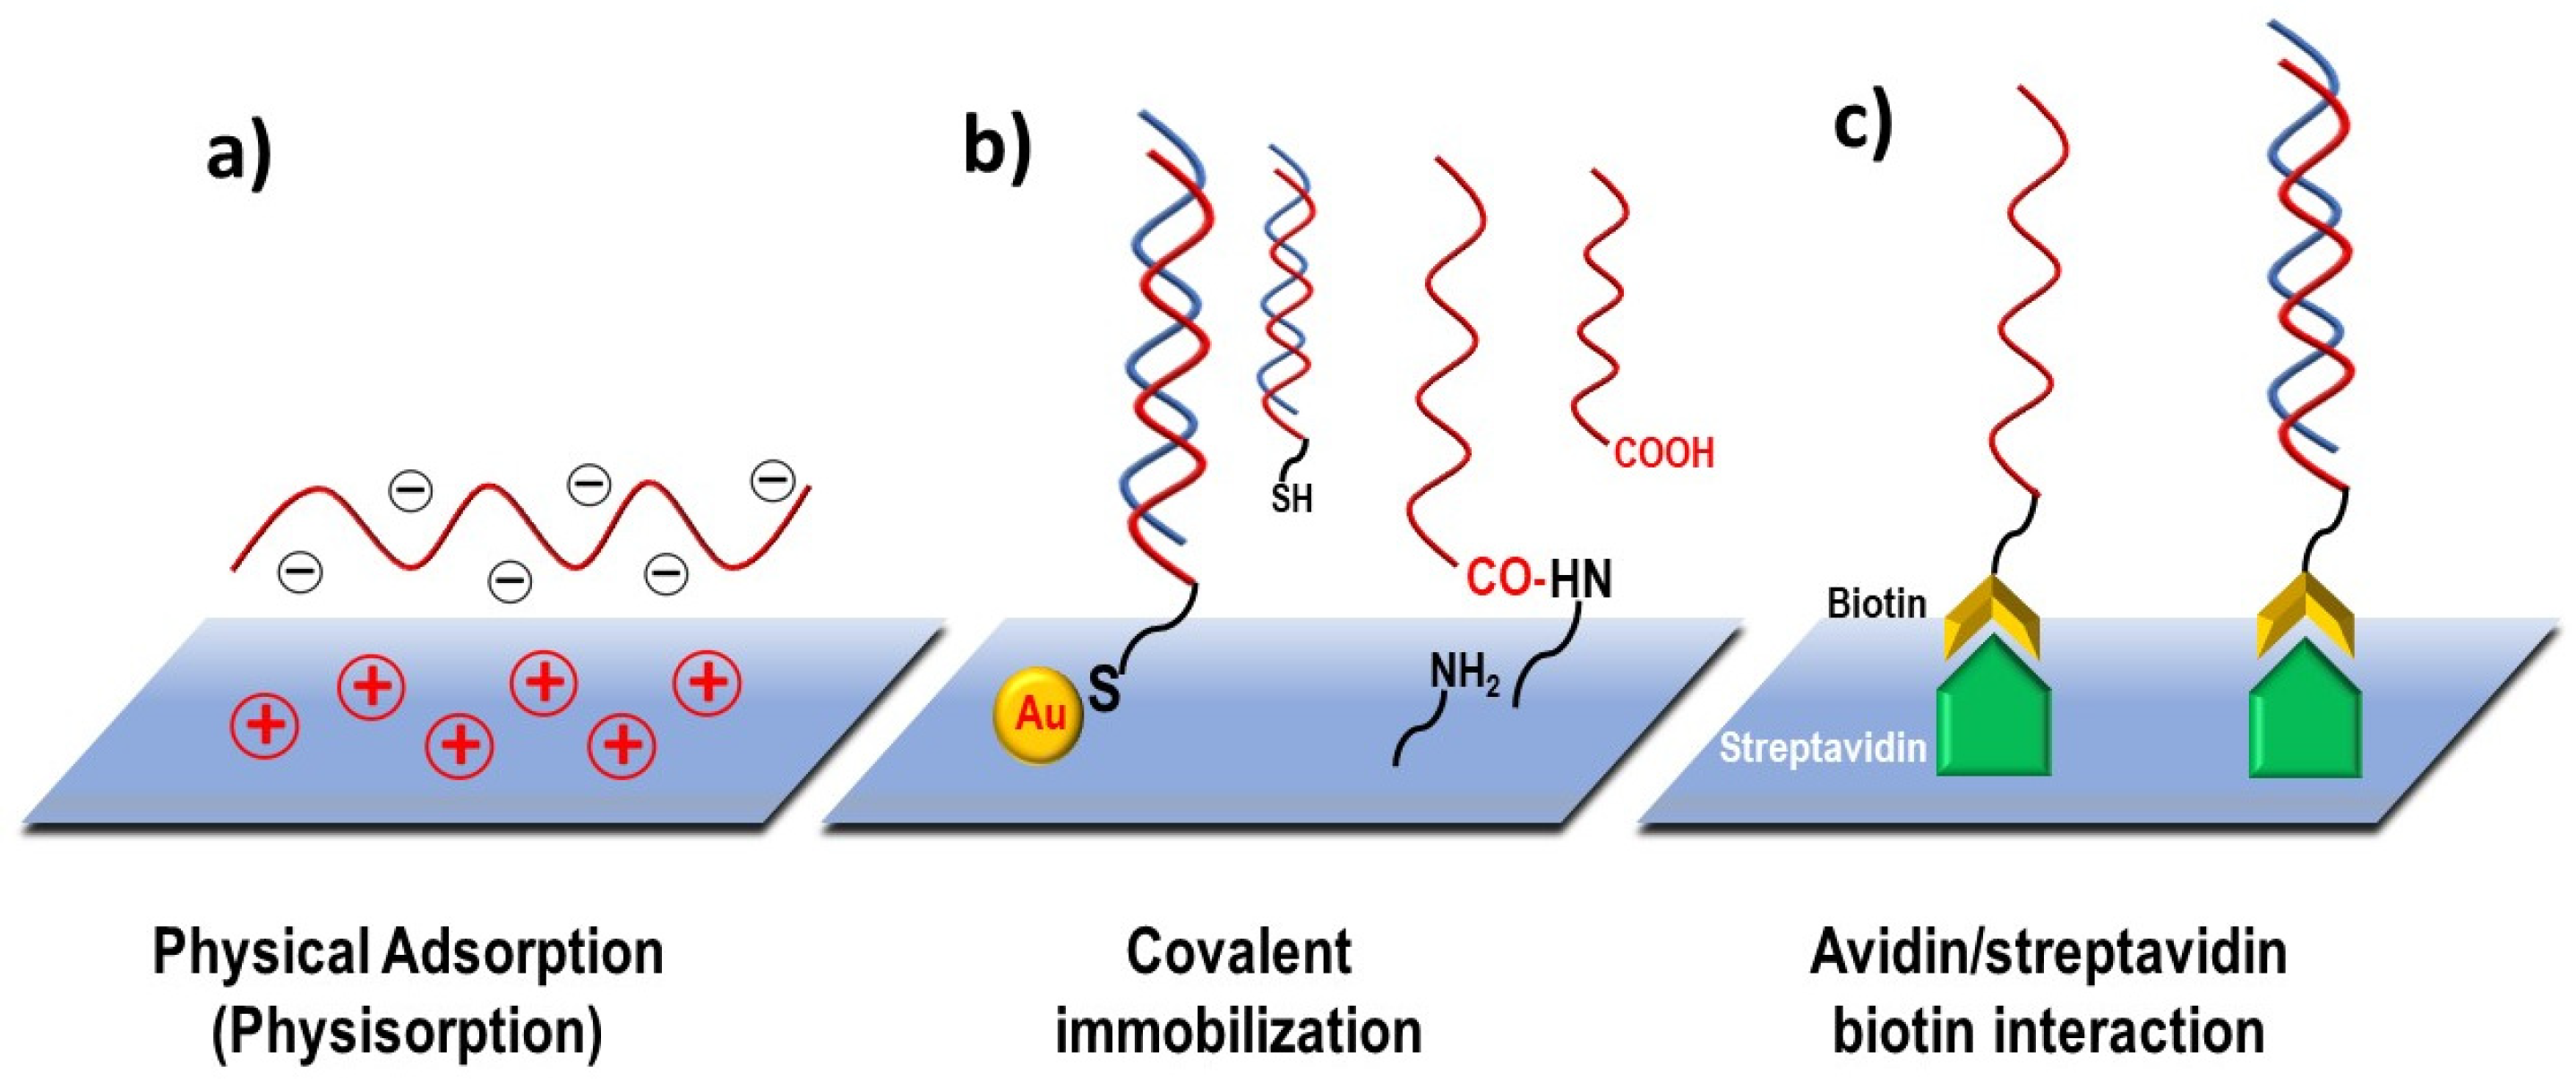
5. Probes Immobilization and Functionalization Strategies
6. Electrochemical Biosensors for miRNA Detection
6.1. Metallic Nanoparticles
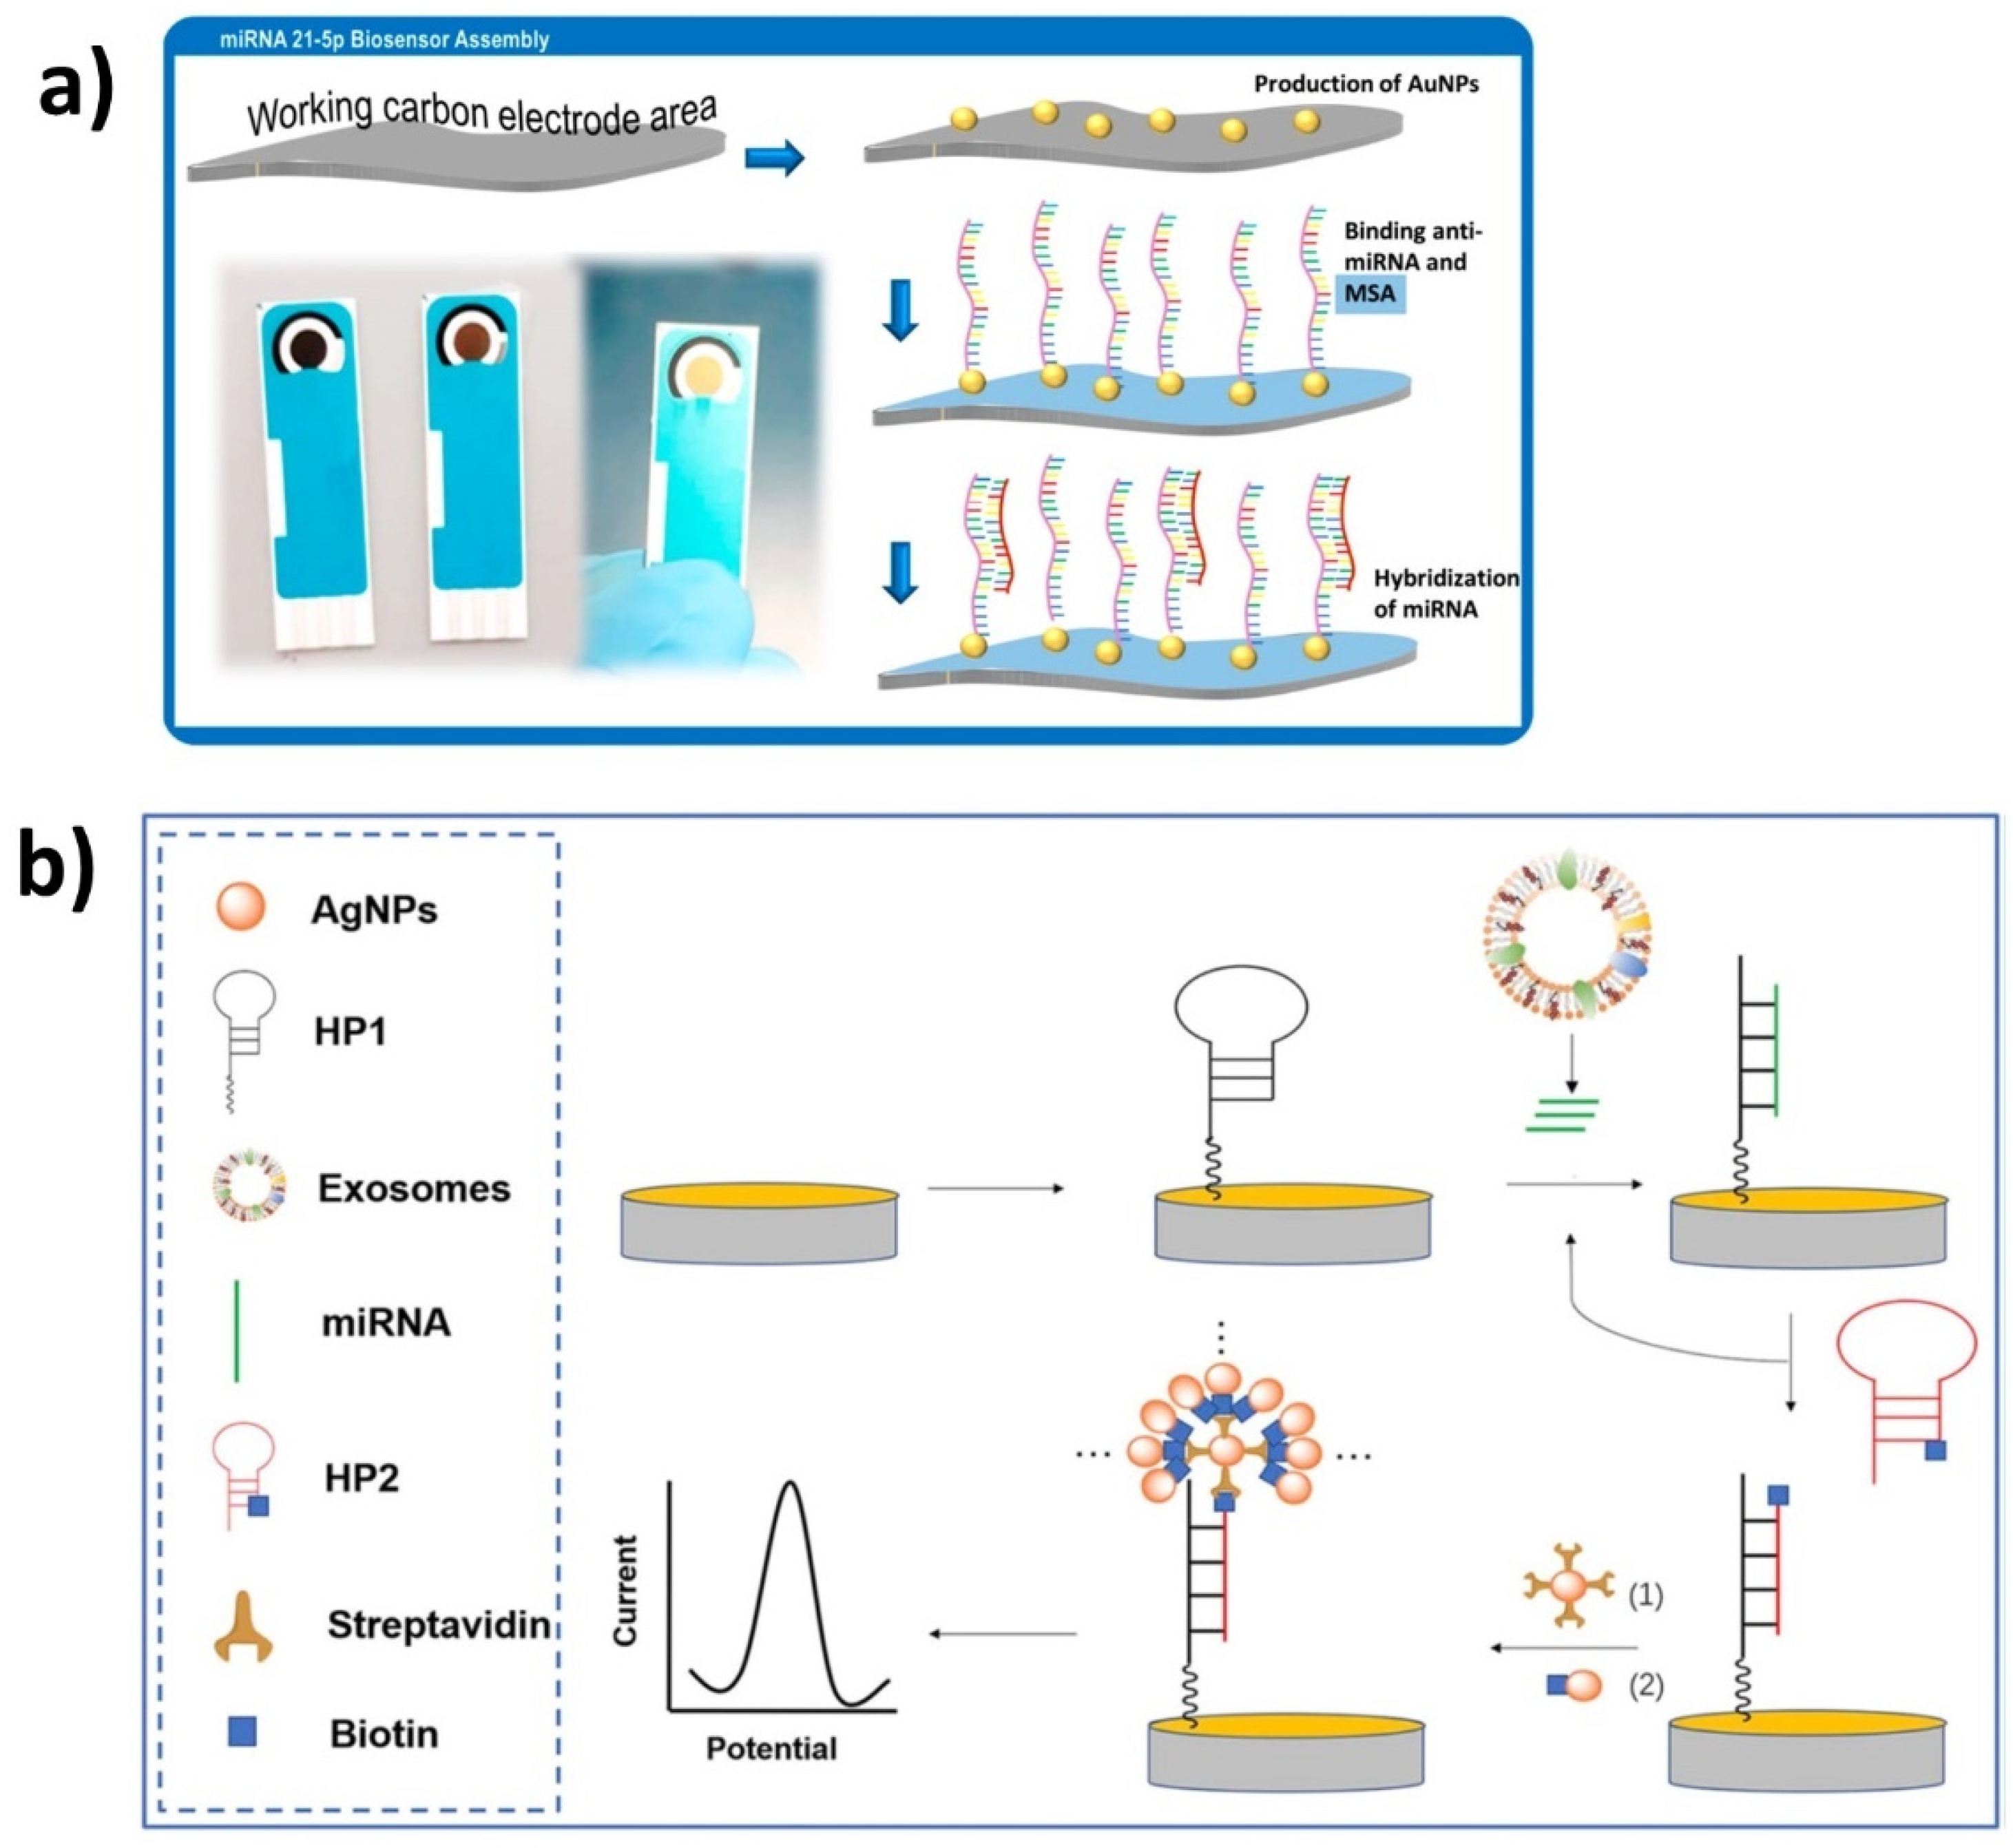
6.1.1. Gold Nanoparticles
6.1.2. Silver Nanoparticles
6.1.3. Other Metallic Nanoparticles
6.2. Graphene Oxide
6.3. Quantum Dots
6.4. Nanostructured Polymers
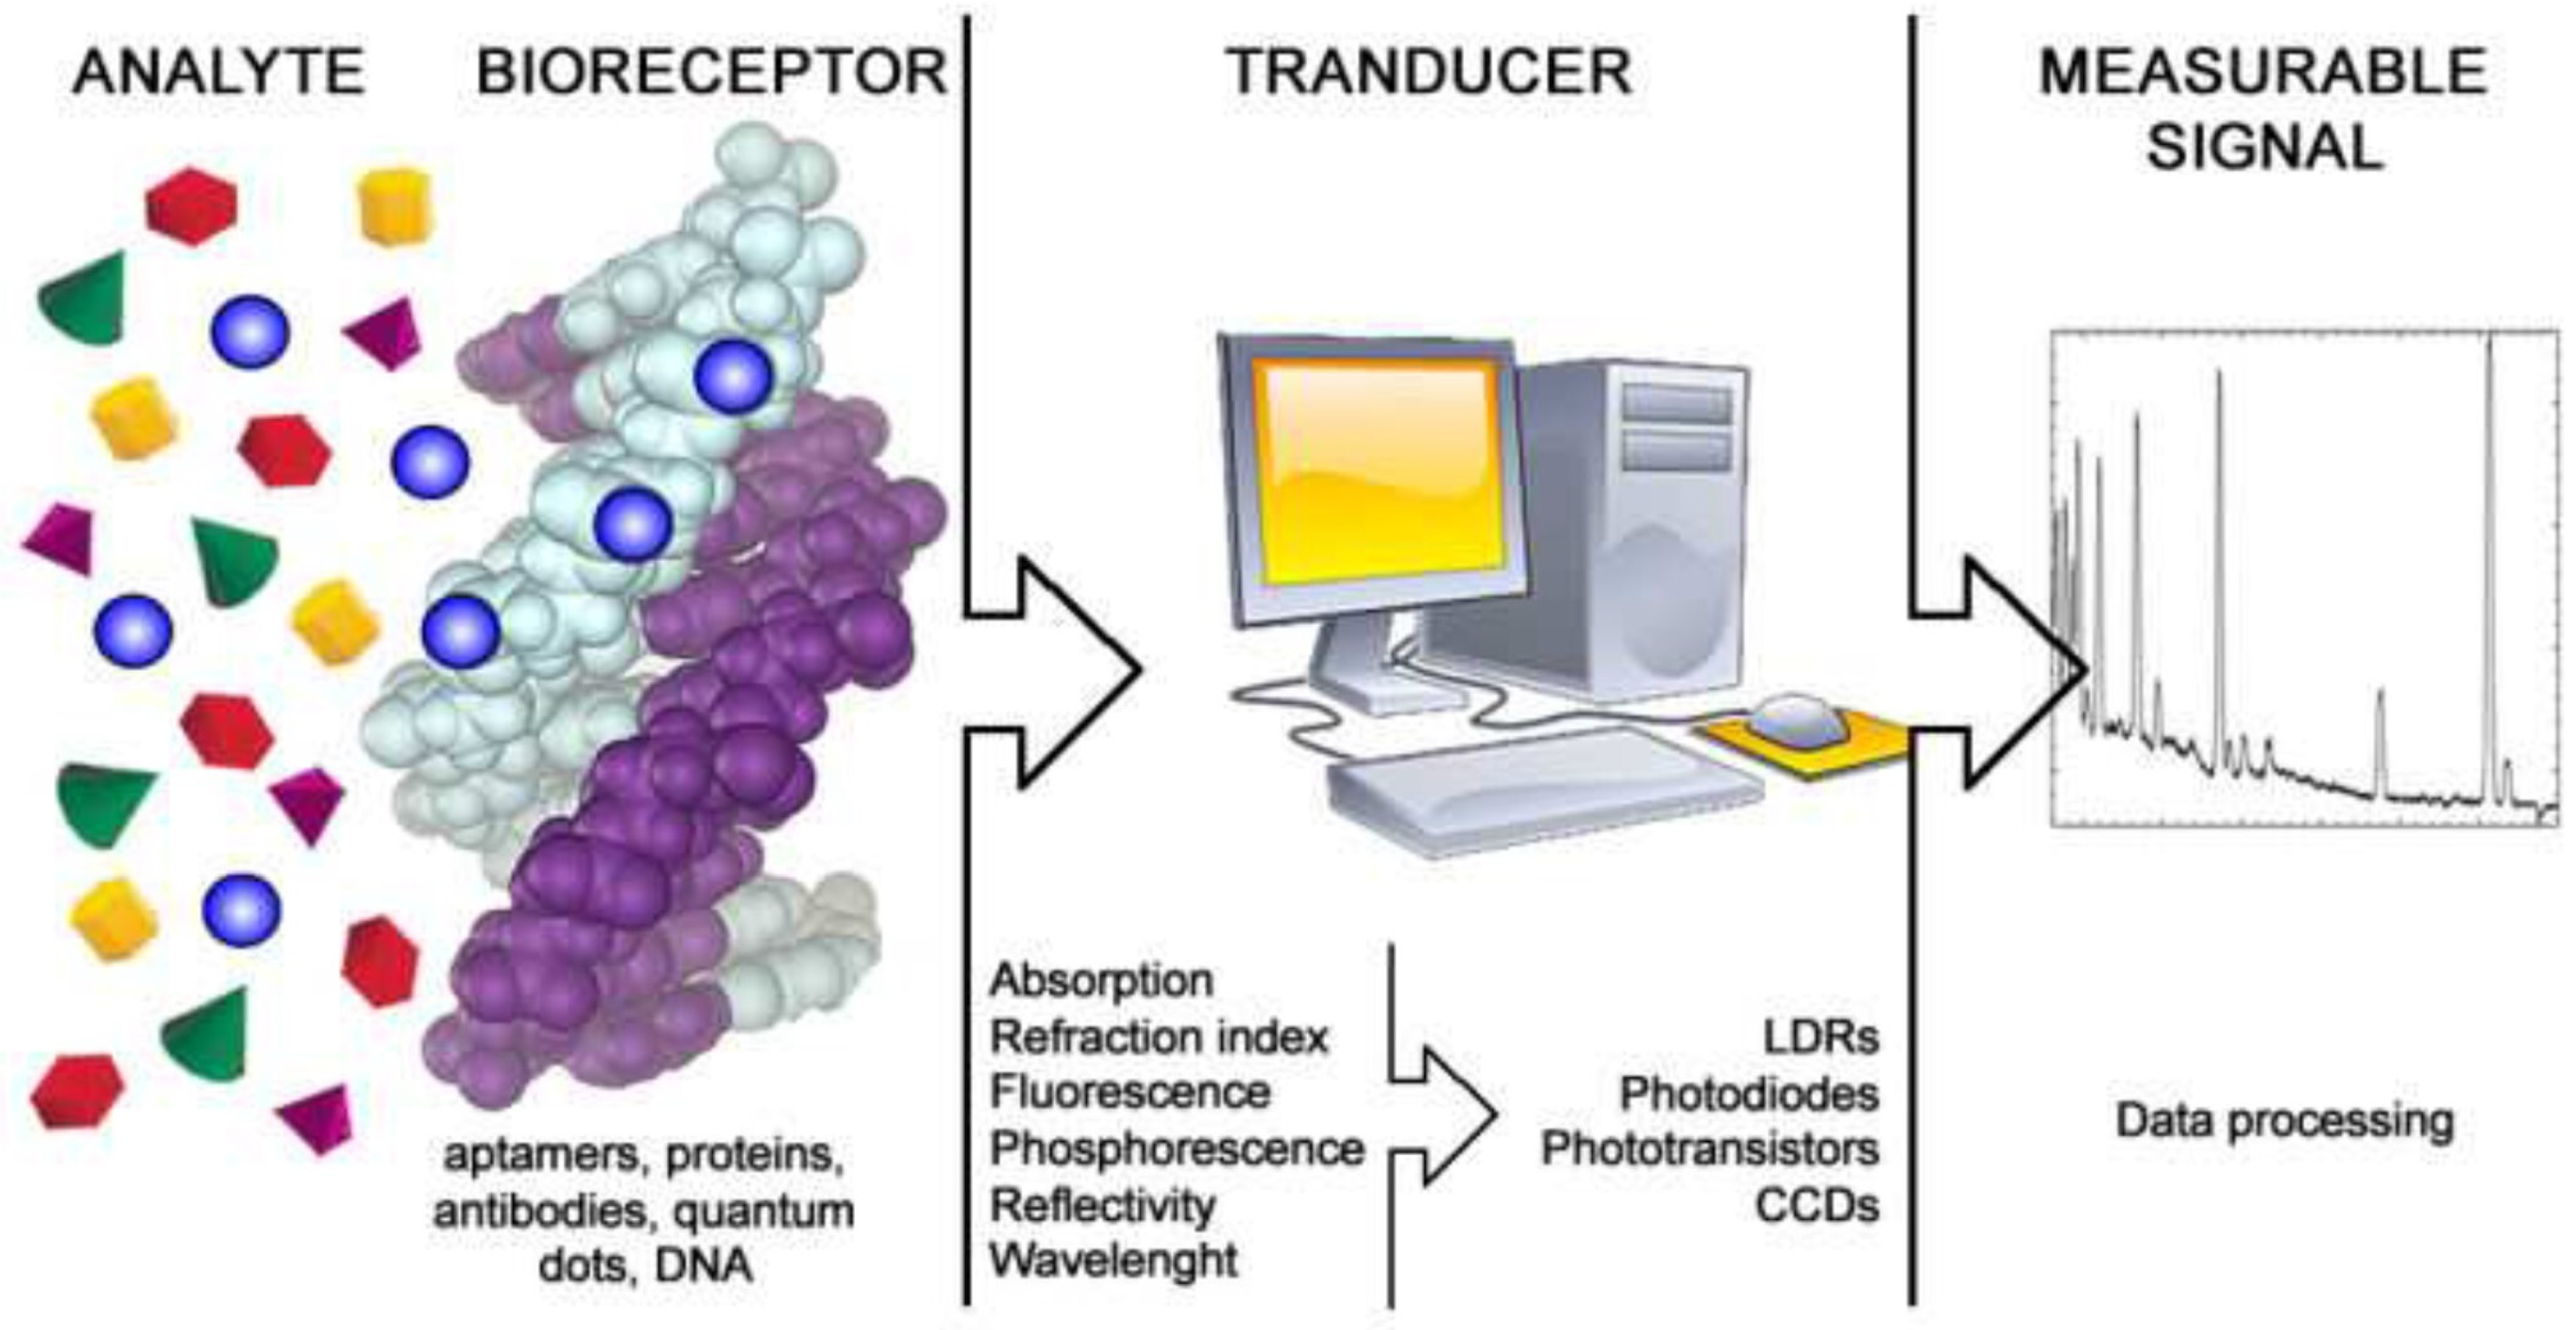
7. Optical Biosensors for miRNA Detection
7.1. Metallic Nanoparticles
7.1.1. Gold Nanoparticles
7.1.2. Silver Nanoparticles
7.1.3. Other Metallic Nanoparticles
7.2. Graphene Oxide
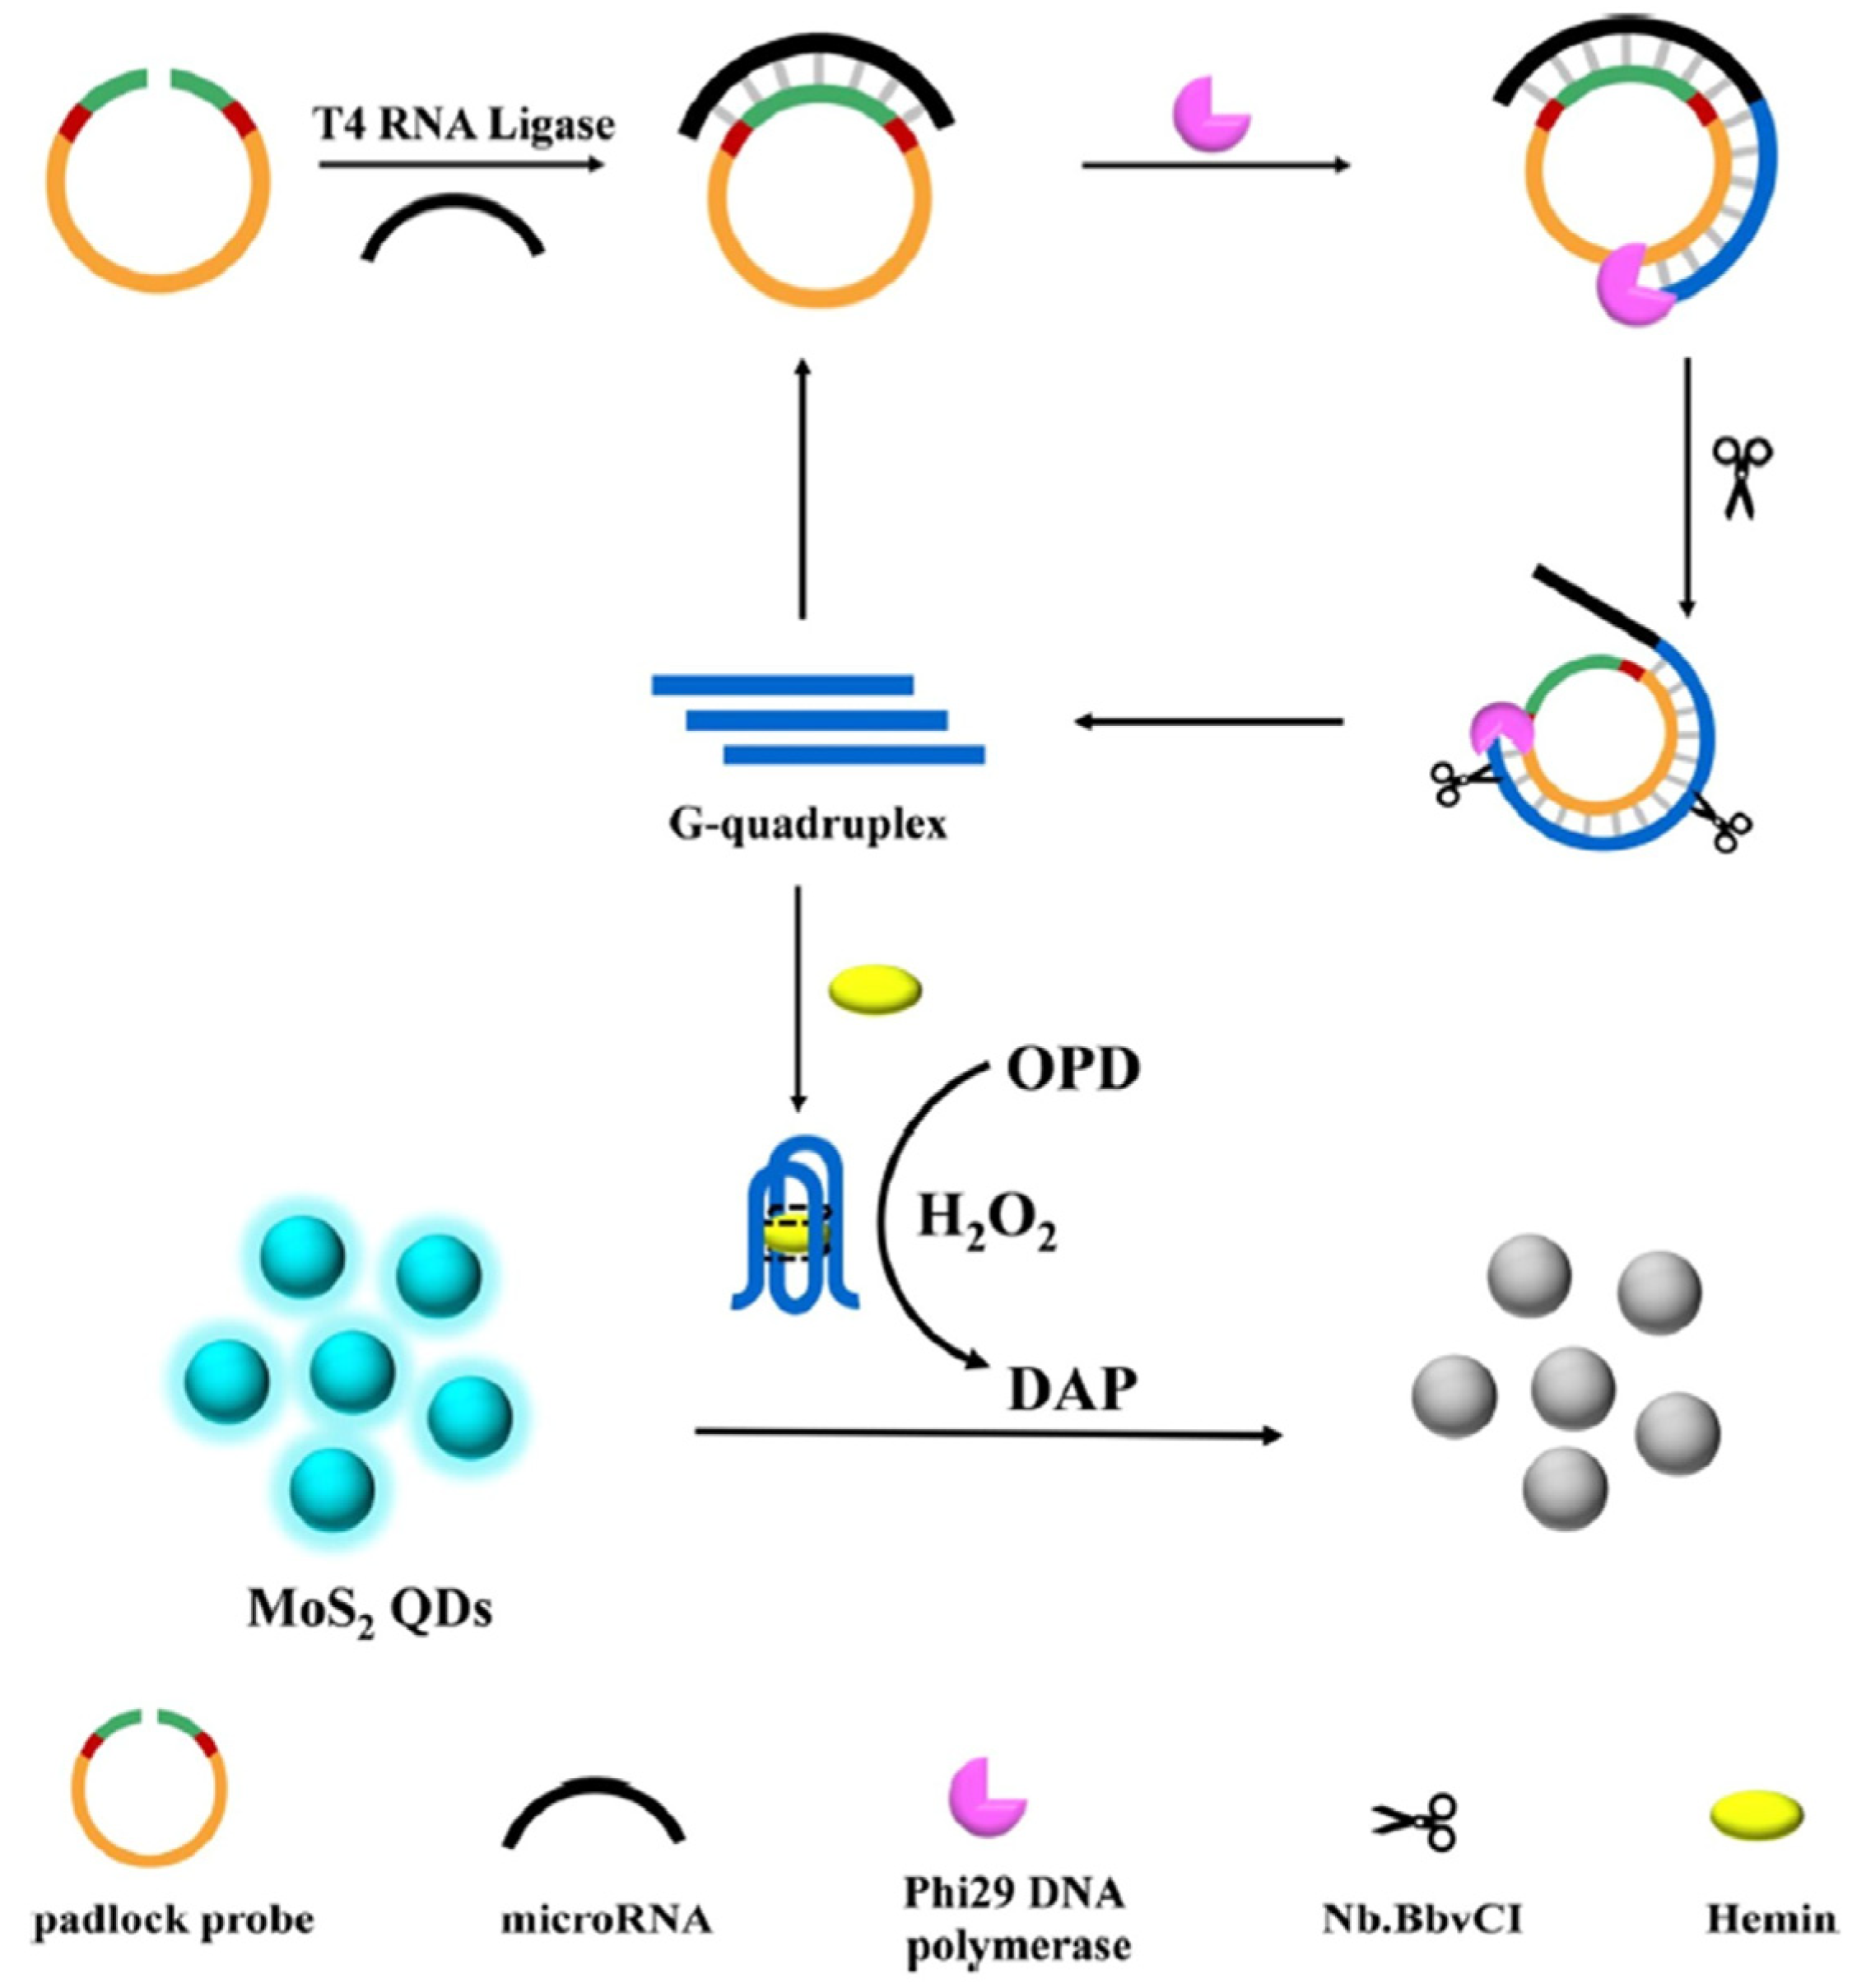
7.3. Quantum Dots
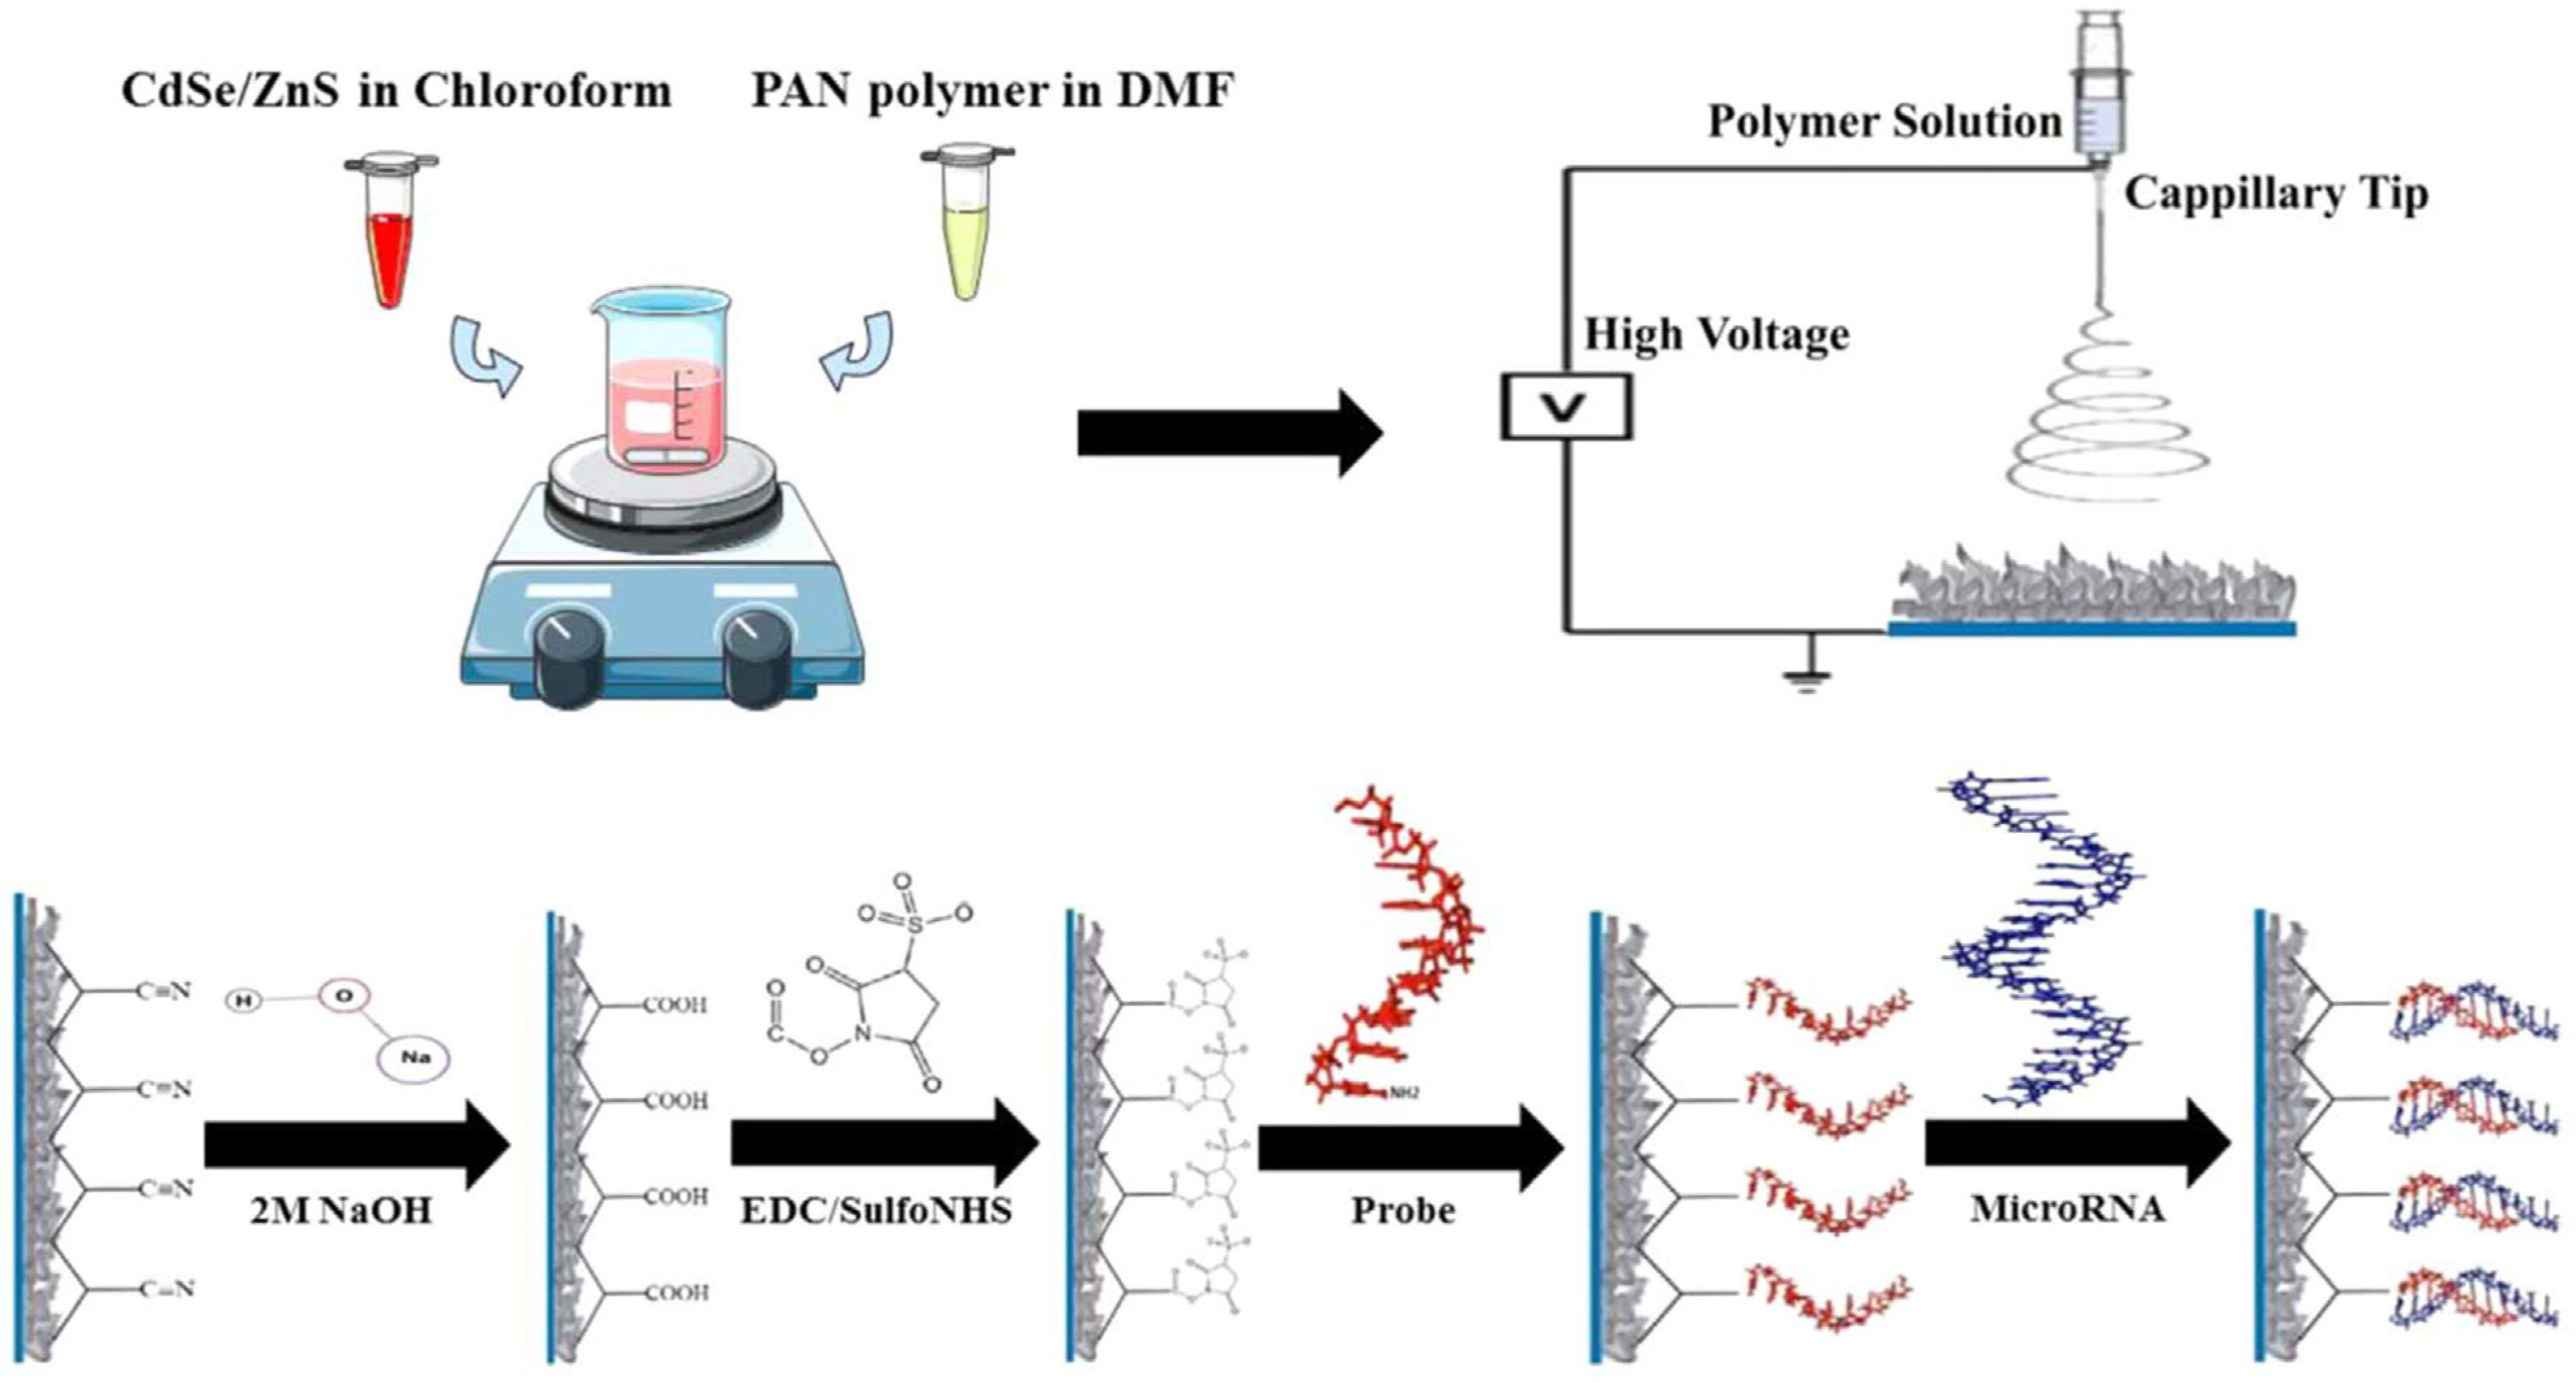
7.4. Nanostructured Polymers
8. Concluding Remarks
Author Contributions
Funding
Institutional Review Board Statement
Informed Consent Statement
Data Availability Statement
Conflicts of Interest
References
- Bartel, D.P. MicroRNAs: Genomics, Biogenesis, Mechanism, and Function. Cell 2004, 116, 281–297. [Google Scholar] [CrossRef]
- Cirillo, F.; Catellani, C.; Sartori, C.; Lazzeroni, P.; Amarri, S.; Street, M.E. Obesity, Insulin Resistance, and Colorectal Cancer: Could miRNA Dysregulation Play a Role? Int. J. Mol. Sci. 2019, 20, 2922. [Google Scholar] [CrossRef]
- Duan, L.; Xiong, X.; Liu, Y.; Wang, J. miRNA-1: Functional roles and dysregulation in heart disease. Mol. Biosyst. 2014, 10, 2775–2782. [Google Scholar] [CrossRef]
- Kamal, M.A.; Mushtaq, G.; Greig, N.H. Current Update on Synopsis of miRNA Dysregulation in Neurological Disorders. CNS Neurol. Disord. Drug Targets 2015, 14, 492–501. [Google Scholar] [CrossRef] [PubMed]
- Ahmad, F.B.; Anderson, R.N. The Leading Causes of Death in the US for 2020. JAMA 2021, 325, 1829. [Google Scholar] [CrossRef]
- Iroanya, O.O.; Olutunde, O.T.; Egwuatu, T.F.; Igbokwe, C. Stability of selected microRNAs in human blood, semen and saliva samples exposed to different environmental conditions. Forensic Sci. Int. 2022, 336, 111338. [Google Scholar] [CrossRef] [PubMed]
- Kashyap, D.; Kaur, H. Cell-free miRNAs as non-invasive biomarkers in breast cancer: Significance in early diagnosis and metastasis prediction. Life Sci. 2020, 246, 117417. [Google Scholar] [CrossRef]
- Wright, K.; de Silva, K.; Purdie, A.C.; Plain, K.M. Comparison of methods for miRNA isolation and quantification from ovine plasma. Sci. Rep. 2020, 10, 825. [Google Scholar] [CrossRef]
- Valihrach, L.; Androvic, P.; Kubista, M. Circulating miRNA analysis for cancer diagnostics and therapy. Mol. Asp. Med. 2019, 72, 100825. [Google Scholar] [CrossRef]
- Häntzsch, M.; Tolios, A.; Beutner, F.; Nagel, D.; Thiery, J.; Teupser, D.; Holdt, L.M. Comparison of Whole Blood RNA Preservation Tubes and Novel Generation RNA Extraction Kits for Analysis of mRNA and MiRNA Profiles. PLoS ONE 2014, 9, e113298. [Google Scholar] [CrossRef]
- Takeuchi, T.; Kawasaki, H.; Luce, A.; Cossu, A.M.; Misso, G.; Scrima, M.; Bocchetti, M.; Ricciardiello, F.; Caraglia, M.; Zappavigna, S. Insight toward the MicroRNA Profiling of Laryngeal Cancers: Biological Role and Clinical Impact. Int. J. Mol. Sci. 2020, 21, 3693. [Google Scholar] [CrossRef]
- Zhang, G.; Zhang, L.; Tong, J.; Zhao, X.; Ren, J. CRISPR-Cas12a enhanced rolling circle amplification method for ultrasensitive miRNA detection. Microchem. J. 2020, 158, 105239. [Google Scholar] [CrossRef]
- Thévenot, D.R.; Toth, K.; Durst, R.A.; Wilson, G.S. Electrochemical biosensors: Recommended definitions and classification. Biosens. Bioelectron. 2001, 16, 121–131. [Google Scholar] [CrossRef]
- Metcalf, G.A.D.; Shibakawa, A.; Patel, H.; Sita-Lumsden, A.; Zivi, A.; Rama, N.; Bevan, C.L.; Ladame, S. Amplification-Free Detection of Circulating microRNA Biomarkers from Body Fluids Based on Fluorogenic Oligonucleotide-Templated Reaction between Engineered Peptide Nucleic Acid Probes: Application to Prostate Cancer Diagnosis. Anal. Chem. 2016, 88, 8091–8098. [Google Scholar] [CrossRef]
- Wang, Y.-H.; He, L.-L.; Huang, K.-J.; Chen, Y.-X.; Wang, S.-Y.; Liu, Z.-H.; Li, D. Recent advances in nanomaterial-based electrochemical and optical sensing platforms for microRNA assays. Analyst 2019, 144, 2849–2866. [Google Scholar] [CrossRef]
- Gines, G.; Menezes, R.; Xiao, W.; Rondelez, Y.; Taly, V. Emerging isothermal amplification technologies for microRNA biosensing: Applications to liquid biopsies. Mol. Asp. Med. 2019, 72, 100832. [Google Scholar] [CrossRef]
- Grennan, K.; Killard, A.J.; Smyth, M.R. Physical Characterizations of a Screen-Printed Electrode for Use in an Amperometric Biosensor System. Electroanalysis 2001, 13, 745–750. [Google Scholar] [CrossRef]
- El Aamri, M.; Yammouri, G.; Mohammadi, H.; Amine, A.; Korri-Youssoufi, H. Electrochemical Biosensors for Detection of MicroRNA as a Cancer Biomarker: Pros and Cons. Biosensors 2020, 10, 186. [Google Scholar] [CrossRef]
- Crisci, T.; Falanga, A.P.; Casalino, M.; Borbone, N.; Terracciano, M.; Chianese, G.; Gioffrè, M.; D’errico, S.; Marzano, M.; Rea, I.; et al. Bioconjugation of a PNA Probe to Zinc Oxide Nanowires for Label-Free Sensing. Nanomaterials 2021, 11, 523. [Google Scholar] [CrossRef]
- Lai, M.; Slaughter, G. Label-Free MicroRNA Optical Biosensors. Nanomaterials 2019, 9, 1573. [Google Scholar] [CrossRef]
- Jamali, A.A.; Pourhassan-Moghaddam, M.; Nazhad Dolatabadi, J.E.; Omidi, Y. Nanomaterials on the road to microRNA detection with optical and electrochemical nanobiosensors. TrAC Trends Anal. Chem. 2014, 55, 24–42. [Google Scholar] [CrossRef]
- Lee, R.C.; Feinbaum, R.L.; Ambros, V. The C. elegans heterochronic gene lin-4 encodes small RNAs with antisense complementarity to lin-14. Cell 1993, 75, 843–854. [Google Scholar] [CrossRef] [PubMed]
- Meng, Y.; Ma, X.; Li, J.; Shao, C. Creating and maintaining a high-confidence microRNA repository for crop research: A brief review and re-examination of the current crop microRNA registries. J. Plant Physiol. 2022, 270, 153636. [Google Scholar] [CrossRef] [PubMed]
- Hayes, J.; Peruzzi, P.P.; Lawler, S. MicroRNAs in cancer: Biomarkers, functions and therapy. Trends Mol. Med. 2014, 20, 460–469. [Google Scholar] [CrossRef]
- Calin, G.A.; Dumitru, C.D.; Shimizu, M.; Bichi, R.; Zupo, S.; Noch, E.; Aldler, H.; Rattan, S.; Keating, M.; Rai, K.; et al. Frequent deletions and down-regulation of micro-RNA genes miR15 and miR16 at 13q14 in chronic lymphocytic leukemia. Proc. Natl. Acad. Sci. USA 2002, 99, 15524–15529. [Google Scholar] [CrossRef]
- Peng, Y.; Croce, C.M. The role of MicroRNAs in human cancer. Signal Transduct. Target. Ther. 2016, 1, 15004. [Google Scholar] [CrossRef]
- Chim, S.S.C.; Shing, T.K.F.; Hung, E.C.W.; Leung, T.-Y.; Lau, T.-K.; Chiu, R.W.K.; Lo, Y.M.D. Detection and Characterization of Placental MicroRNAs in Maternal Plasma. Clin. Chem. 2008, 54, 482–490. [Google Scholar] [CrossRef]
- Mitchell, P.S.; Parkin, R.K.; Kroh, E.M.; Fritz, B.R.; Wyman, S.K.; Pogosova-Agadjanyan, E.L.; Peterson, A.; Noteboom, J.; O’Briant, K.C.; Allen, A.; et al. Circulating microRNAs as stable blood-based markers for cancer detection. Proc. Natl. Acad. Sci. USA 2008, 105, 10513–10518. [Google Scholar] [CrossRef]
- Kai, K.; Dittmar, R.L.; Sen, S. Secretory microRNAs as biomarkers of cancer. Semin. Cell Dev. Biol. 2018, 78, 22–36. [Google Scholar] [CrossRef]
- Arroyo, J.D.; Chevillet, J.R.; Kroh, E.M.; Ruf, I.K.; Pritchard, C.C.; Gibson, D.F.; Mitchell, P.S.; Bennett, C.F.; Pogosova-Agadjanyan, E.L.; Stirewalt, D.L.; et al. Argonaute2 complexes carry a population of circulating microRNAs independent of vesicles in human plasma. Proc. Natl. Acad. Sci. USA 2011, 108, 5003–5008. [Google Scholar] [CrossRef]
- Guirado, M.; Martín, E.F.; Villar, A.F.; Martín, A.N.; Sánchez-Hernández, A. Clinical impact of delays in the management of lung cancer patients in the last decade: Systematic review. Clin. Transl. Oncol. 2022, 24, 1549–1568. [Google Scholar] [CrossRef]
- Leng, Q.; Lin, Y.; Jiang, F.; Lee, C.-J.; Zhan, M.; Fang, H.; Wang, Y.; Jiang, F. A plasma miRNA signature for lung cancer early detection. Oncotarget 2017, 8, 111902–111911. [Google Scholar] [CrossRef]
- Saare, M.; Rekker, K.; Laisk-Podar, T.; Sõritsa, D.; Roost, A.M.; Simm, J.; Velthut-Meikas, A.; Samuel, K.; Metsalu, T.; Karro, H.; et al. High-Throughput Sequencing Approach Uncovers the miRNome of Peritoneal Endometriotic Lesions and Adjacent Healthy Tissues. PLoS ONE 2014, 9, e112630. [Google Scholar] [CrossRef]
- Darvasi, O.; Szabo, P.M.; Nemeth, K.; Szabo, K.; Spisak, S.; Liko, I.; Czirjak, S.; Racz, K.; Igaz, P.; Patocs, A.; et al. Limitations of high throughput methods for miRNA expression profiles in non-functioning pituitary adenomas. Pathol. Oncol. Res. 2017, 25, 169–182. [Google Scholar] [CrossRef]
- Deo, S.V.S.; Sharma, J.; Kumar, S. GLOBOCAN 2020 Report on Global Cancer Burden: Challenges and Opportunities for Surgical Oncologists. Ann. Surg. Oncol. 2022, 29, 6497–6500. [Google Scholar] [CrossRef]
- Mahmoudian, M.; Razmara, E.; Hussen, B.M.; Simiyari, M.; Lotfizadeh, N.; Motaghed, H.; Monfared, A.K.; Montazeri, M.; Babashah, S. Identification of a six-microRNA signature as a potential diagnostic biomarker in breast cancer tissues. J. Clin. Lab. Anal. 2021, 35, e24010. [Google Scholar] [CrossRef]
- Cuk, K.; Zucknick, M.; Madhavan, D.; Schott, S.; Golatta, M.; Heil, J.; Marmé, F.; Turchinovich, A.; Sinn, P.; Sohn, C.; et al. Plasma MicroRNA Panel for Minimally Invasive Detection of Breast Cancer. PLoS ONE 2013, 8, e76729. [Google Scholar] [CrossRef]
- Alhasan, A.H.; Scott, A.W.; Wu, J.J.; Feng, G.; Meeks, J.J.; Thaxton, C.S.; Mirkin, C.A. Circulating microRNA signature for the diagnosis of very high-risk prostate cancer. Proc. Natl. Acad. Sci. USA 2016, 113, 10655–10660. [Google Scholar] [CrossRef]
- Falco, M.; Tammaro, C.; Takeuchi, T.; Cossu, A.M.; Scafuro, G.; Zappavigna, S.; Itro, A.; Addeo, R.; Scrima, M.; Lombardi, A.; et al. Overview on Molecular Biomarkers for Laryngeal Cancer: Looking for New Answers to an Old Problem. Cancers 2022, 14, 1716. [Google Scholar] [CrossRef]
- Zhong, S.; Golpon, H.; Zardo, P.; Borlak, J. miRNAs in lung cancer. A systematic review identifies predictive and prognostic miRNA candidates for precision medicine in lung cancer. Transl. Res. 2020, 230, 164–196. [Google Scholar] [CrossRef]
- Poste, G. Bring on the biomarkers. Nature 2011, 469, 156–157. [Google Scholar] [CrossRef]
- Saliminejad, K.; Khorshid, H.R.K.; Ghaffari, S.H. Why have microRNA biomarkers not been translated from bench to clinic? Futur. Oncol. 2019, 15, 801–803. [Google Scholar] [CrossRef]
- Dong, H.; Lei, J.; Ding, L.; Wen, Y.; Ju, H.; Zhang, X. MicroRNA: Function, Detection, and Bioanalysis. Chem. Rev. 2013, 113, 6207–6233. [Google Scholar] [CrossRef] [PubMed]
- Dambal, S.; Shah, M.; Mihelich, B.; Nonn, L. The microRNA-183 cluster: The family that plays together stays together. Nucleic Acids Res. 2015, 43, 7173–7188. [Google Scholar] [CrossRef]
- Sidén-Kiamos, I. Southern/northern blotting and hybridization techniques. Mol. Biol. Insect Dis. Vectors 1997, 230–243. [Google Scholar] [CrossRef]
- Rio, D.C. Denaturation and Electrophoresis of RNA with Formaldehyde. Cold Spring Harb. Protoc. 2015, 2015, 219–222. [Google Scholar] [CrossRef]
- Pall, G.S.; Hamilton, A.J. Improved northern blot method for enhanced detection of small RNA. Nat. Protoc. 2008, 3, 1077–1084. [Google Scholar] [CrossRef]
- Chen, C.; Ridzon, D.A.; Broomer, A.J.; Zhou, Z.; Lee, D.H.; Nguyen, J.T.; Barbisin, M.; Xu, N.L.; Mahuvakar, V.R.; Andersen, M.R.; et al. Real-time quantification of microRNAs by stem-loop RT-PCR. Nucleic Acids Res. 2005, 33, e179. [Google Scholar] [CrossRef]
- Shi, R.; Chiang, V.L. Facile means for quantifying microRNA expression by real-time PCR. Biotechniques 2005, 39, 519–525. [Google Scholar] [CrossRef]
- Yin, J.Q.; Zhao, R.C.; Morris, K. Profiling microRNA expression with microarrays. Trends Biotechnol. 2008, 26, 70–76. [Google Scholar] [CrossRef]
- Castoldi, M.; Schmidt, S.; Benes, V.; Noerholm, M.; Kulozik, A.E.; Hentze, M.W.; Muckenthaler, M.U. A sensitive array for microRNA expression profiling (miChip) based on locked nucleic acids (LNA). RNA 2006, 12, 913–920. [Google Scholar] [CrossRef]
- Hong, M.; Tao, S.; Zhang, L.; Diao, L.-T.; Huang, X.; Huang, S.; Xie, S.-J.; Xiao, Z.-D.; Zhang, H. RNA sequencing: New technologies and applications in cancer research. J. Hematol. Oncol. 2020, 13, 166. [Google Scholar] [CrossRef]
- Marioni, J.C.; Mason, C.E.; Mane, S.M.; Stephens, M.; Gilad, Y. RNA-seq: An assessment of technical reproducibility and comparison with gene expression arrays. Genome Res. 2008, 18, 1509–1517. [Google Scholar] [CrossRef]
- Mardis, E.R. Next-generation DNA sequencing methods. Annu. Rev. Genomics Hum. Genet. 2008, 9, 387–402. [Google Scholar] [CrossRef]
- Shendure, J.; Ji, H. Next-generation DNA sequencing. Nat. Biotechnol. 2008, 26, 1135–1145. [Google Scholar] [CrossRef]
- Mardis, E.R. Next-Generation Sequencing Platforms. Annu. Rev. Anal. Chem. 2013, 6, 287–303. [Google Scholar] [CrossRef]
- Schadt, E.E.; Turner, S.; Kasarskis, A. A window into third-generation sequencing. Hum. Mol. Genet. 2010, 19, R227–R240. [Google Scholar] [CrossRef]
- Eid, J.; Fehr, A.; Gray, J.; Luong, K.; Lyle, J.; Otto, G.; Peluso, P.; Rank, D.; Baybayan, P.; Bettman, B.; et al. Real-Time DNA Sequencing from Single Polymerase Molecules. Science 2009, 323, 133–138. [Google Scholar] [CrossRef]
- Hart, C.; Lipson, D.; Ozsolak, F.; Raz, T.; Steinmann, K.; Thompson, J.; Milos, P.M. Single-molecule sequencing: Sequence methods to enable accurate quantitation. Methods Enzymol. 2010, 472, 407–430. [Google Scholar] [CrossRef]
- Bayley, H. Nanopore sequencing: From imagination to reality. Clin. Chem. 2015, 61, 25–31. [Google Scholar] [CrossRef]
- Naresh, V.; Lee, N. A Review on Biosensors and Recent Development of Nanostructured Materials-Enabled Biosensors. Sensors 2021, 21, 1109. [Google Scholar] [CrossRef]
- Moretta, R.; De Stefano, L.; Terracciano, M.; Rea, I. Porous Silicon Optical Devices: Recent Advances in Biosensing Applications. Sensors 2021, 21, 1336. [Google Scholar] [CrossRef]
- Managò, S.; Tramontano, C.; Cave, D.D.; Chianese, G.; Zito, G.; De Stefano, L.; Terracciano, M.; Lonardo, E.; De Luca, A.C.; Rea, I. SERS Quantification of Galunisertib Delivery in Colorectal Cancer Cells by Plasmonic-Assisted Diatomite Nanoparticles. Small 2021, 17, e2101711. [Google Scholar] [CrossRef]
- Barhoum, A.; García-Betancourt, M.L.; Jeevanandam, J.; Hussien, E.A.; Mekkawy, S.A.; Mostafa, M.; Omran, M.M.; Abdalla, M.S.; Bechelany, M. Review on Natural, Incidental, Bioinspired, and Engineered Nanomaterials: History, Definitions, Classifications, Synthesis, Properties, Market, Toxicities, Risks, and Regulations. Nanomaterials 2022, 12, 177. [Google Scholar] [CrossRef]
- Dolez, P.I. Nanomaterials Definitions, Classifications, and Applications. In Nanoengineering; Elsevier: Amsterdam, The Netherlands, 2015; pp. 3–40. [Google Scholar] [CrossRef]
- Ranjan, S.; Dasgupta, N.; Lichtfouse, E. Nanoscience in Food and Agriculture 3; Springer: Berlin/Heidelberg, Germany, 2016; Volume 23. [Google Scholar] [CrossRef]
- Suresh, A.K.; Pelletier, D.A.; Doktycz, M.J. Relating nanomaterial properties and microbial toxicity. Nanoscale 2012, 5, 463–474. [Google Scholar] [CrossRef]
- Terracciano, M.; De Stefano, L.; Borbone, N.; Politi, J.; Oliviero, G.; Nici, F.; Casalino, M.; Piccialli, G.; Dardano, P.; Varra, M.; et al. Solid phase synthesis of a thrombin binding aptamer on macroporous silica for label free optical quantification of thrombin. RSC Adv. 2016, 6, 86762–86769. [Google Scholar] [CrossRef]
- Yang, Y.; Jia, J.; Liu, Y.; Zhang, P. The effect of tungsten doping on the catalytic activity of α-MnO2 nanomaterial for ozone decomposition under humid condition. Appl. Catal. A Gen. 2018, 562, 132–141. [Google Scholar] [CrossRef]
- Itaković, N.M. Physical properties of nanomaterials. Vojnoteh. Glas. Mil. Tech. Cour. 2019, 67, 159–171. [Google Scholar] [CrossRef]
- Chen, X.; Cheng, L.; Li, H.; Barhoum, A.; Zhang, Y.; He, X.; Yang, W.; Bubakir, M.M.; Chen, H. Magnetic Nanofibers: Unique Properties, Fabrication Techniques, and Emerging Applications. Chemistryselect 2018, 3, 9127–9143. [Google Scholar] [CrossRef]
- Nocerino, V.; Miranda, B.; Tramontano, C.; Chianese, G.; Dardano, P.; Rea, I.; De Stefano, L. Plasmonic Nanosensors: Design, Fabrication, and Applications in Biomedicine. Chemosensors 2022, 10, 150. [Google Scholar] [CrossRef]
- Sánchez-López, E.; Gomes, D.; Esteruelas, G.; Bonilla, L.; Lopez-Machado, A.L.; Galindo, R.; Cano, A.; Espina, M.; Ettcheto, M.; Camins, A.; et al. Metal-Based Nanoparticles as Antimicrobial Agents: An Overview. Nanomaterials 2020, 10, 292. [Google Scholar] [CrossRef]
- Ahmad, H.; Fan, M.; Hui, D. Graphene oxide incorporated functional materials: A review. Compos. Part B Eng. 2018, 145, 270–280. [Google Scholar] [CrossRef]
- Alizadeh-Ghodsi, M.; Pourhassan-Moghaddam, M.; Zavari-Nematabad, A.; Walker, B.; Annabi, N.; Akbarzadeh, A. State-of-the-art and trends in synthesis, properties, and application of quantum dots-based nanomaterials. Part. Part. Syst. Charact. 2019, 36, 1800302. [Google Scholar] [CrossRef]
- Delfi, M.; Ghomi, M.; Zarrabi, A.; Mohammadinejad, R.; Taraghdari, Z.B.; Ashrafizadeh, M.; Zare, E.N.; Agarwal, T.; Padil, V.V.T.; Mokhtari, B.; et al. Functionalization of Polymers and Nanomaterials for Biomedical Applications: Antimicrobial Platforms and Drug Carriers. Prosthesis 2020, 2, 12. [Google Scholar] [CrossRef]
- Chen, H.; Kou, X.; Yang, Z.; Ni, W.; Wang, J. Shape- and Size-Dependent Refractive Index Sensitivity of Gold Nanoparticles. Langmuir 2008, 24, 5233–5237. [Google Scholar] [CrossRef]
- Boldt, K.; Kirkwood, N.; Beane, G.A.; Mulvaney, P. Synthesis of Highly Luminescent and Photo-Stable, Graded Shell CdSe/CdxZn1–xS Nanoparticles by In Situ Alloying. Chem. Mater. 2013, 25, 4731–4738. [Google Scholar] [CrossRef]
- Xue, J.; Xie, J.; Liu, W.; Xia, Y. Electrospun Nanofibers: New Concepts, Materials, and Applications. Acc. Chem. Res. 2017, 50, 1976–1987. [Google Scholar] [CrossRef]
- Wilson, N.R.; Pandey, P.A.; Beanland, R.; Young, R.J.; Kinloch, I.A.; Gong, L.; Liu, Z.; Suenaga, K.; Rourke, J.P.; York, S.J.; et al. Graphene Oxide: Structural Analysis and Application as a Highly Transparent Support for Electron Microscopy. ACS Nano 2009, 3, 2547–2556. [Google Scholar] [CrossRef]
- Cho, I.-H.; Kim, D.H.; Park, S. Electrochemical biosensors: Perspective on functional nanomaterials for on-site analysis. Biomater. Res. 2020, 24, 6. [Google Scholar] [CrossRef]
- Cho, I.-H.; Lee, J.; Kim, J.; Kang, M.-S.; Paik, J.K.; Ku, S.; Cho, H.-M.; Irudayaraj, J.; Kim, D.-H. Current Technologies of Electrochemical Immunosensors: Perspective on Signal Amplification. Sensors 2018, 18, 207. [Google Scholar] [CrossRef]
- Serrano, V.M.; Silva, I.S.P.; Cardoso, A.R.; Sales, M.G.F. Carbon Electrodes with Gold Nanoparticles for the Electrochemical Detection of miRNA 21-5p. Chemosensors 2022, 10, 189. [Google Scholar] [CrossRef]
- Cheng, W.; Ma, J.; Cao, P.; Zhang, Y.; Xu, C.; Yi, Y.; Li, J. Enzyme-free electrochemical biosensor based on double signal amplification strategy for the ultra-sensitive detection of exosomal microRNAs in biological samples. Talanta 2020, 219, 121242. [Google Scholar] [CrossRef] [PubMed]
- Al-Hakkani, M.F. Biogenic copper nanoparticles and their applications: A review. SN Appl. Sci. 2020, 2, 1–20. [Google Scholar] [CrossRef]
- Bharti, A.; Mittal, S.; Rana, S.; Dahiya, D.; Agnihotri, N.; Prabhakar, N. Electrochemical biosensor for miRNA-21 based on gold-platinum bimetallic nanoparticles coated 3-aminopropyltriethoxy silane. Anal. Biochem. 2020, 609, 113908. [Google Scholar] [CrossRef]
- Coronado, E.A.; Encina, E.R.; Stefani, F.D. Optical properties of metallic nanoparticles: Manipulating light, heat and forces at the nanoscale. Nanoscale 2011, 3, 4042–4059. [Google Scholar] [CrossRef]
- Wang, X.; Hou, T.; Lin, H.; Lv, W.; Li, H.; Li, F. In situ template generation of silver nanoparticles as amplification tags for ultrasensitive surface plasmon resonance biosensing of microRNA. Biosens. Bioelectron. 2019, 137, 82–87. [Google Scholar] [CrossRef]
- Ma, Q.; Gao, Z.; Dayal, H.; Li, S.F.Y. A Label-Free Fluorescent Sensor Based on the Formation of Poly(thymine)-Templated Copper Nanoparticles for the Sensitive and Selective Detection of MicroRNA from Cancer Cells. Chemosensors 2020, 8, 52. [Google Scholar] [CrossRef]
- Fan, Y.; Liu, Y.; Zhou, Q.; Du, H.; Zhao, X.; Ye, F.; Zhao, H. Catalytic hairpin assembly indirectly covalent on Fe3O4@C nanoparticles with signal amplification for intracellular detection of miRNA. Talanta 2020, 223, 121675. [Google Scholar] [CrossRef]
- Yu, W.; Sisi, L.; Haiyan, Y.; Jie, L. Progress in the functional modification of graphene/graphene oxide: A review. RSC Adv. 2020, 10, 15328–15345. [Google Scholar] [CrossRef]
- Nitu, F.R.; Savu, L.; Muraru, S.; Stoian, I.; Ionită, M. Label-Free Homogeneous microRNA Detection in Cell Culture Medium Based on Graphene Oxide and Specific Fluorescence Quenching. Nanomaterials 2021, 11, 368. [Google Scholar] [CrossRef]
- Farzin, M.A.; Abdoos, H. A critical review on quantum dots: From synthesis toward applications in electrochemical biosensors for determination of disease-related biomolecules. Talanta 2020, 224, 121828. [Google Scholar] [CrossRef]
- Murphy, C.J. Peer Reviewed: Optical Sensing with Quantum Dots. Anal. Chem. 2002, 74, 520A–526A. [Google Scholar] [CrossRef]
- Cesewski, E.; Johnson, B.N. Electrochemical biosensors for pathogen detection. Biosens. Bioelectron. 2020, 159, 112214. [Google Scholar] [CrossRef]
- Baig, N.; Sajid, M.; Saleh, T.A. Recent trends in nanomaterial-modified electrodes for electroanalytical applications. TrAC—Trends Anal. Chem. 2018, 111, 47–61. [Google Scholar] [CrossRef]
- Paquet, C.; Kumacheva, E. Nanostructured polymers for photonics. Mater. Today 2008, 11, 48–56. [Google Scholar] [CrossRef]
- Jet, T.; Gines, G.; Rondelez, Y.; Taly, V. Advances in multiplexed techniques for the detection and quantification of microRNAs. Chem. Soc. Rev. 2021, 50, 4141–4161. [Google Scholar] [CrossRef]
- Dirks, R.M.; Pierce, N.A. Triggered amplification by hybridization chain reaction. Proc. Natl. Acad. Sci. USA 2004, 101, 15275–15278. [Google Scholar] [CrossRef]
- Bi, S.; Yue, S.; Zhang, S. Hybridization chain reaction: A versatile molecular tool for biosensing, bioimaging, and biomedicine. Chem. Soc. Rev. 2017, 46, 4281–4298. [Google Scholar] [CrossRef]
- Shao, H.; Lin, H.; Guo, Z.; Lu, J.; Jia, Y.; Ye, M.; Su, F.; Niu, L.; Kang, W.; Wang, S.; et al. A multiple signal amplification sandwich-type SERS biosensor for femtomolar detection of miRNA. Biosens. Bioelectron. 2019, 143, 111616. [Google Scholar] [CrossRef]
- Van Ness, J.; Van Ness, L.K.; Galas, D.J. Isothermal reactions for the amplification of oligonucleotides. Proc. Natl. Acad. Sci. USA 2003, 100, 4504–4509. [Google Scholar] [CrossRef]
- Reid, M.S.; Le, X.C.; Zhang, H. Exponential Isothermal Amplification of Nucleic Acids and Assays for Proteins, Cells, Small Molecules, and Enzyme Activities: An EXPAR Example. Angew. Chem. Int. Ed. 2018, 57, 11856–11866. [Google Scholar] [CrossRef] [PubMed]
- Zhou, B.; Lin, L.; Li, B. Exponential amplification reaction-based fluorescent sensor for the sensitive detection of tumor biomarker flap endonuclease 1. Sens. Actuators B Chem. 2021, 346, 130457. [Google Scholar] [CrossRef]
- Li, R.-D.; Yin, B.-C.; Ye, B.-C. Ultrasensitive, colorimetric detection of microRNAs based on isothermal exponential amplification reaction-assisted gold nanoparticle amplification. Biosens. Bioelectron. 2016, 86, 1011–1016. [Google Scholar] [CrossRef] [PubMed]
- Xu, Y.; Li, D.; Cheng, W.; Hu, R.; Sang, Y.; Yin, Y.; Ding, S.; Ju, H. Chemiluminescence imaging for microRNA detection based on cascade exponential isothermal amplification machinery. Anal. Chim. Acta 2016, 936, 229–235. [Google Scholar] [CrossRef]
- Ye, L.-P.; Hu, J.; Liang, L.; Zhang, C.-Y. Surface-enhanced Raman spectroscopy for simultaneous sensitive detection of multiple microRNAs in lung cancer cells. Chem. Commun. 2014, 50, 11883–11886. [Google Scholar] [CrossRef]
- Qian, J.; Zhang, Q.; Liu, M.; Wang, Y.; Lu, M. A portable system for isothermal amplification and detection of exosomal microRNAs. Biosens. Bioelectron. 2021, 196, 113707. [Google Scholar] [CrossRef]
- Jonstrup, S.P.; Koch, J.; Kjems, J. A microRNA detection system based on padlock probes and rolling circle amplification. RNA 2006, 12, 1747–1752. [Google Scholar] [CrossRef]
- Gao, H.; Zhang, K.; Teng, X.; Li, J. Rolling circle amplification for single cell analysis and in situ sequencing. TrAC—Trends Anal. Chem. 2019, 121, 115700. [Google Scholar] [CrossRef]
- Ali, M.M.; Li, F.; Zhang, Z.; Zhang, K.; Kang, D.-K.; Ankrum, J.A.; Le, X.C.; Zhao, W. Rolling circle amplification: A versatile tool for chemical biology, materials science and medicine. Chem. Soc. Rev. 2014, 43, 3324–3341. [Google Scholar] [CrossRef]
- Mohsen, M.G.; Kool, E.T. The Discovery of Rolling Circle Amplification and Rolling Circle Transcription. Acc. Chem. Res. 2016, 49, 2540–2550. [Google Scholar] [CrossRef]
- Shagin, D.A.; Rebrikov, D.V.; Kozhemyako, V.B.; Altshuler, I.M.; Shcheglov, A.S.; Zhulidov, P.A.; Bogdanova, E.A.; Staroverov, D.B.; Rasskazov, V.A.; Lukyanov, S. A Novel Method for SNP Detection Using a New Duplex-Specific Nuclease From Crab Hepatopancreas. Genome Res. 2002, 12, 1935–1942. [Google Scholar] [CrossRef]
- Wu, Y.; Cui, S.; Li, Q.; Zhang, R.; Song, Z.; Gao, Y.; Chen, W.; Xing, D. Recent advances in duplex-specific nuclease-based signal amplification strategies for microRNA detection. Biosens. Bioelectron. 2020, 165, 112449. [Google Scholar] [CrossRef]
- Zhang, K.; Wang, K.; Zhu, X.; Xu, F.; Xie, M. Sensitive detection of microRNA in complex biological samples by using two stages DSN-assisted target recycling signal amplification method. Biosens. Bioelectron. 2017, 87, 358–364. [Google Scholar] [CrossRef]
- Nimse, S.B.; Song, K.; Sonawane, M.D.; Sayyed, D.R.; Kim, T. Immobilization Techniques for Microarray: Challenges and Applications. Sensors 2014, 14, 22208–22229. [Google Scholar] [CrossRef]
- Gong, Q.; Han, H.; Yang, H.; Zhang, M.; Sun, X.; Liang, Y.; Liu, Z.; Zhang, W.; Qiao, J. Sensitive electrochemical DNA sensor for the detection of HIV based on a polyaniline/graphene nanocomposite. J. Mater. 2019, 5, 313–319. [Google Scholar] [CrossRef]
- Rashid, J.I.A.; Yusof, N.A. The strategies of DNA immobilization and hybridization detection mechanism in the construction of electrochemical DNA sensor: A review. Sens. Bio-Sens. Res. 2017, 16, 19–31. [Google Scholar] [CrossRef]
- Rotz, M.W.; Holbrook, R.J.; MacRenaris, K.W.; Meade, T.J. A Markedly Improved Synthetic Approach for the Preparation of Multifunctional Au-DNA Nanoparticle Conjugates Modified with Optical and MR Imaging Probes. Bioconjugate Chem. 2018, 29, 3544–3549. [Google Scholar] [CrossRef]
- Roushani, M.; Shahdost-Fard, F. Fabrication of an electrochemical nanoaptasensor based on AuNPs for ultrasensitive determination of cocaine in serum sample. Mater. Sci. Eng. C 2016, 61, 599–607. [Google Scholar] [CrossRef]
- Adeel, M.; Bilal, M.; Rasheed, T.; Sharma, A.; Iqbal, H.M. Graphene and graphene oxide: Functionalization and nano-bio-catalytic system for enzyme immobilization and biotechnological perspective. Int. J. Biol. Macromol. 2018, 120, 1430–1440. [Google Scholar] [CrossRef]
- Wang, Q.; Ding, Y.; Gao, F.; Jiang, S.; Zhang, B.; Ni, J.; Gao, F. A sensitive DNA biosensor based on a facile sulfamide coupling reaction for capture probe immobilization. Anal. Chim. Acta 2013, 788, 158–164. [Google Scholar] [CrossRef]
- Jiang, Y.; Wu, J. Recent development in chitosan nanocomposites for surface-based biosensor applications. Electrophoresis 2019, 40, 2084–2097. [Google Scholar] [CrossRef]
- Luong, J.H.T.; Vashist, S.K. Chemistry of Biotin–Streptavidin and the Growing Concern of an Emerging Biotin Interference in Clinical Immunoassays. ACS Omega 2019, 5, 10–18. [Google Scholar] [CrossRef] [PubMed]
- Liu, H.; Li, Y.; Dykes, J.; Gilliam, T.; Burnham, K.; Chopra, N. Manipulating the functionalization surface of graphene-encapsulated gold nanoparticles with single-walled carbon nanotubes for SERS sensing. Carbon 2018, 140, 306–313. [Google Scholar] [CrossRef]
- Wijesinghe, K.M.; Kanak, M.A.; Harrell, J.C.; Dhakal, S. Single-Molecule Sensor for High-Confidence Detection of miRNA. ACS Sens. 2022, 7, 1086–1094. [Google Scholar] [CrossRef] [PubMed]
- Clark, L.C., Jr.; Lyons, C. Electrode systems for continuous monitoring in cardiovascular surgery. Ann. N. Y. Acad. Sci. 1962, 102, 29–45. [Google Scholar] [CrossRef]
- Grieshaber, D.; MacKenzie, R.; Vörös, J.; Reimhult, E. Electrochemical Biosensors—Sensor Principles and Architectures. Sensors 2008, 8, 1400–1458. [Google Scholar] [CrossRef]
- Pohanka, M.; Skládal, P. Electrochemical biosensors—Principles and applications. J. Appl. Biomed. 2008, 6, 57–64. [Google Scholar] [CrossRef]
- Kurbanoglu, S.; Ozkan, S.A.; Merkoçi, A. Nanomaterials-based enzyme electrochemical biosensors operating through inhibition for biosensing applications. Biosens. Bioelectron. 2017, 89, 886–898. [Google Scholar] [CrossRef]
- Metters, J.P.; Kadara, R.O.; Banks, C.E. New directions in screen printed electroanalytical sensors: An overview of recent developments. Analyst 2011, 136, 1067–1076. [Google Scholar] [CrossRef]
- Yammouri, G.; Mohammadi, H.; Amine, A. A Highly Sensitive Electrochemical Biosensor Based on Carbon Black and Gold Nanoparticles Modified Pencil Graphite Electrode for microRNA-21 Detection. Chem. Afr. 2019, 2, 291–300. [Google Scholar] [CrossRef]
- Zhong, X.; Li, X.; Zhuo, Y.; Chai, Y.; Yuan, R. Synthesizing anode electrochemiluminescent self-catalyzed carbon dots-based nanocomposites and its application in sensitive ECL biosensor for microRNA detection. Sens. Actuators B Chem. 2019, 305, 127490. [Google Scholar] [CrossRef]
- Li, H.; Cai, Q.; Yan, X.; Jie, G.; Jie, G. Ratiometric electrochemical biosensor based on silver nanoparticles coupled with walker amplification for sensitive detection of microRNA. Sens. Actuators B Chem. 2021, 353, 131115. [Google Scholar] [CrossRef]
- Tian, R.; Ning, W.; Chen, M.; Zhang, C.; Li, Q.; Bai, J. High performance electrochemical biosensor based on 3D nitrogen-doped reduced graphene oxide electrode and tetrahedral DNA nanostructure. Talanta 2018, 194, 273–281. [Google Scholar] [CrossRef]
- Wang, Y.; Meng, W.; Chen, X.; Zhang, Y. DNA-templated copper nanoparticles as signalling probe for electrochemical determination of microRNA-222. Microchim. Acta 2019, 187, 4. [Google Scholar] [CrossRef]
- Ma, Y.; Liu, N.; Xu, Z.; Wang, J.; Luo, X. An ultrasensitive biosensor based on three-dimensional nanoporous conducting polymer decorated with gold nanoparticles for microRNA detection. Microchem. J. 2020, 161, 105780. [Google Scholar] [CrossRef]
- Yang, L.; Wang, H.; Lü, H.; Hui, N. Phytic acid functionalized antifouling conducting polymer hydrogel for electrochemical detection of microRNA. Anal. Chim. Acta 2020, 1124, 104–112. [Google Scholar] [CrossRef]
- Torul, H.; Yarali, E.; Eksin, E.; Ganguly, A.; Benson, J.; Tamer, U.; Papakonstantinou, P.; Erdem, A. Paper-Based Electrochemical Biosensors for Voltammetric Detection of miRNA Biomarkers Using Reduced Graphene Oxide or MoS2 Nanosheets Decorated with Gold Nanoparticle Electrodes. Biosensors 2021, 11, 236. [Google Scholar] [CrossRef]
- Pothipor, C.; Jakmunee, J.; Bamrungsap, S.; Ounnunkad, K. An electrochemical biosensor for simultaneous detection of breast cancer clinically related microRNAs based on a gold nanoparticles/graphene quantum dots/graphene oxide film. Analyst 2021, 146, 4000–4009. [Google Scholar] [CrossRef]
- Pingarrón, J.M.; Yáñez-Sedeño, P.; González-Cortés, A. Gold nanoparticle-based electrochemical biosensors. Electrochim. Acta 2008, 53, 5848–5866. [Google Scholar] [CrossRef]
- Shoaie, N.; Forouzandeh, M.; Omidfar, K. Highly Sensitive Electrochemical Biosensor Based on Polyaniline and Gold Nanoparticles for DNA Detection. IEEE Sens. J. 2017, 18, 1835–1843. [Google Scholar] [CrossRef]
- Ivanova, O.S.; Zamborini, F.P. Size-Dependent Electrochemical Oxidation of Silver Nanoparticles. J. Am. Chem. Soc. 2009, 132, 70–72. [Google Scholar] [CrossRef]
- Duque, T.; Ribeiro, A.C.C.; de Camargo, H.S.; Filho, P.A.D.C.; Cavalcante, H.P.M.; Lopes, D. New Insights on Optical Biosensors: Techniques, Construction and Application. In State of the Art in Biosensors—General Aspects; IntechOpen: London, UK, 2013. [Google Scholar] [CrossRef]
- Chen, C.; Wang, J. Optical biosensors: An exhaustive and comprehensive review. Analyst 2020, 145, 1605–1628. [Google Scholar] [CrossRef]
- Pattnaik, P. Surface Plasmon Resonance: Applications in Understanding Receptor–Ligand Interaction. Appl. Biochem. Biotechnol. 2005, 126, 079–092. [Google Scholar] [CrossRef] [PubMed]
- Kazuma, E.; Tatsuma, T. Localized surface plasmon resonance sensors based on wavelength-tunable spectral dips. Nanoscale 2013, 6, 2397–2405. [Google Scholar] [CrossRef] [PubMed]
- Li, D.; Xia, L.; Zhou, Q.; Wang, L.; Chen, D.; Gao, X.; Li, Y. Label-Free Detection of miRNA Using Surface-Enhanced Raman Spectroscopy. Anal. Chem. 2020, 92, 12769–12773. [Google Scholar] [CrossRef]
- Arwin, H. Is ellipsometry suitable for sensor applications? Sens. Actuators A Phys. 2001, 92, 43–51. [Google Scholar] [CrossRef]
- Agranat, A.J.; Kabessa, Y.; Shemer, B.; Shpigel, E.; Schwartsglass, O.; Atamneh, L.; Uziel, Y.; Ejzenberg, M.; Mizrachi, Y.; Garcia, Y.; et al. An autonomous bioluminescent bacterial biosensor module for outdoor sensor networks, and its application for the detection of buried explosives. Biosens. Bioelectron. 2021, 185, 113253. [Google Scholar] [CrossRef]
- Hakimian, F.; Ghourchian, H.; Hashemi, A.S.; Arastoo, M.R.; Rad, M.B. Ultrasensitive optical biosensor for detection of miRNA-155 using positively charged Au nanoparticles. Sci. Rep. 2018, 8, 2943. [Google Scholar] [CrossRef]
- Borghei, Y.S.; Hosseini, M.; Ganjali, M.R. A label-free luminescent light switching system for miRNA detection based on two color quantum dots. J. Photochem. Photobiol. A Chem. 2020, 391, 112351. [Google Scholar] [CrossRef]
- Zhang, H.; Yi, Y.; Zhou, C.; Ying, G.; Zhou, X.; Fu, C.; Zhu, Y.; Shen, Y. SERS detection of microRNA biomarkers for cancer diagnosis using gold-coated paramagnetic nanoparticles to capture SERS-active gold nanoparticles. RSC Adv. 2017, 7, 52782–52793. [Google Scholar] [CrossRef]
- Ge, J.; Hu, Y.; Deng, R.; Li, Z.; Zhang, K.; Shi, M.; Yang, D.; Cai, R.; Tan, W. Highly Sensitive MicroRNA Detection by Coupling Nicking-Enhanced Rolling Circle Amplification with MoS2 Quantum Dots. Anal. Chem. 2020, 92, 13588–13594. [Google Scholar] [CrossRef]
- Liu, R.; Wang, Q.; Li, Q.; Yang, X.; Wang, K.; Nie, W. Surface plasmon resonance biosensor for sensitive detection of microRNA and cancer cell using multiple signal amplification strategy. Biosens. Bioelectron. 2017, 87, 433–438. [Google Scholar] [CrossRef]
- Shin, B.; Kim, W.-K.; Yoon, S.; Lee, J. Duplex DNA-functionalized graphene oxide: A versatile platform for miRNA sensing. Sens. Actuators B Chem. 2019, 305, 127471. [Google Scholar] [CrossRef]
- Chavoshy, H.Z.; Ghasemi, R. Fabrication of a novel fluorescent polyacrylonitrile electrospun nanofiber for DNA-based optical biosensing of microRNA-21. Nano Express 2020, 1, 020031. [Google Scholar] [CrossRef]
- Zhu, Y.; Qiu, D.; Yang, G.; Wang, M.; Zhang, Q.; Wang, P.; Ming, H.; Zhang, D.; Yu, Y.; Zou, G.; et al. Selective and sensitive detection of MiRNA-21 based on gold-nanorod functionalized polydiacetylene microtube waveguide. Biosens. Bioelectron. 2016, 85, 198–204. [Google Scholar] [CrossRef]
- Ko, H.; Singamaneni, S.; Tsukruk, V.V. Nanostructured Surfaces and Assemblies as SERS Media. Small 2008, 4, 1576–1599. [Google Scholar] [CrossRef]
- Shahbazi, N.; Zare-Dorabei, R.; Naghib, S.M. Multifunctional nanoparticles as optical biosensing probe for breast cancer detection: A review. Mater. Sci. Eng. C 2021, 127, 112249. [Google Scholar] [CrossRef]
- Wei, L.; Lu, J.; Xu, H.; Patel, A.; Chen, Z.-S.; Chen, G. Silver nanoparticles: Synthesis, properties, and therapeutic applications. Drug Discov. Today 2015, 20, 595–601. [Google Scholar] [CrossRef]
- Wu, J.; Jia, L.; Zhang, Y.; Qu, Y.; Jia, B.; Moss, D.J. Graphene Oxide for Integrated Photonics and Flat Optics. Adv. Mater. 2020, 33, e2006415. [Google Scholar] [CrossRef]
- Zheng, P.; Wu, N. Fluorescence and Sensing Applications of Graphene Oxide and Graphene Quantum Dots: A Review. Chem. Asian J. 2017, 12, 2343–2353. [Google Scholar] [CrossRef]


| Target | Electrochemical Signal | Nanomaterials | Detection Strategy | LOD | Ref. |
|---|---|---|---|---|---|
| miR-21 | DPV | AuNPs | Hybridization with capture miRNA probe | 1 fM | [132] |
| SWV | Biotinylated-AgNPs, Streptavidin-AgNPs | SDR amplification | 0.4 fM | [84] | |
| DPV | AuPtBNPs | Hybridization with cDNA capture probe | 0.63 fM | [86] | |
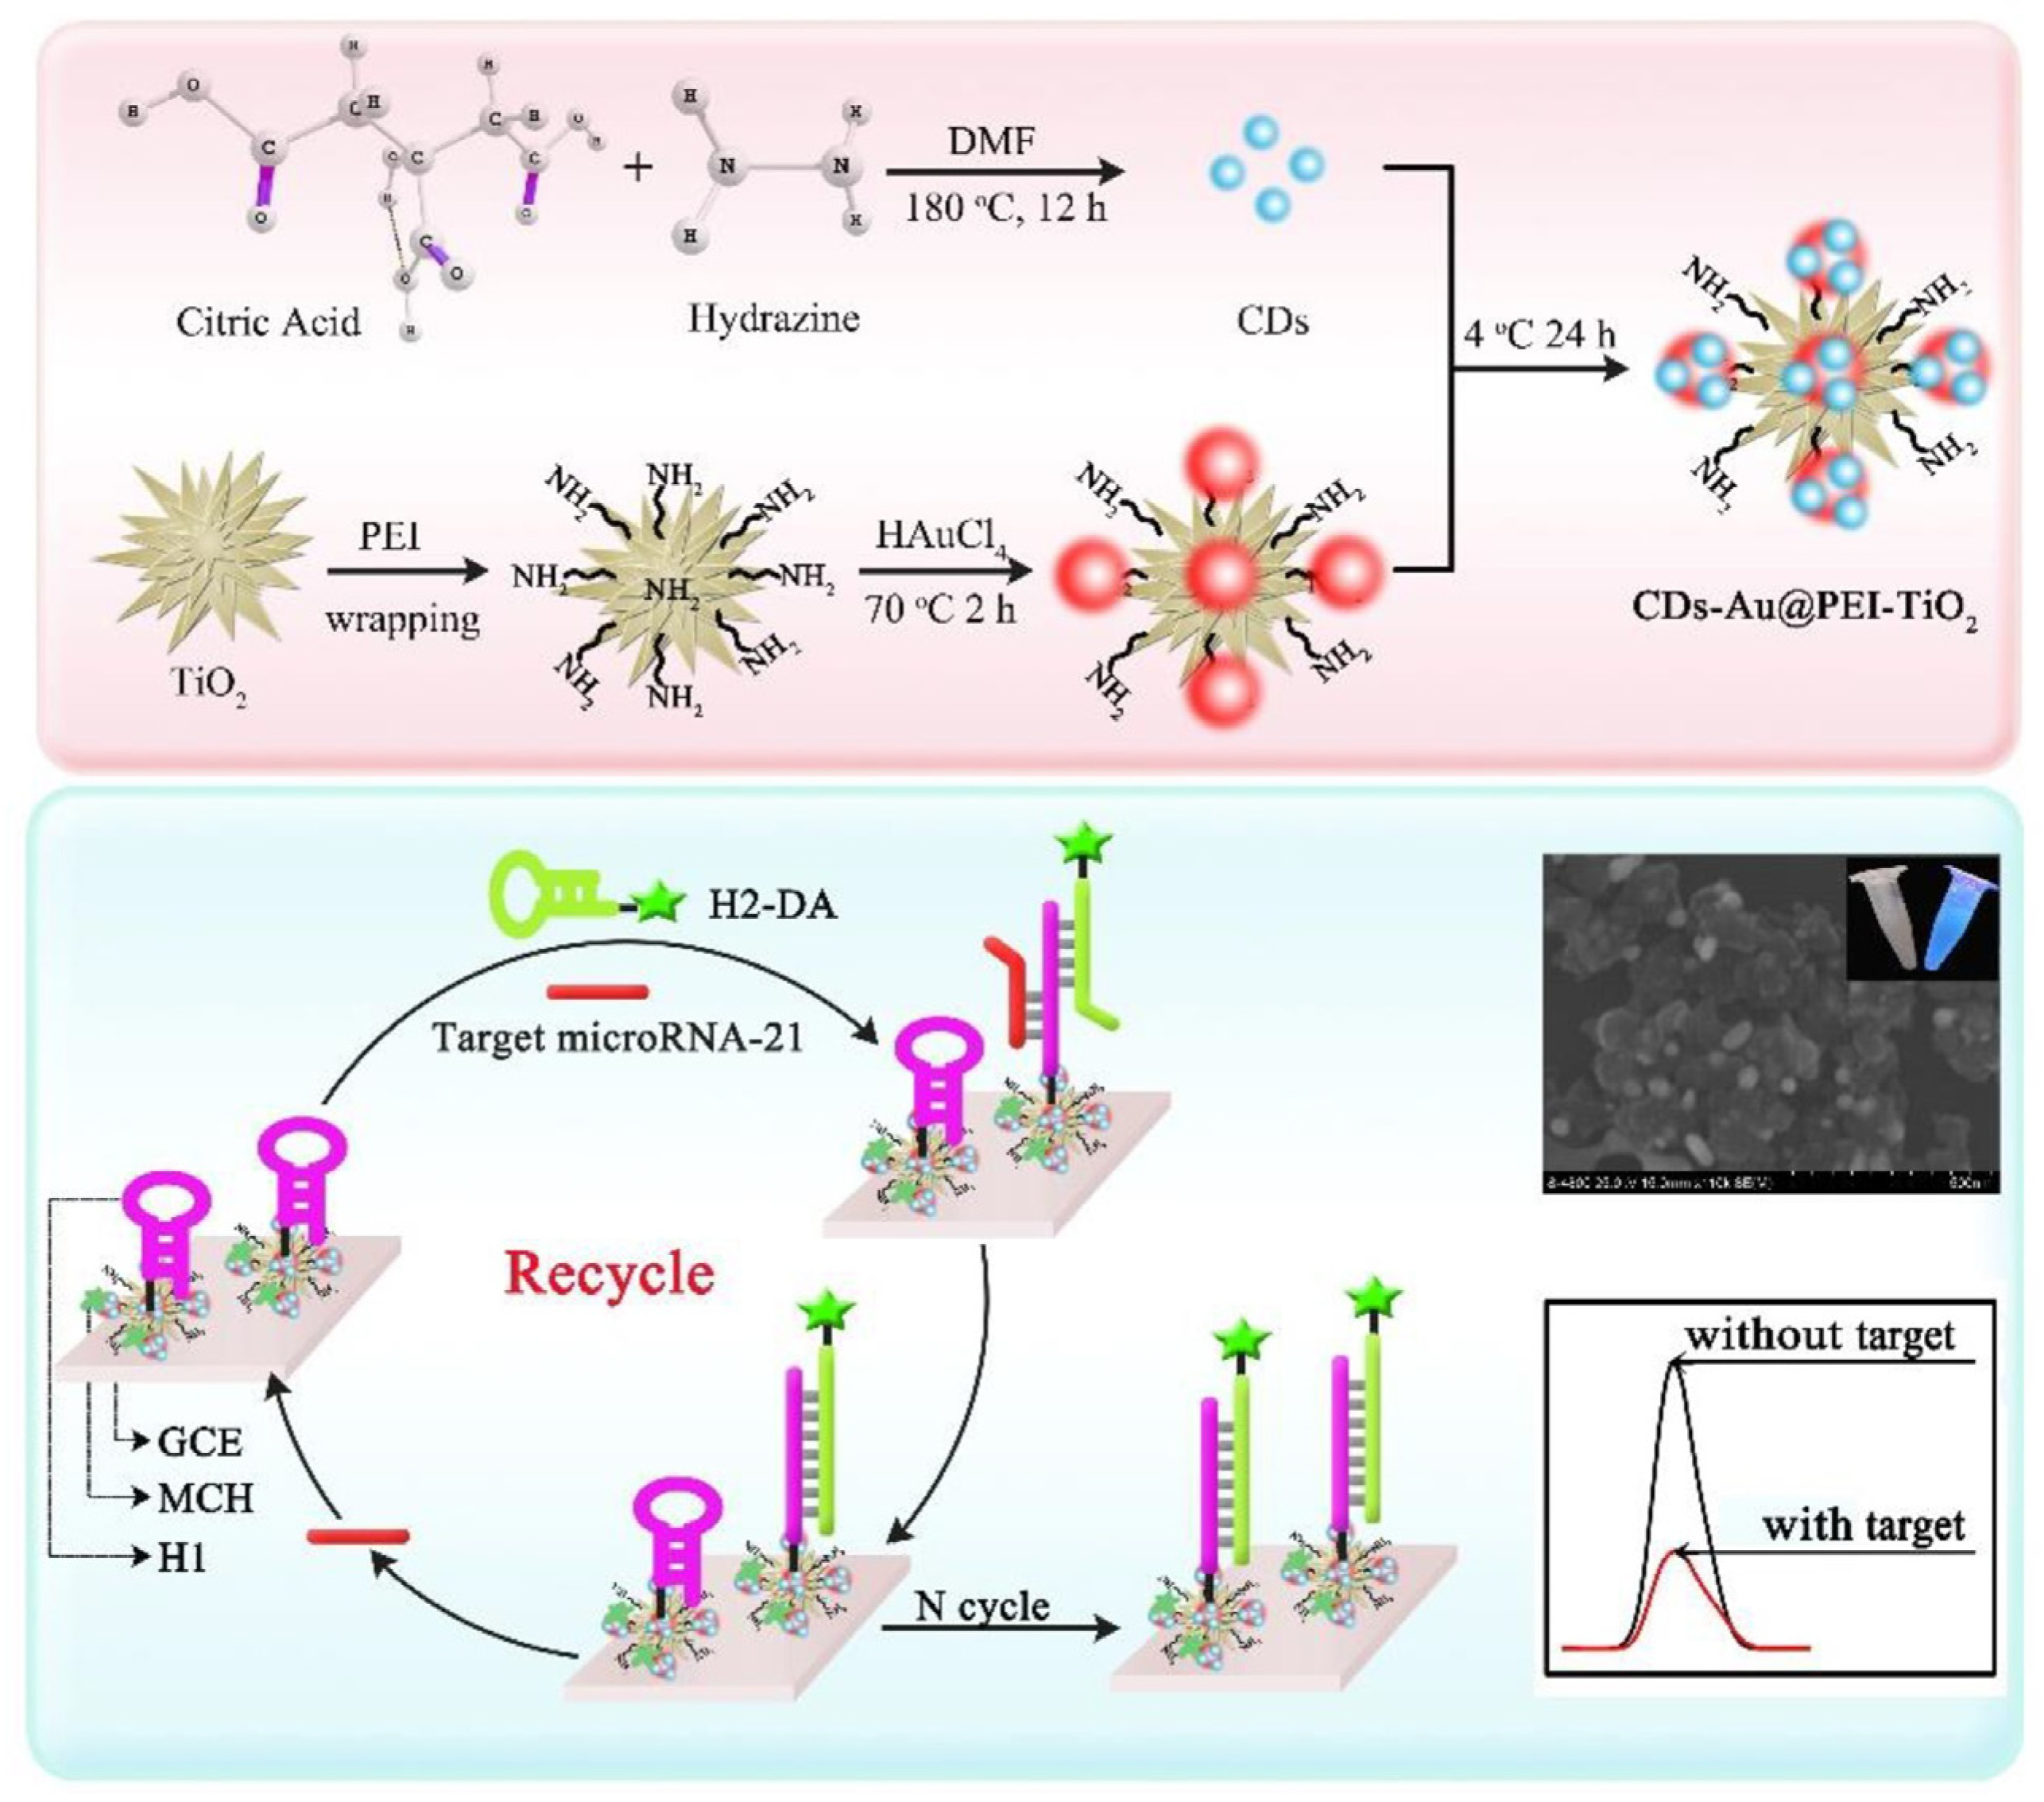
| ECL, EIS | CQDs-Au-PEI@TiO2 | CHA amplification | 0.03 fM | [133] | |
| miR-21-5p | EIS | AuNPs | Hybridization with anti-miRNA probe | 4.31 fM | [83] |
| miR-155 | DPV | AgNPs | DNA walker amplification | 3.2 fM | [134] |
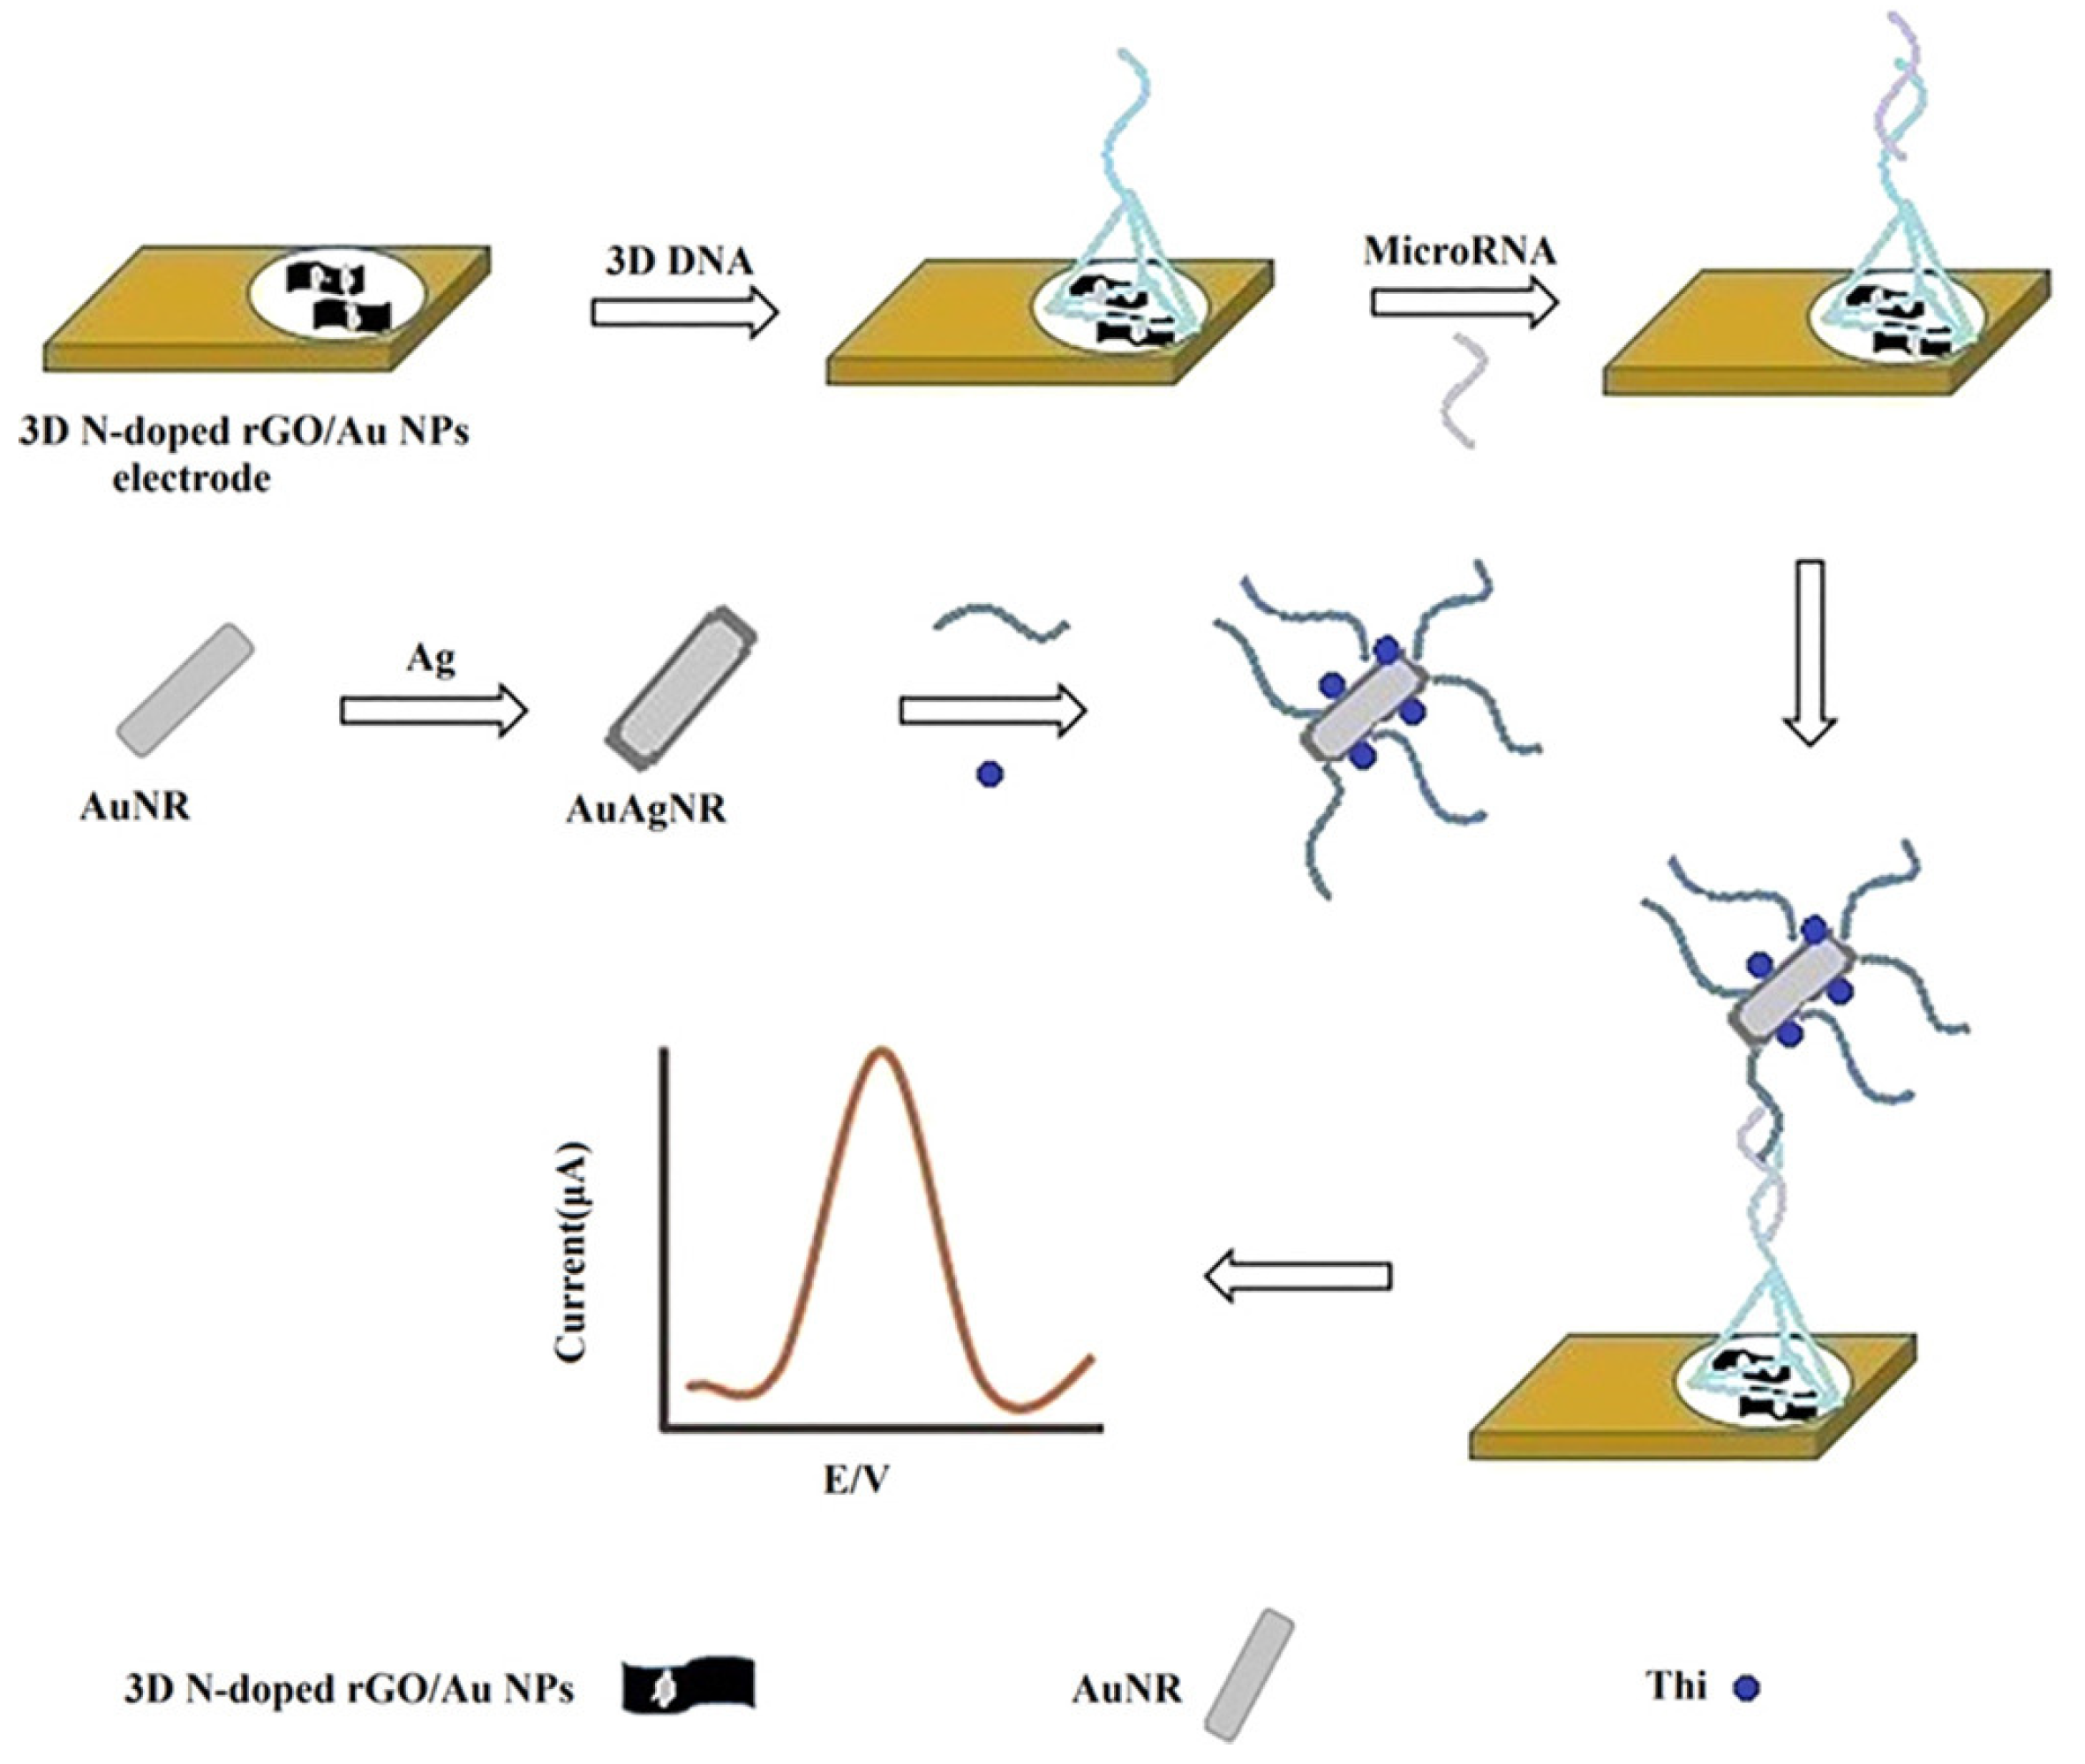
| DPV | 3D-N-doped rGO/AuNPs | Hybridization with AuAgNR/Thi/F complementary DNA probe | 1 pM | [135] | |
| miR-222 | DPV | rGO, AuNPs, DNA-CuNPs as signal probe | HCR amplification | 0.03 fM | [136] |
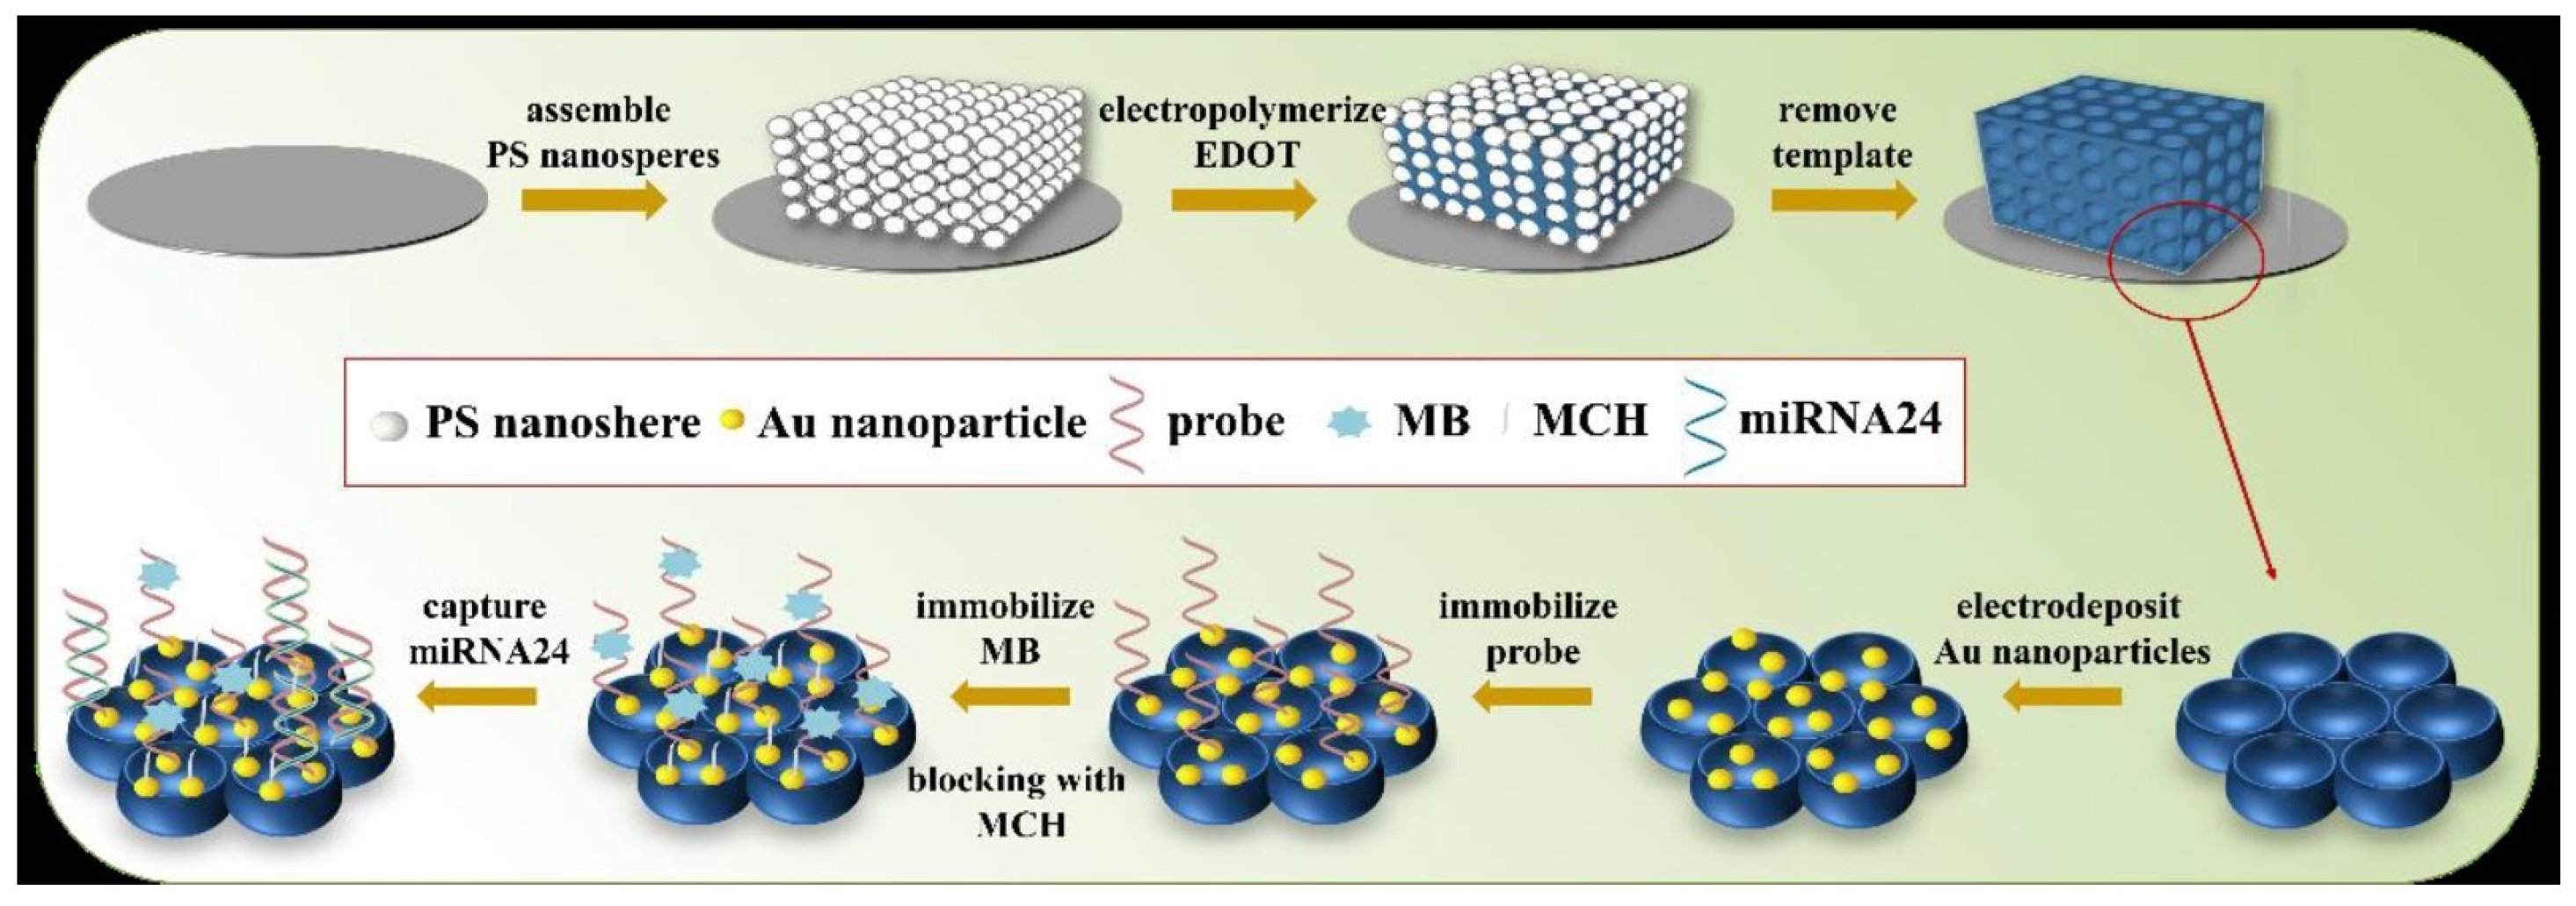
| miR-24 | DPV | AuNPs/PEDOT | Hybridization with DNA capture probe | 0.38 fM | [137] |
| DPV | PANI/PA | Hybridization with DNA capture probe | 0.34 fM | [138] | |
| Multiplex detection: miR-155 and miR-21 | DPV | AuNPs/rGO, AuNPs/MoSs | Hybridization with DNA capture probe | For AuNPs/RGO 12.0 nM (miR-21) 25.7 nM (miR-155) For AuNPs/MoS2 51.6 nM (miR-21) 59.6 nM (miR-155) | [139] |
| Multiplex detection: miR-155, miR-21 and miR-210 | SWV | AuNPs/GQDs/GO | Hybridization with miRNA probe | 0.04 fM (miR-21) 0.33 fM (miR-155) 0.28 fM (miR-210) | [140] |
| miRNA Target | Optical Signal | Nanomaterial | Detection Strategy | LOD | Ref. |
|---|---|---|---|---|---|
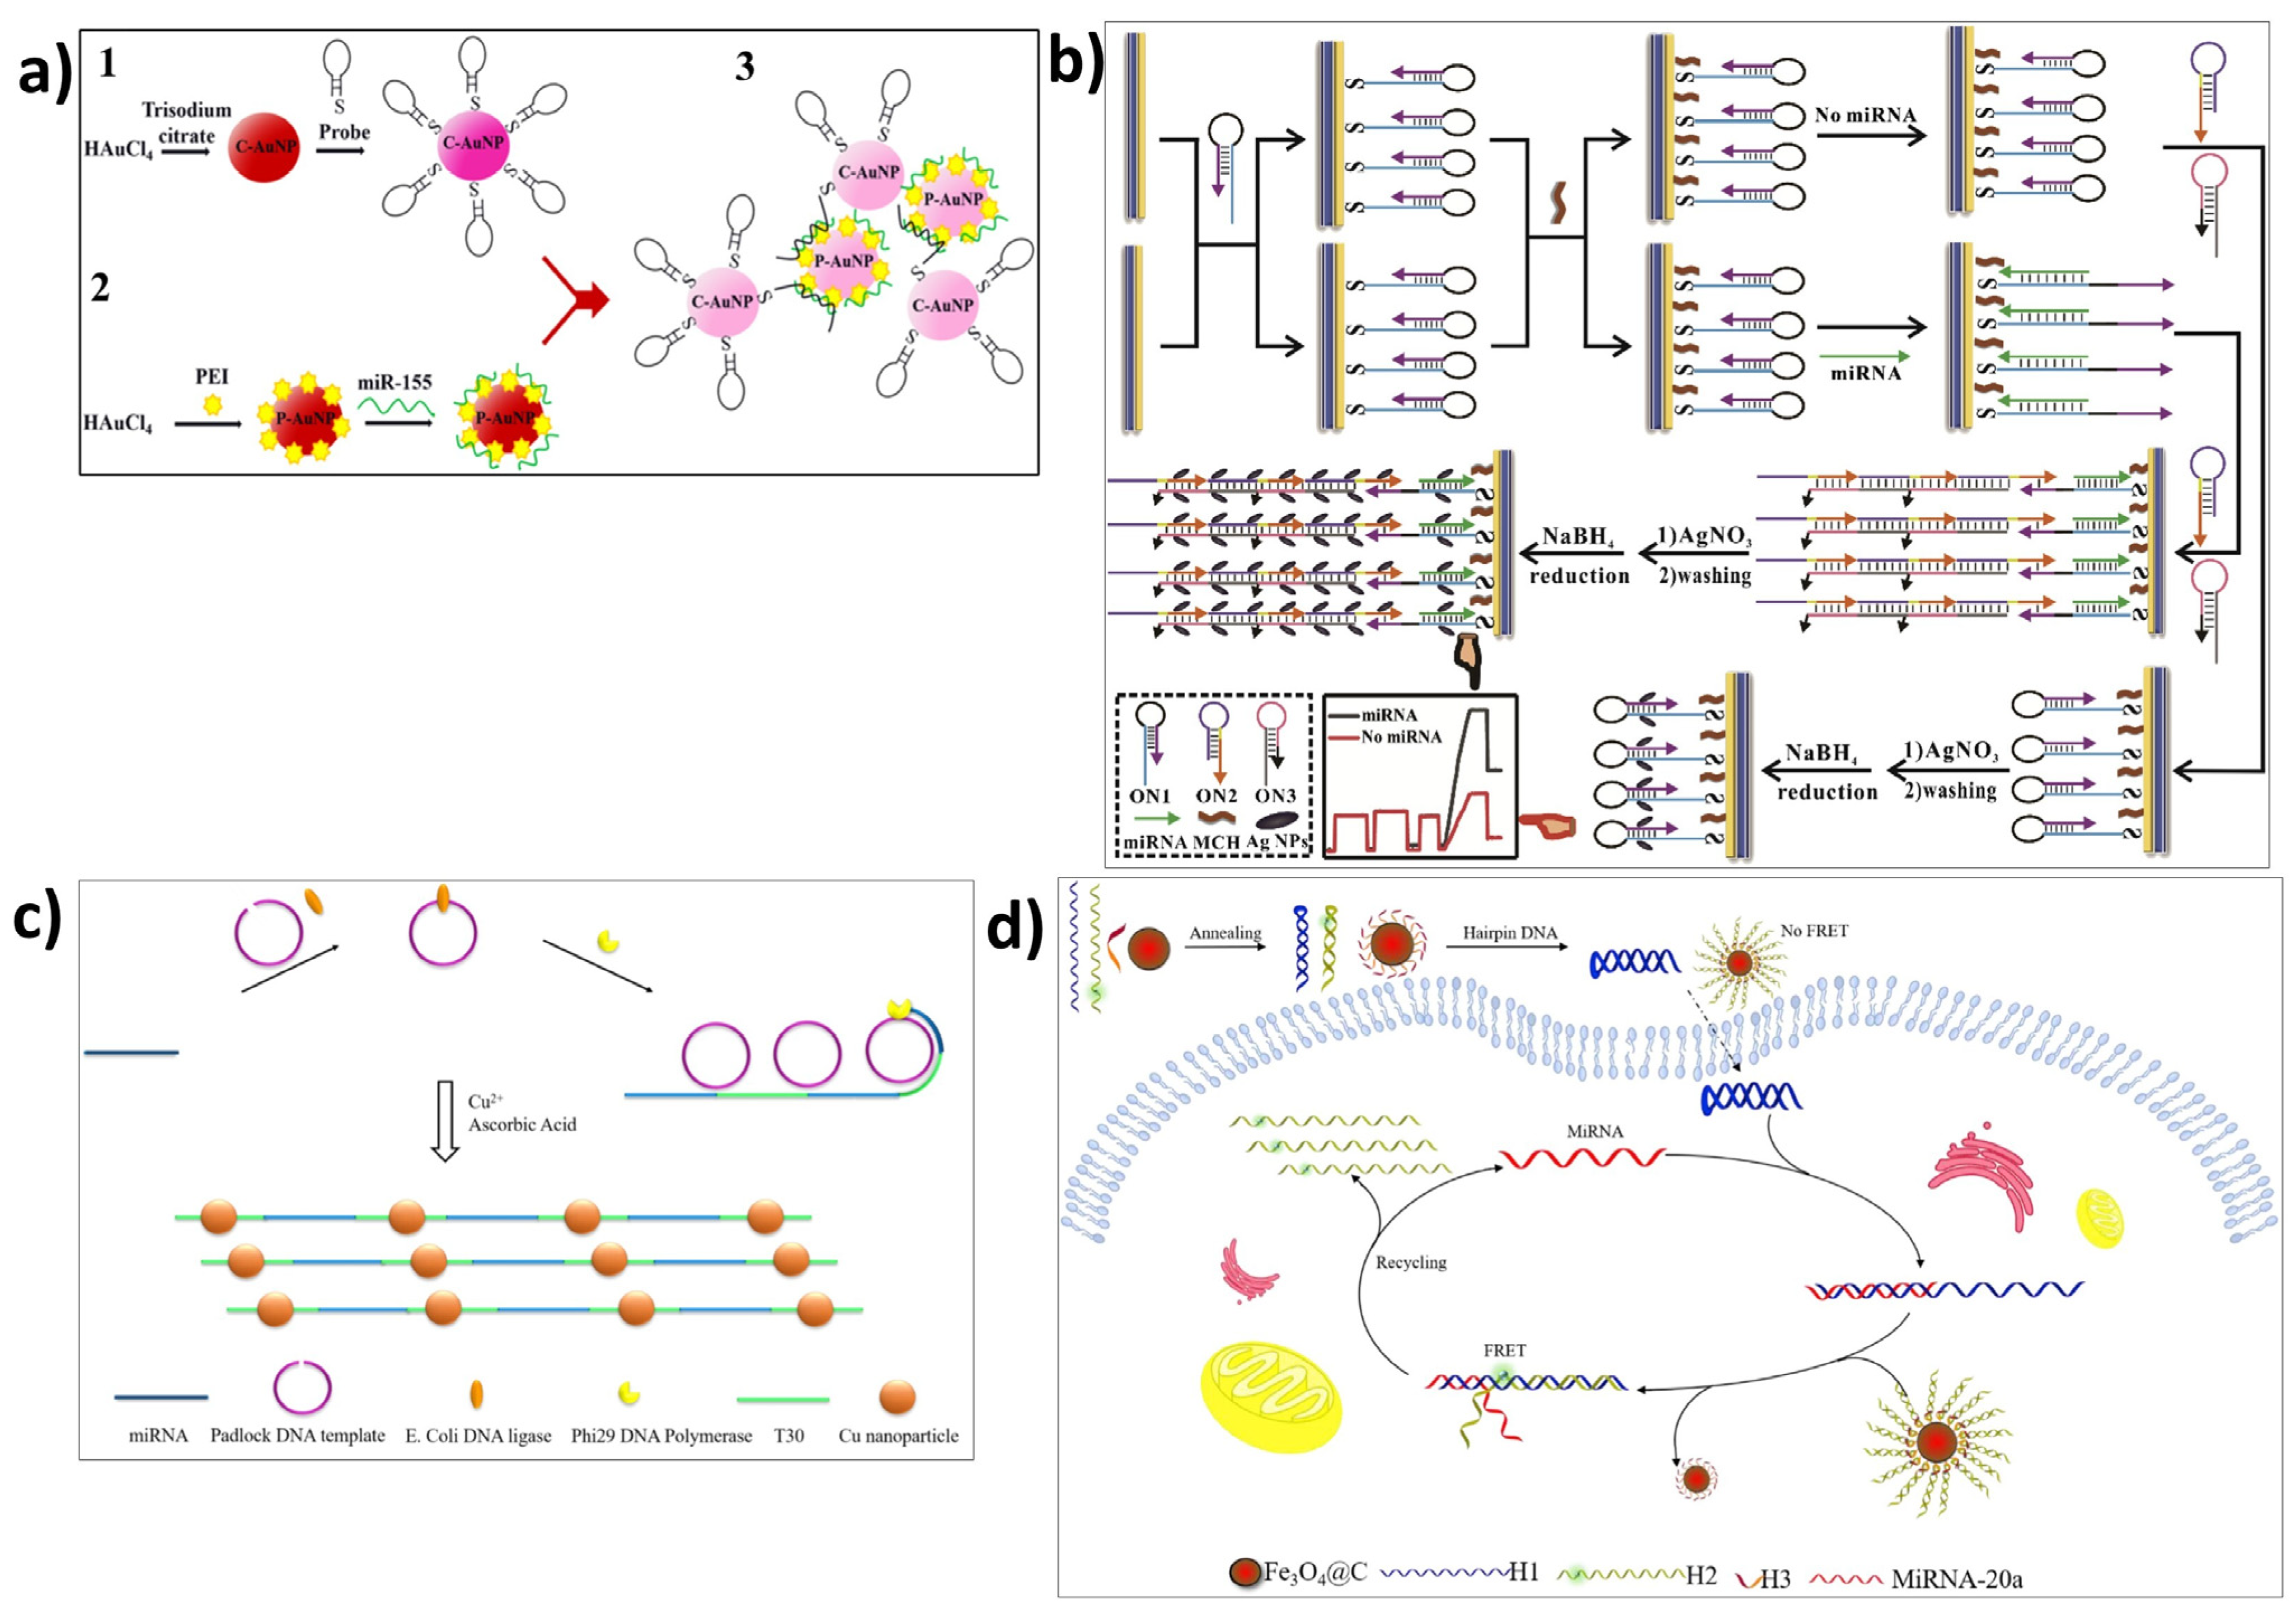
| miR-155 | Colorimetric assay | C-AuNPs and P-AuNPs | Hybridization with hairpin-DNA probe | 100 aM | [151] |
| Fluorescence | Green and orange-emitting CdTe QDs | Hybridization with ds-DNA probe | 14 pM | [152] | |
| miR-141 | SERS | Au@MNPs | Hybridization with labeled (Raman reporter) DNA probe | 100 fM | [153] |
| let-7a | SPR | AgNPs | HCR | 0.35 fM | [88] |
| Fluorescence | CuNPs | RCA | 70.6 fM | [89] | |
| Chemiluminescence | MoS2 QDs | RCA | 4.6 fM | [154] | |
| miR-21 | SPR | AuNPs@DNA@AgNPs | Hybridization with AuNPs@DNA supersandwich structure | 0.6 fM | [155] |
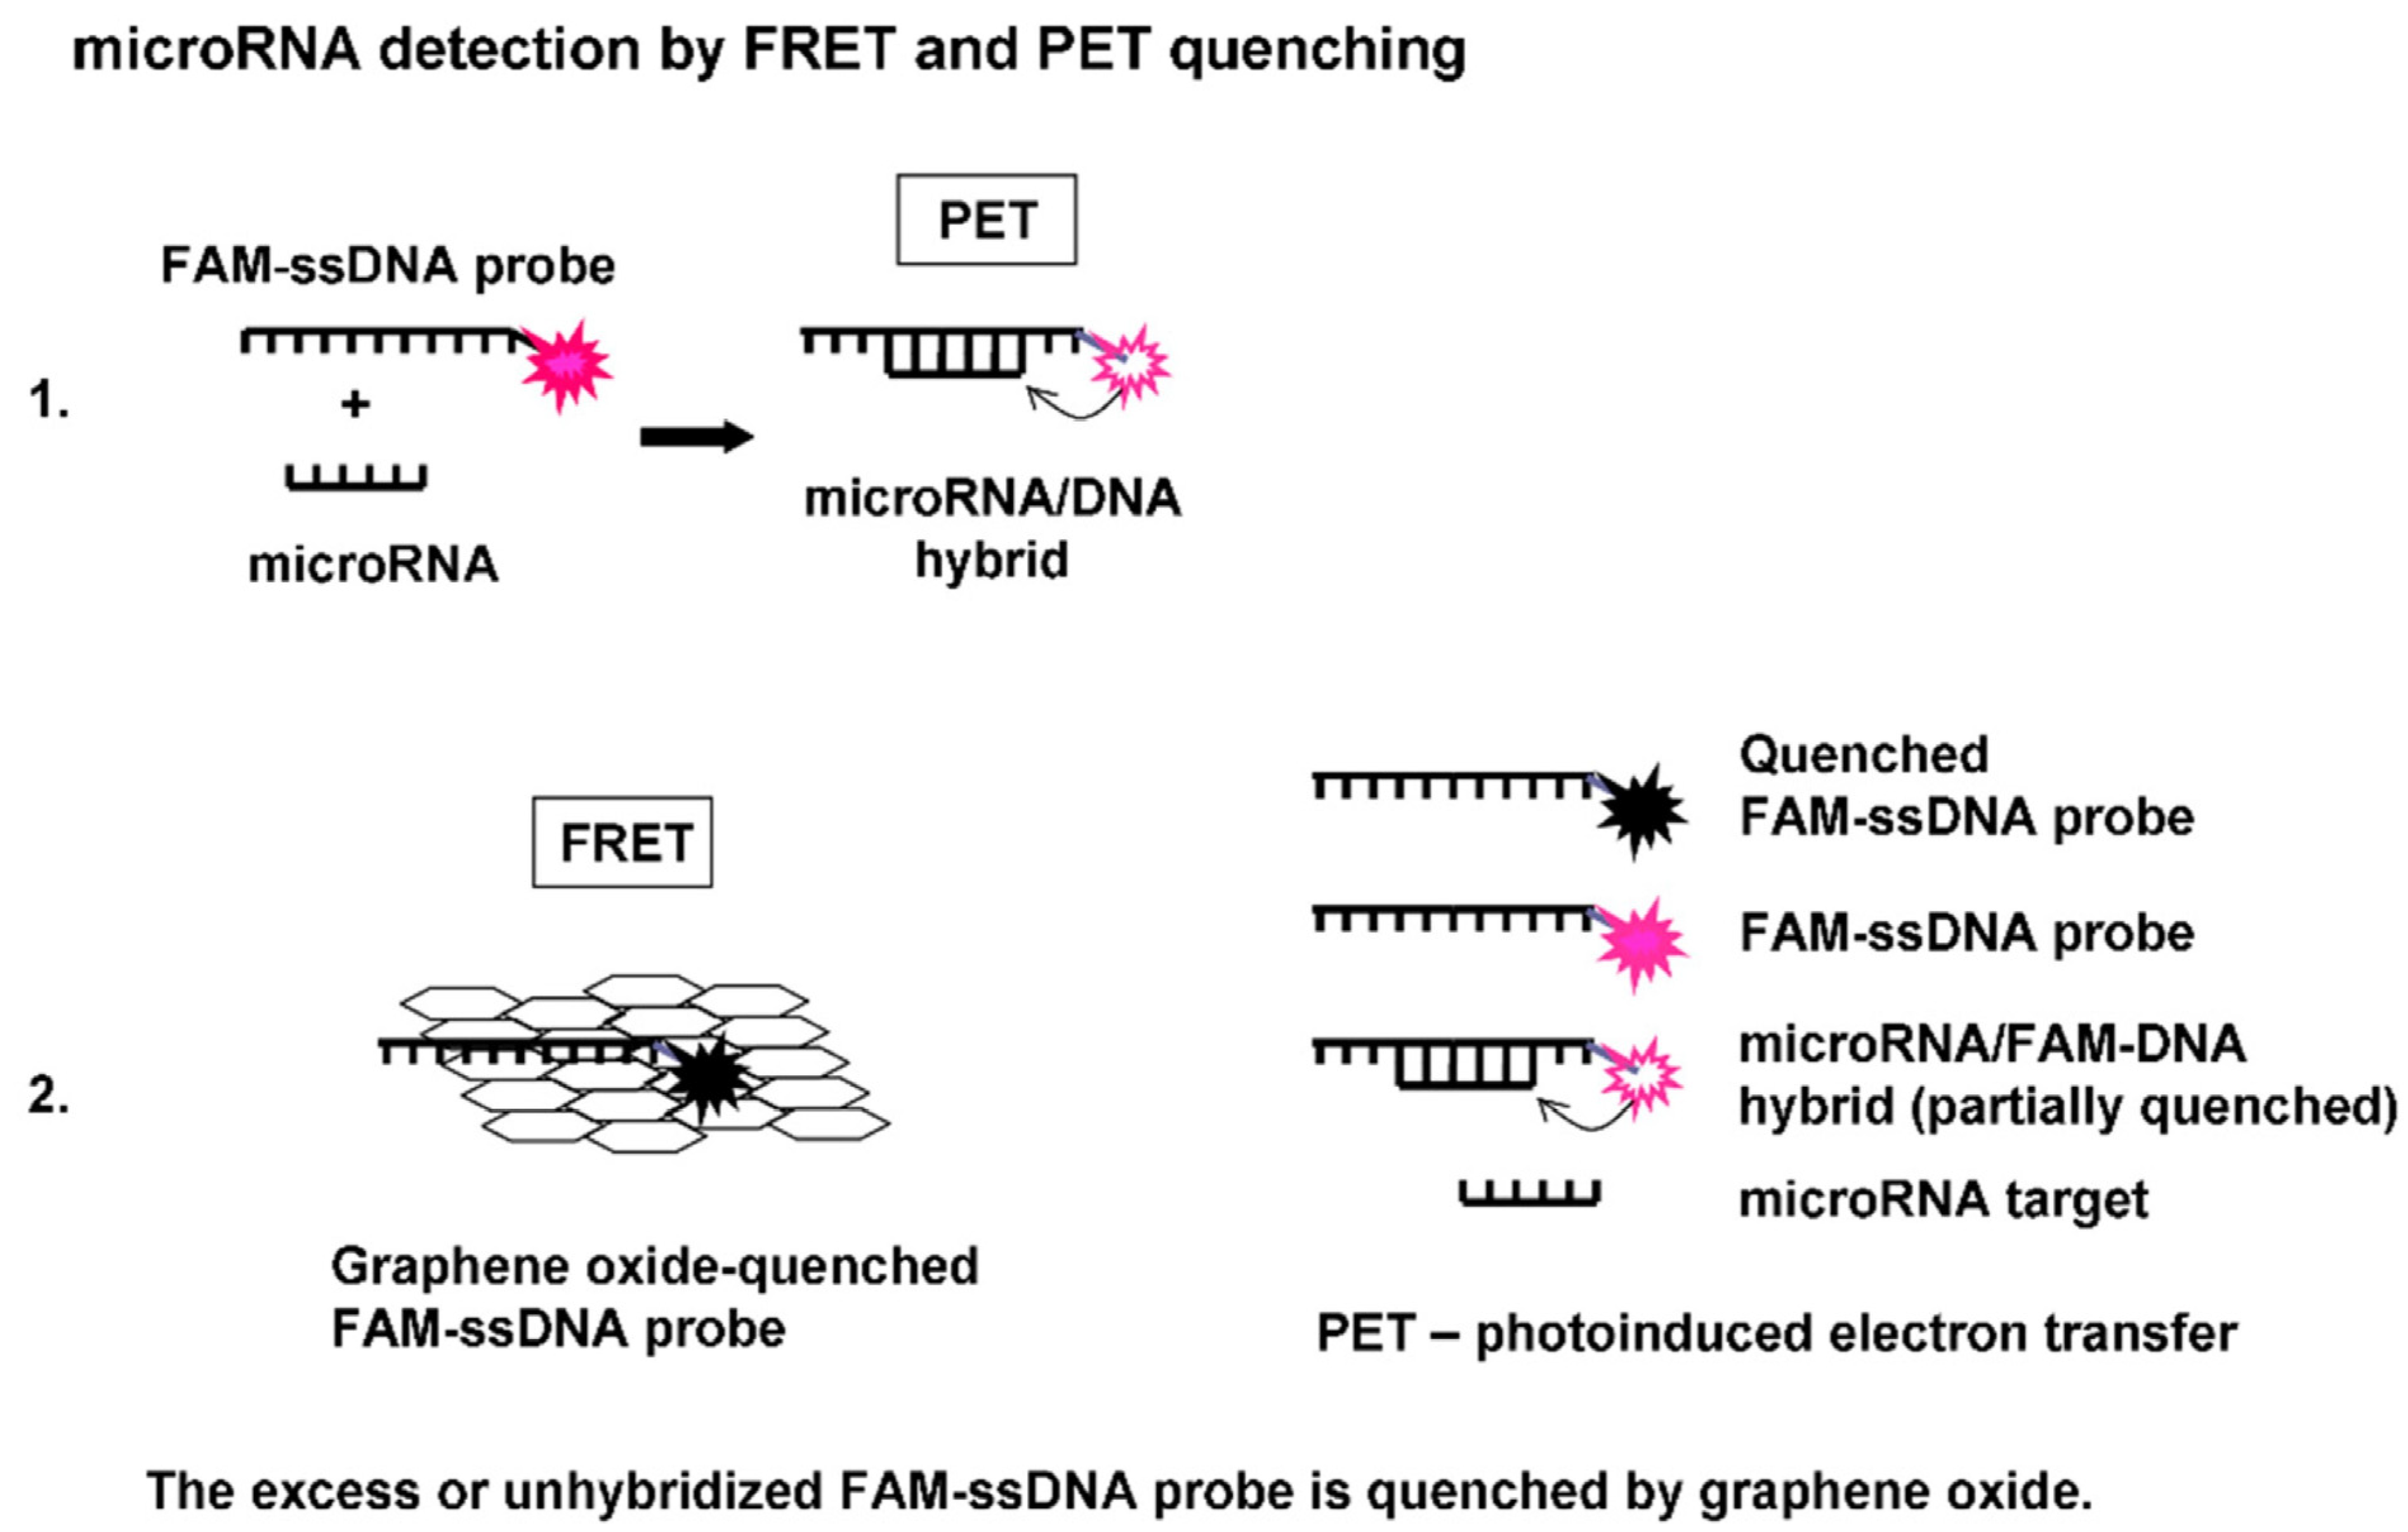
| Fluorescence | GO | Hybridization with fluorescent-labeled ssDNA probe | 1 nM | [92] | |
| Fluorescence | GO | Hybridization with fluorescent-labeled DNA probe | 99.3 pM | [156] | |
| Fluorescence | FPAN@CdSe/ZnS QDs | Hybridization with miRNA-21 complementary probe | 1 pM | [157] | |
| Fluorescence | PDA@AuNRs | Hybridization with DNA probe | 0.01 nM | [158] | |
| miR-20a | Fluorescence | Fe3O4@C | CHA | 4.91 × 10⁻⁴ nM | [90] |
Disclaimer/Publisher’s Note: The statements, opinions and data contained in all publications are solely those of the individual author(s) and contributor(s) and not of MDPI and/or the editor(s). MDPI and/or the editor(s) disclaim responsibility for any injury to people or property resulting from any ideas, methods, instructions or products referred to in the content. |
© 2023 by the authors. Licensee MDPI, Basel, Switzerland. This article is an open access article distributed under the terms and conditions of the Creative Commons Attribution (CC BY) license (https://creativecommons.org/licenses/by/4.0/).
Share and Cite
Martino, S.; Tammaro, C.; Misso, G.; Falco, M.; Scrima, M.; Bocchetti, M.; Rea, I.; De Stefano, L.; Caraglia, M. microRNA Detection via Nanostructured Biochips for Early Cancer Diagnostics. Int. J. Mol. Sci. 2023, 24, 7762. https://doi.org/10.3390/ijms24097762
Martino S, Tammaro C, Misso G, Falco M, Scrima M, Bocchetti M, Rea I, De Stefano L, Caraglia M. microRNA Detection via Nanostructured Biochips for Early Cancer Diagnostics. International Journal of Molecular Sciences. 2023; 24(9):7762. https://doi.org/10.3390/ijms24097762
Chicago/Turabian StyleMartino, Sara, Chiara Tammaro, Gabriella Misso, Michela Falco, Marianna Scrima, Marco Bocchetti, Ilaria Rea, Luca De Stefano, and Michele Caraglia. 2023. "microRNA Detection via Nanostructured Biochips for Early Cancer Diagnostics" International Journal of Molecular Sciences 24, no. 9: 7762. https://doi.org/10.3390/ijms24097762