
Metabolite Profiling of the Gut–Renal–Cerebral Axis Reveals a Particular Pattern in Early Diabetic Kidney Disease in T2DM Patients

 , ,
, ,
Abstract
: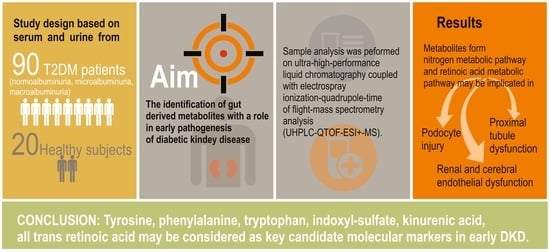
1. Introduction
2. Results
2.1. The Comparison of Patients with DKD (P Group) and the Control Individuals (C Group) by Multivariate Analysis of Serum and Urine Samples
2.2. The Comparison of DKD Subgroups (Normoalbuminuria-P1, Microalbuminuria-P2 and Macroalbuminuria-P3) and Control Group (C) in Serum and Urine
2.3. Integration of Statistical Results
3. Discussion
3.1. Phenylalanine and Tyrosine Metabolism May Be Involved in Early DKD
3.2. Tryptophan Metabolites May Be Involved in the Cross-Talk of Podocyte Injury, Proximal Tubule Dysfunction and Endothelial Dysfunction
3.3. Retinoic Acid Signaling Pathway Could Have Beneficial Effects on Renal Structures and on Cerebrovascular Endothelium
3.4. Clinical Applicability and Potential Therapeutical Aspects
4. Materials and Methods
4.1. Patients’ Selection and Compliance with Ethical Standards
4.2. Sample Collection and Preparation
4.3. UHPLC-QTOF-ESI+-MS Analysis
4.4. Statistical Analysis
5. Conclusions
Author Contributions
Funding
Institutional Review Board Statement
Informed Consent Statement
Data Availability Statement
Conflicts of Interest
References
- Tuttle, K.R.; Agarwal, R.; Alpers, C.E.; Bakris, G.L.; Brosius, F.C.; Kolkhof, P.; Uribarri, J. Molecular Mechanisms and Therapeutic Targets for Diabetic Kidney Disease. Kidney Int. 2022, 102, 248–260. [Google Scholar] [CrossRef] [PubMed]
- Pérez-Morales, R.E.; del Pino, M.D.; Valdivielso, J.M.; Ortiz, A.; Mora-Fernández, C.; Navarro-González, J.F. Inflammation in Diabetic Kidney Disease. Nephron 2019, 143, 12–16. [Google Scholar] [CrossRef] [PubMed] [Green Version]
- Petrica, L.; Milas, O.; Vlad, M.; Vlad, A.; Gadalean, F.; Dumitrascu, V.; Velciov, S.; Gluhovschi, C.; Bob, F.; Ursoniu, S.; et al. Interleukins and MiRNAs Intervene in the Early Stages of Diabetic Kidney Disease in Type 2 Diabetes Mellitus Patients. Biomark. Med. 2019, 13, 1577–1588. [Google Scholar] [CrossRef]
- Petrica, L.; Hogea, E.; Gadalean, F.; Vlad, A.; Vlad, M.; Dumitrascu, V.; Velciov, S.; Gluhovschi, C.; Bob, F.; Ursoniu, S.; et al. Long Noncoding RNAs May Impact Podocytes and Proximal Tubule Function through Modulating Mirnas Expression in Early Diabetic Kidney Disease of Type 2 Diabetes Mellitus Patients. Int. J. Med. Sci 2021, 18, 2093–2101. [Google Scholar] [CrossRef] [PubMed]
- Kolluru, G.K.; Bir, S.C.; Kevil, C.G. Endothelial Dysfunction and Diabetes: Effects on Angiogenesis, Vascular Remodeling, and Wound Healing. Int. J. Vasc. Med. 2012, 2012, 918267. [Google Scholar] [CrossRef] [Green Version]
- Sun, L.; Diao, X.; Gang, X.; Lv, Y.; Zhao, X.; Yang, S.; Gao, Y.; Wang, G. Risk Factors for Cognitive Impairment in Patients with Type 2 Diabetes. J. Diabetes Res. 2020, 2020, 4591938. [Google Scholar] [CrossRef] [Green Version]
- Yang, Y.; Rosenberg, G.A. Blood-Brain Barrier Breakdown in Acute and Chronic Cerebrovascular Disease. Stroke 2011, 42, 3323–3328. [Google Scholar] [CrossRef] [Green Version]
- Wang, P.; Wang, T.; Zheng, X.; Cui, W.; Shang, J.; Zhao, Z. Gut Microbiota, Key to Unlocking the Door of Diabetic Kidney Disease. Nephrology 2021, 26, 641–649. [Google Scholar] [CrossRef]
- Lin, J.-R.; Wang, Z.-T.; Sun, J.-J.; Yang, Y.-Y.; Li, X.-X.; Wang, X.-R.; Shi, Y.; Zhu, Y.-Y.; Wang, R.-T.; Wang, M.-N.; et al. Gut Microbiota and Diabetic Kidney Diseases: Pathogenesis and Therapeutic Perspectives. World J. Diabetes 2022, 13, 308–318. [Google Scholar] [CrossRef]
- Koppe, L.; Fouque, D.; Soulage, C.O. Metabolic Abnormalities in Diabetes and Kidney Disease: Role of Uremic Toxins. Curr. Diab. Rep. 2018, 18, 97. [Google Scholar] [CrossRef]
- Yang, T.; Richards, E.M.; Pepine, C.J.; Raizada, M.K. The Gut Microbiota and the Brain-Gut-Kidney Axis in Hypertension and Chronic Kidney Disease. Nat. Rev. Nephrol. 2018, 14, 442–456. [Google Scholar] [CrossRef]
- Persson, F.; Rossing, P. Diagnosis of Diabetic Kidney Disease: State of the Art and Future Perspective. Kidney Int. Suppl. 2018, 8, 2–7. [Google Scholar] [CrossRef] [Green Version]
- Mayer, E.A.; Knight, R.; Mazmanian, S.K.; Cryan, J.F.; Tillisch, K. Gut Microbes and the Brain: Paradigm Shift in Neuroscience. J. Neurosci. 2014, 34, 15490–15496. [Google Scholar] [CrossRef] [Green Version]
- Mosterd, C.M.; Kanbay, M.; van den Born, B.J.H.; van Raalte, D.H.; Rampanelli, E. Intestinal Microbiota and Diabetic Kidney Diseases: The Role of Microbiota and Derived Metabolites Inmodulation of Renal Inflammation and Disease Progression. Best Pract. Res. Clin. Endocrinol. Metab. 2021, 35, 101484. [Google Scholar] [CrossRef]
- Vlad, A.; Vlad, M.; Petrica, L.; Ursoniu, S.; Gadalean, F.; Popescu, R.; Vlad, D.; Dumitrascu, V.; Gluhovschi, G.; Gluhovschi, C.; et al. Therapy with Atorvastatin versus Rosuvastatin Reduces Urinary Podocytes, Podocyte-Associated Molecules, and Proximal Tubule Dysfunction Biomarkers in Patients with Type 2 Diabetes Mellitus: A Pilot Study. Ren. Fail. 2017, 39, 112–119. [Google Scholar] [CrossRef] [Green Version]
- Darshi, M.; van Espen, B.; Sharma, K. Metabolomics in Diabetic Kidney Disease: Unraveling the Biochemistry of a Silent Killer. Am. J. Nephrol. 2016, 44, 92–103. [Google Scholar] [CrossRef]
- Pena, M.J.; Lambers Heerspink, H.J.; Hellemons, M.E.; Friedrich, T.; Dallmann, G.; Lajer, M.; Bakker, S.J.L.; Gansevoort, R.T.; Rossing, P.; de Zeeuw, D.; et al. Urine and Plasma Metabolites Predict the Development of Diabetic Nephropathy in Individuals with Type 2 Diabetes Mellitus. Diabet. Med. 2014, 31, 1138–1147. [Google Scholar] [CrossRef]
- Fanet, H.; Capuron, L.; Castanon, N.; Calon, F.; Vancassel, S. Tetrahydrobioterin (BH4) Pathway: From Metabolism to Neuropsychiatry. Curr. Neuropharmacol. 2020, 19, 591–609. [Google Scholar] [CrossRef]
- Rygula, A.; Pacia, M.Z.; Mateuszuk, L.; Kaczor, A.; Kostogrys, R.B.; Chlopicki, S.; Baranska, M. Identification of a Biochemical Marker for Endothelial Dysfunction Using Raman Spectroscopy. Analyst 2015, 140, 2185–2189. [Google Scholar] [CrossRef]
- Luo, H.H.; Li, J.; Feng, X.F.; Sun, X.Y.; Li, J.; Yang, X.; Fang, Z.Z. Plasma Phenylalanine and Tyrosine and Their Interactions with Diabetic Nephropathy for Risk of Diabetic Retinopathy in Type 2 Diabetes. BMJ Open Diabetes Res. Care 2020, 8, e000877. [Google Scholar] [CrossRef]
- Lee, H.; Jang, H.B.; Yoo, M.-G.; Park, S.I.; Lee, H.-J. Amino Acid Metabolites Associated with Chronic Kidney Disease: An Eight-Year Follow-Up Korean Epidemiology Study. Biomedicines 2020, 8, 222. [Google Scholar] [CrossRef] [PubMed]
- Ibarra-González, I.; Cruz-Bautista, I.; Bello-Chavolla, O.Y.; Vela-Amieva, M.; Pallares-Méndez, R.; Ruiz de Santiago Y Nevarez, D.; Salas-Tapia, M.F.; Rosas-Flota, X.; González-Acevedo, M.; Palacios-Peñaloza, A.; et al. Optimization of Kidney Dysfunction Prediction in Diabetic Kidney Disease Using Targeted Metabolomics. Acta Diabetol. 2018, 55, 1151–1161. [Google Scholar] [CrossRef] [PubMed]
- Merino, J.; Leong, A.; Liu, C.T.; Porneala, B.; Walford, G.A.; von Grotthuss, M.; Wang, T.J.; Flannick, J.; Dupuis, J.; Levy, D.; et al. Metabolomics Insights into Early Type 2 Diabetes Pathogenesis and Detection in Individuals with Normal Fasting Glucose. Diabetologia 2018, 61, 1315–1324. [Google Scholar] [CrossRef] [PubMed] [Green Version]
- Jansen, J.; Jansen, K.; Neven, E.; Poesen, R.; Othman, A.; van Mil, A.; Sluijter, J.; Torano, J.S.; Zaal, E.A.; Berkers, C.R.; et al. Remote Sensing and Signaling in Kidney Proximal Tubules Stimulates Gut Microbiome-Derived Organic Anion Secretion. Proc. Natl. Acad. Sci. USA 2019, 116, 16105–16110. [Google Scholar] [CrossRef] [PubMed] [Green Version]
- Ichii, O.; Otsuka-Kanazawa, S.; Nakamura, T.; Ueno, M.; Kon, Y.; Chen, W.; Rosenberg, A.Z.; Kopp, J.B. Podocyte Injury Caused by Indoxyl Sulfate, a Uremic Toxin and Aryl-Hydrocarbon Receptor Ligand. PLoS ONE 2014, 9, e108448. [Google Scholar] [CrossRef] [Green Version]
- Lowenstein, J.; Nigam, S.K. Uremic Toxins in Organ Crosstalk. Front. Med. 2021, 8, 592602. [Google Scholar] [CrossRef]
- Adelibieke, Y.; Shimizu, H.; Muteliefu, G.; Bolati, D.; Niwa, T. Indoxyl Sulfate Induces Endothelial Cell Senescence by Increasing Reactive Oxygen Species Production and P53 Activity. J. Ren. Nutr. 2012, 22, 86–89. [Google Scholar] [CrossRef]
- Gao, B.; Vavricka, S.R.; Meier, P.J.; Stieger, B. Differential Cellular Expression of Organic Anion Transporting Peptides OATP1A2 and OATP2B1 in the Human Retina and Brain: Implications for Carrier-Mediated Transport of Neuropeptides and Neurosteriods in the CNS. Pflug. Arch. 2015, 467, 1481–1493. [Google Scholar] [CrossRef]
- Bobot, M.; Thomas, L.; Moyon, A.; Fernandez, S.; McKay, N.; Balasse, L.; Garrigue, P.; Brige, P.; Chopinet, S.; Poitevin, S.; et al. Uremic Toxic Blood-Brain Barrier Disruption Mediated by AhR Activation Leads to Cognitive Impairment during Experimental Renal Dysfunction. J. Am. Soc. Nephrol. 2020, 31, 1509–1521. [Google Scholar] [CrossRef]
- Yang, Y.; Huang, H.; Xu, Z.; Duan, J.K. Serotonin and Its Receptor as a New Antioxidant Therapeutic Target for Diabetic Kidney Disease. J. Diabetes Res. 2017, 2017, 7680576. [Google Scholar] [CrossRef] [Green Version]
- Rhee, E.J.; Plutzky, J. Retinoid Metabolism and Diabetes Mellitus. Diabetes Metab. J. 2012, 36, 167–180. [Google Scholar] [CrossRef] [Green Version]
- Cassani, B.; Villablanca, E.J.; de Calisto, J.; Wang, S.; Mora, J.R. Vitamin A and Immune Regulation: Role of Retinoic Acid in Gut-Associated Dendritic Cell Education, Immune Protection and Tolerance. Mol. Aspects. Med. 2012, 33, 63–76. [Google Scholar] [CrossRef] [Green Version]
- Chen, A.; Liu, Y.; Lu, Y.; Lee, K.; He, J.C. Disparate Roles of Retinoid Acid Signaling Molecules in Kidney Disease. Am. J. Physiol. Renal. Physiol. 2021, 320, F683–F692. [Google Scholar] [CrossRef]
- Tang, D.; He, W.J.; Zhang, Z.T.; Shi, J.J.; Wang, X.; Gu, W.T.; Chen, Z.Q.; Xu, Y.H.; Chen, Y.B.; Wang, S.M. Protective Effects of Huang-Lian-Jie-Du Decoction on Diabetic Nephropathy through Regulating AGEs/RAGE/Akt/Nrf2 Pathway and Metabolic Profiling in Db/Db Mice. Phytomedicine 2022, 95, 153777. [Google Scholar] [CrossRef]
- Molina-Jijón, E.; Rodríguez-Muñoz, R.; del Carmen Namorado, M.; Bautista-García, P.; Medina-Campos, O.N.; Pedraza-Chaverri, J.; Reyes, J.L. All-Trans Retinoic Acid Prevents Oxidative Stress-Induced Loss of Renal Tight Junction Proteins in Type-1 Diabetic Model. J. Nutr. Biochem. 2015, 26, 441–454. [Google Scholar] [CrossRef]
- Sierra-Mondragon, E.; Rodríguez-Muñoz, R.; Namorado-Tonix, C.; Molina-Jijon, E.; Romero-Trejo, D.; Pedraza-Chaverri, J.; Reyes, J.L. All-Trans Retinoic Acid Attenuates Fibrotic Processes by Downregulating Tgf-Β1/Smad3 in Early Diabetic Nephropathy. Biomolecules 2019, 9, 525. [Google Scholar] [CrossRef] [Green Version]
- Zhang, J.; Deng, B.; Jiang, X.; Cai, M.; Liu, N.; Zhang, S.; Tan, Y.; Huang, G.; Jin, W.; Liu, B.; et al. All-Trans-Retinoic Acid Suppresses Neointimal Hyperplasia and Inhibits Vascular Smooth Muscle Cell Proliferation and Migration via Activation of AMPK Signaling Pathway. Front. Pharmacol. 2019, 10, 485. [Google Scholar] [CrossRef]
- Mizee, M.R.; Wooldrik, D.; Lakeman, K.A.M.; van het Hof, B.; Drexhage, J.A.R.; Geerts, D.; Bugiani, M.; Aronica, E.; Mebius, R.E.; Prat, A.; et al. Retinoic Acid Induces Blood-Brain Barrier Development. J. Neurosci. 2013, 33, 1660–1671. [Google Scholar] [CrossRef] [Green Version]
- Arora, A.; Behl, T.; Sehgal, A.; Singh, S.; Sharma, N.; Bhatia, S.; Sobarzo-Sanchez, E.; Bungau, S. Unravelling the Involvement of Gut Microbiota in Type 2 Diabetes Mellitus. Life Sci. 2021, 273, 119311. [Google Scholar] [CrossRef]
- Aron, R.A.C.; Abid, A.; Vesa, C.M.; Nechifor, A.C.; Behl, T.; Ghitea, T.C.; Munteanu, M.A.; Fratila, O.; Andronie-Cioara, F.L.; Toma, M.M.; et al. Recognizing the Benefits of Pre-/Probiotics in Metabolic Syndrome and Type 2 Diabetes Mellitus Considering the Influence of Akkermansia Muciniphila as a Key Gut Bacterium. Microorganisms 2021, 9, 618. [Google Scholar] [CrossRef]
- Iorga, R.; Bacalbasa, N.; Carsote, M.; Bratu, O.; Stanescu, A.M.; Bungau, S.; Pantis, C.; Diaconu, C. Metabolic and Cardiovascular Benefits of GLP-1 Agonists, besides the Hypoglycemic Effect (Review). Exp. Ther. Med. 2020, 20, 2396–2400. [Google Scholar] [CrossRef] [PubMed]
- KDIGO Clinical Practice Guideline for the Evaluation and Management of Chronic Kidney Disease. Kidney Int. 2013, 3, 1–150.
- NEAPOLIS. Available online: www.bioinformatica.isa.cnr.it/NEAPOLIS (accessed on 8 July 2022).


| (a) | |||||||
| m/z | SERUM VIP Values > 2 and MDA Values > 0.004 | P vs. C | m/z | SERUM VIP Values > 1.6 and MDA Values > 0.004 | P1 vs. P2 | P1 vs. P3 | P1 vs. C |
| 166.0975 | Phenylalanine | D | 166.0975 | Phenylalanine | P1 > P2 | P1 > P3 | P1 < C |
| 182.0932 | Tyrosine | D | 182.0932 | Tyrosine | P1 > P2 | P1 > P3 | P1 < C |
| 214.255 | Indoxyl sulfate | I | 214.255 | Indoxyl sulfate | P1 < P2 | P1 < P3 | P1 < C |
| 190.0625 | Kynurenic acid | D | 190.0625 | Kynurenic acid | P1 > P2 | P1 > P3 | P1 < C |
| 275.1649 | Serotonin sulfate | I | 275.1649 | Serotonin sulfate | P1 > P2 | P1 < P3 | P1 > C |
| 301.1598 | all-trans retinoic acid | I | 301.1598 | all-trans retinoic acid | P1 < P2 | P1 < P3 | P1 > C |
| 177.0663 | Threonylglycine | I | 177.0663 | Threonylglycine | P1 < P2 | P1 > P3 | P1 > C |
| 183.0092 | Sorbitol | D | 183.0092 | Sorbitol | P1 > P2 | P1 > P3 | P1 < C |
| (b) | |||||||
| m/z | URINE VIP Values > 2 and MDA Values > 0.004 | P vs. C | m/z | URINE VIP Values > 2 and MDA Values > 0.004 | P1 vs. P2 | P1 vs. P3 | P1 vs. C |
| 166.0975 | Phenylalanine | D | 166.0975 | Phenylalanine | P1 < P2 | P1 < P3 | P1 < C |
| 182.0932 | Tyrosine | D | 182.0932 | Tyrosine | P1 < P2 | P1 < P3 | P1 < C |
| 214.255 | Indoxyl sulfate | I | 214.255 | Indoxyl sulfate | P1 < P2 | P1 < P3 | P1 < C |
| 190.0625 | Kynurenic acid | D | 190.0625 | Kynurenic acid | P1 < P2 | P1 < P3 | P1 < C |
| 275.1649 | Serotonin sulfate | I | 275.1649 | Serotonin sulfate | P1 < P2 | P1 < P3 | P1 < C |
| 301.1449 | all-trans retinoic acid | I | 301.1449 | all-trans retinoic acid | P1 < P2 | P1 < P3 | P1 < C |
| 279.1637 | Leucyl-phenylalanine | I | 279.1637 | Leucyl-phenylalanine | P1~P2 | P1~P3 | P1 < C |
| 251.0669 | Methionyl-threonine | I | 189.1594 | p-Cresol sulfate | P1 < P2 | P1 < P3 | P1 < C |
| 329.0095 | Glycylprolylarginine | I | 163.1342 | 5-Hydroxy lysine | P1 < P2 | P1 < P3 | P1 < C |
| P1 | P2 | P3 | C | |
|---|---|---|---|---|
| Number of participants | 30 | 30 | 30 | 20 |
| Men (nr.,%) | 14 (46.66%) | 13 (43.33%) | 15 (50%) | 12 (60%) |
| Age (y) | 68.41 ± 4.98 | 68.65 ± 4.91 | 68.84 ± 4.98 | 55.85 ± 7.25 |
| DM duration (y) | 9.6 ± 3.99 | 9.7 ± 3.99 | 12.78 ± 3.35 | 0 |
| Serum creatinine (mg/dL) | 0.82 ± 0.18 | 0.93 ± 0.21 | 1.07 ± 0.32 | 0.73 ± 0.08 |
| eGFR (mL/min/1.73 m2) | 90.42 ± 18.10 | 89.70 ± 18.19 | 77.85 ± 19.38 | 97.93 ± 11.71 |
| UACR (mg/g) | 7.38 ± 3.22 | 45.42 ± 57.08 | 319.86 ± 585.80 | 5 ± 0.23 |
| HbA1c (%) | 5 ± 0.23 | 6.42 ± 1.29 | 7.15 ± 1.60 | 4.98 ± 0.23 |
Disclaimer/Publisher’s Note: The statements, opinions and data contained in all publications are solely those of the individual author(s) and contributor(s) and not of MDPI and/or the editor(s). MDPI and/or the editor(s) disclaim responsibility for any injury to people or property resulting from any ideas, methods, instructions or products referred to in the content. |
© 2023 by the authors. Licensee MDPI, Basel, Switzerland. This article is an open access article distributed under the terms and conditions of the Creative Commons Attribution (CC BY) license (https://creativecommons.org/licenses/by/4.0/).
Share and Cite
Balint, L.; Socaciu, C.; Socaciu, A.I.; Vlad, A.; Gadalean, F.; Bob, F.; Milas, O.; Cretu, O.M.; Suteanu-Simulescu, A.; Glavan, M.; et al. Metabolite Profiling of the Gut–Renal–Cerebral Axis Reveals a Particular Pattern in Early Diabetic Kidney Disease in T2DM Patients. Int. J. Mol. Sci. 2023, 24, 6212. https://doi.org/10.3390/ijms24076212
Balint L, Socaciu C, Socaciu AI, Vlad A, Gadalean F, Bob F, Milas O, Cretu OM, Suteanu-Simulescu A, Glavan M, et al. Metabolite Profiling of the Gut–Renal–Cerebral Axis Reveals a Particular Pattern in Early Diabetic Kidney Disease in T2DM Patients. International Journal of Molecular Sciences. 2023; 24(7):6212. https://doi.org/10.3390/ijms24076212
Chicago/Turabian StyleBalint, Lavinia, Carmen Socaciu, Andreea Iulia Socaciu, Adrian Vlad, Florica Gadalean, Flaviu Bob, Oana Milas, Octavian Marius Cretu, Anca Suteanu-Simulescu, Mihaela Glavan, and et al. 2023. "Metabolite Profiling of the Gut–Renal–Cerebral Axis Reveals a Particular Pattern in Early Diabetic Kidney Disease in T2DM Patients" International Journal of Molecular Sciences 24, no. 7: 6212. https://doi.org/10.3390/ijms24076212