Article

The ENA1 Na+-ATPase Gene Is Regulated by the SPS Sensing Pathway and the Stp1/Stp2 Transcription Factors

Institut de Biotecnologia i Biomedicina, Departament de Bioquímica i Biologia Molecular, Universitat Autònoma de Barcelona, 08193 Cerdanyola del Vallès, Spain
*
Author to whom correspondence should be addressed.
Int. J. Mol. Sci. 2023, 24(6), 5548; https://doi.org/10.3390/ijms24065548
Submission received: 25 February 2023 / Revised: 10 March 2023 / Accepted: 11 March 2023 / Published: 14 March 2023
(This article belongs to the Special Issue State-of-the-Art Molecular Microbiology in Spain)

Abstract

:
The Saccharomyces cerevisiae ENA1 gene, encoding a Na+-ATPase, responds transcriptionally to the alkalinization of the medium by means of a network of signals that involves the Rim101, the Snf1 and PKA kinases, and the calcineurin/Crz1 pathways. We show here that the ENA1 promoter also contains a consensus sequence, located at nt −553/−544, for the Stp1/2 transcription factors, the downstream components of the amino acid sensing SPS pathway. Mutation of this sequence or deletion of either STP1 or STP2 decreases the activity of a reporter containing this region in response to alkalinization as well as to changes in the amino acid composition in the medium. Expression driven from the entire ENA1 promoter was affected with similar potency by the deletion of PTR3, SSY5, or simultaneous deletion of STP1 and STP2 when cells were exposed to alkaline pH or moderate salt stress. However, it was not altered by the deletion of SSY1, encoding the amino acid sensor. In fact, functional mapping of the ENA1 promoter reveals a region spanning from nt −742 to −577 that enhances transcription, specifically in the absence of Ssy1. We also found that the basal and alkaline pH-induced expression from the HXT2, TRX2, and, particularly, SIT1 promoters was notably decreased in an stp1 stp2 deletion mutant, whereas the PHO84 and PHO89 gene reporters were unaffected. Our findings add a further layer of complexity to the regulation of ENA1 and suggest that the SPS pathway might participate in the regulation of a subset of alkali-inducible genes.

Graphical Abstract

1. Introduction

Adaptation to changes in the environment is critical for cell survival. The yeast Saccharomyces cerevisiae grows preferentially at acidic pH, and even a moderate alkalinization of the extracellular pH triggers an adaptive response that is largely based on the remodeling of gene expression affecting hundreds of genes. Work performed in the last 20 years has delineated in S. cerevisiae a number of signaling pathways that are responsible for such response, including the Rim101, Pho4, Slt2/Rlm1, Snf1 and PKA kinases, and calcineurin/Crz1 pathways [1,2].
The S. cerevisiae ENA1 gene encodes a P-type ATPase able to export Na+ and K+ cations that become the only way to eliminate toxic Na+ cations in the absence of extracellular/intracellular H+ gradient. Under standard growth conditions, ENA1 is barely expressed, but its promoter is potently induced shortly after cells are shifted to a medium containing high levels of Na+ or under alkaline pH [3,4,5,6,7]. The mechanisms for gene induction are various. Under mild saline (0.3–0.4 M NaCl) stress, ENA1 induction is predominantly due to the activation of the HOG pathway [8], which acts by phosphorylating the bZip transcription factor Sko1 [9] and recruiting the histone deacetylase complex Rpd3-Sin3 to the ENA1 promoter to facilitate transcriptional activation [10]. Induction of ENA1 by higher concentrations of Na+ also involves the activation of calcineurin [8], which dephosphorylates the transcription factor Crz1 leading to its entry into the nucleus [11,12] and is binding to two calcineurin-dependent response elements (CDRE) in the ENA1 promoter [13].
As mentioned above, ENA1 is also potently induced by alkaline pH, and this effect is mediated by several mechanisms. One of them is the activation of calcineurin, promoted by a very fast influx of calcium cations into the cell [14]. The impact of the Ppz1 protein phosphatase on ENA1 expression seems to be also mediated by the regulation of calcineurin [15]. A second mechanism consists of the activation of the Rim101 transcription factor, a conserved pathway in fungi. Activation of Rim101 releases Nrg1-mediated repression of the ENA1 promoter, leading to transcriptional activation of the gene [16,17]. A third mechanism involves activation of the Snf1 kinase, which phosphorylates both Mig1 and Mig2 repressors, and also acts by releasing Nrg1-mediated repression of ENA1 [18]. Induction of ENA1 expression by high pH does not involve the HOG pathway nor the PKA-regulated Msn2/Msn4 transcription factors [14,19], and the conjunction of the three mechanisms described above was considered sufficient to account for the transcriptional control of ENA1 in response to environmental alkalinization [19]. Whereas the benefits of the induction of ENA1 in response to salt stress seem obvious, those derived from its activation by alkaline pH were less evident. This was clarified after the finding that the signaling network controlling the induction of PHO89 (encoding a high-affinity Na+/Pi cotransporter) in response to high pH was virtually identical to that identified for ENA1 [20]. At alkaline pH, Pho89 becomes a key component for phosphate uptake, but this is achieved at the expense of the import of Na+ cations. Therefore, concomitant induction of ENA1 would counteract the accumulation of Na+, thus allowing maintenance of the extracellular/intracellular cation gradient required to sustain Pho89-mediated Pi uptake and/or prevent the intracellular accumulation of Na+ to toxic levels.
Bioavailable nitrogen is indispensable for life, and yeast cells growing in different environments are exposed to a variety of nitrogen sources. Therefore, the sensing of such sources becomes essential for these cells in order to reprogram their metabolism for optimal proliferation [21]. Sensing of extracellular amino acids is made possible by the SPS sensor system. This system is composed of three proteins located at the plasma membrane: Ssy1, Ptr3, and Ssy5. Ssy1 displays high similarity to several amino acid permeases, but it does not transport amino acids: instead, it has a sensor function provided by its N-terminal region [22,23,24,25]. Ssy1 interacts with Ptr3 and Ssy5 to form the complete sensor system that is stimulated by extracellular amino acids. The signal is transmitted through Ptr3 and promotes the interaction with the protein kinases Yck1/2, which phosphorylates Ptr3 and Ssy5 [26]. Consequently, Ssy5 is partially proteolyzed, releasing its endoprotease activity. Activated Ssy5 then acts on the transcription factors Stp1 and Stp2 by removing its N-terminal negative regulatory domains and promoting their translocation into the nucleus and the activation of their target genes [27,28,29,30].
During the course of our research on the generation of hybrid promoters able to respond to alkalinization, we incorporated to alkaline-responsive synthetic reporters short DNA segments from the ENA1 promoter containing the known Nrg1 or Mig1/2 consensus sequences with the aim of down-regulating their basal expression. Surprisingly, whereas the Nrg1-containing fragment acted as expected, the one harboring the Mig1/2 sequence further activated expression. In this work, we demonstrate that this anomalous behavior is due to the existence of an Stp1/Stp2 consensus sequence adjacent to the Mig1 site. We also show that the elimination of components of the SPS pathway, but not that of the Ssy1 sensor, attenuates expression from the entire ENA1 promoter. These findings highlight a novel and unexpected regulatory input for the control of ENA1 expression and possibly other alkaline pH-responsive genes.

2. Results

2.1. A Short Region of the ENA1 Promoter Containing the Mig1/2 Consensus Sequence Unexpectedly Increases the Activity of a Hybrid Promoter

With the aim of testing hybrid promoters likely able to respond to alkaline pH, we developed a set of constructs composed of a basal CYC1 transcription sequence fused to eGFP and containing upstream consensus sequences for different alkaline sensitive transcription factors. Figure 1A shows the structure of one of these constructs, in which a 37 nt fragment containing two Pho4-binding sites from the PHO84 gene was placed upstream of the CYC1 basal transcription region. As shown in Figure 1B (upper panel), the inclusion of the Pho4 elements (pPHO) promoted sustained expression of the GFP reporter after the alkalinization of the medium. In order to test the effect of negative elements, we placed downstream of the Pho4 elements an Nrg1 consensus sequence (55 nt) derived from the −552/−606 region of the ENA1 promoter (Figure 1A).
As expected, the insertion of this sequence markedly decreased the levels of GFP. We next introduced (also downstream of the PHO element) a 60 nt region of the ENA1 promoter (−508/−567) known to contain a functional Mig1/2 repressor element (from now on denoted as MIG). However, to our surprise, the addition of this region did not repress the expression of the reporter but, on the contrary, resulted in a marked increase in GFP levels (Figure 1B, upper panel). To test further this unexpected behavior, we placed the MIG fragment upstream of a region containing a cluster of four CDRE elements (4xCDRE) that was previously known to respond to high pH [14]. As shown in Figure 1B (lower panel), the inclusion of the MIG fragment also increased the expression from this promoter.
The results described above suggested that the MIG fragment contained a positive transcriptional element not yet identified. Indeed, computational analysis of this region revealed that slightly upstream of the previously characterized Mig1/2 site, there was a region showing high identity with an Stp2 consensus sequence (p-value 1.8 × 10⁻⁵). Stp2 and its paralog Stp1 (with a very similar consensus sequence, see Figure 1A) are transcription factors activated by proteolysis in response to external amino acids and are known to activate the transcription of genes coding for diverse amino acid permeases.

2.2. The Putative Stp1/2 Site Present in the ENA1 Promoter Is Relevant for Transcriptional Induction

The transcriptional relevance of the putative Stp1/2 recognition sequence was investigated by cloning in the basal CYC1 reporter vector the native MIG fragment alone as well as a mutated version in which the nearly constant CGGC central residues were changed to ATCG (pG1, see Figure 2). Both constructs were then introduced in BY4741 wild-type cells, as well as in stp1 and stp2 deletion mutants. As shown in Figure 2, fragment MIG alone was able to enhance transcription from the CYC1 basal promoter in wild-type cells growing in standard conditions, and the effect was increased further in cells switched to alkaline pH. The expression of GFP upon alkalinization was reduced in cells lacking Stp1 and particularly in those lacking Stp2. The effect of the mutation at the Stp1/2 site (pG1) was also noticeable, yielding expression levels comparable to those observed in the stp2 deletion mutant for the native pMIG reporter. These results indicate that the MIG fragment of the ENA1 promoter contains a bona fide Stp1/2 consensus sequence that participates in the induction prompted by alkaline pH. They also suggest that Stp2 might be more important than Stp1 for regulation at this site.
To confirm the relevance of the newly detected Stp1/2 site, we resorted to alternative ENA1-derived β-galactosidase reporters (Figure 3A) previously characterized in our laboratory for alkaline response [19]. As shown in Figure 3B, the presence of the −573/−490 region of the ENA1 promoter (reporter pMRK213) conferred a pH-dependent response to the reporter in wild-type cells, and this response was substantially decreased when the reporter was introduced in stp1 or stp2 deletion mutants. This region comprises the Nrg1/2, Stp1/2, and Mig1/2 sites, as well as a CRE (cyclic AMP response element) element, albeit the latter has no relevance in alkaline pH transcriptional regulation [19]. When the same experiment was repeated using the pMRK515a construct, which only contains the Mig1/2 site, alkaline pH induction in wild-type cells was much lower (~four-fold) and was barely affected by the mutation of the STP1 or STP2 genes. These experiments indicate that the Stp1/2 site identified here could be relevant for the regulation of the induction of the ENA1 ATPase gene in response to environmental alkalinization.

2.3. The Stp1/2 Site in the ENA1 Promoter Responds to the Activation of the SPS Pathway

As mentioned in the introduction, Stp1 and Stp2 transcription factors are known to be activated through the SPS pathway, which responds to amino acid availability. We then wondered whether the Stp1/Stp2 site present in the ENA1 promoter could be sensitive to amino acid signals. To test this possibility, we introduced the basal pCYC1 reporter, as well as the pMIG and pG1 versions in the strain CEN.PK113-5D, which is prototrophic for amino acids and auxotrophic only for uracil. Cells were grown in a synthetic medium with Pro as the only N source (a condition known to maintain inactive the SPS pathway) and then switched to a medium with Leu or Phe to activate the SPS pathway. As shown in Figure 4A, the pMIG reporter was rapidly induced by changing Pro by either Leu or Phe, whereas this effect was completely abolished in cells bearing the pG1reporter, in which the Stp1/2 site had been mutated. This observation indicated that the predicted Stp1/2 element in the ENA1 promoter was responsive to the activation of the SPS pathway. To explore in more detail the involvement of the SPS pathway in this response, we resorted to the 23344c background, a Σ1278b-based strain in which mutations in the pathway are available and have been widely characterized. As shown in Figure 4B, all these mutations blocked the response of the pMIG reporter when cells were shifted from Pro to Phe, similarly to that observed for the pG1 reporter.
We also tested the response of the pMIG and pG1 reporters in the 23344c genetic background upon alkalinization and incorporated a new reporter (pG2) in which the Mig1/2 site was changed from 5′-TGCGGGG-3′ to 5′-TGCATCG-3′. As shown in Figure 5, in spite of the rather high basal activity of the pMIG reporter in this genetic background, it was further enhanced by alkalinization. Removal of the Stp1/2 site clearly decreased both basal and alkaline pH-induced expression levels, whereas elimination of the Mig1/2 consensus increased basal expression to levels similar to those of alkali-induced cells, which was compatible with the elimination of a repressor site. The expression levels from all three constructs were drastically decreased in cells lacking both Stp1 and Stp2 transcription factors or devoid of the Ssy1 sensor. Taken together, these results indicate that the newly found Stp1/2 site responds to the activation of the SPS pathway.

2.4. Non-Homogenous Impact of Mutations in the SPS Pathway on the Expression Driven from the Entire ENA1 Promoter

To investigate the potential effect of the activation of the SPS pathway on the expression of the ENA1 gene, we resorted to the pKC201 reporter, which is a LacZ translational fusion containing the entire ENA1 promoter region, and introduced this construct into the wild-type BY4741 strain and its stp1Δ and stp2Δ derivatives. As shown in Figure S1, in this genetic background, ENA1 was potently induced by alkalinization, and mutation of either STP1 or STP2 significantly decreased its expression. This suggests that both transcription factors might operate on the ENA1 gene. When the expression of the entire ENA1 reporter was analyzed in the 23344c background, simultaneous removal of both Stp1 and Stp2 transcription factors resulted in a marked decrease of the expression, and a similar effect was observed in cells lacking the Ptr3 and Ssy5 components of the signaling pathway (Figure 6A). However, to our surprise, the deletion of the gene encoding the Ssy1 sensor did not affect expression in response to alkaline pH. Because ENA1 also responds to moderate salt stress, we treated the cells with 0.4 M NaCl. As shown in Figure 6B, this response strongly decreased in cells lacking both Stp1 and Stp2 transcription factors, as well as in the ptr3Δ and ssy5Δ mutants. Remarkably, again the activity of the ENA1 reporter did not decrease in cells devoid of the Ssy1 sensor. This was a very surprising result since it indicated that the alkaline pH- and NaCl-induced upregulation of the ENA1 promoter depends on the presence of elements of the SPS pathway but not on the presence of the Ssy1 sensor.

2.5. Functional Mapping of the Alkaline pH Response of the ENA1 Promoter and Its Relationship with the SPS Pathway

Because of the unexpected behavior of the ENA1 promoter in cells lacking Ssy1, we aimed to identify the region of the promoter responsible for this behavior. To this end, we cloned diverse regions of the promoter in plasmid pSLFΔ-178K (as in Figure 3), and tested the response to high pH in strains lacking diverse components of the SPS signaling pathway. As presented in Figure 7 (upper panel), the expression profile from plasmid pMRK1303 perfectly mimicked that observed for plasmid pKC201, suggesting that it contains all elements required for response to high pH. Expression from plasmid pMRK213 was induced by high pH (as observed for strain BY4741, Figure 3) and it was clearly reduced, in a similar way, in all SPS mutants, including the ssy1 strain. This induction could be attributable to the combination of a depression effect, attributable to the Mig1/2 site and insensitive to the deletion of SSY1, and the activation due to the Stp1/2 site, fully blocked by the ssy1 mutant (compare plasmids pMRK506 and pMRK515a in Figure S2). In contrast, expression from plasmid pMRK212 showed an interesting pattern. Basal levels were somewhat higher than with pMRK213, and this effect was particularly marked in the ssy1 mutant. When cells were challenged with high pH, expression was similar to that observed in the wild-type strain for all mutants, with the exception of the ssy1 strain, in which β-galactosidase activity was two- to three-fold higher.
From this experiment, it was evident that the promoter region responsible for the abnormal behavior of ENA1 expression in ssy1 cells could be restricted to the fragment cloned in plasmid pMRK212, delimited by positions −742/−577. To further limit the anomalous region, we constructed three additional plasmids and tested them in wild-type, ssy1, and stp1 stp2 cells. pMRK805 contained the pMRK212 region plus about 120 nt upstream. As shown in Figure 7 (lower panel), expression from this region is still markedly enhanced in the ssy1 strain but not in stp1 stp2 cells. Plasmid pMRK706 contains a fragment of less than 90 bp that includes the downstream CDRE motif located at −726/−718. In this case, expression is increased by high pH in all three strains in a similar way, indicating that this region is not responsible for the atypical effect due to the ssy1 mutation. Finally, the fragment in pMRK605, comprising the −681/−565 promoter region, does not respond at all to alkalinization in the wild-type and stp1 stp2 strain, although it shows an increase of about three- to four-fold compared with the other strains, in the ssy1 mutant. Therefore, the extraordinary behavior of the ENA1 promoter in response to high pH in ssy1 cells is not mediated by the functional CDRE and can be attributed to structural determinant(s) located between positions −681/−565.

2.6. Participation of Stp1/2 in the Expression of Other Genes Responsive to Alkaline pH
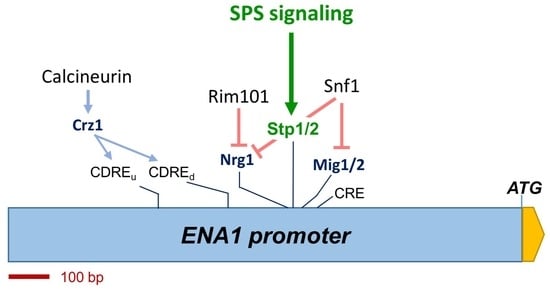
We then wondered whether the participation of the SPS pathway could be observed in other gene promoters also responsive to alkaline pH. To this end, we tested previously characterized PHO84-, PHO89-, TRX2-, SIT1-, and HXT2-LacZ-based reporters in the wild-type 23344c strain and its stp1 stp2 derivative. As shown in Figure 8, the induction triggered by alkaline pH observed with PHO89 and PHO84 reporters did not decrease when these were tested in the stp1 stp2 strain. For TRX2-, HXT2-, and SIT1-based reporters, the induction by alkaline pH was modest, but this was likely the result of abnormally high basal expression levels (see the Discussion section). In any case, both basal and pH-induced expression levels decreased moderately in the stp1 stp2 strain for the TRX2 and HXT2 reporters, whereas they strongly diminished in the case of SIT1. To further confirm these results, we tested the HXT2-based reporter in the BY4741 background. As shown in Figure S3, in this genetic background, induction of the HXT2 reporter was more robust and, whereas the deletion of STP2 did not significantly alter expression levels, that of STP1 resulted in around a decrease of 25%. This observation further supports the notion that HXT2 might be under the control of the Stp1 transcription factor. Taken together, these results suggest that alkaline pH-responsive genes other than ENA1 could be subjected to regulation by the transcription factors acting downstream of the SPS pathway.

3. Discussion

The results presented here indicate that the ENA1 promoter contains a previously unidentified sequence that is recognized by the Stp1/2 transcription factors and is relevant for response to the alkalinization of the medium. This sequence is located at position −553/−544 and is able not only to enhance the expression driven from other alkali-responsive transcriptional elements but also capable by itself of increasing the expression of a basal CYC1 promoter in response to alkalinization of the medium. In addition, this element responds to the shift from Pro as the sole N source to Phe or Leu, a situation that is known to trigger signaling through the SPS pathway [31], and the response entirely depends on the integrity of this pathway. This would suggest that alkalinization might activate the SPS pathway, a notion that would agree with the increased expression upon alkalinization observed for several genes, such as AGP1, BAP2, DIP5, or MUP1 [18,32,33,34,35,36] that are also a target for the SPS pathway [37].
ENA1 is a key factor for tolerance to salt and alkaline pH stress and responds to the activation of multiple pathways in response to various signals, including nutrient availability [38,39]. Among these signals, early work identified the relevance of the carbon source. Thus, the expression of ENA1 is repressed by glucose in comparison with galactose [40], and this is mediated by activation of the Snf1-Mig1/2 axis [41]. Our observations indicate that ENA1 also has the potential to respond to the activation of the SPS pathway, which senses external amino acids. Indeed, we show that the expression of ENA1 in response to both alkaline pH and moderate salt stress (Figure 6) is reduced with similar potency by deletion of PTR3, SSY5, or simultaneous elimination of both STP1 and STP2 genes. To our surprise, deletion of the gene encoding the actual amino acid sensor, SSY1, was without effect under both kinds of stress when the entire promoter was tested. Functional mapping of the ENA1 promoter carried out in the diverse SPS mutants showed that the region from nt −742 to −490 of the promoter, which integrates most of the alkaline pH signals [14,19], can be divided into two segments with very different behavior as far as the components of the SPS pathway are concerned. The region spanning from nt −573 to −490, which contains the known pH-sensitive Nrg1 and Mig1/2 sites, as well as the Stp1/2 site identified in this work, appears as markedly SPS-dependent in its response to high pH, showing a homogenous behavior for all mutations in the pathway. In contrast, the response of the adjacent upstream region (from nt −742 to −577) is unaltered in ptr3, ssy5, or stp1 stp2 cells, but it is clearly enhanced in cells devoid of Ssy1. Remarkably, the region from −753 to −667 promoted a high pH response, and it was unaffected by the lack of Ssy1 and its downstream Stp1 and Stp2 transcription factors. This region contains the ENA1 downstream CDRE, which is known to bind Crz1 with high affinity and constitutes the main determinant of the induction response to calcium and alkaline pH [13,42,43]. On the other hand, the region covering from nt −681 to −565 (pMRK605) was insensitive to alkalinization in the wild type, as previously shown [14] and in the stp1 stp2 strain, but showed a significant increase (about four-fold) in the Ssy1-deficient strain (Figure 7).
These findings lead us to two conclusions. From one side, the absence of effect of the ssy1 mutation could be interpreted as the compensatory balance between a negative effect caused by lack of signaling at the Stp1/2 site found at the −573/−490 region and a positive one promoted by an unknown target likely placed between nt −681 and −565. On the other side, the normal response of the region, including the CDRE in the ssy1 mutant, indicates that the lack of Ssy1 is not influencing the signaling through the Crz1 binding site. A major remaining question would be the nature of the signal leading to hyperactivation of the response in the ssy1 mutant. One possible explanation would be that the absence of the sensor protein might upset the balance between the downstream components of the SPS pathway, thus affecting other pathways that might impinge on the ENA1 promoter. It is worth noting that it has been reported that the expression of numerous genes, including amino acid permeases CAN1 and DIP5, subjected to NCR (nitrogen catabolite repression) regulation, was affected by the ssy1 mutation independently of the presence or absence of leucine (used to induce the SPS pathway) in the medium [44]. Thus, it might be speculated that, in the conditions in which our experiments were carried out (rich medium), the absence of the SPS sensor might result in the activation of genes otherwise subjected to NCR control. In fact, lack of Ssy1 results in increased expression of GAT1, encoding a GATA transcription factor whose expression is normally down-regulated in nitrogen-rich media. This scenario would fit with the previous observation by Crespo and coworkers [45] that ENA1 expression was induced in cells treated with rapamycin (an inhibitor of the TOR pathway). In addition, mutation of GLN3 and GAT1, encoding the positive NCR transcription factors known to act downstream TOR, resulted in reduced basal and salt-induced expression of ENA1 in response to salt stress.
Therefore, in this scenario, the abnormal activation driven by the ENA1 promoter region spanning from −681 and −565 would be explained by a release from the NCR control. Gln3 and Gat1 are called GATA factors because they bind to (A/T)GATA(A/G) sequences. Crespo and coworkers [45] already pointed to the presence of several such sequences in the ENA1 promoter (although no attempts were made to map them functionally). Interestingly, one of these is located at positions −638/−633 and, therefore, is present in the two reporters tested here (pMRK212 and pMRK605) that exhibit abnormal induction in Ssy1-deficient cells. It is worth noting that a role for Gat1 in the regulation of ENA1 in Hansenula polymorpha has been proposed in response to the nitrogen source [46]. However, in this case, Gat1 would be activated by Crz1, a mechanism that is not likely to occur in response to alkalinization in S. cerevisiae.
Our exploration of different pH-responsive reporters indicates that alkaline pH-triggered activation of the SPS pathway is not restricted to the ENA1 gene, as a loss of response is also observed for TRX2, HXT2, and SIT1 reporter genes when both STP1 and STP2 genes are deleted (Figure 8). It is worth mentioning that the basal expression levels of the HXT2 and SIT1 reporters in the wild-type strain 23344c are much higher than that observed in the past for the same reporters in other genetic backgrounds [15,47], thus leading only to a modest increase upon alkalinization. This is not unexpected since 23344c is a Σ strain, rather distant from BY4741, which derives from the S288C background, and there is plenty of evidence showing that relevant phenotypic traits (including gene essentiality) can depend on the specific yeast genetic background [48,49,50]. We also observe a dramatic decrease in stp1 stp2 cells in the basal and pH-induced response of the SIT1 gene reporter. This is interesting because SIT1 was identified as the only transporter gene showing the same induction pattern as AGP1, GNP1, BAP3, TAT1, and TAT2 (all five genes dependent on the SPS sensor pathway) when cells were shifted from ammonium to various amino acids [51]. This effect on SIT1 appears also dependent on the presence of Ssy1 [44]. In fact, analysis of the promoter regions of these genes reveals putative Stp1/2 consensus sequence: TRX2 (positions −371/−352, p = 5.5 × 10⁻⁶), HXT2 (positions −261/−242, p = 4.9 × 10⁻⁶) and SIT1 (−319/−300, p = 1.3 × 10⁻⁷). In contrast, we do not observe the loss of alkaline pH induction in the stp1 stp2 mutant when the PHO84 and PHO89 reporter genes are tested (Figure 7). This is not surprising in the case of PHO84, as it is known that its response to alkalinization is based solely on the activation of the PHO pathway and the presence of the Pho4 transcription factor [14]. In contrast, PHO89 and ENA1 have been found to be co-regulated in response to high pH, likely due to the requirement for a Na+-extrusion system working at alkaline pH to counteract the activity of the Pho89-mediated Na+/Pi cotransport and such co-regulation is based in that both promoters integrate the same set of signals [20]. Therefore, our finding illustrates a differential trait in the response of the ENA1 and PHO89 promoters to environmental alkalinization.

4. Materials and Methods

4.1. Yeast Strains and Culture Media

Yeast cells were incubated at 28 °C in YP medium (1% yeast extract, 2% peptone) plus 2% glucose except otherwise stated, or synthetic medium (YNB without amino acids) lacking the appropriate selection requirements [52]. The strains used in this work are indicated in Table 1. Searches of gene promoters for putative transcription factor binding sites were performed at the RSAT site using the Matrix-Scan algorithm [53].

4.2. Recombinant DNA Techniques and Reporter Construction

Escherichia coli DH5α cells were employed as the plasmid DNA host and were grown at 37 °C in the LB medium (1% tryptone, 0.5% Yeast Extract, 0.5% NaCl) supplemented, when required, with 50 μg/mL ampicillin. Transformations of E. coli and standard recombinant DNA techniques were performed as described [56]. S. cerevisiae cells were transformed by the lithium acetate method [57].
Constructs using eGFP as a reporter protein were based on the pRS426 (URA3, 2µ) reported in [58]. In the first step, a 1002 bp fragment containing the yeast-enhanced GFP (yeGFP) sequence followed by the CYC1 terminator, was amplified from the pUG35 vector (Güldener and Hegemann, unpublished data, GenBank: AF298787.1) with primers GFP-term Fw and GFP-term Rev to provide pGFP-CYCterm. Vector pCYC was made by amplification of 269 bp fragment, containing the basal CYC1 promoter region, from the pAMS366 plasmid [11] with primers CYC1promoter5′ and CYC1promoter3′, digestion with XhoI-ClaI, and cloning into these same sites of vector pGFP-CYCterm. Plasmid pCYC was used for subsequence constructions, except for pCYC-4xCDRE, which was constructed by amplification of 404 bp fragment from pAMS366 (containing the CYC1 sequence and a 4x tandem of the CDRE site present in the FKS2 gene) with primers 4x-CDRE5′ and CYC1promoter3′ and cloning into pGFP-CYCterm upon XhoI digestion.
Insertion of a PHO element was performed as follows. The −404/−440 region downstream of the PHO84 promoter, containing the consensus Pho4 elements C and D described in [59], was synthesized by overlapped extension using oligonucleotides Pho84-pho4binding3′ and Pho84-pho4binding5′. The resulting 53 bp fragment was digested with BamHI and EcoRI and cloned into these sites in pCYC to yield pCYC-PHO. Individual Nrg1 and Mig1/2 sites were taken from the ENA1 promoter [19]. The Nrg1 element (position −651/−647) was recreated by overlapped extension with oligonucleotides 5′-NRG1 and 3′-NRG1, yielding a 65 bp fragment. A 74-bp fragment containing the Mig1/2 site located at position −544/−534 of ENA1 was synthesized by the same method using oligonucleotides 5′-MIG1/2 and 3′-MIG1/2. Each fragment was digested with HindIII and EcoRI and cloned into the same sites of pCYC, pPHO, or pCYC-4xCDRE to yield pCYC-MIG, pPHO-NRG, pPHO-MIG, or pMIG-4xCDRE (Figure 1A). Mutation of the putative Stp1/2 site was made as follows. An overlapped extension reaction was set with primers Mig1/2_NOStp2-5′ and 3′-MIG1/2, and the product was digested with HindIII and EcoRI and cloned into pCYC to yield pG1. The Mig1/2 site was changed using the same strategy with primers 5′-NOMig1/2 and 3′-NOMig1/2 to produce pG2. Overlapped extension reactions were made starting in all cases by mixing two hundred pmol of each oligonucleotide, raising the temperature heating up to 95 °C for 2 min and allowing annealing at 65 °C for 15 s in the presence of Q5 High-fidelity DNA polymerase and Q5 buffer (New England Biolabs™, Ipswich, MA, USA).
The construction of the following LacZ fusion plasmids has been previously reported as follows. The pKC201 vector contains the ENA1 promoter sequence from −1385 to +35 [60]; plasmid pTRX2 carries the corresponding −981/+11 region [61]; plasmid pHXT2 includes the −1/−618 region of the HXT2 gene [62]; plasmid pSIT1 contains the −786/+52 SIT1 region [15]. Plasmids pPHO84 and PHO89 (603 to +19 and −671 to +33 regions, respectively) were described earlier [14]. Construction of plasmids pMRK1303, pMRK213, and pMRK212 containing, respectively, the −1304/−361, −573/−490, and −742/−577 regions of the ENA1 promoter was described earlier [14]. These constructs derive from the vector pSLFΔ-178K, a CYC1 promoter-LacZ fusion from which the CYC1 UAS elements have been deleted [63]. Plasmid pMRK515a, which contains the −548/−511 region of the ENA1 promoter in the pSLFΔ-178K vector, was made by PCR amplification of the relevant fragment of the ENA1 promoter with primers ena1_prom_5′_G and ena1_prom_3′_E, followed by digestion with SalI and XhoI and cloning into the XhoI site of pSLFΔ-178K. Plasmids pMRK805 (−861/−565), pMRK706 (−753/−666), and pMRK605 (−681/−565) were made by amplification of the relevant region (see Table S1), cloned into pBluescript at the PstI and XhoI sites, released by SmaI and XhoI digestion, and cloned into the same sites of pSLFΔ-178K. Plasmid pMRK506, containing the −574 to −541 region, was made by hybridizing the pair of primers 5′-ENA1-509 and 3′-ENA1-509, digestion with SmaI and XhoI, and cloning into pSLFΔ-178K. All oligonucleotides used in this work can be found in Table S1.
All constructs were verified by restriction mapping and DNA sequencing.

4.3. Fluorimetric Determination of yeGFP Production

Cells carrying the relevant reporters were grown overnight in a synthetic medium lacking uracil and then diluted to an OD600 of 0.25 in the same medium supplemented with TAPS (pH 5.5) and grown until an OD600 of 0.5–0.6. Then, 292.5 μL of culture were added onto 96 well plates and supplemented (ThermoFisher, #165305) with 7.5 µL of KOH from a 1 M stock to raise the pH 7.9–8.0 or with the same volume of 1 M KCl (control cells). Plates were transferred to a Varioskan LUX Multimode Microplate Reader (ThermoFisher™, Waltham, MA, USA), and growth resumed at 28 °C with intermittent shaking. Fluorescence (relative fluorescence units at 488 nm excitation/520 nm emission) and absorbance (600 nm) were simultaneously measured every 15 min using the SkanIt™ software (ThermoFisher™, Waltham, MA, USA). Normalization of the fluorescence values was conducted by dividing by the corresponding OD600 values after subtracting the fluorescence and absorbance blank values.

4.4. Flow Cytometry Analysis

For determination of alkaline pH induction, aliquots of cultures of BY4741 or 23344c cells transformed with the appropriate reporters were grown until an OD600 of 0.5–0.6 and were made 25 mM KCl (non-induced) or 25 mM KOH (raising the pH to 7.9–8.0). Samples (0.8 mL) were taken at time zero and after different periods and fixed with formaldehyde (2.7%) for 5 min. After various washes with cold PBS, cells were diluted 1:20 to 1:40 with PBS and analyzed in a FACSCanto (Becton & Dickinson Co., Franklin Lakes, NJ, USA) flow cytometer.
Monitoring the reporter’s response to amino acids was carried out as follows. A colony of the wild-type strains CEN.PK113-5D or 23344c (as well as its derivatives), transformed with the suitable plasmids, was grown in a minimal medium with 10 mM Pro as the only amino acid source to saturation and then inoculated into the same medium and grown until OD600 = 0.6. Samples were taken just before adding Phe or Leu at 1.5 mM (t = 0) and then after different periods of incubation and processed for flow cytometry as described above.

4.5. β-Galactosidase Assays

The activity of the LacZ reporters was determined as in [19], except that non-induced cells were resuspended in a YPD medium adjusted to pH 5.5 after autoclaving. For the HXT2-LacZ reporter, YP supplemented with 4% glucose was used, as described in [47]. Induction of the cells was extended for 60 min.

Supplementary Materials

The following supporting information can be downloaded at: https://www.mdpi.com/article/10.3390/ijms24065548/s1.

Author Contributions

Conceptualization, J.A. and A.C.; formal analysis, A.Z., M.A., A.C. and J.A.; investigation, A.Z. and M.A.; data curation, A.Z., M.A., A.C. and J.A.; writing—original draft preparation, J.A.; writing—review and editing, A.Z., M.A., A.C. and J.A.; supervision, A.C. and J.A.; project administration, J.A.; funding acquisition, A.C. and J.A. All authors have read and agreed to the published version of the manuscript.

Funding

This research was funded by the Ministerio de Ciencia e Innovación (Spain), grant number PID2020-113319RB-I00. AZ is a recipient of a PIF contract (Universitat Autònoma de Barcelona).

Institutional Review Board Statement

Not applicable.

Informed Consent Statement

Not applicable.

Data Availability Statement

Data is contained within this article and its supplementary material. Raw (unprocessed) data are available on request from the corresponding author.

Acknowledgments

The contribution of Ernest Prat and Antònia M. Bauzá to the earliest steps of this work is acknowledged. Thanks are given to Bruno André for strains and advice. The skillful technical support of Montserrat Robledo is recognized.

Conflicts of Interest

The authors declare no conflict of interest. The funders had no role in the design of the study; in the collection, analyses, or interpretation of data; in the writing of the manuscript; or in the decision to publish the results.

References

  1. Ariño, J. Integrative responses to high pH stress in S. cerevisiae. OMICS 2010, 14, 517–523. [Google Scholar] [CrossRef] [PubMed]
  2. Serra-Cardona, A.; Canadell, D.; Ariño, J. Coordinate responses to alkaline pH stress in budding yeast. Microb. Cell 2015, 2, 182–196. [Google Scholar] [CrossRef] [PubMed] [Green Version]
  3. Garciadeblas, B.; Rubio, F.; Quintero, F.J.; Banuelos, M.A.; Haro, R.; Rodriguez-Navarro, A. Differential expression of two genes encoding isoforms of the ATPase involved in sodium efflux in Saccharomyces cerevisiae. Mol. Gen. Genet. 1993, 236, 363–368. [Google Scholar] [CrossRef] [PubMed]
  4. Mendoza, I.; Rubio, F.; Rodriguez-Navarro, A.; Pardo, J.M. The protein phosphatase calcineurin is essential for NaCl tolerance of Saccharomyces cerevisiae. J. Biol. Chem. 1994, 269, 8792–8796. [Google Scholar] [CrossRef]
  5. Haro, R.; Garciadeblas, B.; Rodríguez-Navarro, A. A novel P-type ATPase from yeast involved in sodium transport. FEBS Lett. 1991, 291, 189–191. [Google Scholar] [CrossRef] [Green Version]
  6. Wieland, J.; Nitsche, A.M.; Strayle, J.; Steiner, H.; Rudolph, H.K. The PMR2 gene cluster encodes functionally distinct isoforms of a putative Na+ pump in the yeast plasma membrane. EMBO J. 1995, 14, 3870–3882. [Google Scholar] [CrossRef]
  7. Posas, F.; Camps, M.; Ariño, J. The PPZ protein phosphatases are important determinants of salt tolerance in yeast cells. J. Biol. Chem. 1995, 270, 13036–13041. [Google Scholar] [CrossRef] [Green Version]
  8. Marquez, J.A.; Serrano, R. Multiple transduction pathways regulate the sodium-extrusion gene PMR2/ENA1 during salt stress in yeast. FEBS Lett. 1996, 382, 89–92. [Google Scholar] [CrossRef] [Green Version]
  9. Proft, M.; Struhl, K. Hog1 kinase converts the Sko1-Cyc8-Tup1 repressor complex into an activator that recruits SAGA and SWI/SNF in response to osmotic stress. Mol. Cell 2002, 9, 1307–1317. [Google Scholar] [CrossRef]
  10. De Nadal, E.; Zapater, M.; Alepuz, P.M.; Sumoy, L.; Mas, G.; Posas, F. The MAPK Hog1 recruits Rpd3 histone deacetylase to activate osmoresponsive genes. Nature 2004, 427, 370–374. [Google Scholar] [CrossRef]
  11. Stathopoulos, A.M.; Cyert, M.S. Calcineurin acts through the CRZ1/TCN1-encoded transcription factor to regulate gene expression in yeast. Genes Dev. 1997, 11, 3432–3444. [Google Scholar] [CrossRef] [PubMed] [Green Version]
  12. Matheos, D.P.; Kingsbury, T.J.; Ahsan, U.S.; Cunningham, K.W. Tcn1p/Crz1p, a calcineurin-dependent transcription factor that differentially regulates gene expression in Saccharomyces cerevisiae. Genes Dev. 1997, 11, 3445–3458. [Google Scholar] [CrossRef] [Green Version]
  13. Mendizabal, I.; Pascual-Ahuir, A.; Serrano, R.; de Larrinoa, I.F. Promoter sequences regulated by the calcineurin-activated transcription factor Crz1 in the yeast ENA1 gene. Mol. Genet.Genom. 2001, 265, 801–811. [Google Scholar] [CrossRef]
  14. Serrano, R.; Ruiz, A.; Bernal, D.; Chambers, J.R.; Arino, J. The transcriptional response to alkaline pH in Saccharomyces cerevisiae: Evidence for calcium-mediated signalling. Mol. Microbiol. 2002, 46, 1319–1333. [Google Scholar] [CrossRef] [PubMed]
  15. Ruiz, A.; Yenush, L.; Ariño, J. Regulation of ENA1 Na+-ATPase gene expression by the Ppz1 protein phosphatase is mediated by the calcineurin pathway. Eukaryot. Cell 2003, 2, 937–948. [Google Scholar] [CrossRef] [PubMed] [Green Version]
  16. Lamb, T.M.; Xu, W.; Diamond, A.; Mitchell, A.P. Alkaline response genes of Saccharomyces cerevisiae and their relationship to the RIM101 pathway. J. Biol. Chem. 2001, 276, 1850–1856. [Google Scholar] [CrossRef] [PubMed] [Green Version]
  17. Lamb, T.M.; Mitchell, A.P. The transcription factor Rim101p governs ion tolerance and cell differentiation by direct repression of the regulatory genes NRG1 and SMP1 in Saccharomyces cerevisiae. Mol. Cell. Biol. 2003, 23, 677–686. [Google Scholar] [CrossRef] [Green Version]
  18. Casamayor, A.; Serrano, R.; Platara, M.; Casado, C.; Ruiz, A.; Ariño, J. The role of the Snf1 kinase in the adaptive response of Saccharomyces cerevisiae to alkaline pH stress. Biochem. J. 2012, 444, 39–49. [Google Scholar] [CrossRef] [Green Version]
  19. Platara, M.; Ruiz, A.; Serrano, R.; Palomino, A.; Moreno, F.; Arino, J. The Transcriptional Response of the Yeast Na+-ATPase ENA1 Gene to Alkaline Stress Involves Three Main Signaling Pathways. J. Biol. Chem. 2006, 281, 36632–36642. [Google Scholar] [CrossRef] [Green Version]
  20. Serra-Cardona, A.; Petrezsélyová, S.; Canadell, D.; Ramos, J.; Ariño, J. Coregulated expression of the Na+/phosphate Pho89 transporter and Ena1 Na+-ATPase allows their functional coupling under high-pH stress. Mol. Cell. Biol. 2014, 34, 4420–4435. [Google Scholar] [CrossRef] [Green Version]
  21. Zhang, W.; Du, G.; Zhou, J.; Chen, J. Regulation of Sensing, Transportation, and Catabolism of Nitrogen Sources in Saccharomyces cerevisiae. Microbiol. Mol. Biol. Rev. 2018, 82, e00040-17. [Google Scholar] [CrossRef] [PubMed] [Green Version]
  22. Klasson, H.; Fink, G.R.; Ljungdahl, P.O. Ssy1p and Ptr3p Are Plasma Membrane Components of a Yeast System That Senses Extracellular Amino Acids. Mol. Cell. Biol. 1999, 19, 5405–5416. [Google Scholar] [CrossRef] [Green Version]
  23. Bernard, F.; André, B. Genetic analysis of the signalling pathway activated by external amino acids in Saccharomyces cerevisiae. Mol. Microbiol. 2001, 41, 489–502. [Google Scholar] [CrossRef] [Green Version]
  24. Didion, T.; Regenberg, B.; Jørgensen, M.U.; Kielland-Brandt, M.C.; Andersen, H.A. The permease homologue Ssy1p controls the expression of amino acid and peptide transporter genes in Saccharomyces cerevisiae. Mol. Microbiol. 1998, 27, 643–650. [Google Scholar] [CrossRef]
  25. Iraqui, I.; Vissers, S.; Bernard, F.; de Craene, J.-O.; Boles, E.; Urrestarazu, A.; André, B. Amino acid signaling in Saccharomyces cerevisiae: A permease-like sensor of external amino acids and F-Box protein Grr1p are required for transcriptional induction of the AGP1 gene, which encodes a broad-specificity amino acid permease. Mol. Cell. Biol. 1999, 19, 989–1001. [Google Scholar] [CrossRef] [Green Version]
  26. Liu, Z.; Thornton, J.; Spírek, M.; Butow, R.A. Activation of the SPS amino acid-sensing pathway in Saccharomyces cerevisiae correlates with the phosphorylation state of a sensor component, Ptr3. Mol. Cell. Biol. 2008, 28, 551–563. [Google Scholar] [CrossRef] [PubMed] [Green Version]
  27. Andréasson, C.; Ljungdahl, P.O. Receptor-mediated endoproteolytic activation of two transcription factors in yeast. Genes Dev. 2002, 16, 3158–3172. [Google Scholar] [CrossRef] [Green Version]
  28. Abdel-Sater, F.; El Bakkoury, M.; Urrestarazu, A.; Vissers, S.; André, B. Amino acid signaling in yeast: Casein kinase I and the Ssy5 endoprotease are key determinants of endoproteolytic activation of the membrane-bound Stp1 transcription factor. Mol. Cell. Biol. 2004, 24, 9771–9785. [Google Scholar] [CrossRef] [PubMed] [Green Version]
  29. Andréasson, C.; Heessen, S.; Ljungdahl, P.O. Regulation of transcription factor latency by receptor-activated proteolysis. Genes Dev. 2006, 20, 1563–1568. [Google Scholar] [CrossRef] [Green Version]
  30. Poulsen, P.; Leggio, L.L.; Kielland-Brandt, M.C. Mapping of an internal protease cleavage site in the Ssy5p component of the amino acid sensor of Saccharomyces cerevisiae and functional characterization of the resulting pro- and protease domains by gain-of-function genetics. Eukaryot. Cell 2006, 5, 601–608. [Google Scholar] [CrossRef] [Green Version]
  31. Wielemans, K.; Jean, C.; Vissers, S.; André, B. Amino acid signaling in yeast: Post-genome duplication divergence of the Stp1 and Stp2 transcription factors. J. Biol. Chem. 2010, 285, 855–865. [Google Scholar] [CrossRef] [Green Version]
  32. Viladevall, L.; Serrano, R.; Ruiz, A.; Domenech, G.; Giraldo, J.; Barcelo, A.; Arino, J. Characterization of the calcium-mediated response to alkaline stress in Saccharomyces cerevisiae. J. Biol. Chem. 2004, 279, 43614–43624. [Google Scholar] [CrossRef] [Green Version]
  33. Casado, C.; González, A.; Platara, M.; Ruiz, A.; Ariño, J. The role of the protein kinase A pathway in the response to alkaline pH stress in yeast. Biochem. J. 2011, 438, 523–533. [Google Scholar] [CrossRef] [Green Version]
  34. Serrano, R.; Martín, H.; Casamayor, A.; Ariño, J. Signaling alkaline pH stress in the yeast Saccharomyces cerevisiae through the Wsc1 cell surface sensor and the Slt2 MAPK pathway. J. Biol. Chem. 2006, 281, 39785–39795. [Google Scholar] [CrossRef] [Green Version]
  35. Canadell, D.; García-Martínez, J.; Alepuz, P.; Pérez-Ortín, J.E.; Ariño, J. Impact of high pH stress on yeast gene expression: A comprehensive analysis of mRNA turnover during stress responses. Biochim. Biophys. Acta-Gene Regul. Mech. 2015, 1849, 653–664. [Google Scholar] [CrossRef]
  36. Causton, H.C.; Ren, B.; Koh, S.S.; Harbison, C.T.; Kanin, E.; Jennings, E.G.; Lee, T.I.; True, H.L.; Lander, E.S.; Young, R.A. Remodeling of yeast genome expression in response to environmental changes. Mol. Biol. Cell 2001, 12, 323–337. [Google Scholar] [CrossRef] [PubMed] [Green Version]
  37. Ljungdahl, P.O. Amino-acid-induced signalling via the SPS-sensing pathway in yeast. Biochem. Soc. Trans. 2009, 37, 242–247. [Google Scholar] [CrossRef] [Green Version]
  38. Ruiz, A.; Ariño, J. Function and regulation of the Saccharomyces cerevisiae ENA sodium ATPase system. Eukaryot. Cell 2007, 6, 2175–2183. [Google Scholar] [CrossRef] [PubMed] [Green Version]
  39. Yenush, L. Potassium and Sodium Transport in Yeast. Adv. Exp. Med. Biol. 2016, 892, 187–228. [Google Scholar] [PubMed]
  40. Alepuz, P.M.; Cunningham, K.W.; Estruch, F. Glucose repression affects ion homeostasis in yeast through the regulation of the stress-activated ENA1 gene. Mol. Microbiol. 1997, 26, 91–98. [Google Scholar] [CrossRef]
  41. Proft, M.; Serrano, R. Repressors and upstream repressing sequences of the stress-regulated ENA1 gene in Saccharomyces cerevisiae: bZIP protein Sko1p confers HOG-dependent osmotic regulation. Mol. Cell Biol. 1999, 19, 537–546. [Google Scholar] [CrossRef] [Green Version]
  42. Roque, A.; Petrezsélyová, S.; Serra-Cardona, A.; Ariño, J. Genome-wide recruitment profiling of transcription factor Crz1 in response to high pH stress. BMC Genom. 2016, 17, 662. [Google Scholar] [CrossRef] [PubMed] [Green Version]
  43. Petrezsélyová, S.; López-Malo, M.; Canadell, D.; Roque, A.; Serra-Cardona, A.; Marqués, M.; Vilaprinyó, E.; Alves, R.; Yenush, L.; Ariño, J. Regulation of the Na+/K+-ATPase Ena1 Expression by Calcineurin/Crz1 under High pH Stress: A Quantitative Study. PLoS ONE 2016, 11, e0158424. [Google Scholar] [CrossRef] [PubMed] [Green Version]
  44. Forsberg, H.; Gilstring, C.F.; Zargari, A.; Martínez, P.; Ljungdahl, P.O. The role of the yeast plasma membrane SPS nutrient sensor in the metabolic response to extracellular amino acids. Mol. Microbiol. 2001, 42, 215–228. [Google Scholar] [CrossRef] [PubMed] [Green Version]
  45. Crespo, J.L.; Daicho, K.; Ushimaru, T.; Hall, M.N. The GATA transcription factors GLN3 and GAT1 link TOR to salt stress in Saccharomyces cerevisiae. J. Biol. Chem. 2001, 276, 34441–34444. [Google Scholar] [CrossRef] [Green Version]
  46. Rodríguez, C.; Galindo, L.R.; Siverio, J.M. Nitrogen-dependent calcineurin activation in the yeast Hansenula polymorpha. Fungal Genet. Biol. 2013, 53, 34–41. [Google Scholar] [CrossRef]
  47. Ruiz, A.; Serrano, R.; Arino, J. Direct regulation of genes involved in glucose utilization by the calcium/calcineurin pathway. J. Biol. Chem. 2008, 283, 13923–13933. [Google Scholar] [CrossRef] [PubMed] [Green Version]
  48. Scott, T.D.; Xu, P.; McClean, M.N. Strain-dependent differences in coordination of yeast signalling networks. FEBS J. 2022. [Google Scholar] [CrossRef] [PubMed]
  49. Dowell, R.D.; Ryan, O.; Jansen, A.; Cheung, D.; Agarwala, S.; Danford, T.; Bernstein, D.A.; Alexander Rolfe, P.; Heisler, L.E.; Chin, B.; et al. Genotype to phenotype: A complex problem. Science 2010, 328, 469. [Google Scholar] [CrossRef] [Green Version]
  50. Galardini, M.; Busby, B.P.; Vieitez, C.; Dunham, A.S.; Typas, A.; Beltrao, P. The impact of the genetic background on gene deletion phenotypes in Saccharomyces cerevisiae. Mol. Syst. Biol. 2019, 15, e8831. [Google Scholar] [CrossRef]
  51. Boer, V.M.; Tai, S.L.; Vuralhan, Z.; Arifin, Y.; Walsh, M.C.; Piper, M.D.W.; De Winde, J.H.; Pronk, J.T.; Daran, J.M. Transcriptional responses of Saccharomyces cerevisiae to preferred and nonpreferred nitrogen sources in glucose-limited chemostat cultures. FEMS Yeast Res. 2007, 7, 604–620. [Google Scholar] [CrossRef] [PubMed] [Green Version]
  52. Adams, A.; Gottschling, D.E.; Kaiser, C.A.; Stearns, T. Methods in Yeast Genetics: A Cold Spring Harbor Laboratory Course Manual; Cold Spring Harbor Laboratory Press: Suffolk County, NY, USA, 1998; ISBN 0879695080. [Google Scholar]
  53. Santana-Garcia, W.; Castro-Mondragon, J.A.; Padilla-Gálvez, M.; Nguyen, N.T.T.; Elizondo-Salas, A.; Ksouri, N.; Gerbes, F.; Thieffry, D.; Vincens, P.; Contreras-Moreira, B.; et al. RSAT 2022: Regulatory sequence analysis tools. Nucleic Acids Res. 2022, 50, W670–W676. [Google Scholar] [CrossRef] [PubMed]
  54. Brachmann, C.B.; Davies, A.; Cost, G.J.; Caputo, E.; Li, J.; Hieter, P.; Boeke, J.D. Designer deletion strains derived from Saccharomyces cerevisiae S288C: A useful set of strains and plasmids for PCR-mediated gene disruption and other applications. Yeast 1998, 14, 115–132. [Google Scholar] [CrossRef]
  55. Winzeler, E.A.; Shoemaker, D.D.; Astromoff, A.; Liang, H.; Anderson, K.; Andre, B.; Bangham, R.; Benito, R.; Boeke, J.D.; Bussey, H.; et al. Functional characterization of the S. cerevisiae genome by gene deletion and parallel analysis. Science 1999, 285, 901–906. [Google Scholar] [CrossRef] [PubMed] [Green Version]
  56. Sambrook, J.; Russell, D.W. Molecular Cloning: A Laboratory Manual, 3rd ed.; Cold Spring Harbor Laboratory Press: Cold Spring Harbor, NY, USA, 2001. [Google Scholar]
  57. Ito, H.; Fukuda, Y.; Murata, K.; Kimura, A. Transformation of intact yeast cells treated with alkali cations. J. Bacteriol. 1983, 153, 163–168. [Google Scholar] [CrossRef] [Green Version]
  58. Christianson, T.W.; Sikorski, R.S.; Dante, M.; Shero, J.H.; Hieter, P. Multifunctional yeast high-copy-number shuttle vectors. Gene 1992, 110, 119–122. [Google Scholar] [CrossRef]
  59. Ogawa, N.; Saitoh, H.; Miura, K.; Magbanua, J.P.; Bun-ya, M.; Harashima, S.; Oshima, Y. Structure and distribution of specific cis-elements for transcriptional regulation of PHO84 in Saccharomyces cerevisiae. Mol. Gen.Genet. 1995, 249, 406–416. [Google Scholar] [CrossRef]
  60. Cunningham, K.W.; Fink, G.R. Calcineurin inhibits VCX1-dependent H+/Ca2+ exchange and induces Ca2+ ATPases in Saccharomyces cerevisiae. Mol. Cell Biol. 1996, 16, 2226–2237. [Google Scholar] [CrossRef] [Green Version]
  61. Pérez-Sampietro, M.; Serra-Cardona, A.; Canadell, D.; Casas, C.; Ariño, J.; Herrero, E. The yeast Aft2 transcription factor determines selenite toxicity by controlling the low affinity phosphate transport system. Sci. Rep. 2016, 6, 32836. [Google Scholar] [CrossRef] [Green Version]
  62. Ozcan, S.; Johnston, M. Three different regulatory mechanisms enable yeast hexose transporter (HXT) genes to be induced by different levels of glucose. Mol. Cell Biol. 1995, 15, 1564–1572. [Google Scholar] [CrossRef] [Green Version]
  63. Idrissi, F.Z.; Fernandez-Larrea, J.B.; Pina, B. Structural and functional heterogeneity of Rap1p complexes with telomeric and UASrpg-like DNA sequences. J. Mol. Biol. 1998, 284, 925–935. [Google Scholar] [CrossRef] [PubMed]
Figure 1. A 60-bp fragment of the ENA1 promoter that contains the Mig1/2 site potentiates transcription. (A) Schematic depiction of the diverse constructs driving yeGFP expression tested in panel B. At the bottom, the relevant section of the ENA1 promoter (with its chromosomal coordinates) shows the previously identified Mig1/2 site and the predicted Stp1/2 consensus sequence. (B) BY4741 cultures transformed with the indicated reporters were grown as indicated in Material and Methods, and the fluorescence and growth (OD600) values were captured after raising the pH to 7.9–8.0 every 15 min for 15 h. Data are expressed for each culture as relative fluorescence units (RFU) divided by OD600 values and are presented as the mean ± SEM from 6 (upper panel) or 4 (lower panel) independent cultures.
Ijms 24 05548 g001
Figure 2. Mutation of the putative Stp1/2 site decreases expression from the pMIG reporter. Upper panel. The structure of the MIG region was cloned into the pCYC vector. The nucleotides mutated in pG1 are denoted in red. The lower panel shows the expression at normal or alkaline pH from the empty vector (pCYC), pMIG, or pG1 in BY4741 wild-type cells (WT) or its stp1Δ and stp2Δ derivatives. In this case, induction was carried out for 6 h, cells were fixed for flow cytometry, and fluorescence was recorded with the fluorimeter. Data are mean ± SEM from three independent experiments.
Ijms 24 05548 g002
Figure 3. Removal of the putative Stp1/2 site drastically decreases expression from a lacZ reporter. (A) Schematic depiction of the constructs used. (B) Strain BY4741 (WT) and its isogenic stp1 and stp2 derivatives were transformed with the indicated constructs or the empty pSLFΔ-178K vector (“No insert”). Cells were treated as indicated in Materials and Methods and β-galactosidase activity was determined after 1 h of induction. Data are mean ± SEM from 4 to 6 independent experiments.
Ijms 24 05548 g003
Figure 4. The Stp1/2 site in the ENA1 promoter responds to amino acids. (A) Strain CEN.PK113-5D was transformed with the indicated constructs and was grown in a minimal medium with Pro as the only nitrogen source, as described in Materials and Methods. Then, 1.5 mM Leu or Phe was added (solid lines), and growth continued. Samples were taken at the indicated periods of time and processed for flow cytometry. (B) Amino acid-induced response of the Stp1/2 site is abolished in mutants in the SPS pathway. The indicated strains (23344c background) carrying the pMIG or pG1 constructs were switched from Pro to Phe-containing medium, and samples were processed for flow cytometry after 2 h. In all cases, the ratio of RFU values of the induced vs non-induced cultures was calculated and is expressed as the mean ± SEM from six independent experiments.
Ijms 24 05548 g004
Figure 5. Expression of pMIG (M), pG1, and pG2 in the 23344c background. The indicated reporters (pG2 bears a mutated Mig1/2 site) were introduced into strains 23344c (WT), 32501c (ssy1Δ), or KW023 (stp1Δ stp2Δ). Cells were exposed to alkaline pH for 2 h and processed for flow cytometry analysis. Data are the mean ± SEM from 8 to 10 independent experiments. ns, not significative, p > 0.05; *, p < 0.05; **, p < 0.01; ***, p < 0.005.
Ijms 24 05548 g005
Figure 6. Effect of mutations in the SPS pathway on the expression of the full ENA1 promoter. Plasmid pKC201, bearing the entire ENA1 promoter fused to lacZ, was introduced into strain 23344c (WT) and its isogenic ptr3, ssy5, ssy1, and stp1 stp2 derivatives. Cells were exposed for 1 h to alkaline pH (A) or 0.4 M NaCl (B) and processed for β-galactosidase activity determination. “NI” denotes not induced. Data are mean ± SEM from 4 to 10 independent experiments. ***, p < 0.005, ns, not significant. The gene structure and relevant regulatory sites in the ENA1 promoter included in plasmid pKC201 are indicated in the cartoon shown at the top. CDREu and CDREd refer to the upstream and downstream elements, respectively.
Ijms 24 05548 g006
Figure 7. Functional mapping of the alkaline pH response of the ENA1 promoter in mutants in the SPS pathway. The diverse strains (23344c background) were transformed with pSLFΔ-178K derived reporters containing the indicated fragments, and cells were exposed for 1 h to alkaline pH prior to determination of β-galactosidase activity. The relevant regulatory sites included in each fragment are depicted. Data are mean ± SEM from 6 to 10 independent experiments. A second set of independent determinations for pMRK212 is included in the bottom section for better comparison with the newly constructed reporters.
Ijms 24 05548 g007
Figure 8. Effect of the lack of Stp1 and Stp2 transcription factors on the expression of diverse alkali-induced gene reporters. The indicated reporters were introduced in strain 23344c (WT) and KW023 (stp1Δ stp2Δ) and grown as in Figure 6. LacZ activity was measured after 1 h of induction at alkaline pH. Data are mean ± SEM from 4 to 10 independent experiments.
Ijms 24 05548 g008
Table 1. Yeast strains employed in this work.
StrainGenotypeReference
BY4741MATa his3Δ1 leu2Δ0 met15Δ0 ura3Δ0[54]
BYstp1ΔBY4741 stp1::kanMX4[55]
BYstp2ΔBY4741 stp2::kanMX4[55]
CEN.PK113-5DMATa ura3-52 TRP1 LEU2 HIS3 MAL2-8c SUC2Euroscarf
23344cMATα ura3-52[25]
32501cMATa ssy1::kanMX2 ura3[25]
FB98MATα ptr3::kanMX2 ura3[23]
FB90MATα ssy5::kanMX2 ura3[23]
KW023MATα stp1Δ stp2Δ ura3[31]
Disclaimer/Publisher’s Note: The statements, opinions and data contained in all publications are solely those of the individual author(s) and contributor(s) and not of MDPI and/or the editor(s). MDPI and/or the editor(s) disclaim responsibility for any injury to people or property resulting from any ideas, methods, instructions or products referred to in the content.

