Article

Respiratory Health Effects of In Vivo Sub-Chronic Diesel and Biodiesel Exhaust Exposure

by
Katherine R. Landwehr
1,2,
Ryan Mead-Hunter
1,
Rebecca A. O’Leary
3,
Anthony Kicic
1,2,4,5,
Benjamin J. Mullins
1 and
Alexander N. Larcombe
1,2,*
1
Occupation, Environment and Safety, School of Population Health, Curtin University, Perth, WA 6845, Australia
2
Respiratory Environmental Health, Wal-yan Respiratory Research Centre, Telethon Kids Institute, Perth Children’s Hospital, Nedlands, Perth, WA 6009, Australia
3
Department of Primary Industries and Regional Development, Perth, WA 6151, Australia
4
Department of Respiratory and Sleep Medicine, Perth Children’s Hospital, Nedlands, Perth, WA 6009, Australia
5
Centre for Cell Therapy and Regenerative Medicine, The University of Western Australia, Perth, WA 6009, Australia
*
Author to whom correspondence should be addressed.
Int. J. Mol. Sci. 2023, 24(6), 5130; https://doi.org/10.3390/ijms24065130
Submission received: 16 February 2023 / Revised: 1 March 2023 / Accepted: 3 March 2023 / Published: 7 March 2023

Abstract

:
Biodiesel, which can be made from a variety of natural oils, is currently promoted as a sustainable, healthier replacement for commercial mineral diesel despite little experimental data supporting this. The aim of our research was to investigate the health impacts of exposure to exhaust generated by the combustion of diesel and two different biodiesels. Male BALB/c mice (n = 24 per group) were exposed for 2 h/day for 8 days to diluted exhaust from a diesel engine running on ultra-low sulfur diesel (ULSD) or Tallow or Canola biodiesel, with room air exposures used as control. A variety of respiratory-related end-point measurements were assessed, including lung function, responsiveness to methacholine, airway inflammation and cytokine response, and airway morphometry. Exposure to Tallow biodiesel exhaust resulted in the most significant health impacts compared to Air controls, including increased airway hyperresponsiveness and airway inflammation. In contrast, exposure to Canola biodiesel exhaust resulted in fewer negative health effects. Exposure to ULSD resulted in health impacts between those of the two biodiesels. The health effects of biodiesel exhaust exposure vary depending on the feedstock used to make the fuel.

1. Introduction

Diesel exhaust exposure is known to lead to negative health impacts on multiple organ systems including, but not limited to, the respiratory, cardiovascular, nervous, endocrine, and urinary systems [1,2]. It has been implicated in lung [3,4], brain [5], and bladder cancer [6], increased blood pressure [7], altered neurological activity [8], increased thrombotic risk [9], increased stroke risk [10], increased risk of type 2 diabetes [11,12,13], and asthma [14]. Biodiesel exhaust shares many of the same physicochemical characteristics as diesel exhaust, such as oxides of nitrogen (NOx), carbon monoxide and dioxide, particulate matter consisting of mostly ultrafine particles [15,16,17], polycyclic aromatic hydrocarbons (PAHs), aldehydes, ketones, and heavy metals [18,19,20], and, thus, it is suspected that it will be associated with many of the same negative health impacts. Previous studies into engine and exhaust characteristics that compared diesel and biodiesel often show that biodiesel exhaust contains more NOx, PAHs, and ultrafine particles (<100 nm) but less overall particulate matter by weight [18,20,21,22,23,24] compared with mineral diesel exhaust. This is of concern as ultrafine particles, when compared to larger sizes, are more commonly linked to the negative health effects of air pollution [25,26]. Up to 90% of diesel exhaust particles by number consist of nucleation mode particles, newly formed from combustion and chemical reactions and are under 30 nm in size [15,16]. Thus, a further increase in the proportion of ultrafine particles in biodiesel exhaust is of great concern, in part due to increased surface-area-to-volume ratios allowing for more dangerous chemicals to be ab/adsorbed onto them for a given particle mass [22]. Despite this, biodiesel fuel usage is increasing worldwide [27].
Previous studies, both in vitro and in vivo, looking into the health effects of biodiesel exhaust typically use less than optimal exposure models [28,29]. Many previous studies have focused solely on the health effects of the exhaust particles by collecting them on a filter and adding a set concentration directly to a flask of cells/bacteria or instilling it into the nose/trachea of rats/mice [28,30,31,32,33]. While it allows an accurate dosage of particles to be given [33], in return, it both ignores the effects of the exhaust gases, which have their own set of negative health impacts [34], and also removes the ultrafine particles, arguably one of the most toxic components of diesel exhaust, which readily agglomerate on filters to form larger-sized particles [35]. This generates an artificial particle size spectrum, with previous studies showing that over a 16-fold increase in particle concentration is needed to generate the similar health impacts as if whole exhaust was used [36].
In addition to this, the majority of previous biodiesel exhaust toxicology studies have used bacterial AMES tests to study mutagenic effects, or have exposed immortalized cell lines [23,24,37,38] that are not always human or even derived from the respiratory system, the first exposed and likely most affected tissue [37,39]. Previous studies that expose animals most often use instillation to expose the mice/rats to the particulate matter in solution, with few studies performing inhalation exposures. These few studies are often divided into several different publications, likely due to the difficulty in conducting them, which artificially inflates the actual number of inhalation studies performed [40,41,42,43,44,45,46,47,48,49,50]. Of the few studies that do use inhalation exposures, only half expose mice/rats to pure biodiesel exhausts and the remainder use biodiesel blended with diesel (at ratios of <30% biodiesel in diesel fuel). With the biodiesel concentration being below half of the total fuel content, there is a chance for biodiesel-exhaust-exposure-induced health effects to be masked by those of diesel. That said, blended fuels are highly relevant to what is being used today with biodiesel already being blended up to 20% in some countries [51,52,53].
There is also a tendency in the literature to treat all biodiesels as the same, despite evidence that the feedstock used to make the biodiesel vastly affects the fuel and exhaust properties and, thus, the resulting health impacts of exhaust exposure [54]. Studies often use just one biodiesel type and make claims about biodiesel in general based on the results of that type [55]. Some studies do not even disclose the feedstock used to make their biodiesel [55,56]. Methodological differences inherent in different study designs—from the exact engine type, the use (or not) of exhaust after-treatment systems, differing exhaust concentrations, the use of whole exhaust compared to filter-extracted particles, and the wide range of health effects measured, including mutagenicity, cytotoxicity, and immunological effects [23,24,29,40,41,46,48,50,57]—make comparisons of fuel feedstocks between different studies difficult.
Thus, the aim of this study was to compare the respiratory health effects of exposure to one of two different types of biodiesel exhaust, using air and ultra-low sulfur mineral diesel (ULSD) as controls, to evaluate the impacts of biodiesel exhaust exposure and how these impacts can change between different feedstock types. Tallow and Canola were chosen for study, both because they are commonly used today [58,59] and previous research found them to be at extreme ends of the health effects in both a submerged and air–liquid-interface cell-culture exposure model [54,60]. Mice were exposed for two hours each day to one of these four options for eight consecutive days. The main hypotheses were that (i) exposure to Tallow biodiesel exhaust would result in more severe and a greater range of negative health effects than ULSD exhaust exposure and (ii) that exposure to Canola biodiesel exhaust would result in less health impacts.

2. Results

2.1. Exhaust Gas Characteristics

The mean and standard deviation for each fuel and gas type are shown in Table 1, with the exception of CO that showed only the highest reading at 10 min for each of the repeated exposures due to the cold-start effect on the performance of the catalytic converter. Trends over time can be found in the Supplementary Materials (Figure S1). All fuels displayed similar trends over time with NOx (NO and NO2), CO2, and SO2 increasing rapidly in the first 30 min of the exposure, O2 decreasing rapidly in the first 20 min, and CO peaking in the first 10 min before decreasing rapidly to undetectable concentrations. Canola was found to be the most different of the tested fuels with significant changes in each of the measured combustion gases except for CO when compared to both Tallow biodiesel diesel exhaust (p < 0.05). In contrast, Tallow and ULSD exhaust were only different for O2, CO2, and SO2.

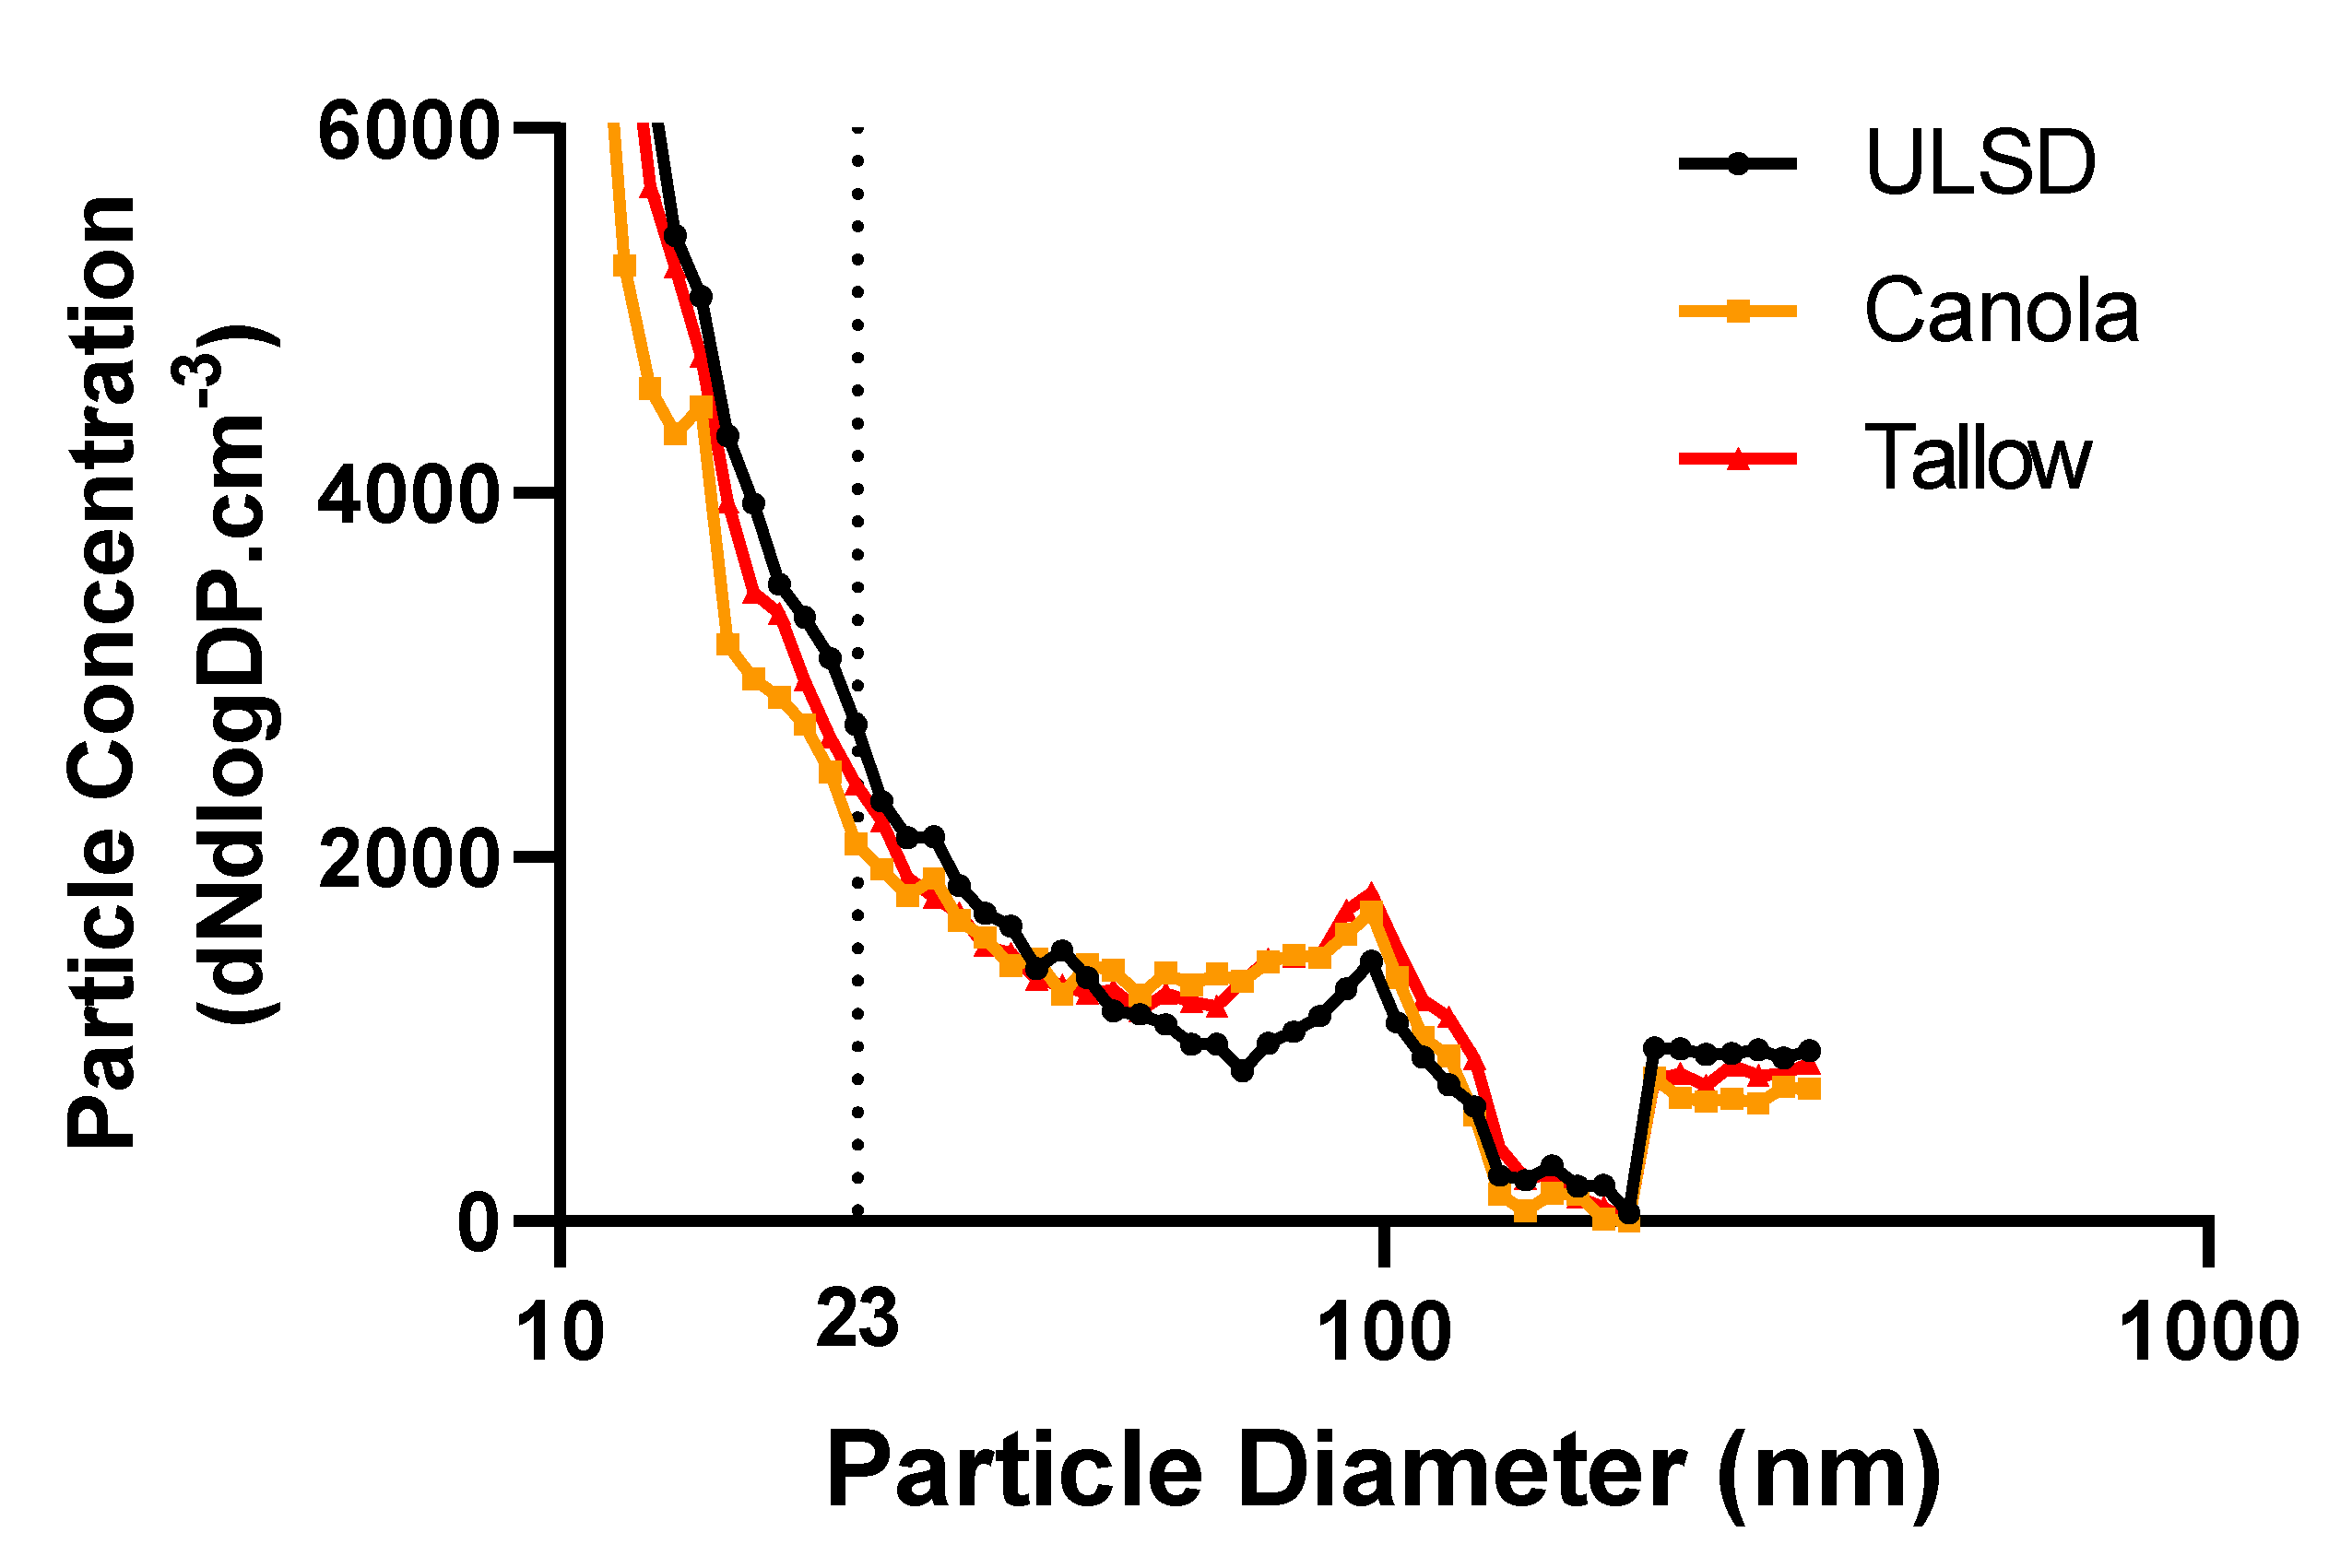
2.2. Exhaust Particle Characteristics
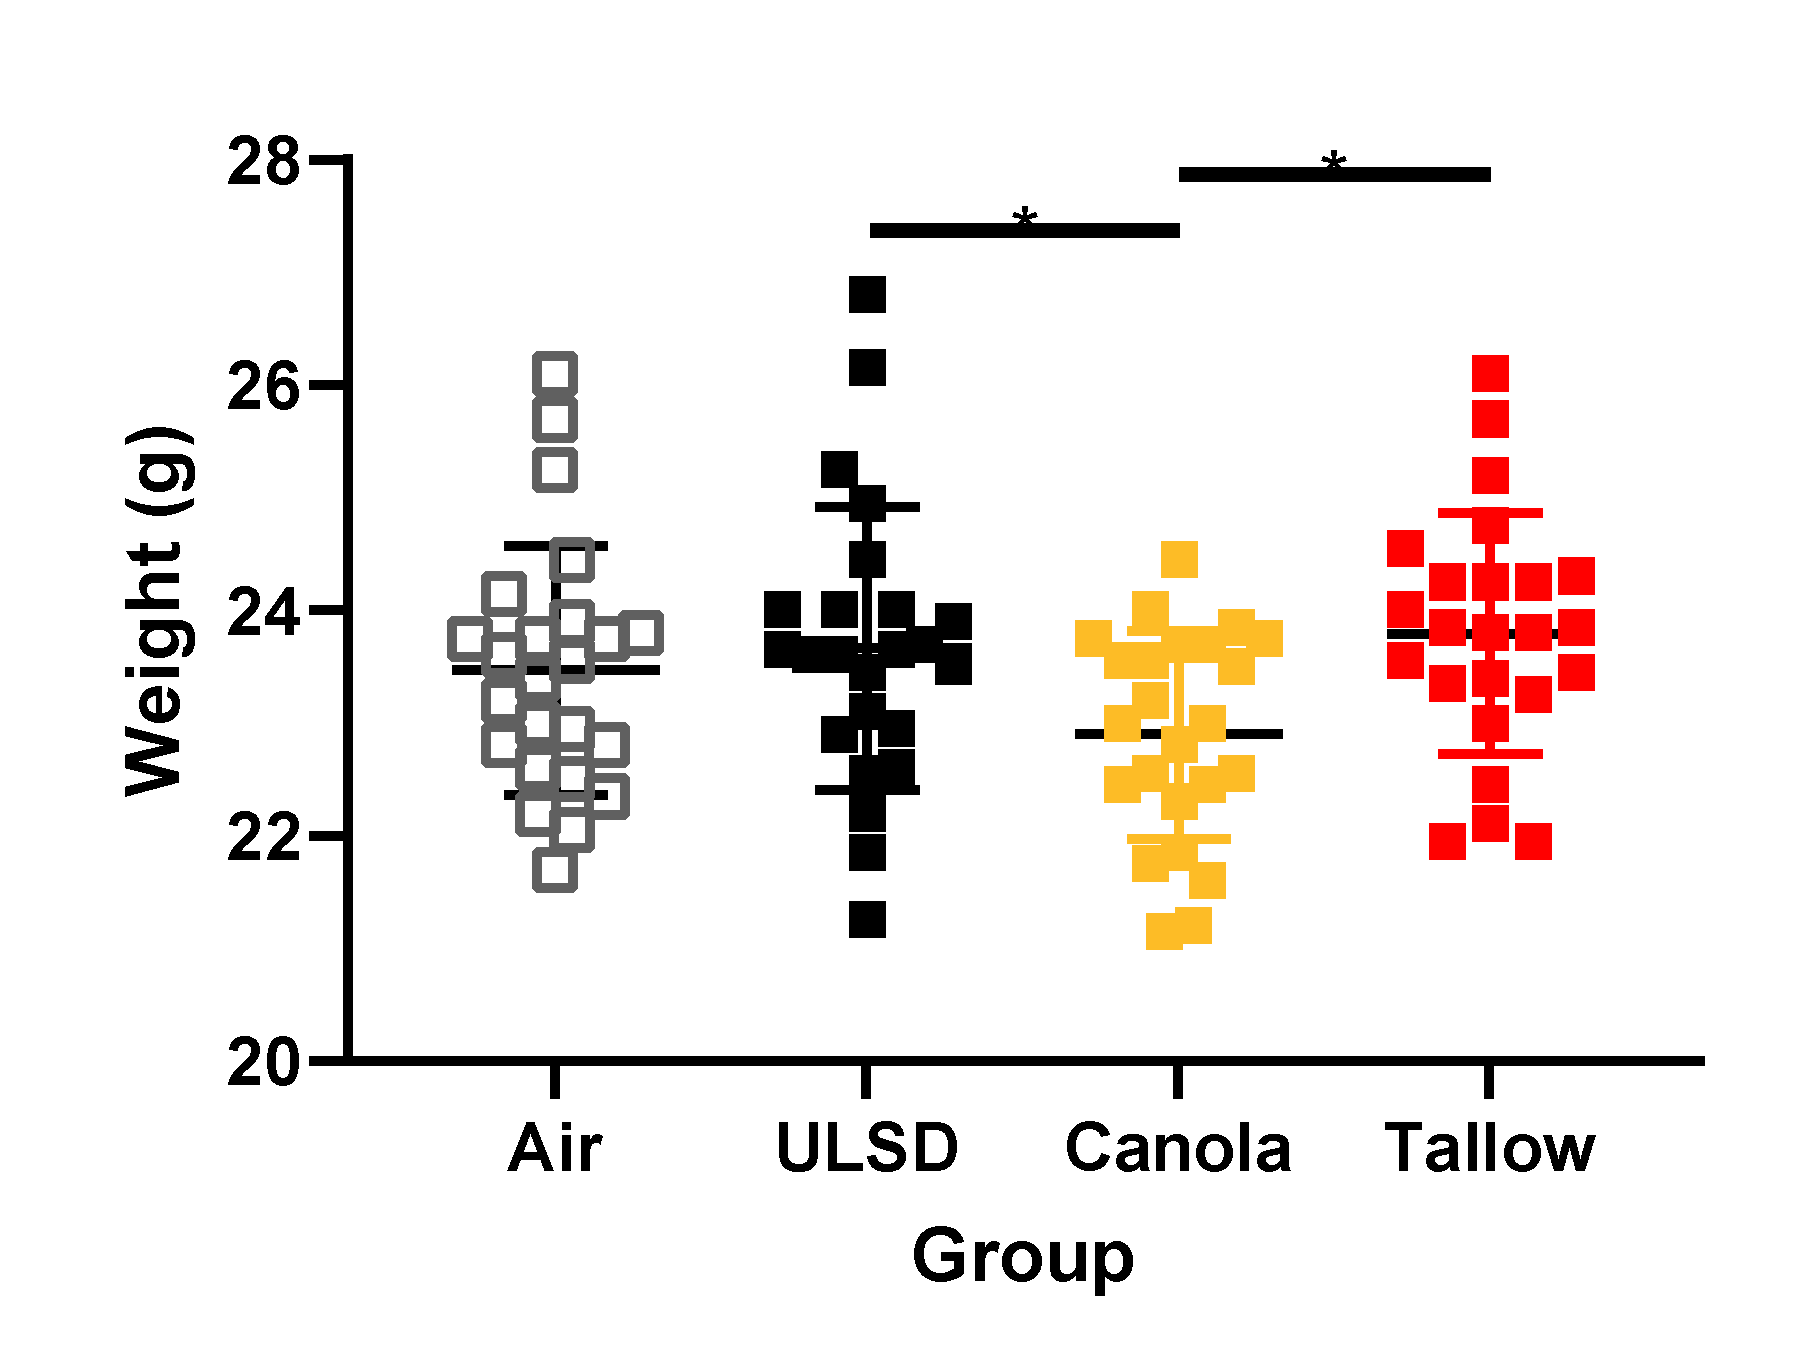
Particle size spectra were obtained for all exhausts between the sizes of 3–340 nm; however, no differences were observed for any of the fuels for total particle number concentrations (Figure 1). Particle mass concentrations (Table 1) were highest in ULSD; however, the concentrations in the Canola and Tallow biodiesels were 78% and 92% of those measurements, respectively, showing little differences between fuels.

2.3. Mouse Weights

Mice were weighed prior to any exposure, and again before lung function assessment, allowing for calculation of the weight changes between the exposure groups (Figure 2). On the day of study, Canola exhaust exposure weights were significantly less than those of ULSD and Tallow. No significant differences were found in % weight increase over the 8 days of exposure for any of the groups.

2.4. Lung Function at Functional Residual Capacity

Thoracic gas volume (TGV) and lung mechanics (airway resistance (Raw), tissue damping (G), tissue elastance (H), and η (hysteresivity)) at functional residual capacity (FRC) were measured (Table 2). TGV was significantly higher in Canola mice compared with all other groups. Due to this, lung function parameters at FRC were normalized to TGV to generate specific lung function measurements. Canola-exhaust-exposed mice had significantly higher sRaw in comparison to ULSD and Tallow groups (p < 0.01). Specific G, H, and hysteresivity were significantly higher for Canola mice in comparison to all other groups (p < 0.01).

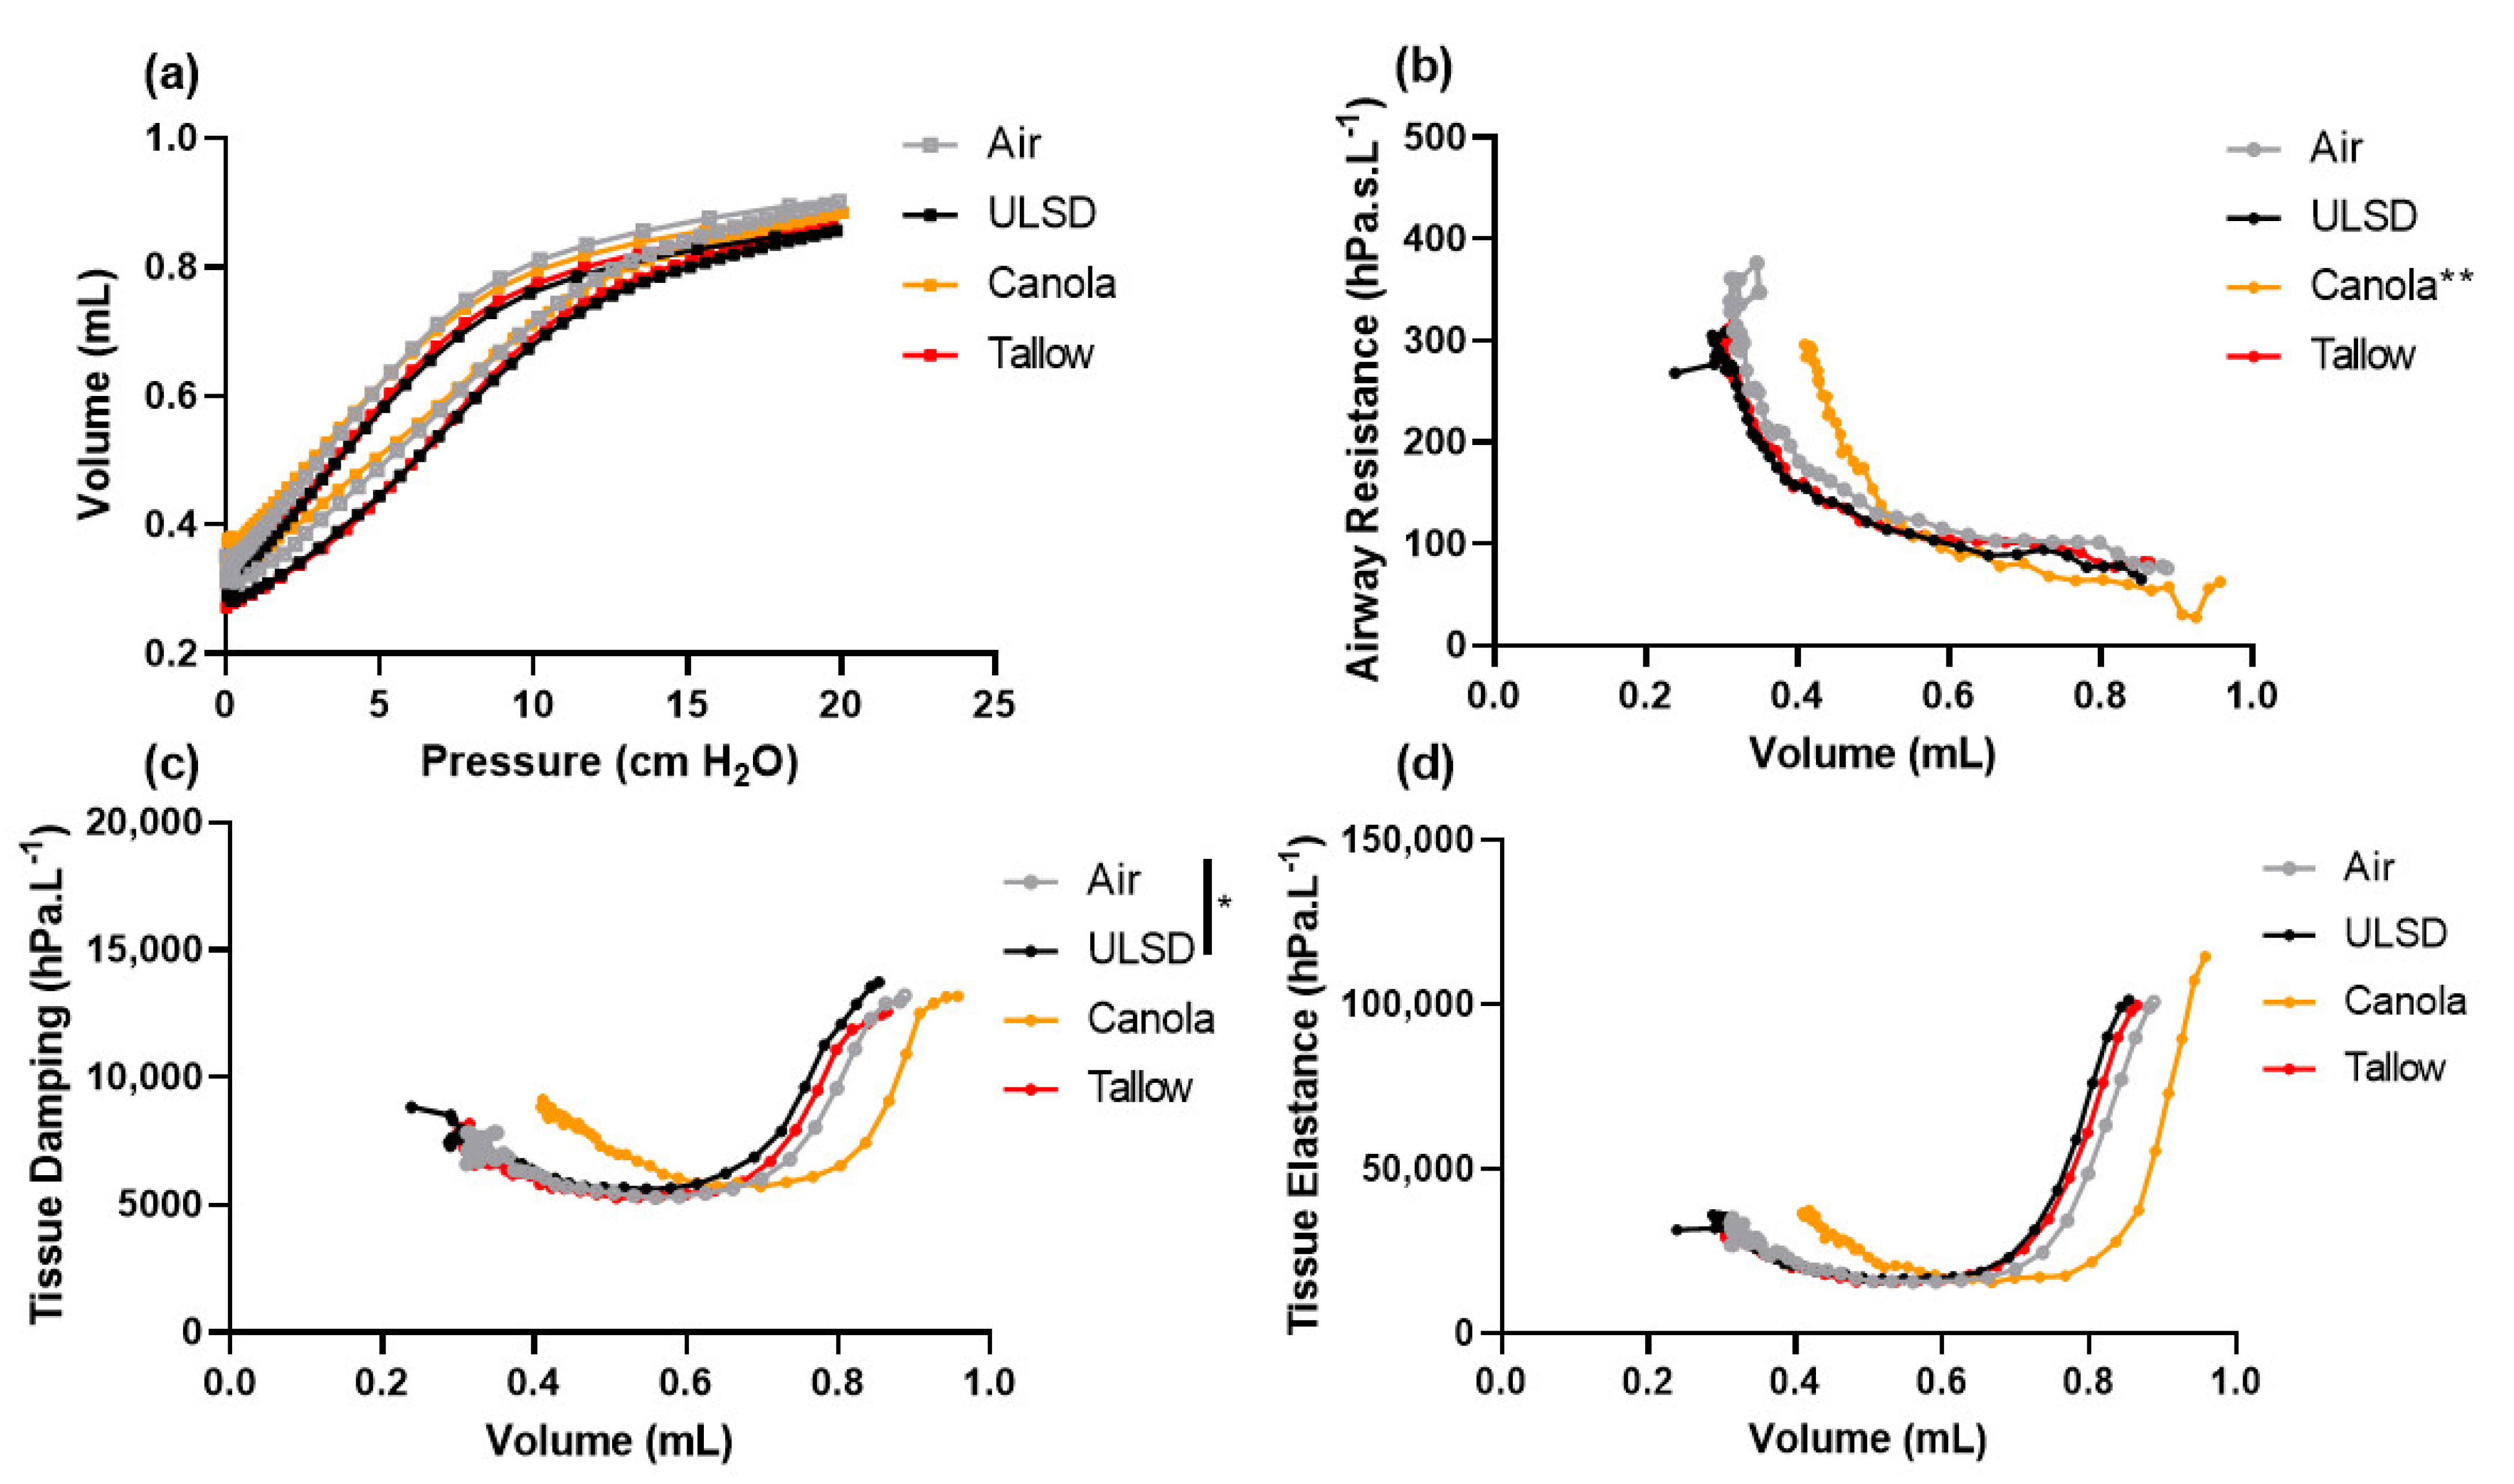
2.5. Volume Dependence of Lung Function

Respiratory pressure–volume curves and volume-dependent Raw, G, and H (Figure 3) were measured throughout a slow, induced inflation–deflation maneuver for each mouse. Specific compliance was significantly lower for Canola-biodiesel-exhaust-exposed mice compared to all other groups (p < 0.0001). At a volume of 0.7 mL (chosen as it is the largest lung volume with data for all mice), Canola-exposed mice were the most different to every other group, with significantly lower Raw (p < 0.01), whereas ULSD-exposed mice showed significantly increased tissue damping compared to Air controls (p < 0.05).

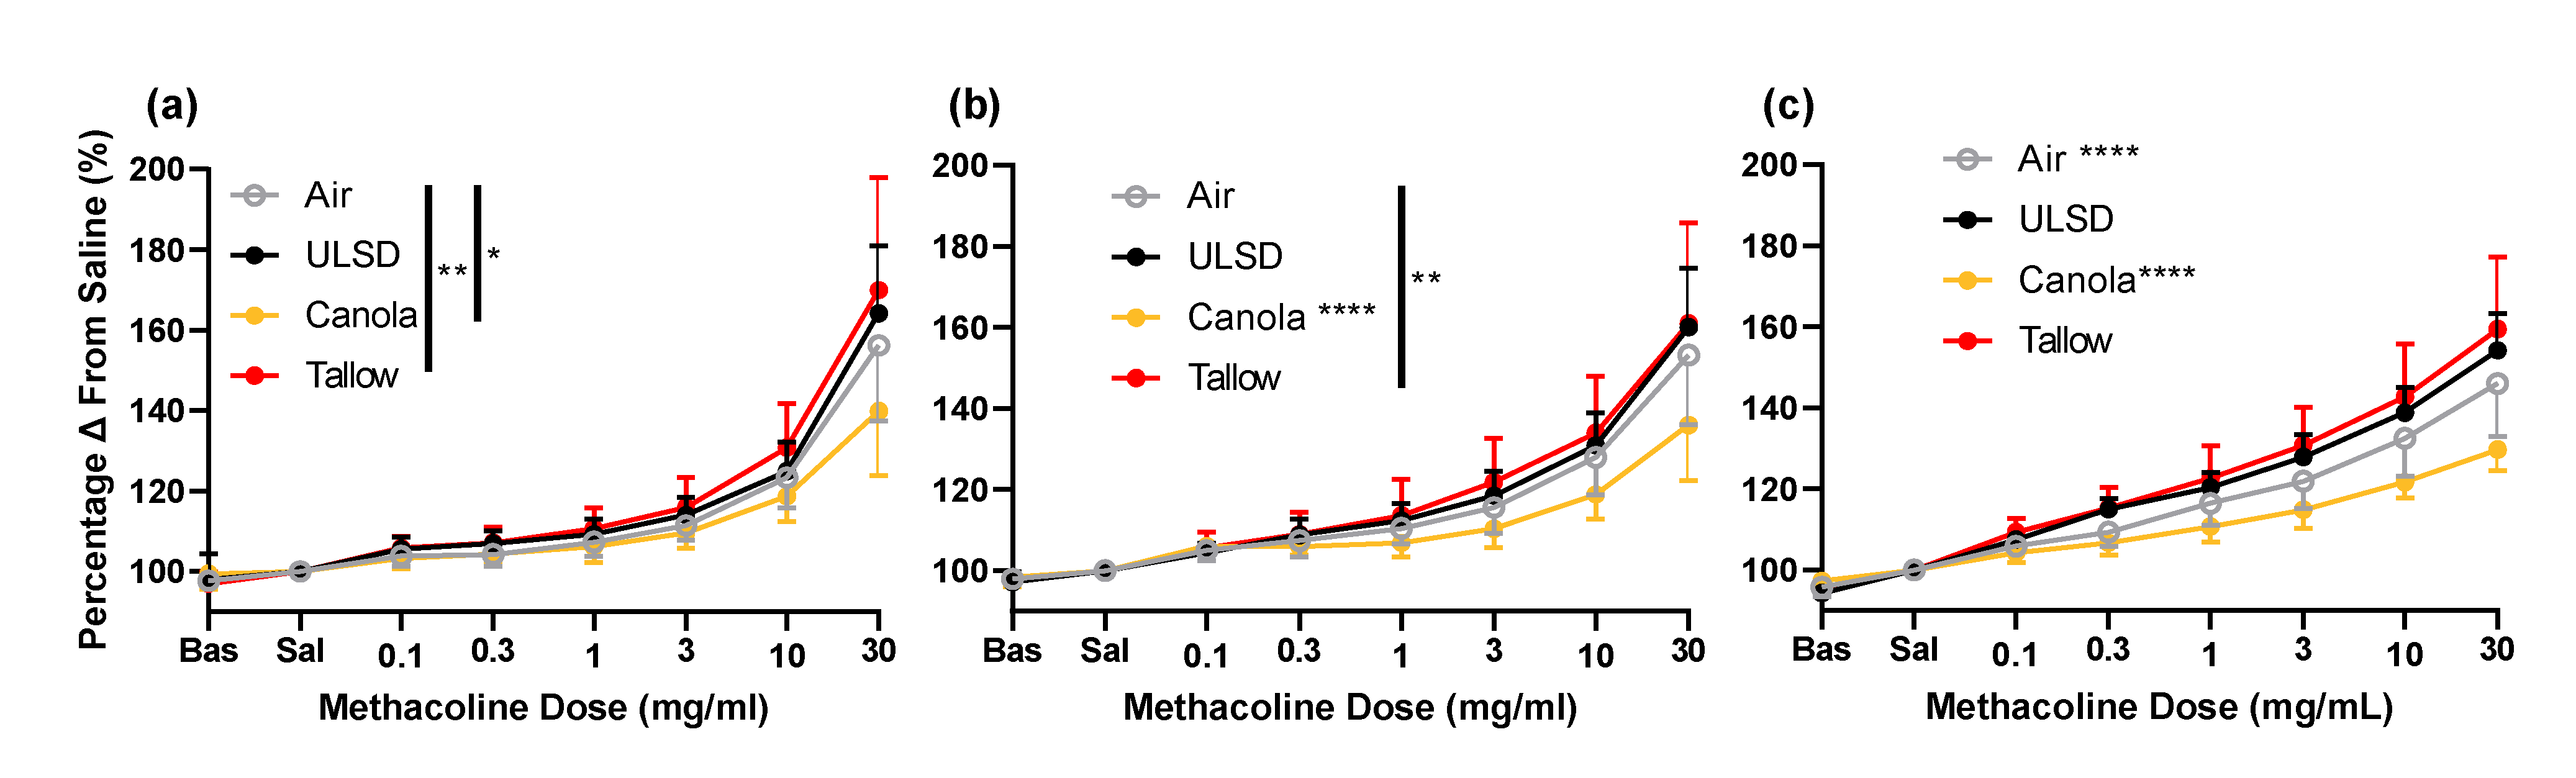
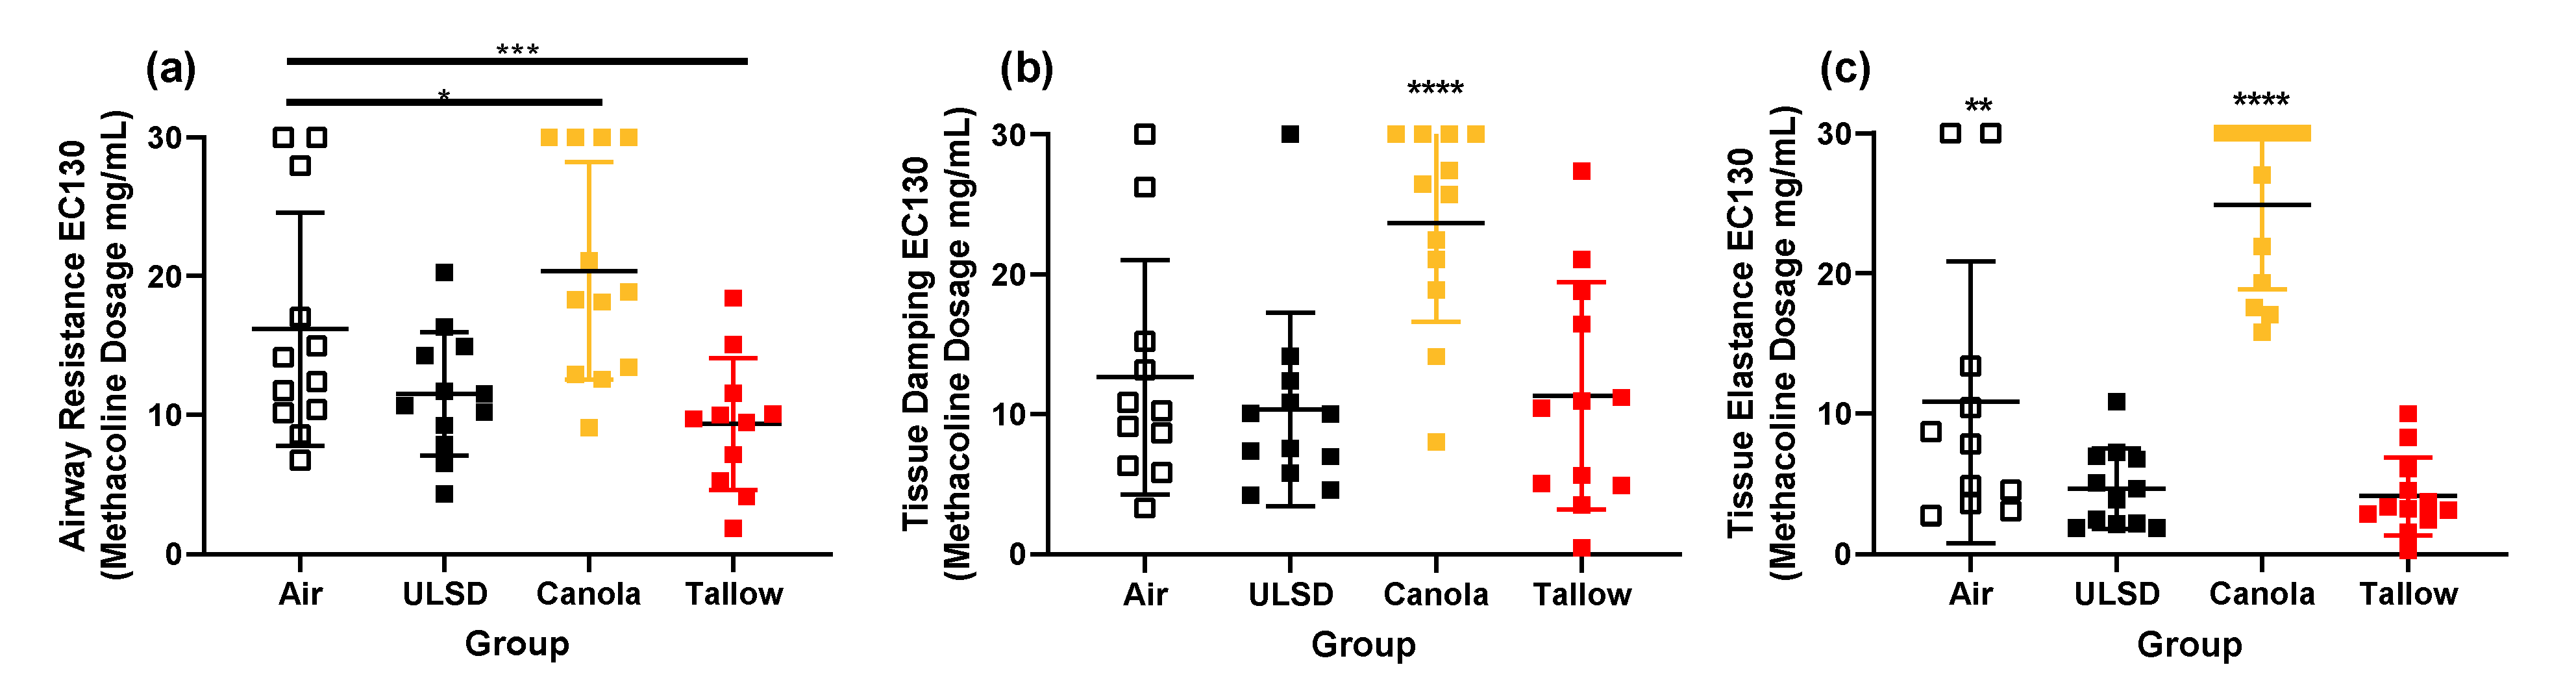
2.6. Responsiveness to Methacholine

Raw, G, and H were measured after exposure to increasing doses of methacholine (Figure 4). There were significant effects of treatment on the responsiveness to MCh with respect to airway resistance. Tallow mice were significantly more responsive than Air (p < 0.018) but Canola mice were significantly less responsive than all other groups (p < 0.001 in all cases). For G, Tallow mice were significantly more responsive than Air mice and Canola mice had significantly lower responses than all other groups (p < 0.01 in all cases). For H, all treatments were significantly different to each other with Tallow having the highest response and Canola the lowest (p < 0.0001 in all cases). This pattern was repeated in terms of sensitivity to MCh (evocative concentration needed to reach a 30% increase in Raw, G, and H from saline; Figure 5). The dose of MCh required to elicit a 30% increase in response was significantly lower in the Tallow mice for Raw and H, significantly lower in the ULSD mice for H, and significantly higher in the Canola mice for Raw, G, and H when compared to Air mice (p < 0.05 in all cases).

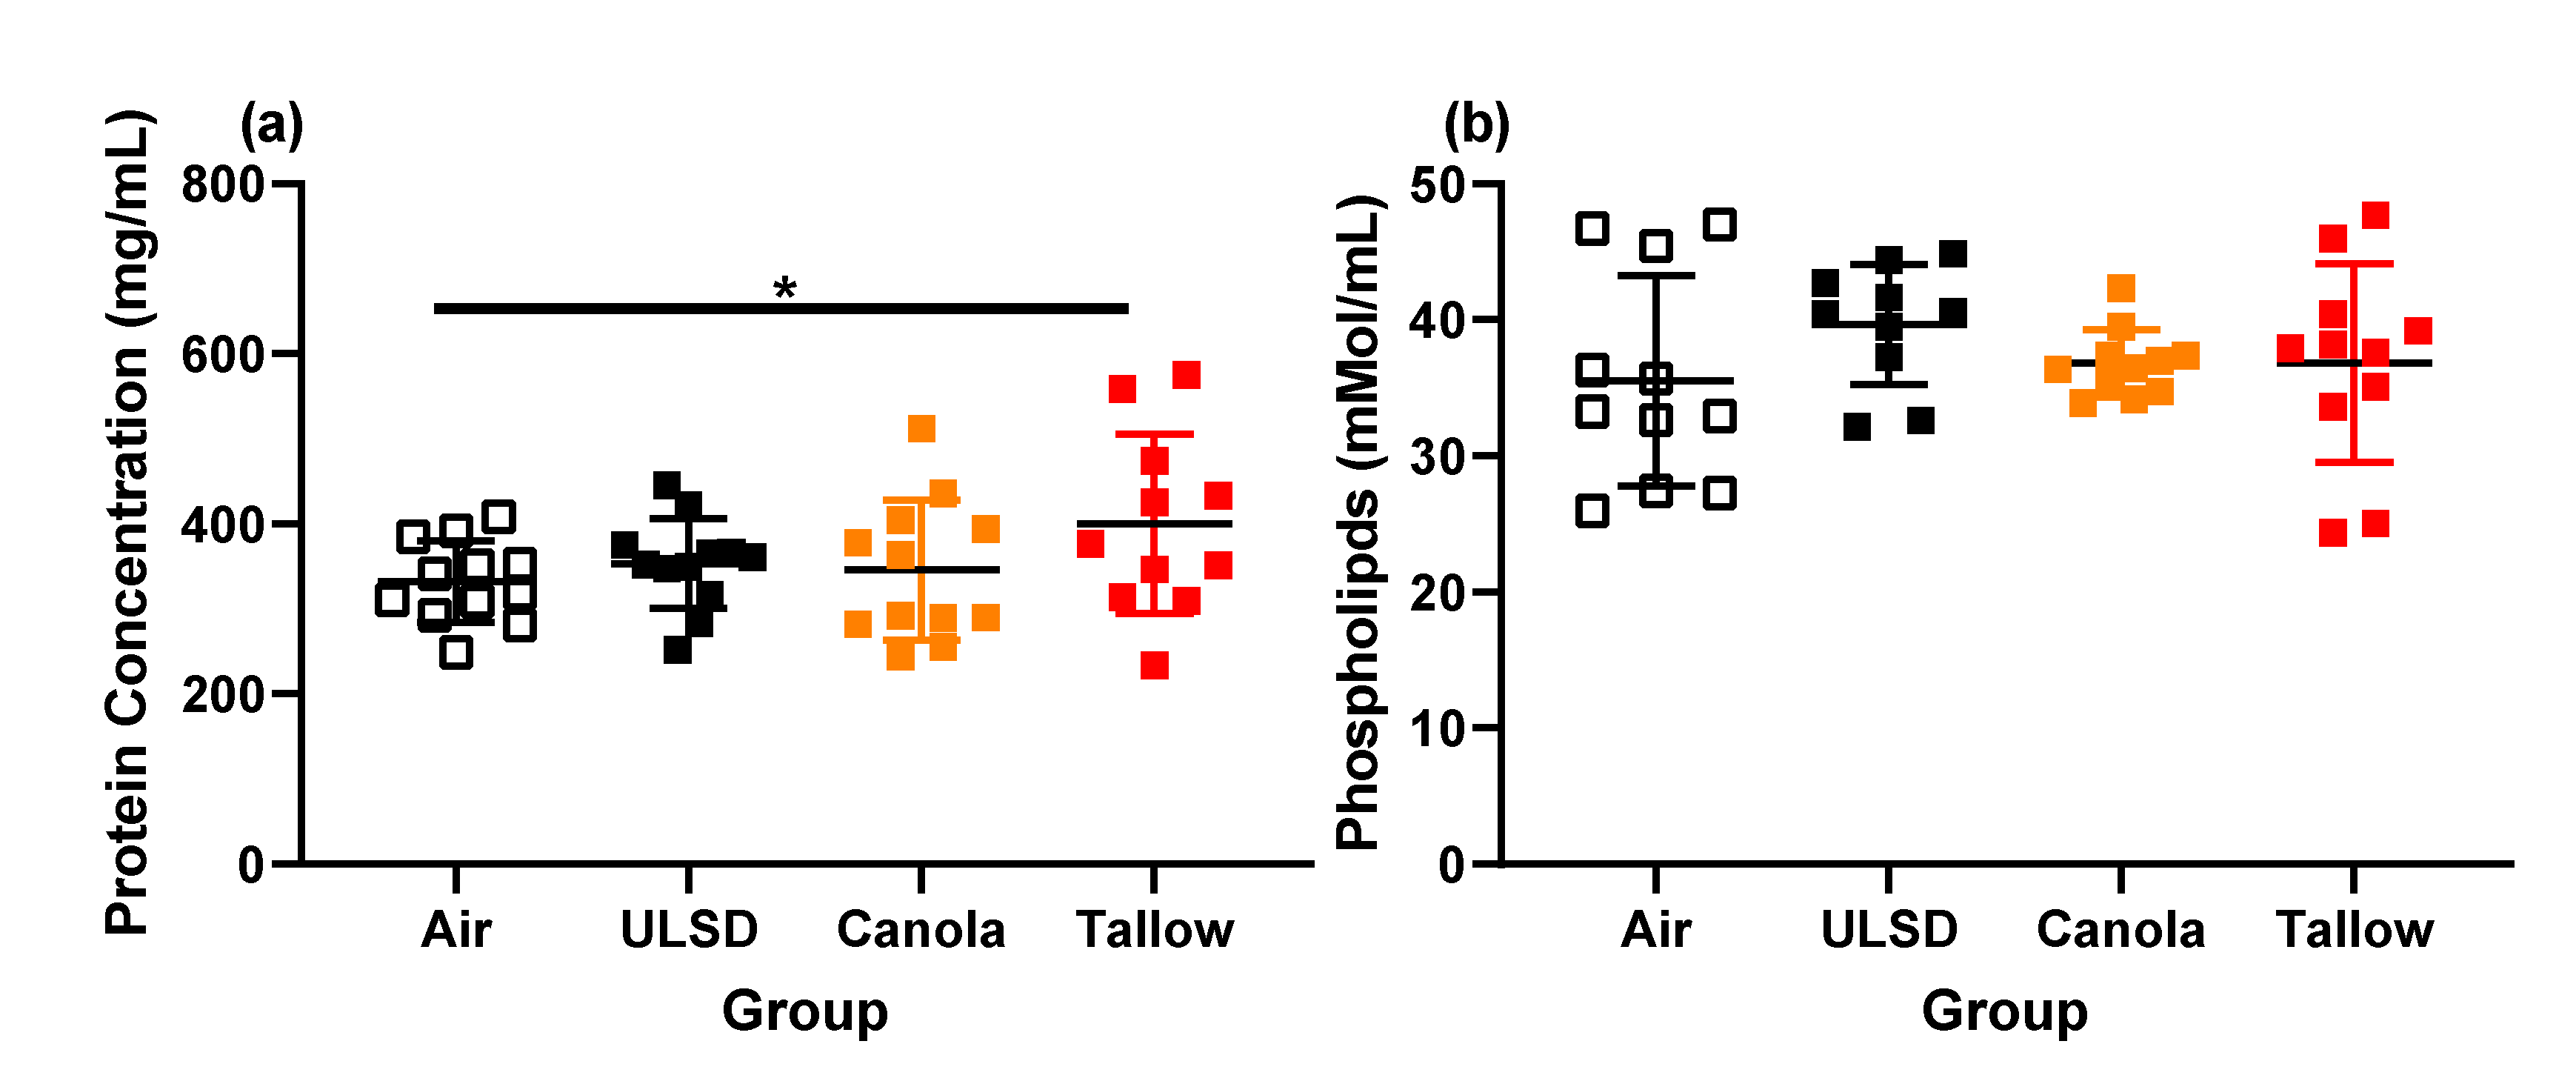
2.7. Bronchoalveolar Lavage Cells, Mediators, Protein, and Phospholipid Concentrations

Total and differential cell counts were performed on bronchoalveolar lavage (Figure 6). Significantly more cells were found in the BAL of Tallow and ULSD mice compared to Air (p < 0.05). The Tallow group also had more cells than the Canola and ULSD mice (p < 0.05). This pattern was seen again in the macrophage cell counts, with the addition of ULSD having more macrophages in the BAL than Canola (p < 0.05). In contrast, the ULSD and Canola mice had significantly fewer neutrophils than the Air-exposed mice (p < 0.05). Tallow mice had more lymphocytes than the Air, Canola, and ULSD mice (p < 0.05). No other cell types were detected. In terms of BAL mediator concentrations (Table 3), the majority of significant differences was found between Tallow and Air, with 1 mediator being significantly increased and 3 mediators significantly decreased for Tallow-biodiesel-exhaust-exposed mice (p < 0.05). Total protein and phospholipid concentrations within the BAL were also measured (Figure 7). There were few effects of exposure on either of these parameters; however, Tallow mice had a significantly increased protein concentration in comparison with Air mice (p < 0.05).

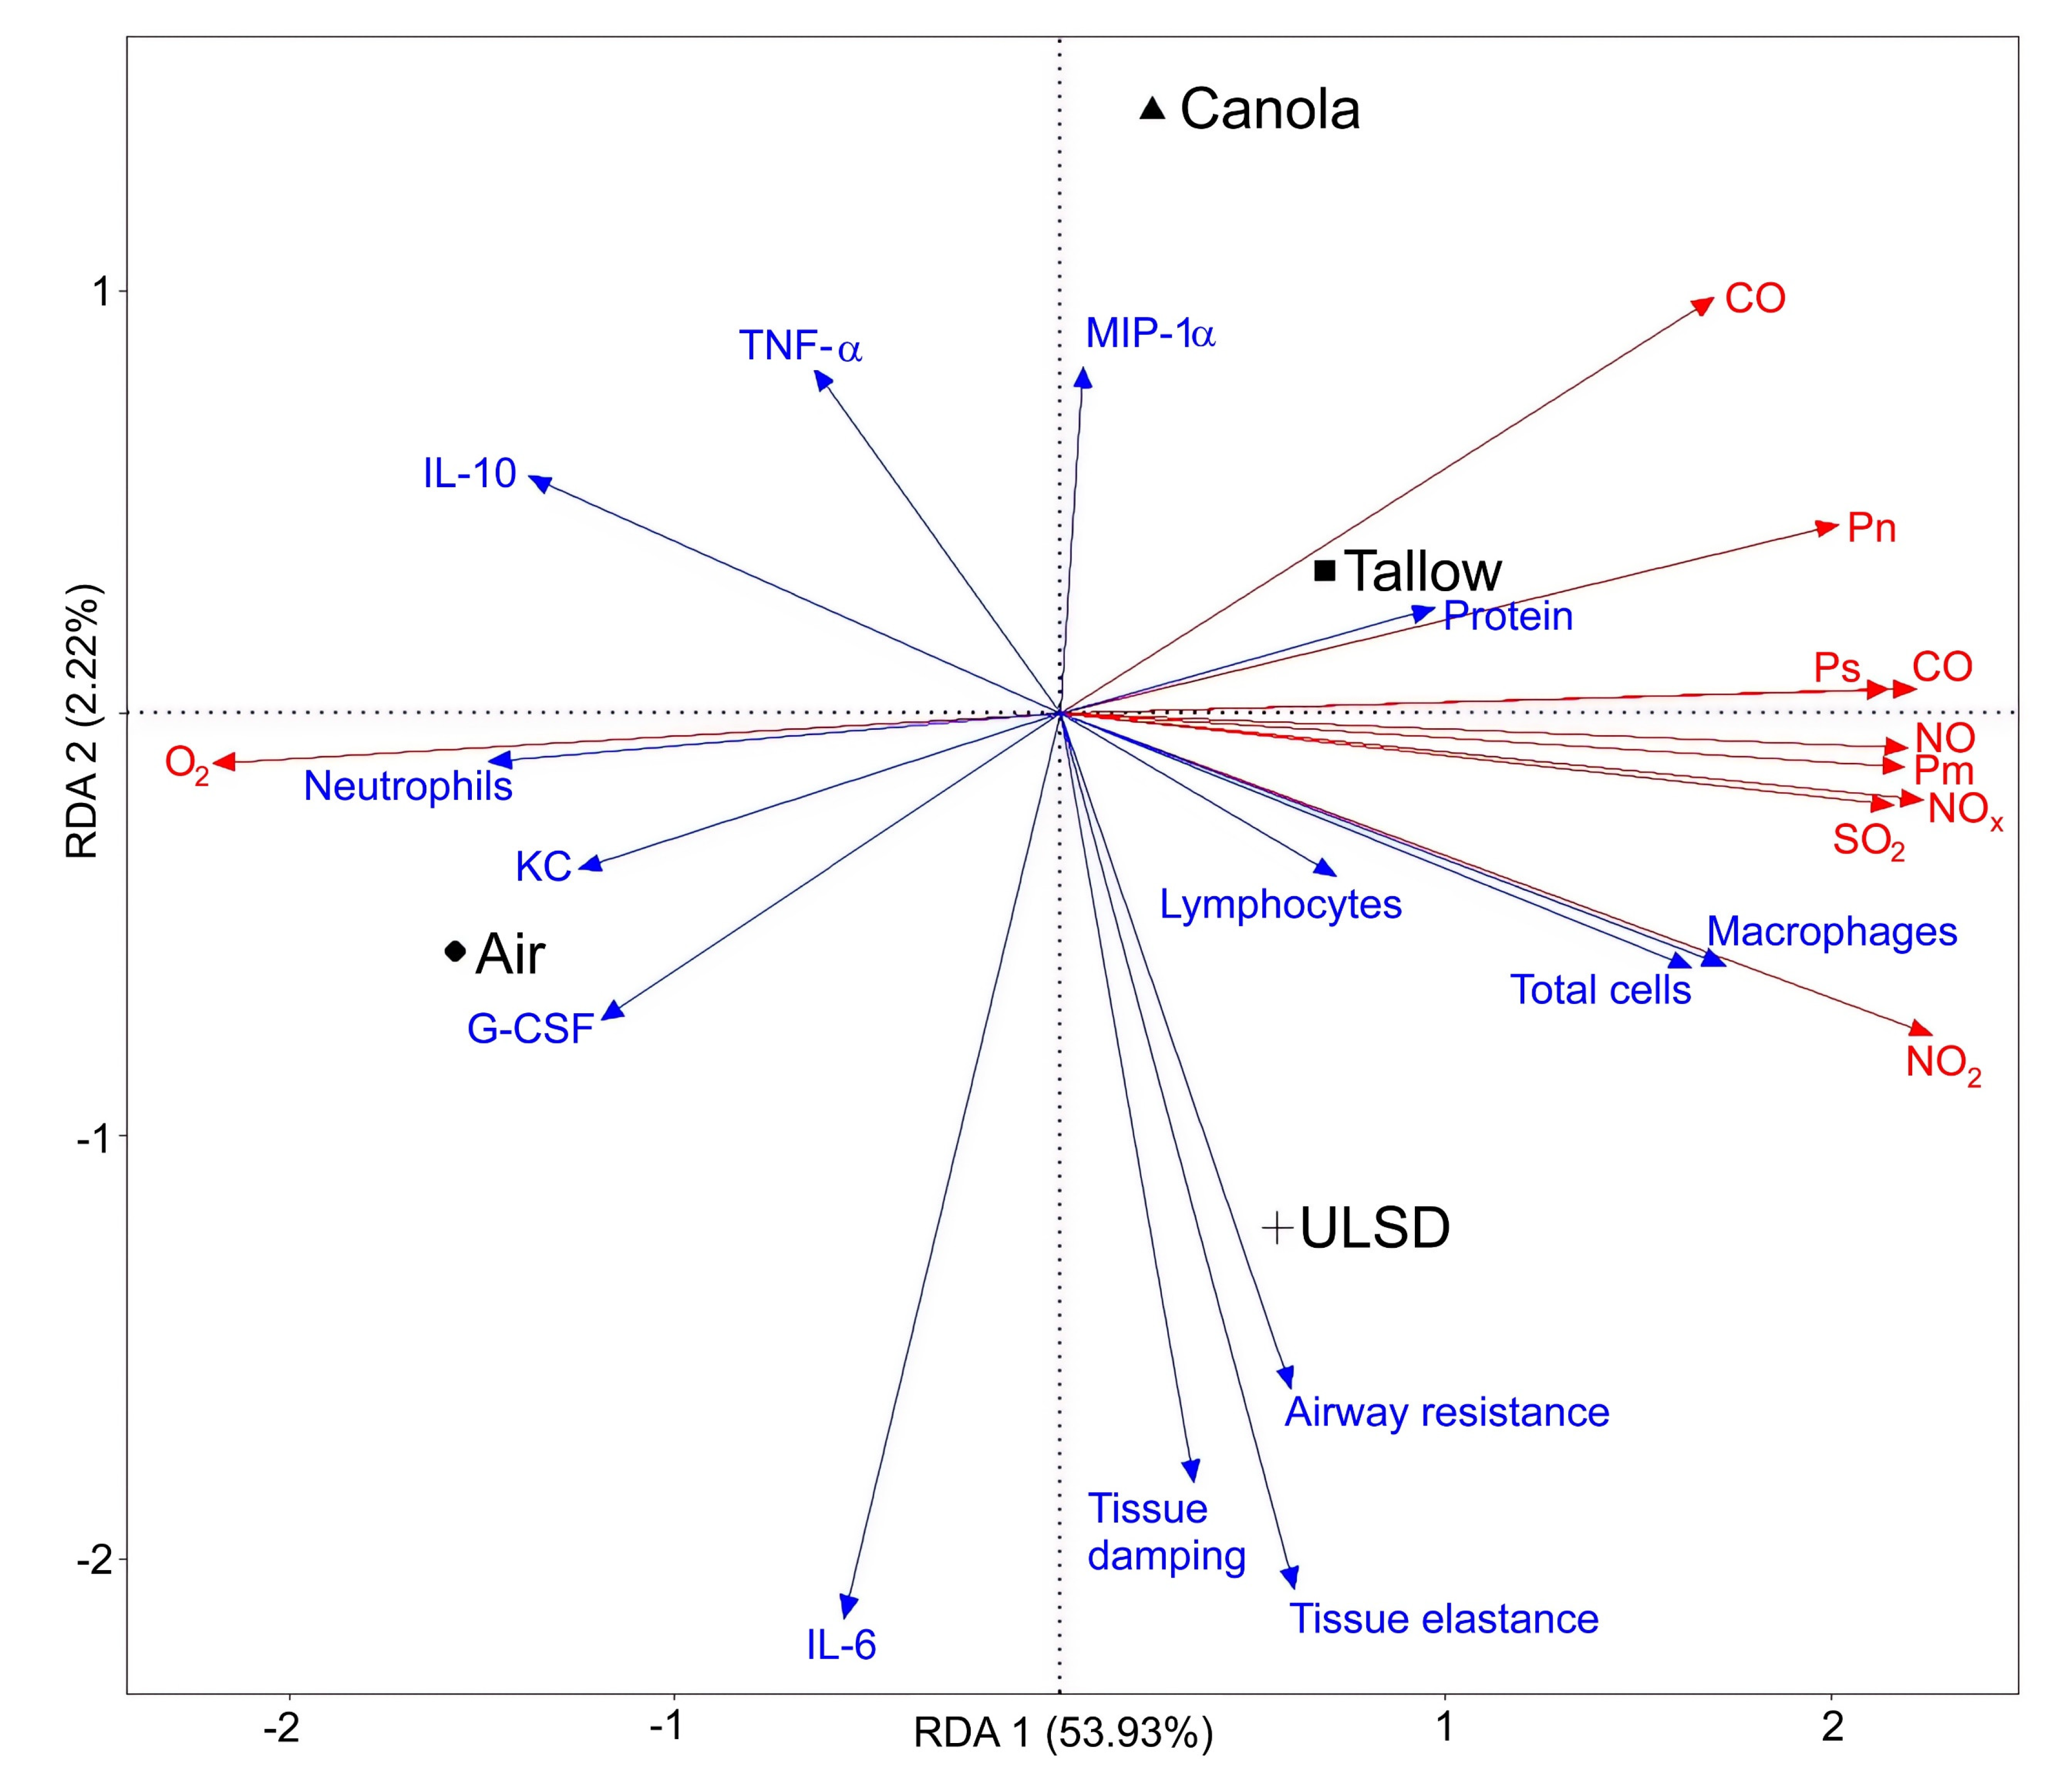
2.8. Multivariate Analysis

Fourteen key outcomes obtained from the responsiveness to methacholine analyses (maximum response in airway resistance, tissue damping, and tissue elastance) and bronchoalveolar lavage (total cellular inflammation, numbers of macrophages, neutrophils and lymphocytes, levels of protein, G-CSF, IL-6, IL-10, KC, MIP-1α, and TNF-α) were fitted to the ten exhaust variables (levels of gases O2, CO, CO2, NO, NO2, NOx, and SO2, in addition to particle size, number, and mass) using a redundancy analysis (RDA) (Figure 8) in order to assess how well the exhaust components explained the resulting biological results. Due to inherent limitations of RDA, only data with complete datasets for all mice in all exhaust-exposed groups were able to be included in analyses. To not overfit the model by overloading it with all cytokine data available, six cytokines were chosen from the 21 analyzed mediator levels. These were chosen based on either their importance in previous exhaust toxicology studies [1,22,28,54] (IL-6, IL-10, TNF- α) or for observed significant differences between exhaust groups and the air control (G-CSF, KC, MIP-1 α). The fitted RDA model showed that over half (56.98%) of the biological variability observed in responsiveness to MCh and BAL outcomes was explained by the exhaust parameters. This type of analysis is a powerful tool in supporting the validity of our findings as it shows strong correlations between related parameters. For example, neutrophilic inflammation is strongly positively correlated with levels of KC (a neutrophilic chemoattractant mediator). Similarly, the responsiveness to MCh outcomes (Raw, G, and H) are all positively correlated with each other, as are the majority of exhaust gases. The oxygen concentration in exhaust is negatively correlated with all other exhaust components, which are strongly correlated with each other (as indicated by the red arrows in Figure 8). This is unsurprising due to fuel combustion requiring oxygen for the reaction. Additionally, neutrophilic inflammation is correlated with neither the total number of inflammatory cells in the bronchoalveolar lavage nor the numbers of other cell types (macrophages and lymphocytes); instead, it is highly negatively correlated with particle number and CO2. The total cell count is highly correlated with NO2 concentrations. Perhaps most importantly, many of the mediator and methacholine response measurements are not correlated with any one exhaust component, suggesting the more complex relationship between exposure and toxicological result that is not currently explainable by the inputted data.

2.9. Airway Morphometry

Size-corrected total airway wall, airway smooth muscle mass, and airway epithelial thickness were measured (Table 4, representative images in Figure S2). Chord length, collagen, and total tissue % were also measured (Table 4). There was no effect of treatment on any airway morphometry parameter (p > 0.05 in all cases). Chord length was significantly higher in Tallow mice compared to Air mice, and Tallow mice had significantly more collagen than Canola and ULSD mice did, suggesting that exposure to Tallow biodiesel exhaust was causing measurable damage to the airways (p < 0.05).

3. Discussion

The results of this study show that exposure to diluted diesel or biodiesel exhaust causes a range of negative health impacts in a murine exposure model. These include impacts on lung function, cellular inflammation, small changes to lung structure, and large impacts to the immune response. Of the two biodiesels tested, Tallow biodiesel exhaust exposure was associated with the widest range of negative health effects with a greater increase in responsiveness to methacholine, a greater than two-fold increase in inflammatory cell numbers in the lungs, a wider disruption in the local mediator release of the lungs, increased protein concentrations in the BAL and a small impact on lung structure with significantly increased chord length. In contrast, Canola biodiesel exhaust exposure only led to negative impacts on lung function at FRC, specific compliance, some decreases in mediator release, and decreased neutrophilic (but not total) inflammation. Mice exposed to Canola biodiesel exhaust were less responsive to MCh than Air-exposed controls, an interesting finding for which we do not have an explanation. The impacts of exposure to ULSD exhaust were generally between those of Canola and Tallow, with increased tissue damping in volume-dependent lung mechanics, several increases in methacholine responses, some decreases in mediator release, and increased immune cell numbers in the lungs of exposed mice.
A concerning implication for this study is that negative health impacts (with implications for wide-reaching consequences) were identified, yet the exhaust used mostly met Safe Work Australia standards [62]. These standards are equivalent to the standards used in Europe and USA [63,64]. The Safe Work Australia standards for various exhaust components are time-weighted 8 h averages of 30 ppm of CO, 5000 ppm of CO2 (peak concentration not exceeding 30,000 ppm), 25 ppm of NO, 3 ppm of NO2 (with peak concentrations not exceeding 5 ppm), and 2 ppm of SO2 (peak concentration not exceeding 5 ppm). Oxygen levels below 19.5% are considered “unsafe” [65]. Table 1 shows that almost all exhaust gases in this study (with the exception of a slightly too high NO2 and a slightly too low oxygen concentration) met these standards. The European Union has set a recent particulate matter occupational exposure limit of 50 ug/m3 of elemental carbon [66,67], whereas in America, the limit for a non-coal mining setting is set at 160 µg/m3 of total carbon [68], and in Australia, it is recommended that diesel exhaust not exceed 100 µg/m3 of elemental carbon [69]. In this study, particle mass concentrations were between 42.6 and 54.4 µg/m3, again showing that common exposure standards were not exceeded.
In the current study, biodiesel exhaust did not contain higher levels of NOx or lower levels of PM compared with ULSD exhaust, as is commonly reported in the literature [18,19,20,22,70]. That said, other studies that measured NOx and PM have also reported either no differences between biodiesel and mineral diesel exhausts, or a decrease in the biodiesel exhaust [19,47,55]. Our previous studies have also found a wide variation in NOx and PM concentrations in biodiesel exhaust compared to ULSD, with differences dependent on the feedstock type used to make the biodiesel [22,54,71]. This suggests that differences in NOx and PM concentrations between diesel and biodiesel are subtle enough that the dilutions used in toxicology studies to make concentrations “real-world”-relevant can mask the changes [18,20,54] and/or that the differences are related to feedstock type. The overarching idea in the literature that biodiesel exhaust overall contains more NOx and less PM may be feedstock-specific and should, thus, be viewed critically [54]. This idea is further supported by the findings that Tallow biodiesel exhaust is no different to ULSD in terms of PM and NOx, but that Canola biodiesel exhaust contained significantly less NOx. Another potential explanation is that many previously published exhaust-only comparisons have been conducted using old technology engines not equipped with a diesel particulate filter and/or diesel oxidation catalyst [18,20,23] and, thus, increased NOx and decreased PM in biodiesel exhaust may only be applicable to older technology engines [19,47,55]. Regardless, the multivariate RDA results suggest a correlation between exhaust gas components and several toxicological responses, showing that it is important that any future experiments analyzing the toxicity of diesel or biodiesel exhaust should use whole exhaust exposure methods instead of focusing solely on the health effects of exhaust particles alone, as is too often conducted in the previous literature [1,28]. For example, we identified a strong correlation between NO2 and inflammation in the form of total cells and the number of macrophages present in the BAL (Figure 8). This correlation is not surprising based on the known inflammatory effects of NO2 [72].
A key finding of this study is that the Tallow-biodiesel-exhaust-exposed mice were hyperresponsive to MCh with respect to airway resistance, tissue damping, and tissue elastance. The mice in this study were exposed for only two hours per day for 8 days, to exhaust that largely met Safe Work Australia Standards, and yet responsiveness to methacholine increased significantly. The response measured is smaller compared to similar exposure studies in smoking, asthmatic, and respiratory viral infection mouse models [73,74,75]; however, comparisons between models that employ a variety of environmental exposures are difficult. Previous studies testing the response to methacholine in mice after intranasal instillation of black carbon or diesel exhaust found a greater hyperresponsiveness than was measured in our study, although differences in diesel exhaust exposure protocols and methacholine dosages make direct comparisons difficult [76,77]. Studies that co-exposed house dust mites and diesel exhaust also found increased responsiveness to methacholine, although only in the co-exposed group and not in the diesel-exhaust-alone-exposed group [78,79]. Studies testing the response to methacholine after diesel exhaust exposure in asthma and atopy also found increased hyperresponsiveness, although, once again, these studies cannot be directly compared, due to differences in subject type and measurements [80,81]. Our finding of increased airway hyperresponsiveness has concerning implications for those with asthma and allergies who are currently exposed for prolonged periods of time to diesel exhaust, as the increased responsiveness to methacholine suggests that a swap to using some biodiesel feedstocks for fuel may elicit worse responses. Additionally, diesel exhaust can act as a sensitizer to aeroallergens and our data suggest that Tallow-derived biodiesel may further enhance that effect [82]. The results of the RDA (Figure 8) suggest that the relationship between exhaust exposure and methacholine response is not straightforward, nor is it correlated with any one particular exhaust component, unlike the measurement of protein concentration present in the BAL, which is highly correlated with the number of particles present in the exhaust.
The finding that mice exposed to Canola biodiesel exhaust for 2 h per day for 8 days were less responsive to methacholine than Air controls was unexpected. Despite being the least toxic in terms of methacholine response and pulmonary cellular inflammation, the Canola biodiesel exposure group displayed both positive and negative health impacts. While the lower 8-day methacholine responsiveness compared to Air, increased thoracic gas volume measurements (despite the Canola mice being significantly smaller than the other groups) and decreased airway resistance in the volume-dependent measurements could be interpreted as positive findings (i.e., “improvements” compared with Air controls), when combined with the negative indications of increased specific Raw, G, and H at FRC, it instead suggests that the complete picture is much more complicated. Diesel (and, thus, likely biodiesel) exhaust is a highly complex mixture made up of thousands of different chemicals [18,37,57,83,84,85,86] and it is possible (and indeed likely, from the results of this study) that exposure to such a mixture could lead to both “positive” and “negative” health impacts as seen for Canola biodiesel exhaust. Further experiments are needed to explore what makes the Canola biodiesel exhaust exposure group so unique. Such research could identify what is changing in the lungs of exposed mice, and also what component(s) of the Canola biodiesel exhaust are associated with the changes. We attempted to address this by examining surfactant levels in the lungs via measurement of BAL choline containing a phospholipid concentration. The surfactant is comprised of approximately 70% of phosphatidylcholine, which, in turn, makes up approximately 80% of phosphatidylcholine in the lungs [87,88]. It is both produced naturally and also used medicinally to improve breathing in preterm children and other children at risk of respiratory failure, as it acts to decrease surface tension at the air–liquid interface of the lung alveoli [88]. However, no difference in phospholipid concentrations was found. Thus, reasons for why the Canola mice responded as they did are difficult to elucidate and warrants further investigation.
Another key finding of this study was the increased cell numbers in the BAL of Tallow biodiesel and ULSD-exhaust-exposed mice. This increase mostly consisted of an increase in macrophages, and an increase in lymphocytes in the Tallow-exposed group. A decrease in neutrophils was also observed in the Air group compared to both the Canola and ULSD groups, a finding that is further supported by the RDA showing negative correlations between total cell count and neutrophil count. This suggests that some immune dysregulation might be occurring in mice sub-chronically exposed to exhaust, a finding that is supported by the local (BAL) mediator response that shows significant decreases in the Tallow-exposed mice compared to their respective Air controls. Due to kinetics of immune mediator release after exhaust exposure, wherein the greatest immune responses in a previous study were found 3–6 h after exposure with decreases back to baseline levels observed by 24 h [89], a decrease after a single day of exposure could be explained as immune mediators being “used up”. However, with the depletion effect ongoing after 8 days of exhaust exposure, combined with the decrease in neutrophil numbers in all groups, even if this decrease was only statistically significant for Canola and ULSD, this instead suggests an inability for the mouse immune system to cope with ongoing exhaust exposure, which could have serious consequences for cancer and infection [90,91,92,93]. These findings have been mirrored in a diesel exhaust human exposure study of occupationally exposed workers [90], which found workers exposed to high amounts of exhaust for prolonged periods showed immune dysregulation and decreases in serum inflammatory mediators, such as IL-8 and MIP-1β. In addition, previous studies co-exposing mice to both a respiratory infection and diesel exhaust found that exposure increased infection susceptibility [93,94]. Studies have also been able to induce allergic airways disease using diesel exhaust [82] and human exposure studies on populations with allergic rhinitis found that diesel exhaust exacerbated allergic inflammation, likely by dysregulating the immune systems’ ability to remove eosinophils [95].
There were also minor changes in the lung structure of Tallow-biodiesel-exhaust-exposed mice in terms of a small but statistically significant increase in chord length. Chord length, also known as mean linear intercept, is a measure of the mean space between airway structures [96,97], and increased chord length has been linked to airway damage and disease such as emphysema [98], although it is not a direct measurement of airway size [96]. The Tallow-exposed mice also had increased protein content in the BAL, which is a marker of increased lung permeability and epithelial damage [76,99] and further supports our previous finding of increased epithelial cell damage and increased permeability in air–liquid-interface cell cultures [60]. Increased epithelial damage and increased chord length would indicate damage to the airways after Tallow biodiesel exhaust exposure [97,98], which is concerning after such a relatively short-duration exposure period. There were no other indications of changes to airway morphometry; however, very mild exposures were used in comparison to some previous studies [41,42,100].

4. Materials and Methods

4.1. Animals

Ninety-six seven-week-old male BALB/c mice were purchased from the Animal Resources Center (Murdoch, WA, Australia) and housed in individually vented cages (IVC Allentown XJ model, ECO FLO Air handling unit set at 22–23 °C with 30–31% humidity, 50 air changes per hour). They were left to acclimatize for one week before being weighed and randomly assigned into one of 4 different groups (n = 24 per group). These groups were exposed for 2 h per day for 8 days to Air or the diluted exhaust of an engine running on ULSD, Canola, or Tallow biodiesel (Figure 9). Twenty-four hours after the last exposure, mice were weighed and prepared for end exposure outcomes as previously described [101].

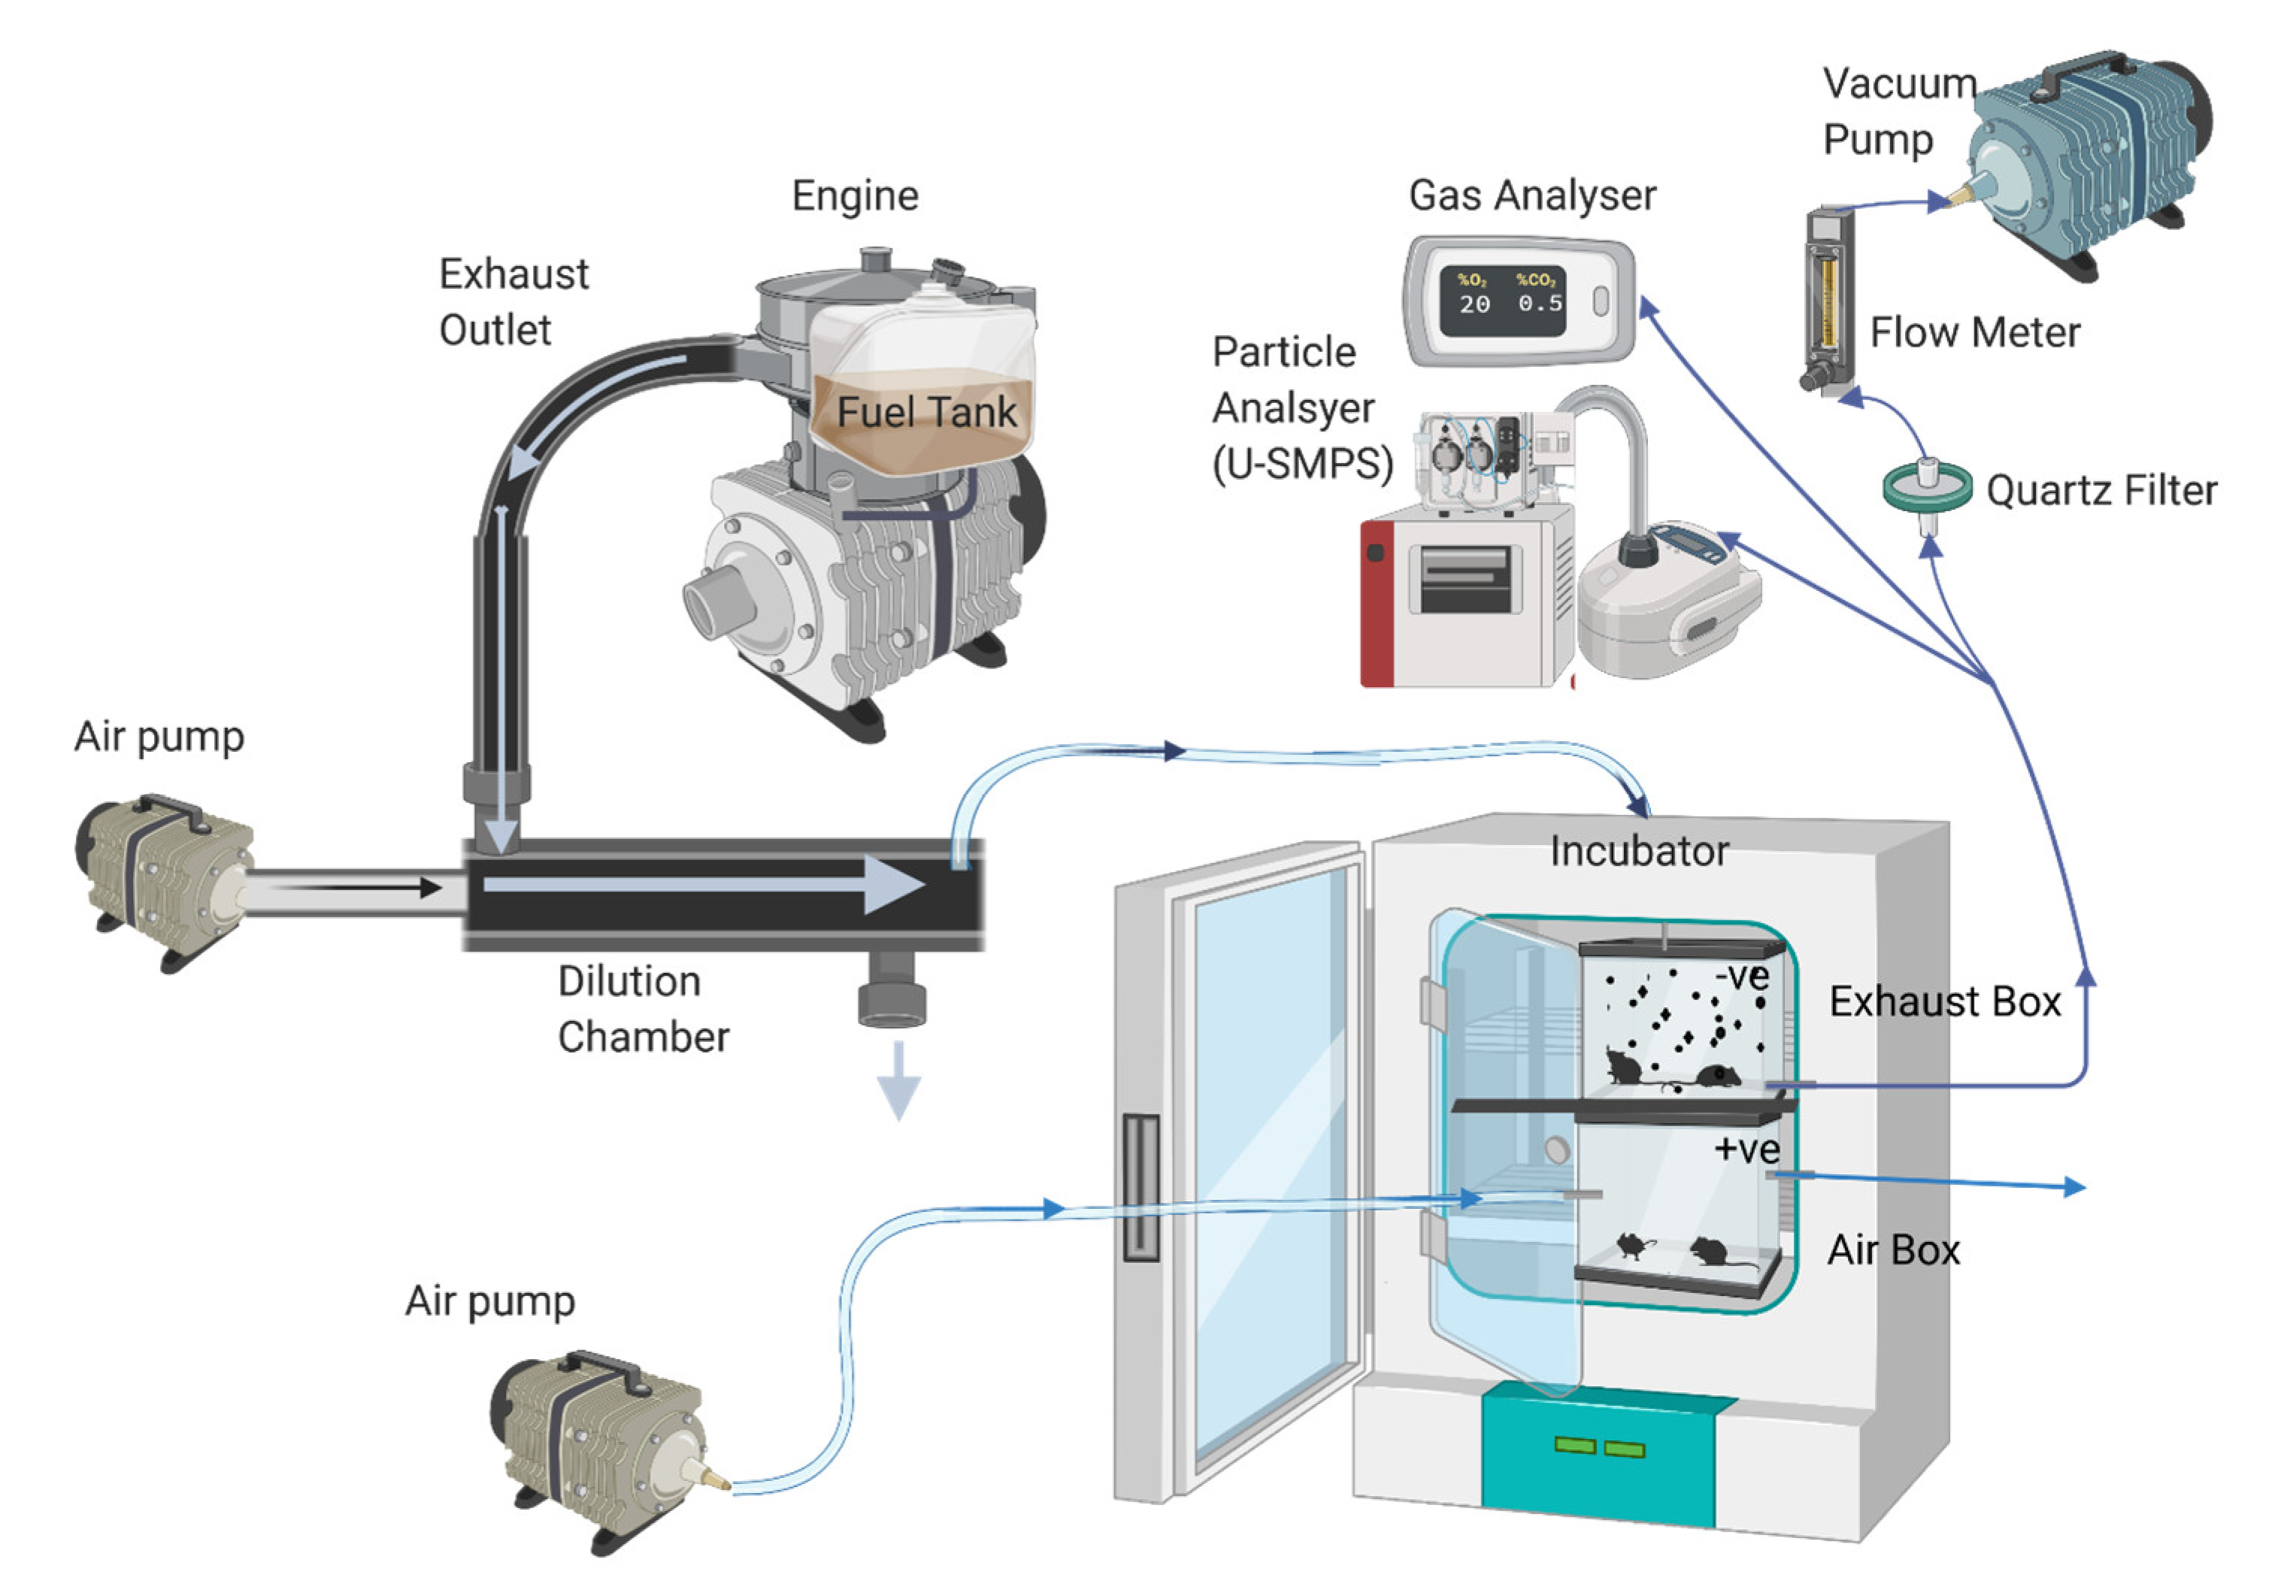
4.2. Engine Configuration and Fuel Information

Exhaust was generated by a single-cylinder, 435 cc design Yanmar L100V engine (Yanmar, Italy) coupled with an electric fuel pump with multistage filtration and a dynamometer and fitted with Euro V/VI after-treatment technology consisting of a diesel particulate filter and oxidation catalyst (Daimler, Germany) [71]. All exposures were run from cold start with a constant load of 40% and a speed of 2000 rpm. Air exposures were conducted simultaneously alongside exhaust exposures. The diesel fuel used as the control was obtained from a local supplier (SHELL, Australia, <10 ppm sulfur). Both Canola and Tallow biodiesel were created following an established sodium methoxide transesterification process [102] using high-quality oils obtained from local suppliers (Campbells Wholesale Reseller, WA, Aus and Range Products, WA, Aus). Detailed FAME profiles have been previously published [54,103]. The diesel exhaust exposure consumed less fuel due than was required for both biodiesel exposures, likely due to the differences in fuel efficiency [18].

4.3. Exposure Protocol

The exposure methodology is based on a combination of previously published protocols [41,103]. To make exposures more realistic to occupational settings, mice were exposed for short time periods to exhaust diluted approximately 1/10 with air with cold-start emissions included as part of the exposure. The exhaust was diluted inside a mixing chamber attached to the exhaust piping and pumped through an isokinetic sampling point at a rate of 5 L/min into a sealed incubator (Model 1535, Sheldon Manufacturing, OR, USA) maintained at 28 °C containing a 27 L exposure chamber with the mice inside divided into individual cubicles. The sealed incubator was used to dampen the sound of the engine and keep chamber temperatures constant. During exposures, exhaust was gently vacuumed out of the exposure chamber for physicochemical analysis of gas and particle properties (Figure 10). Simultaneously to the exhaust exposure, a second 4 L exposure chamber was also placed inside the incubator and attached to piping that allowed air to be pumped inside for the Air exposure controls. The difference of pumping air into and vacuuming exhaust out of the different chamber boxes created a pressure gradient that made certain of no chance for cross-exposure contamination, in case of any leakages within the sealed exposure chambers. Fewer Air mice were exposed at any one time (i) because of the smaller control exposure chamber and (ii) to ensure that there were control animals on each data acquisition day. All exposure chambers were thoroughly washed and dried between exposures.

4.4. Gas and Particle Analysis

Exhaust exiting the exposure chamber was analyzed at the beginning of every exposure and then every 10 min until the end of exposure for concentrations of combustion gas products including O2, NOx (NO and NO2), CO, CO2, and SO2 using a combustion gas analyzer (TESTO 350, Testo, Lenzkirch, Germany). Similarly, exhaust was analyzed every 10 min for particle concentrations between the sizes of 3 nm and 340 nm using a Universal Scanning Mobility Particle Sizer (U-SMPS 1700 Palas, Karlsruhe, Germany). Particles less than 10 nm in size were excluded from further calculations due to the high variability of measurements at that size range. Median particle size count was calculated using the mean number of particles. Particle mass was calculated from particle spectra, assuming sphericity and using the 40% load diesel exhaust particle density as previously described [104]. Particle number was further separated into two fractions: nucleation mode particles below 23 nm in size and solid particles above 23 nm [61]. Due to the high dilution and aftertreatment devices used in this experiment, there was not enough particulate matter collected on quartz filters to perform detailed chemical analysis on polycyclic aromantic hydrocarbon, aldehyde, or heavy metal concentrations present in the exhaust [60].

4.5. Lung Function Measurements

Measurements of thoracic gas volume (TGV) and lung mechanics were conducted as previously described [73,105,106]. In brief, mice were anesthetized via intraperitoneal injection of a solution containing ketamine (40 mg/mL; Troy Laboratories, New South Wales, Australia) and xylazine (2 mg/mL; Troy Laboratories, New South Wales, Australia) at a dose of 0.1 mL/10 g body weight, tracheostomized with a 10 mm long cannula with an internal diameter of 0.86 mm, and attached to a mechanical ventilator (HSE Harvard Minivent; Hugo Sachs Harvard Elektronik, March-Hugstetten, Germany). They were ventilated at a rate of 400 breaths/min with a tidal volume of 8 mL/kg and 2 cmH2O of positive-end expiratory pressure, which is sufficient to allow measurement of lung function parameters without either induction of paralysis or autonomous breathing. Plethysmography was used to measure TGV. At end expiration, the trachea was occluded and the intercostal muscles electrically stimulated (six 2 to 3 ms, 20 V pulses, model S44 electrical stimulator; Grass Instruments, Quincy, MA, USA) to induce inspiration with tracheal pressure and plethysmograph box pressure measured throughout. TGV was then calculated using Boyle’s law, after correction for thermal properties and impedance of the plethysmograph [106]. Respiratory system impedance (Zrs) was measured using a wave-tube system adapted for use in small animals [107,108] and a modification of the forced oscillation technique [108]. The constant-phase model was fit to Zrs to generate the parameters of airway resistance (Raw), tissue damping (G), and tissue elastance (H). Zrs was measured at functional respiratory capacity and also during a slow inflation–deflation maneuver from 0 to 20 cmH2O transrespiratory pressure (Prs), allowing for construction of absolute pressure–volume curves and assessment of the volume dependence of lung mechanics. Specific lung compliance was then calculated between Prs = 8 cm/H2O and 3 cm/H2O on the deflationary arm [109].

4.6. Methacholine Challenge

After measurement of TGV and lung mechanics, a randomized selection of half the mice from each group (n = 12) were transferred to a small animal ventilator (Legacy flexiVent; SCIREQ, Montreal, QC, Canada) for assessment of responsiveness to methacholine (MCh; acetyl β-methacholine chloride; Sigma-Aldrich, St. Louis, MO, USA) as previously described [110]. Briefly, 5x forced oscillation technique (FOT) measurements were taken at FRC/baseline (1 per minute), then after a 10 s saline aerosol and again after increasing doses of MCh from 0.1 to 30 mg/mL. Peak responses to MCh at each dose were used to construct dose–response curves.

4.7. Bronchoalveolar Lavage (BAL) Collection and Cell Measurement

At the end of the methacholine challenge, BAL fluid was collected by washing 0.5 mL of chilled saline in and out of the lungs three times via the tracheal cannula (n = 12 per group). Lavage samples were processed as previously described for total cell counts [111] and differential cell counts were obtained using DiffQuik (Thermofisher Scientific, Waltham, MA, USA) staining as per the manufacturer’s protocol. In short, samples were centrifuged at 400× g for 4 min to pellet the cells and the supernatant was removed and stored at −80 °C for future mediator, protein, and phospholipid analysis. A total cell count was determined from the cell pellet by staining an aliquot of cells with trypan blue and counting cells with a hemocytometer. Remaining cells were cytospun, stained with DiffQuik, and scanned using a Panoramic MIDI® scanner (3DHISTECH Ltd., Budapest, Hungary) prior to visualization using ImageJ [112] to determine the proportion of cell types within a randomized count of 300 cells.

4.8. Lung Fixation, Airway Morphometry, and Histology

Non-methacholine-challenged mice had lungs inflation fixed at Prs = 10 cmH2O using 10% formalin [96] prior to removal en bloc for airway morphometry analysis (n = 12 for all groups). The left lung was embedded in paraffin, and 5 μm thick sections were taken from the proximal region, where the primary bronchi were first fully enclosed by tissue. Three sections from each mouse were stained using Masson’s trichome and the most intact sections were imaged using a Panoramic MIDI® scanner (3DHISTECH Ltd., Budapest, Hungary). Semiautomated assessment of chord length was performed [97,113] and collagen content was quantified as a percentage of total tissue in the cross-sectional area using ImageJ [112]. The cross-sectional area of the outside bronchi wall, airway smooth muscle, the gap between smooth muscle and the epithelium, and the airway epithelium were measured. The square root of all areas was normalized to the internal perimeter of the basement membrane to correct for differences in airway size [114].

4.9. Mediator, Phospholipid, and Protein Analysis

BAL was analyzed for mediators as per kit protocol using Bio-Rad Mouse Cytokine 23plx kits (Bio-Rad) and accompanying software (Bio-Plex Manager, v6.1.1, Bio-Rad, Tokyo, Japan). The protein concentration of BAL was used as an indirect measurement of airway epithelial damage and was assessed as per kit protocol using a Pierce™ BCA protein assay kit (Thermofisher Scientific). Phospholipid (choline containing) concentration within the BAL was analyzed to assess surfactant concentrations as per kit protocol using a Colorimetric Phospholipid Assay Kit (Abcam). Serum immunoglobulin concentration was analyzed as per kit protocol using Mouse Immunoglobulin Isotyping Magnetic Bead Panel (Milliplex, MERCK).

4.10. Statistical Analysis

Data are presented as mean ± standard deviation. This study was performed as part of a larger study with both 1-day and 8-day exposure groups. As the study was initially designed to have exposure groups for both days, statistical analyses were performed on the whole dataset (including both timepoints). Due to the complexity of the data, this larger study has now been separated into two. The 8 days of exposure results are reported in this paper. All statistical analyses were performed using R statistical software (v3.4.3) [115] loaded with the packages “lme4”, “mgcv”, and “Vegan” [116]. p-values less than 0.05 were considered significant. All statistical analyses excluding gas concentration data were completed using multivariate general linear modeling methodologies with the families “Gamma(inverse/log)” and “gaussian(identity/log)” as best fits to the data, applying a backwards elimination approach to remove insignificant predictive variables. For combustion gas analysis, a separate General Additive Model (GAM) file was fitted to each gas measurement with concentration as the response variable and time as the predictor, thus allowing for non-parametric fits as caused by cold-start effects. Redundancy analysis (RDA) [116,117] was performed using the package “Vegan” and a previously published protocol, inputting data obtained only from the methacholine challenge and the bronchoalveolar lavage due to the limitations of the model’s ability to deal handle missing data values, meaning that only whole datasets could be appropriately analyzed. This excluded both the histology data and lung function measurements at FRC due to different sets of mice being used for different measurements, and the mice used for airway morphometry measurements were not the same group as those used for the remainder of the results. To not overfit the model with the highly correlated cytokine data, 6 cytokines were chosen for analysis: IL-6, IL-10, G-CSF, KC, MIP-1α, and TNF-α chosen for either their importance to the innate immune response or for the observed significant differences compared to air-exposed controls [88,89,90,91,92,93,94]. Before completing the RDA, data were standardized using the command “decostand” to help account for different units of measurement used for different values [116,117]. The RDA was then performed as recommended by the “Vegan” package guidelines.

5. Conclusions

Exposure to diesel and/or biodiesel exhaust impacted lung function measured at FRC, volume-dependent lung function, methacholine responsiveness, inflammation, and airway morphometry in a mouse model. In line with our previous research [54,60]. Tallow biodiesel exhaust exposure resulted in the widest range of negative health impacts, followed by ULSD exhaust with Canola biodiesel exhaust causing the most limited impacts and arguably even having a positive effect on methacholine response. More research is needed to parse out reasons for this.

Supplementary Materials

The following supporting information can be downloaded at: https://www.mdpi.com/article/10.3390/ijms24065130/s1, Figure S1: Changes in gas concentration over time, Figure S2: Representative images of airway morphometry.

Author Contributions

Conceptualization, K.R.L., A.K., B.J.M. and A.N.L.; methodology, K.R.L., R.M.-H., B.J.M. and A.N.L.; formal analysis, K.R.L., R.A.O. and A.N.L.; investigation, K.R.L. and A.N.L.; resources, R.M.-H., B.J.M., A.K. and A.N.L.; writing—original draft preparation, K.R.L.; writing—review and editing, R.M.-H., R.A.O., B.J.M., A.K. and A.N.L.; project administration, A.N.L.; funding acquisition, A.K., B.J.M. and A.N.L. All authors have read and agreed to the published version of the manuscript.

Funding

This research was supported by the Australian Research Council Discovery Project Grant- DP170104346, the Telethon Kids Institute, Stan Perron Charitable Foundation and Curtin University, Western Australia. Associate professor Anthony Kicic is a Rothwell Family Fellow.

Institutional Review Board Statement

The animal study protocol was approved by the Curtin University Animal Ethics Committee (approval number ARE2020-16, approved on 23 July 2020).

Data Availability Statement

Data are available upon request.

Acknowledgments

We would like to acknowledge Curtin University’s School of Population Health, Curtin University’s Schools of Engineering, and Curtin University’s Graduate Research School for their support. The graphical abstract was created using Biorender.com.

Conflicts of Interest

The authors declare no conflict of interest.

References

  1. Landwehr, K.R.; Larcombe, A.N.; Reid, A.; Mullins, B.J. Critical review of diesel exhaust exposure health impact research relevant to occupational settings: Are we controlling the wrong pollutants? Expo. Health 2021, 13, 141–171. [Google Scholar] [CrossRef]
  2. Long, E.; Carlsten, C. Controlled human exposure to diesel exhaust: Results illuminate health effects of traffic-related air pollution and inform future directions. Part. Fibre Toxicol. 2022, 19, 11. [Google Scholar] [CrossRef] [PubMed]
  3. Silverman, D.T.; Samanic, C.M.; Lubin, J.H.; Blair, A.E.; Stewart, P.A.; Vermeulen, R.; Coble, J.B.; Rothman, N.; Schleiff, P.L.; Travis, W.D.; et al. The Diesel Exhaust in Miners study: A nested case-control study of lung cancer and diesel exhaust. J. Natl. Cancer Inst. 2012, 104, 855–868. [Google Scholar] [CrossRef] [PubMed]
  4. Attfield, M.D.; Schleiff, P.L.; Lubin, J.H.; Blair, A.; Stewart, P.A.; Vermeulen, R.; Coble, J.B.; Silverman, D.T. The Diesel Exhaust in Miners study: A cohort mortality study with emphasis on lung cancer. J. Natl. Cancer Inst. 2012, 104, 869–883. [Google Scholar] [CrossRef]
  5. Andersen, Z.J.; Pedersen, M.; Weinmayr, G.; Stafoggia, M.; Galassi, C.; Jørgensen, J.T.; Sommar, J.N.; Forsberg, B.; Olsson, D.; Oftedal, B.; et al. Long-term exposure to ambient air pollution and incidence of brain tumor: The European Study of Cohorts for Air Pollution Effects (ESCAPE). Neuro Oncol. 2018, 20, 420–432. [Google Scholar] [CrossRef] [Green Version]
  6. Latifovic, L.; Villeneuve, P.J.; Parent, M.-É.; Johnson, K.C.; Kachuri, L.; Canadian Cancer Registries Epidemiology Group; Harris, S.A. Bladder cancer and occupational exposure to diesel and gasoline engine emissions among Canadian men. Cancer Med. 2015, 4, 1948–1962. [Google Scholar] [CrossRef] [Green Version]
  7. Cosselman, K.E.; Krishnan, R.; Oron, A.P.; Jansen, K.; Peretz, A.; Sullivan, J.H.; Larson, T.V.; Kaufman, J.D. Blood pressure response to controlled diesel exhaust exposure in human subjects. Hypertension 2012, 59, 943–948. [Google Scholar] [CrossRef]
  8. Crüts, B.; van Etten, L.; Törnqvist, H.; Blomberg, A.; Sandström, T.; Mills, N.L.; Borm, P.J. Exposure to diesel exhaust induces changes in EEG in human volunteers. Part. Fibre Toxicol. 2008, 5, 4. [Google Scholar] [CrossRef] [Green Version]
  9. Mills, N.L.; Törnqvist, H.; Gonzalez, M.C.; Vink, E.; Robinson, S.D.; Söderberg, S.; Boon, N.A.; Donaldson, K.; Sandström, T.; Blomberg, A.; et al. Ischemic and Thrombotic Effects of Dilute Diesel-Exhaust Inhalation in Men with Coronary Heart Disease. N. Engl. J. Med. 2007, 357, 1075–1082. [Google Scholar] [CrossRef] [Green Version]
  10. Zhu, N.; Li, H.; Han, M.; Guo, L.; Chen, L.; Yun, Y.; Guo, Z.; Li, G.; Sang, N. Environmental nitrogen dioxide (NO2) exposure influences development and progression of ischemic stroke. Toxicol. Lett. 2012, 214, 120–130. [Google Scholar] [CrossRef]
  11. Balti, E.V.; Echouffo-Tcheugui, J.B.; Yako, Y.Y.; Kengne, A.P. Air pollution and risk of type 2 diabetes mellitus: A systematic review and meta-analysis. Diabetes Res. Clin. Pract. 2014, 106, 161–172. [Google Scholar] [CrossRef]
  12. Eze, I.C.; Hemkens, L.G.; Bucher, H.C.; Hoffmann, B.; Schindler, C.; Künzli, N.; Schikowski, T.; Probst-Hensch, N.M. Association between ambient air pollution and diabetes mellitus in Europe and North America: Systematic review and meta-analysis. Environ. Health Perspect. 2015, 123, 381–389. [Google Scholar] [CrossRef] [Green Version]
  13. Fleisch, A.F.; Kloog, I.; Luttmann-Gibson, H.; Gold, D.R.; Oken, E.; Schwartz, J.D. Air pollution exposure and gestational diabetes mellitus among pregnant women in Massachusetts: A cohort study. Environ. Health A Glob. Access Sci. Source 2016, 15, 40. [Google Scholar] [CrossRef] [Green Version]
  14. Evans, K.A.; Halterman, J.S.; Hopke, P.K.; Fagnano, M.; Rich, D.Q. Increased ultrafine particles and carbon monoxide concentrations are associated with asthma exacerbation among urban children. Environ. Res. 2014, 129, 11–19. [Google Scholar] [CrossRef] [Green Version]
  15. Kittelson, D.; Watts, W.; Johnson, J. Diesel Aerosol Sampling Methodology; CRC E-43 Final Report; Coordinating Research Council: Alpharetta, GA, USA, 19 August 2002. [Google Scholar]
  16. Ris, C.U.S. EPA Health Assessment for Diesel Engine Exhaust: A Review. Inhal. Toxicol. 2007, 19, 229–239. [Google Scholar] [CrossRef]
  17. Yusuf, A.A.; Yusuf, D.A.; Jie, Z.; Bello, T.Y.; Tambaya, M.; Abdullahi, B.; Muhammed-Dabo, I.A.; Yahuza, I.; Dandakouta, H. Influence of waste oil-biodiesel on toxic pollutants from marine engine coupled with emission reduction measures at various loads. Atmos. Pollut. Res. 2022, 13, 101258. [Google Scholar] [CrossRef]
  18. Fontaras, G.; Karavalakis, G.; Kousoulidou, M.; Tzamkiozis, T.; Ntziachristos, L.; Bakeas, E.; Stournas, S.; Samaras, Z. Effects of biodiesel on passenger car fuel consumption, regulated and non-regulated pollutant emissions over legislated and real-world driving cycles. Fuel 2009, 88, 1608–1617. [Google Scholar] [CrossRef]
  19. Prokopowicz, A.; Zaciera, M.; Sobczak, A.; Bielaczyc, P.; Woodburn, J. The Effects of Neat Biodiesel and Biodiesel and HVO Blends in Diesel Fuel on Exhaust Emissions from a Light Duty Vehicle with a Diesel Engine. Environ. Sci. Technol. 2015, 49, 7473–7482. [Google Scholar] [CrossRef]
  20. Graver, B.M.; Frey, H.C.; Hu, J. Effect of Biodiesel Fuels on Real-World Emissions of Passenger Locomotives. Environ. Sci. Technol. 2016, 50, 12030–12039. [Google Scholar] [CrossRef]
  21. Giakoumis, E.G.; Rakopoulos, C.D.; Dimaratos, A.M.; Rakopoulos, D.C. Exhaust emissions of diesel engines operating under transient conditions with biodiesel fuel blends. Prog. Energy Combust. Sci. 2012, 38, 691–715. [Google Scholar] [CrossRef]
  22. Mullins, B.J.; Kicic, A.; Ling, K.-M.; Mead-Hunter, R.; Larcombe, A.N. Biodiesel Exhaust–Induced Cytotoxicity and Proinflammatory Mediator Production in Human Airway Epithelial Cells. Environ. Toxicol. 2016, 31, 44–57. [Google Scholar] [CrossRef] [PubMed]
  23. Westphal, G.A.; Krahl, J.; Munack, A.; Rosenkranz, N.; Schröder, O.; Schaak, J.; Pabst, C.; Brüning, T.; Bünger, J. Combustion of Hydrotreated Vegetable Oil and Jatropha Methyl Ester in a Heavy Duty Engine: Emissions and Bacterial Mutagenicity. Environ. Sci. Technol. 2013, 47, 6038–6046. [Google Scholar] [CrossRef] [PubMed]
  24. Gioda, A.; Rodríguez-Cotto, R.I.; Amaral, B.S.; Encarnación-Medina, J.; Ortiz-Martínez, M.G.; Jiménez-Vélez, B.D. Biodiesel from Soybean Promotes Cell Proliferation in Vitro. Toxicol. Vitr. 2016, 34, 283–288. [Google Scholar] [CrossRef] [PubMed] [Green Version]
  25. Oberdörster, G.; Celein, R.M.; Ferin, J.; Weiss, B. Association of Particulate Air Pollution and Acute Mortality: Involvement of Ultrafine Particles? Inhal. Toxicol. 1995, 7, 111–124. [Google Scholar] [CrossRef] [PubMed]
  26. Breitner, S.; Liu, L.; Cyrys, J.; Brüske, I.; Franck, U.; Schlink, U.; Leitte, A.M.; Herbarth, O.; Wiedensohler, A.; Wehner, B.; et al. Sub-micrometer particulate air pollution and cardiovascular mortality in Beijing, China. Sci. Total Environ. 2011, 409, 5196–5204. [Google Scholar] [CrossRef]
  27. EIA. International Energy Statistics. Available online: https://www.eia.gov/international/overview/world (accessed on 28 October 2022).
  28. Larcombe, A.N.; Kicic, A.; Mullins, B.J.; Knothe, G. Biodiesel exhaust: The need for a systematic approach to health effects research. Respirology 2015, 20, 1034–1045. [Google Scholar] [CrossRef] [Green Version]
  29. André, V.; Barraud, C.; Capron, D.; Preterre, D.; Keravec, V.; Vendeville, C.; Cazier, F.; Pottier, D.; Morin, J.P.; Sichel, F. Comparative mutagenicity and genotoxicity of particles and aerosols emitted by the combustion of standard vs. rapeseed methyl ester supplemented bio-diesel fuels: Impact of after treatment devices: Oxidation catalyst and particulate filter. Mutat. Res./Genet. Toxicol. Environ. Mutagen. 2015, 777, 33–42. [Google Scholar] [CrossRef] [Green Version]
  30. Møller, P.; Scholten, R.H.; Roursgaard, M.; Krais, A.M. Inflammation, oxidative stress and genotoxicity responses to biodiesel emissions in cultured mammalian cells and animals. Crit. Rev. Toxicol. 2020, 50, 383–401. [Google Scholar] [CrossRef]
  31. Madden, M.C. A paler shade of green? The toxicology of biodiesel emissions: Recent findings from studies with this alternative fuel. Biochim. Biophys. Acta-Gen. Subj. 2016, 1860, 2856–2862. [Google Scholar] [CrossRef]
  32. Swanson, K.J.; Madden, M.l.C.; Ghio, A.J. Biodiesel Exhaust: The Need for Health Effects Research. Environ. Health Perspect. 2007, 115, 496–499. [Google Scholar] [CrossRef] [Green Version]
  33. Yanamala, N.; Hatfield, M.K.; Farcas, M.T.; Schwegler-Berry, D.; Hummer, J.A.; Shurin, M.R.; Birch, M.E.; Gutkin, D.W.; Kisin, E.; Kagan, V.E.; et al. Biodiesel versus diesel exposure: Enhanced pulmonary inflammation, oxidative stress, and differential morphological changes in the mouse lung. Toxicol. Appl. Pharmacol. 2013, 272, 373–383. [Google Scholar] [CrossRef] [Green Version]
  34. Chen, T.-M.; Kuschner, W.G.; Gokhale, J.; Shofer, S. Outdoor Air Pollution: Nitrogen Dioxide, Sulfur Dioxide, and Carbon Monoxide Health Effects. Am. J. Med. Sci. 2007, 333, 249–256. [Google Scholar] [CrossRef]
  35. Morin, J.-P.; Hasson, V.; Fall, M.; Papaioanou, E.; Preterre, D.; Gouriou, F.; Keravec, V.; Konstandopoulos, A.; Dionnet, F. Prevalidation of in vitro continuous flow exposure systems as alternatives to in vivo inhalation safety evaluation experimentations: Outcome from MAAPHRI-PCRD5 research program. Exp. Toxicol. Pathol. 2008, 60, 195–205. [Google Scholar] [CrossRef]
  36. Lichtveld, K.M.; Ebersviller, S.M.; Sexton, K.G.; Vizuete, W.; Jaspers, I.; Jeffries, H.E. In Vitro Exposures in Diesel Exhaust Atmospheres: Resuspension of PM from Filters versus Direct Deposition of PM from Air. Environ. Sci. Technol. 2012, 46, 9062–9070. [Google Scholar] [CrossRef]
  37. Bünger, J.; Krahl, J.; Baum, K.; Schröder, O.; Müller, M.; Westphal, G.; Ruhnau, P.; Schulz, T.G.; Hallier, E. Cytotoxic and mutagenic effects, particle size and concentration analysis of diesel engine emissions using biodiesel and petrol diesel as fuel. Arch. Toxicol. 2000, 74, 490–498. [Google Scholar] [CrossRef]
  38. Cervena, T.; Rossnerova, A.; Sikorova, J.; Beranek, V.; Vojtisek-Lom, M.; Ciganek, M.; Topinka, J.; Rossner, P. DNA Damage Potential of Engine Emissions Measured In Vitro by Micronucleus Test in Human Bronchial Epithelial Cells. Basic Clin. Pharmacol. Toxicol. 2017, 121, 102–108. [Google Scholar] [CrossRef] [Green Version]
  39. Jalava, P.I.; Aakko-Saksa, P.; Murtonen, T.; Happo, M.S.; Markkanen, A.; Yli-Pirilä, P.; Hakulinen, P.; Hillamo, R.; Mäki-Paakkanen, J.; Salonen, R.O.; et al. Toxicological properties of emission particles from heavy duty engines powered by conventional and bio-based diesel fuels and compressed natural gas. Part. Fibre Toxicol. 2012, 9, 37. [Google Scholar] [CrossRef]
  40. Brito, J.M.; Belotti, L.; Toledo, A.C.; Antonangelo, L.; Silva, F.S.; Alvim, D.S.; Andre, P.A.; Saldiva, P.H.N.; Rivero, D.H.R.F. Acute Cardiovascular and Inflammatory Toxicity Induced by Inhalation of Diesel and Biodiesel Exhaust Particles. Toxicol. Sci. 2010, 116, 67–78. [Google Scholar] [CrossRef] [Green Version]
  41. De Brito, J.M.; Mauad, T.; Cavalheiro, G.F.; Yoshizaki, K.; de André, P.A.; Lichtenfels, A.J.F.C.; Guimarães, E.T.; Rivero, D.H.R.F.; Antonangelo, L.; Oliveira, L.B.; et al. Acute exposure to diesel and sewage biodiesel exhaust causes pulmonary and systemic inflammation in mice. Sci. Total Environ. 2018, 628–629, 1223–1233. [Google Scholar] [CrossRef]
  42. Gavett, S.H.; Wood, C.E.; Williams, M.A.; Cyphert, J.M.; Boykin, E.H.; Daniels, M.J.; Copeland, L.B.; King, C.; Krantz, T.Q.; Richards, J.H.; et al. Soy biodiesel emissions have reduced inflammatory effects compared to diesel emissions in healthy and allergic mice. Inhal. Toxicol. 2015, 27, 533–544. [Google Scholar] [CrossRef]
  43. Farraj, A.K.; Haykal-Coates, N.; Winsett, D.W.; Gilmour, M.I.; King, C.; Krantz, Q.T.; Richards, J.; Hazari, M.S. Comparative electrocardiographic, autonomic and systemic inflammatory responses to soy biodiesel and petroleum diesel emissions in rats. Inhal. Toxicol. 2015, 27, 564–575. [Google Scholar] [CrossRef] [PubMed]
  44. Hazari, M.S.; Haykal-Coates, N.; Winsett, D.W.; King, C.; Krantz, Q.T.; Gilmour, M.I.; Farraj, A.K. The effects of B0, B20, and B100 soy biodiesel exhaust on aconitine-induced cardiac arrhythmia in spontaneously hypertensive rats. Inhal. Toxicol. 2015, 27, 557–563. [Google Scholar] [CrossRef] [PubMed]
  45. Bass, V.L.; Schladweiler, M.C.; Nyska, A.; Thomas, R.F.; Miller, D.B.; Krantz, T.; King, C.; Gilmour, M.I.; Ledbetter, A.D.; Richards, J.E.; et al. Comparative cardiopulmonary toxicity of exhausts from soy-based biofuels and diesel in healthy and hypertensive rats. Inhal. Toxicol. 2015, 27, 545–556. [Google Scholar] [CrossRef] [Green Version]
  46. Douki, T.; Corbière, C.; Preterre, D.; Martin, P.J.; Lecureur, V.; André, V.; Landkocz, Y.; Pottier, I.; Keravec, V.; Fardel, O.; et al. Comparative study of diesel and biodiesel exhausts on lung oxidative stress and genotoxicity in rats. Environ. Pollut. 2018, 235, 514–524. [Google Scholar] [CrossRef]
  47. Valand, R.; Magnusson, P.; Dziendzikowska, K.; Gajewska, M.; Wilczak, J.; Oczkowski, M.; Kamola, D.; Królikowski, T.; Kruszewski, M.; Lankoff, A.; et al. Gene expression changes in rat brain regions after 7- and 28 days inhalation exposure to exhaust emissions from 1st and 2nd generation biodiesel fuels—The FuelHealth project. Inhal. Toxicol. 2018, 30, 299–312. [Google Scholar] [CrossRef] [PubMed]
  48. Magnusson, P.; Dziendzikowska, K.; Oczkowski, M.; Øvrevik, J.; Eide, D.M.; Brunborg, G.; Gutzkow, K.B.; Instanes, C.; Gajewska, M.; Wilczak, J.; et al. Lung effects of 7- and 28-day inhalation exposure of rats to emissions from 1st and 2nd generation biodiesel fuels with and without particle filter—The FuelHealth project. Environ. Toxicol. Pharmacol. 2019, 67, 8–20. [Google Scholar] [CrossRef]
  49. Dziendzikowska, K.; Gajewska, M.; Wilczak, J.; Mruk, R.; Oczkowski, M.; Żyła, E.; Królikowski, T.; Stachoń, M.; Øvrevik, J.; Myhre, O.; et al. The effects of 1st and 2nd generation biodiesel exhaust exposure on hematological and biochemical blood indices of Fisher344 male rats—The FuelHealth project. Environ. Toxicol. Pharmacol. 2018, 63, 34–47. [Google Scholar] [CrossRef]
  50. Magnusson, P.; Oczkowski, M.; Øvrevik, J.; Gajewska, M.; Wilczak, J.; Biedrzycki, J.; Dziendzikowska, K.; Kamola, D.; Królikowski, T.; Kruszewski, M.; et al. No adverse lung effects of 7- and 28-day inhalation exposure of rats to emissions from petrodiesel fuel containing 20% rapeseed methyl esters (B20) with and without particulate filter—The FuelHealth project. Inhal. Toxicol. 2017, 29, 206–218. [Google Scholar] [CrossRef]
  51. EERE, Energy Efficiency & Renewable Energy, Alternate Fuels Data Centre. US Department of Energy 2020.
  52. ASTM International. ASTM D7467-20a, Standard Specification for Diesel Fuel Oil, Biodiesel Blend (B6 to B20); ASTM: West Conshohocken, PA, USA, 2020. [Google Scholar] [CrossRef]
  53. Hamje, H.D.; Hass, H.; Lonza, L.; Maas, H.; Reid, A.; Rose, K.; Venderbosch, T. EU renewable energy targets in 2020: Revised analysis of scenarios for transport fuels. Sci. Policy Rep. Jt. Res. Cent. Eur. Comm. 2014, 27. [Google Scholar] [CrossRef]
  54. Landwehr, K.R.; Hillas, J.; Mead-Hunter, R.; Brooks, P.; King, A.; O’Leary, R.A.; Kicic, A.; Mullins, B.J.; Larcombe, A.N. Fuel feedstock determines biodiesel exhaust toxicity in a human airway epithelial cell exposure model. J. Hazard. Mater. 2021, 420, 126637. [Google Scholar] [CrossRef]
  55. Hawley, B.; L’Orange, C.; Olsen, D.B.; Marchese, A.J.; Volckens, J. Oxidative stress and aromatic hydrocarbon response of human bronchial epithelial cells exposed to petro- or biodiesel exhaust treated with a diesel particulate filter. Toxicol. Sci. Off. J. Soc. Toxicol. 2014, 141, 505–514. [Google Scholar] [CrossRef] [Green Version]
  56. Ackland, M.L.; Zou, L.; Freestone, D.; Van De Waasenburg, S.; Michalczyk, A.A. Diesel exhaust particulate matter induces multinucleate cells and zinc transporter-dependent apoptosis in human airway cells. Immunol. Cell Biol. 2007, 85, 617–622. [Google Scholar] [CrossRef]
  57. Hemmingsen, J.G.; Møller, P.; Nøjgaard, J.K.; Roursgaard, M.; Loft, S. Oxidative Stress, Genotoxicity, And Vascular Cell Adhesion Molecule Expression in Cells Exposed to Particulate Matter from Combustion of Conventional Diesel and Methyl Ester Biodiesel Blends. Environ. Sci. Technol. 2011, 45, 8545–8551. [Google Scholar] [CrossRef]
  58. OECD/FAO. OECD-FAO Agricultural Outlook 2020–2029; FAO: Rome, Italy, 2020. [Google Scholar]
  59. ARENA (Australian Renewable Energy Agency), Clean Energy Finance Corporation. Biofuels and Transport: An Australian Opportunity; ARENA (Australian Renewable Energy Agency): Canberra, Australia, 2018. [Google Scholar]
  60. Landwehr, K.R.; Hillas, J.; Mead-Hunter, R.; King, A.; O’Leary, R.A.; Kicic, A.; Mullins, B.J.; Larcombe, A.N. Toxicity of different biodiesel exhausts in primary human airway epithelial cells grown at air-liquid interface. Sci. Total Environ. 2022, 832, 155016. [Google Scholar] [CrossRef]
  61. Amanatidis, S.; Ntziachristos, L.; Giechaskiel, B.; Bergmann, A.; Samaras, Z. Impact of Selective Catalytic Reduction on Exhaust Particle Formation over Excess Ammonia Events. Environ. Sci. Technol. 2014, 48, 11527–11534. [Google Scholar] [CrossRef]
  62. SafeWork Australia. Workplace Exposure Standards for Airborne Contaminants; SafeWork Australia: Canberra, Australia, 2019. [Google Scholar]
  63. European Agency for Safety and Health at Work. Workplace Exposure Standards for Airborne Contaminants. Available online: https://osha.europa.eu/en/themes/dangerous-substances/practical-tools-dangerous-substances/workplace-exposure-standards (accessed on 22 April 2021).
  64. Occupational Safety and Health Administration. Permissible Exposure Limits–Annotated Tables. Available online: https://www.osha.gov/annotated-pels/table-z-1 (accessed on 22 April 2021).
  65. SafeWork Australia. Confined spaces Code of Practice; SafeWork Australia: Canberra, Australia, 2018. [Google Scholar]
  66. European Union Directive 2004/37/EC of the European Parliament and of the Council of 29 April 2004 on the protection of workers from the risks related to exposure to carcinogens or mutagens at work. Off. J. Eur. Union. 2004, 47, 50–76.
  67. European Union Directive (EU) 2019/130 of the European Parliament and of the Council of 16 January 2019 amending Directive 2004/37/EC on the protection of workers from the risks related to exposure to carcinogens or mutagens at work (Text with EEA relevance). Off. J. Eur. Union 2019, 30, 112.
  68. Mine Safety and Health Administration. Exposure of Underground Miners to Diesel Exhaust; Mine Safety and Health Administration: Arlington, VA, USA, 2016. [Google Scholar]
  69. Australian Institute of Occupational Hygienists. Diesel Particulate Matter and Occupational Health Issues-Position Paper; Australian Institute of Occupational Hygienists: Tullamarine, Australia, 2017. [Google Scholar]
  70. Unosson, J.; Kabéle, M.; Boman, C.; Nyström, R.; Sadiktsis, I.; Westerholm, R.; Mudway, I.S.; Purdie, E.; Raftis, J.; Miller, M.R.; et al. Acute cardiovascular effects of controlled exposure to dilute Petrodiesel and biodiesel exhaust in healthy volunteers: A crossover study. Part. Fibre Toxicol. 2021, 18, 22. [Google Scholar] [CrossRef]
  71. Landwehr, K.R.; Hillas, J.; Mead-Hunter, R.; O’Leary, R.A.; Kicic, A.; Mullins, B.J.; Larcombe, A.N. Soy Biodiesel Exhaust is More Toxic than Mineral Diesel Exhaust in Primary Human Airway Epithelial Cells. Environ. Sci. Technol. 2019, 53, 11437–11446. [Google Scholar] [CrossRef]
  72. Hesterberg, T.W.; Bunn, W.B.; McClellan, R.O.; Hamade, A.K.; Long, C.M.; Valberg, P.A. Critical review of the human data on short-term nitrogen dioxide (NO2) exposures: Evidence for NO2 no-effect levels. Crit. Rev. Toxicol. 2009, 39, 743–781. [Google Scholar] [CrossRef]
  73. Larcombe, A.N.; Janka, M.A.; Mullins, B.J.; Berry, L.J.; Bredin, A.; Franklin, P.J. The effects of electronic cigarette aerosol exposure on inflammation and lung function in mice. Am. J. Physiol.-Lung Cell. Mol. Physiol. 2017, 313, L67–L79. [Google Scholar] [CrossRef] [PubMed] [Green Version]
  74. Wang, K.C.; Cras, T.D.L.; Larcombe, A.N.; Zosky, G.R.; Elliot, J.G.; James, A.L.; Noble, P.B. Independent and combined effects of airway remodelling and allergy on airway responsiveness. Clin. Sci. 2018, 132, 327–338. [Google Scholar] [CrossRef] [PubMed]
  75. Collins, R.A.; Gualano, R.C.; Zosky, G.R.; Atkins, C.L.; Turner, D.J.; Colasurdo, G.N.; Sly, P.D. Hyperresponsiveness to inhaled but not intravenous methacholine during acute respiratory syncytial virus infection in mice. Respir. Res. 2005, 6, 142. [Google Scholar] [CrossRef] [PubMed] [Green Version]
  76. Lambert, A.L.; Mangum, J.B.; DeLorme, M.P.; Everitt, J.I. Ultrafine Carbon Black Particles Enhance Respiratory Syncytial Virus-Induced Airway Reactivity, Pulmonary Inflammation, and Chemokine Expression. Toxicol. Sci. 2003, 72, 339–346. [Google Scholar] [CrossRef] [Green Version]
  77. Nemmar, A.; Al-Salam, S.; Zia, S.; Marzouqi, F.; Al-Dhaheri, A.; Subramaniyan, D.; Dhanasekaran, S.; Yasin, J.; Ali, B.H.; Kazzam, E.E. Contrasting actions of diesel exhaust particles on the pulmonary and cardiovascular systems and the effects of thymoquinone. Br. J. Pharm. 2011, 164, 1871–1882. [Google Scholar] [CrossRef] [Green Version]
  78. Brandt, E.B.; Biagini Myers, J.M.; Acciani, T.H.; Ryan, P.H.; Sivaprasad, U.; Ruff, B.; LeMasters, G.K.; Bernstein, D.I.; Lockey, J.E.; LeCras, T.D.; et al. Exposure to allergen and diesel exhaust particles potentiates secondary allergen-specific memory responses, promoting asthma susceptibility. J. Allergy Clin. Immunol. 2015, 136, 295–303.e297. [Google Scholar] [CrossRef] [Green Version]
  79. Brandt, E.B.; Kovacic, M.B.; Lee, G.B.; Gibson, A.M.; Acciani, T.H.; Le Cras, T.D.; Ryan, P.H.; Budelsky, A.L.; Khurana Hershey, G.K. Diesel exhaust particle induction of IL-17A contributes to severe asthma. J. Allergy Clin. Immunol. 2013, 132, 1194–1204.e1192. [Google Scholar] [CrossRef] [Green Version]
  80. Nordenhäll, C.; Pourazar, J.; Ledin, M.-C.; Levin, J.-O.; Sandström, T.; Ädelroth, E. Diesel exhaust enhances airway responsiveness in asthmatic subjects. Eur. Respir. J. 2001, 17, 909–915. [Google Scholar] [CrossRef] [Green Version]
  81. Carlsten, C.; MacNutt, M.J.; Zhang, Z.; Sava, F.; Pui, M.M. Anti-Oxidant N-Acetylcysteine Diminishes Diesel Exhaust-Induced Increased Airway Responsiveness in Person with Airway Hyper-Reactivity. Toxicol. Sci. 2014, 139, 479–487. [Google Scholar] [CrossRef] [Green Version]
  82. Alvarez-Simón, D.; Muñoz, X.; Gómez-Ollés, S.; de Homdedeu, M.; Untoria, M.-D.; Cruz, M.-J. Effects of diesel exhaust particle exposure on a murine model of asthma due to soybean. PLoS ONE 2017, 12, e0179569. [Google Scholar] [CrossRef] [Green Version]
  83. Khalek, I.A.; Bougher, T.L.; Merritt, P.M.; Zielinska, B. Regulated and Unregulated Emissions from Highway Heavy-Duty Diesel Engines Complying with U.S. Environmental Protection Agency 2007 Emissions Standards. J. Air Waste Manag. Assoc. 2011, 61, 427–442. [Google Scholar] [CrossRef] [Green Version]
  84. Hesterberg, T.W.; Long, C.M.; Sax, S.N.; Lapin, C.A.; McClellan, R.O.; Bunn, W.B.; Valberg, P.A. Particulate Matter in New Technology Diesel Exhaust (NTDE) is Quantitatively and Qualitatively Very Different from that Found in Traditional Diesel Exhaust (TDE). J. Air Waste Manag. Assoc. 2011, 61, 894–913. [Google Scholar] [CrossRef] [Green Version]
  85. Karavalakis, G.; Stournas, S.; Bakeas, E. Light vehicle regulated and unregulated emissions from different biodiesels. Sci. Total Environ. 2009, 407, 3338–3346. [Google Scholar] [CrossRef]
  86. Kisin, E.R.; Shi, X.C.; Keane, M.J.; Bugarski, A.B.; Shvedova, A.A. Mutagenicity of biodiesel or diesel exhaust particles and the effect of engine operating conditions. J. Environ. Eng. Ecol. Sci. 2013, 2. [Google Scholar] [CrossRef] [Green Version]
  87. Bernhard, W. Lung surfactant: Function and composition in the context of development and respiratory physiology. Ann. Anat. = Anat. Anz. Off. Organ Anat. Ges. 2016, 208, 146–150. [Google Scholar] [CrossRef]
  88. Chakraborty, M.; Kotecha, S. Pulmonary surfactant in newborn infants and children. Breathe 2013, 9, 476–488. [Google Scholar] [CrossRef] [Green Version]
  89. Boylen, C.E.; Sly, P.D.; Zosky, G.R.; Larcombe, A.N. Physiological and inflammatory responses in an anthropomorphically relevant model of acute diesel exhaust particle exposure are sex and dose-dependent. Inhal. Toxicol. 2011, 23, 906–917. [Google Scholar] [CrossRef]
  90. Dai, Y.; Ren, D.; Bassig, B.A.; Vermeulen, R.; Hu, W.; Niu, Y.; Duan, H.; Ye, M.; Meng, T.; Xu, J.; et al. Occupational exposure to diesel engine exhaust and serum cytokine levels. Environ. Mol. Mutagen. 2018, 59, 144–150. [Google Scholar] [CrossRef]
  91. Gowdy, K.M.; Krantz, Q.T.; King, C.; Boykin, E.; Jaspers, I.; Linak, W.P.; Gilmour, M.I. Role of oxidative stress on diesel-enhanced influenza infection in mice. Part. Fibre Toxicol. 2010, 7, 34. [Google Scholar] [CrossRef] [Green Version]
  92. Zarcone, M.C.; van Schadewijk, A.; Duistermaat, E.; Hiemstra, P.S.; Kooter, I.M. Diesel exhaust alters the response of cultured primary bronchial epithelial cells from patients with chronic obstructive pulmonary disease (COPD) to non-typeable Haemophilus influenzae. Respir. Res. 2017, 18, 27. [Google Scholar] [CrossRef] [PubMed] [Green Version]
  93. Shears, R.K.; Jacques, L.C.; Naylor, G.; Miyashita, L.; Khandaker, S.; Lebre, F.; Lavelle, E.C.; Grigg, J.; French, N.; Neill, D.R.; et al. Exposure to diesel exhaust particles increases susceptibility to invasive pneumococcal disease. J. Allergy Clin. Immunol. 2020, 145, 1272–1284.e1276. [Google Scholar] [CrossRef] [PubMed]
  94. Larcombe, A.N.; Foong, R.E.; Boylen, C.E.; Zosky, G.R. Acute diesel exhaust particle exposure increases viral titre and inflammation associated with existing influenza infection, but does not exacerbate deficits in lung function. Influenza Other Respir. Viruses 2012, 7, 701–709. [Google Scholar] [CrossRef] [PubMed] [Green Version]
  95. Pawlak, E.A.; Noah, T.L.; Zhou, H.; Chehrazi, C.; Robinette, C.; Diaz-Sanchez, D.; Müller, L.; Jaspers, I. Diesel exposure suppresses natural killer cell function and resolution of eosinophil inflammation: A randomized controlled trial of exposure in allergic rhinitics. Part. Fibre Toxicol. 2016, 13, 24. [Google Scholar] [CrossRef] [Green Version]
  96. Hsia, C.C.; Hyde, D.M.; Ochs, M.; Weibel, E.R. An Official Research Policy Statement of the American Thoracic Society/European Respiratory Society: Standards for Quantitative Assessment of Lung Structure. Am. J. Respir. Crit. Care Med. 2010, 181, 394–418. [Google Scholar] [CrossRef] [Green Version]
  97. Crowley, G.; Kwon, S.; Caraher, E.J.; Haider, S.H.; Lam, R.; Batra, P.; Melles, D.; Liu, M.; Nolan, A. Quantitative lung morphology: Semi-automated measurement of mean linear intercept. BMC Pulm. Med. 2019, 19, 206. [Google Scholar] [CrossRef]
  98. Mitzner, W. Use of mean airspace chord length to assess emphysema. J. Appl. Physiol. 2008, 105, 1980–1981. [Google Scholar] [CrossRef] [Green Version]
  99. Zarcone, M.C.; Duistermaat, E.; Schadewijk, A.V.; Jedynska, A.; Hiemstra, P.S.; Kooter, I.M. Cellular response of mucociliary differentiated primary bronchial epithelial cells to diesel exhaust. Am. J. Physiol.-Lung Cell. Mol. Physiol. 2016, 311, L111–L123. [Google Scholar] [CrossRef] [Green Version]
  100. Larcombe, A.N.; Phan, J.A.; Kicic, A.; Perks, K.L.; Mead-Hunter, R.; Mullins, B.J. Route of exposure alters inflammation and lung function responses to diesel exhaust. Inhal. Toxicol. 2014, 26, 409–418. [Google Scholar] [CrossRef]
  101. Larcombe, A.N.; Zosky, G.R.; Bozanich, E.M.; Turner, D.J.; Hantos, Z.; Sly, P.D. Absence of cholinergic airway tone in normal BALB/c mice. Respir. Physiol. Neurobiol. 2008, 161, 223–229. [Google Scholar] [CrossRef]
  102. Knothe, G.; de Castro, M.E.G.; Razon, L.F. Methyl Esters (Biodiesel) from and Fatty Acid Profile of Gliricidia sepium Seed Oil. J. Am. Oil Chem. Soc. 2015, 92, 769–775. [Google Scholar] [CrossRef]
  103. Landwehr, K.R.; Hillas, J.; Mead-Hunter, R.; Brooks, P.; King, A.; O’Leary, R.A.; Kicic, A.; Mullins, B.J.; Larcombe, A.N. In Vitro primary human airway epithelial whole exhaust exposure. MethodsX 2021, 8, 101561. [Google Scholar] [CrossRef]
  104. Olfert, J.S.; Symonds, J.P.R.; Collings, N. The effective density and fractal dimension of particles emitted from a light-duty diesel vehicle with a diesel oxidation catalyst. J. Aerosol Sci. 2007, 38, 69–82. [Google Scholar] [CrossRef]
  105. Larcombe, A.N.; Foong, R.E.; Berry, L.J.; Zosky, G.R.; Sly, P.D. In utero cigarette smoke exposure impairs somatic and lung growth in BALB/c mice. Eur. Respir. J. 2011, 38, 932–938. [Google Scholar] [CrossRef] [Green Version]
  106. Jánosi, T.Z.; Adamicza, Á.; Zosky, G.R.; Asztalos, T.; Sly, P.D.; Hantos, Z. Plethysmographic estimation of thoracic gas volume in apneic mice. J. Appl. Physiol. 2006, 101, 454–459. [Google Scholar] [CrossRef] [Green Version]
  107. Peták, F.; Hantos, Z.; Adamicza, Á.; Asztalos, T.; Sly, P.D. Methacholine-induced bronchoconstriction in rats: Effects of intravenous vs. aerosol delivery. J. Appl. Physiol. 1997, 82, 1479–1487. [Google Scholar] [CrossRef] [Green Version]
  108. Sly, P.D.; Collins, R.A.; Thamrin, C.; Turner, D.J.; Hantos, Z. Volume dependence of airway and tissue impedances in mice. J. Appl. Physiol. 2003, 94, 1460–1466. [Google Scholar] [CrossRef]
  109. Limjunyawong, N.; Fallica, J.; Horton, M.R.; Mitzner, W. Measurement of the Pressure-volume Curve in Mouse Lungs. JoVE 2015, 27, e52376. [Google Scholar] [CrossRef] [Green Version]
  110. Larcombe, A.N.; Foong, R.E.; Bozanich, E.M.; Berry, L.J.; Garratt, L.W.; Gualano, R.C.; Jones, J.E.; Dousha, L.F.; Zosky, G.R.; Sly, P.D. Sexual dimorphism in lung function responses to acute influenza A infection. Influenza Other Respir Viruses 2011, 5, 334–342. [Google Scholar] [CrossRef] [Green Version]
  111. Foong, R.E.; Sly, P.D.; Larcombe, A.N.; Zosky, G.R. No role for neutrophil elastase in influenza-induced cellular recruitment, cytokine production or airway hyperresponsiveness in mice. Respir. Physiol. Neurobiol. 2010, 173, 164–170. [Google Scholar] [CrossRef]
  112. Schneider, C.A.; Rasband, W.S.; Eliceiri, K.W. NIH Image to ImageJ: 25 years of image analysis. Nat. Methods 2012, 9, 671–675. [Google Scholar] [CrossRef] [PubMed]
  113. Larcombe, A.N.; Papini, M.G.; Chivers, E.K.; Berry, L.J.; Lucas, R.M.; Wyrwoll, C.S. Mouse Lung Structure and Function after Long-Term Exposure to an Atmospheric Carbon Dioxide Level Predicted by Climate Change Modeling. Environ. Health Perspect. 2021, 129, 017001. [Google Scholar] [CrossRef] [PubMed]
  114. James, A.L.; Hogg, J.C.; Dunn, L.A.; Paré, P.D. The use of the internal perimeter to compare airway size and to calculate smooth muscle shortening. Am. Rev. Respir. Dis. 1988, 138, 136–139. [Google Scholar] [CrossRef] [PubMed]
  115. R Core Team. R: A Language and Environment for Statistical Computing. R Foundation for Statistical Computing, Vienna, Austria. Available online: https://www.R-project.org/ (accessed on 28 October 2022).
  116. Oksanen, J.; Blanchet, F.G.; Friendly, M.; Kindt, R.; Legendre, P.; McGlinn, D.; Minchin, P.R.; O’Hara, R.B.; Simpson, G.L.; Solymos, P.; et al. The vegan package (versions 2.5-7). Community Ecol. Package 2020, 10, 719. [Google Scholar]
  117. Cooper, T.F.; Berkelmans, R.; Ulstrup, K.E.; Weeks, S.; Radford, B.; Jones, A.M.; Doyle, J.; Canto, M.; O’Leary, R.A.; van Oppen, M.J. Environmental factors controlling the distribution of symbiodinium harboured by the coral Acropora millepora on the Great Barrier Reef. PLoS ONE 2011, 6, e25536. [Google Scholar] [CrossRef] [Green Version]
Figure 1. Particle size spectra representative of what each group of mice were exposed to for the three measured exhausts. Data were analyzed using total particle number concentration between the size of 10 and 340 nm for each fuel. Dotted line at 23 nm represents the approximate divide between solid and liquid particle formation [61]. No significant differences in particle number were found.
Ijms 24 05130 g001
Figure 2. Mouse weights measured 24 h after the last exposure for each group (* indicates p < 0.05). n = 24 per treatment. Data were analyzed using general linear modeling methodologies.
Ijms 24 05130 g002
Figure 3. (a) Pressure–volume loops for mice exposed to Air (A), ULSD (U), Canola (C), or Tallow (T) biodiesel exhaust for 2 h/day for 8 days and volume dependence of lung function for (b) airway resistance, (c) tissue damping, and (d) tissue elastance for mice exposed to Air, ULSD, Canola, or Tallow biodiesel exhaust for 2h/day for 8 days. Data are group means. n = 23 for all groups except ULSD (n = 22) and Tallow (n = 21). Differences between groups were analyzed statistically at Prs = 20 cm H2O or a lung volume of 0.7 mL, representing the highest volume for which data were available for each individual (* = p < 0.05, ** = p < 0.01, significant * values not located next to a line indicate that the group is significantly different to all other exposures). Data were analyzed using general linear modeling methodologies.
Ijms 24 05130 g003
Figure 4. Responsiveness to methacholine for mice exposed to Air (A), ULSD (U), Canola (C), or Tallow (T) biodiesel exhaust for 2 h/day for 8 days. Data shown are (a) airway resistance, (b) tissue damping, and (c) tissue elastance for all exposure groups (n = 12, except Air and ULSD where n = 11). Bas = baseline (FRC), Sal = saline. All data are shown as % change from saline (* = p < 0.05, ** = p < 0.01, **** = p < 0.0001, significant * values not located to the right of a line indicate that the group is significantly different to all other exposures). Data were analyzed using general linear modeling methodologies.
Ijms 24 05130 g004
Figure 5. Evocative concentration showing methacholine dose needed to produce a 30% increase from saline in (a) airway resistance, (b) tissue damping, and (c) tissue elastance in mice exposed to Air, ULSD, Canola, or Tallow biodiesel exhaust for 2 hr/day for 8 days (n = 12, except Air and ULSD where n = 11) (* = p < 0.05, ** = p < 0.01, *** = p < 0.001, **** = p < 0.0001, significant * values not located next to a line indicate that the group is significantly different to all other exposures). Data were analyzed using general linear modeling methodologies.
Ijms 24 05130 g005
Figure 6. Cellular inflammation in bronchoalveolar lavage. Results are shown for (a) total cells, (b) macrophages, (c) neutrophils, and (d) lymphocytes (n = 12, except Tallow where n = 11) (* = p < 0.05, ** = p < 0.01, *** = p < 0.001, **** = p < 0.0001, significant * values not located next to a line indicate that the group is significantly different to all other exposures). Note different scales. Data were analyzed using general linear modeling methodologies.
Ijms 24 05130 g006
Figure 7. (a) Total protein concentration in the bronchoalveolar lavage and (b) total phospholipid concentration in the bronchoalveolar lavage for mice exposed to Air, ULSD, Canola, or Tallow biodiesel exhaust for 2 hr/day for 8 days. For protein, n = 12 except Tallow where n = 11. For phospholipid concentration, n = 11 except for ULSD where n = 10 (* = p < 0.05). Data were analyzed using general linear modeling methodologies. Data are individual mice with mean ± SD.
Ijms 24 05130 g007
Figure 8. Redundancy analysis model plot showing correlations between exhaust components and important toxicological endpoints. The percentages for each axis are the proportion of variability explained by that axis for the entire dataset; thus, for this model, movement along the x-axis has a greater importance than movement along the y-axis. Exhaust variables are in red, toxicological outcomes are in blue. Arrows that point in the same or opposite directions are highly correlated (positively or negatively, respectively), whereas arrows that point perpendicularly indicate little or no correlation between parameters. Note: Pn = particle number, Ps = particle size, Pm = particle mass.
Ijms 24 05130 g008
Figure 9. Exposure timeline. Each group was exposed for two hours once a day for 8 days to the same diluted exhausts or Air as a control. Measurements were taken 24 h after the last exposure.
Ijms 24 05130 g009
Figure 10. Diagram of exposure setup. As a vacuum is used to transport exhaust into the exhaust chamber and a pump is used to transport air into the Air chamber, a slight variation in pressure gradient was created to ensure there was no chance for cross-exposure of groups. Created with Biorender.com.
Ijms 24 05130 g010
Table 1. Mean (standard deviation) combustion gas concentrations and mean particle characteristics representative of what each group of mice were exposed to for the three measured exhausts. Measurements are shown as the mean concentrations for all of the exposures, with the exception of CO, which is shown as the mean peak measurement. Data in square brackets are ratios in comparison to ULSD, particle data in parentheses are percentages of the total within the fuel. Data were analyzed using general additive modeling methodologies.
ULSDCanolaTallow
O2 (%)19.45 (0.53)19.58 (0.43) *
####
19.20 (0.49) ****
####
CO (ppm)0.99 (0.76)1.87 (0.90)2.06 (1.15)
CO2 (%)0.95 (0.35)0.84 (0.27) **
####
1.11 (0.32) ****
####
NOx (ppm)33.30 (14.52)24.73 (9.35) ****
####
32.37 (13.37)
####
NO (ppm)28.23 (11.48)22.71 (8.42) ****
###
27.11 (9.95)
###
NO2 (ppm)5.07 (3.27)2.17
(1.47) ****
####
5.47
(3.87)
####
SO2 (ppm)1.64 (0.73)1.21
(0.53) ****
#
1.38
(0.72) **
#
Particle Mass Concentration (µg/m3)54.4242.58 [0.78]50.17 [0.92]
Median Particle Size (nm)182020
Total Particle Number (particles/cm3)101,78889,086 [0.88]98,418 [0.97]
Particle Number
>23 nm (particles/cm3)
39,035 (38.55%)39,141 (43.94%)41,191 (41.85%)
Particle Number
<23 nm (particles/cm3)
62,753 (61.65%)49,945 (56.06%)57,228 (58.15%)
* = Different to ULSD (* = p < 0.05, ** = p < 0.01, **** = p < 0.0001). # = Different to the other biodiesel (# = p < 0.05, ### = p < 0.001, #### = p < 0.0001).
Table 2. Mean (standard deviation) thoracic gas volume (TGV) and specific lung function at FRC for mice exposed to Air, ULSD, Canola, or Tallow biodiesel exhaust for 8 days as measured by plethysmography and the forced oscillation technique (n = 22–24 per group). As significant differences in TGV were measured between groups, FRC lung function measurements have been normalized to TGV. Data were analyzed using general linear modeling methodologies.
FRC Lung Function MeasureExposure
AirULSDCanolaTallow
TGV (mL)0.291
(0.043)
0.279
(0.042)
0.328
(0.049)
**###a
0.283
(0.035) a
sRaw, hPa·s−1108.3
(23.80)
102.6
(20.82)
120.0
(21.08)
##a
103.6
(22.32) a
sG, hPa2267
(421)
2281
(255)
2865
(398)
****####
a
2160
(322) a
sH, hPa9446
(1734)
9656
(1248)
11,362
(1716)
***##a
9217
(1835) a
η0.243
(0.020)
0.237
(0.015)
0.253
(0.024)
**####a
0.236
(0.027)
TGV = thoracic gas volume; sRaw = specific airway resistance; sG = specific tissue damping; sH = specific tissue elastance; η = hysteresivity. * = Different to Air controls (** = p < 0.01, *** = p < 0.001, **** = p < 0.0001); # = Different to ULSD (## = p < 0.01, ### = p < 0.001, #### = p < 0.0001); a = Different to other biodiesels (p < 0.05).
Table 3. Mean (standard deviation) mediator levels in bronchoalveolar lavage fluid for mice exposed to Air, ULSD, Canola, or Tallow biodiesel exhaust for 2 hr/day for 8 days (n = 12). Data were analyzed using general linear modeling methodologies.
BAL Mediator8 Days Exposure
AirULSDCanolaTallow
IL-1α (pg/mL)2.407 (0.806)2.278 (0.967)2.805 (1.097) a1.976 (0.767) a
IL-2 (pg/mL)2.835 (1.129)2.642 (1.242)3.643 (1.458) #a2.176 (0.771) a
IL-4 (pg/mL)0.338 (0.120)0.305 (0.130)0.357 (0.176) a0.220 (0.091) *a
IL-5 (pg/mL)0.900 (0.401)0.697 (0.366)0.990 (0.417)0.795 (0.615)
IL-6 (pg/mL)0.937 (0.744)1.052 (0.743)0.207 (0.070)0.811 (0.722)
IL-9 (pg/mL)3.364 (2.069)3.351 (1.958)3.795 (2.239)2.749 (1.380)
IL-10 (pg/mL)4.540 (1.297)3.036 (1.365) *4.160 (1.940) a2.890 (1.461) **a
IL-12(p40) (pg/mL)39.924 (16.53)37.253 (7.705)36.263 (8.970)43.284 (17.725)
IL-12(p70) (pg/mL)11.478 (2.881)8.457 (4.369)10.218 (4.897)7.948 (5.217)
IL-13 (pg/mL)17.758 (5.711)15.983 (6.676)21.243 (10.470)15.875 (6.435)
IL-17 (pg/mL)1.760 (0.343)1.464 (0.487)2.005 (0.864) #a1.198 (0.470) *
Eotaxin (pg/mL)5.084 (1.469)4.215 (1.585)5.359 (2.630)4.625 (1.226)
G-CSF (pg/mL)4.447 (2.192)3.342 (1.101)3.024 (0.009) *a4.707 (3.623) a
GM-CSF (pg/mL)4.494 (2.114)3.903 (2.182)4.725 (2.281)3.495 (1.313)
IFN-γ (pg/mL)3.201 (1.257)2.711 (1.083)3.152 (1.112)2.495 (1.140)
KC (pg/mL)39.244 (12.641)30.240 (7.664) *30.379 (2.714) *a41.86 (21.676) #a
MCP-1 (pg/mL)13.565 (8.868)13.646 (7.047)13.594 (8.997)14.862 (12.742)
MIP-1α (pg/mL)2.258 (0.584)1.545 (0.457)2.299 (1.297) a3.945 (3.918) *#a
MIP-1β (pg/mL)11.348 (4.568)8.628 (6.085)9.672 (6.022)8.876 (7.383)
RANTES (pg/mL)8.276 (2.247)7.515 (3.282)9.357 (3.376) a6.410 (2.617) a
TNF-α (pg/mL)8.913 (2.940)7.345 (2.861)9.451 (4.023)7.329 (1.951)
* = Different to Air controls (* = p < 0.05, ** = p < 0.01); # = Different to ULSD (# = p < 0.05); a = Different to other biodiesels (p < 0.05).
Table 4. Mean (standard deviation) measurements for airway morphology and chord length and collagen % for mice exposed to Air, ULSD, Canola, or Tallow biodiesel exhaust for 2 hr/day for 8 days (n = 10–12 for all measurements). Pbm = perimeter of the basement membrane.
MeasurementAirULSDCanolaTallow
Total Wall Thickness (√area/Pbm)0.123 (0.015)0.130 (0.013)0.128 (0.013)0.127 (0.007)
True Wall Thickness (√area/Pbm)0.060 (0.007)0.057 (0.006)0.058 (0.005)0.058 (0.008)
Airway Smooth Muscle Thickness (√area/Pbm)0.036 (0.003)0.033 (0.003)0.033 (0.003)0.035 (0.004)
Epithelial Thickness (√area/Pbm)0.040 (0.003)0.039 (0.003)0.037 (0.002)0.038 (0.003)
Chord Length (µm)21.07 (2.31)21.89 (1.54)22.42 (2.39)23.33 (1.74) *
Collagen (%)2.718 (0.534)2.604 (0.230)2.456 (0.487) a3.262 (1.197) #a
* = Different to Air controls (* = p < 0.05); # = Different to ULSD (# = p < 0.05); a = Different to other biodiesels (p < 0.05).
Disclaimer/Publisher’s Note: The statements, opinions and data contained in all publications are solely those of the individual author(s) and contributor(s) and not of MDPI and/or the editor(s). MDPI and/or the editor(s) disclaim responsibility for any injury to people or property resulting from any ideas, methods, instructions or products referred to in the content.

