
A Novel Preclinical In Vitro 3D Model of Oral Carcinogenesis for Biomarker Discovery and Drug Testing
 , , , , and
Abstract
:1. Introduction
2. Results
3. Discussion
4. Methods and Materials
4.1. Cell Culture and Reagents
4.2. Spheroid Culture and Treatment with 4NQO
4.3. Spheroid Imaging and Morphometric Analysis
4.4. Spheroid Viability
4.5. 3D Invasion Assay
4.6. RNA Extraction, RNASeq and Bioinformatics
4.7. Gene Set Enrichment Analysis for Biological Pathways
4.8. Reverse Transcription Quantitative Real-Time Polymerase Chain Reaction (RT-qPCR)
4.9. Histopathology and Immunoreactivity Assessment
4.10. Statistical Analysis
Supplementary Materials
Author Contributions
Funding
Institutional Review Board Statement
Informed Consent Statement
Data Availability Statement
Conflicts of Interest
References
- Gillison, M.L. Current topics in the epidemiology of oral cavity and oropharyngeal cancers. Head Neck 2007, 29, 779–792. [Google Scholar] [CrossRef] [PubMed]
- Sung, H.; Ferlay, J.; Siegel, R.L.; Laversanne, M.; Soerjomataram, I.; Jemal, A.; Bray, F. Global Cancer Statistics 2020: GLOBOCAN Estimates of Incidence and Mortality Worldwide for 36 Cancers in 185 Countries. CA Cancer J. Clin. 2021, 71, 209–249. [Google Scholar] [CrossRef]
- Pollaers, K.; Kujan, O.; Johnson, N.W.; Farah, C.S. Oral and oropharyngeal cancer in Oceania:Incidence, mortality, trends and gaps in public databases as presented to the Global Oral Cancer Forum. Transl. Res. Oral Oncol. 2017, 2, 2057178X17726455. [Google Scholar]
- Lin, W.-J.; Jiang, R.-S.; Wu, S.-H.; Chen, F.-J.; Liu, S.-A. Smoking, Alcohol, and Betel Quid and Oral Cancer: A Prospective Cohort Study. J. Oncol. 2011, 2011, 525976. [Google Scholar] [CrossRef] [PubMed]
- Scheer, M.; Kuebler, A.C.; Zöller, J.E. Chemoprevention of oral squamous cell carcinomas. Onkologie 2004, 27, 187–193. [Google Scholar] [CrossRef] [PubMed]
- Conley, B.A.; Ord, R.A. Current status of retinoids in chemoprevention of oral squamous cell carcinoma: An overview. J. Cranio-Maxillofac. Surg. 1996, 24, 339–345. [Google Scholar] [CrossRef] [PubMed]
- Farah, C.S. Molecular landscape of head and neck cancer and implications for therapy. Ann. Transl. Med. 2021, 9, 915. [Google Scholar] [CrossRef]
- Liu, L.; Chen, J.; Cai, X.; Yao, Z.; Huang, J. Progress in targeted therapeutic drugs for oral squamous cell carcinoma. Surg. Oncol. 2019, 31, 90–97. [Google Scholar] [CrossRef]
- Dong, Y.; Zhao, Q.; Ma, X.; Ma, G.; Liu, C.; Chen, Z.; Yu, L.; Liu, X.; Zhang, Y.; Shao, S.; et al. Establishment of a new OSCC cell line derived from OLK and identification of malignant transformation-related proteins by differential proteomics approach. Sci. Rep. 2015, 5, 12668. [Google Scholar] [CrossRef] [Green Version]
- Białkowska, K.; Komorowski, P.; Bryszewska, M.; Miłowska, K. Spheroids as a Type of Three-Dimensional Cell Cultures-Examples of Methods of Preparation and the Most Important Application. Int. J. Mol. Sci. 2020, 21, 6225. [Google Scholar] [CrossRef]
- Chitturi Suryaprakash, R.T.; Kujan, O.; Shearston, K.; Farah, C.S. Three-Dimensional Cell Culture Models to Investigate Oral Carcinogenesis: A Scoping Review. Int. J. Mol. Sci. 2020, 21, 9520. [Google Scholar] [CrossRef] [PubMed]
- Hawkins, B.L.; Heniford, B.W.; Ackermann, D.M.; Leonberger, M.; Martinez, S.A.; Hendler, F.J. 4NQO carcinogenesis: A mouse model of oral cavity squamous cell carcinoma. Head Neck 1994, 16, 424–432. [Google Scholar] [CrossRef] [PubMed]
- Gimenez-Conti, I.B.; Slaga, T.J. The hamster cheek pouch carcinogenesis model. J. Cell. Biochem. 1993, 53, 83–90. [Google Scholar] [CrossRef] [PubMed]
- Hartung, T. Thoughts on limitations of animal models. Park. Relat. Disord. 2008, 14, S81–S83. [Google Scholar] [CrossRef] [PubMed]
- Mak, I.W.; Evaniew, N.; Ghert, M. Lost in translation: Animal models and clinical trials in cancer treatment. Am. J. Transl. Res. 2014, 6, 114–118. [Google Scholar] [PubMed]
- Qin, D. Next-generation sequencing and its clinical application. Cancer Biol. Med. 2019, 16, 4–10. [Google Scholar]
- Teng, H.; Mao, F.; Liang, J.; Xue, M.; Wei, W.; Li, X.; Zhang, K.; Feng, D.; Liu, B.; Sun, Z. Transcriptomic signature associated with carcinogenesis and aggressiveness of papillary thyroid carcinoma. Theranostics 2018, 8, 4345–4358. [Google Scholar] [CrossRef]
- Li, J.; Wang, R.; Zhou, X.; Wang, W.; Gao, S.; Mao, Y.; Wu, X.; Guo, L.; Liu, H.; Wen, L.; et al. Genomic and transcriptomic profiling of carcinogenesis in patients with familial adenomatous polyposis. Gut 2020, 69, 1283–1293. [Google Scholar] [CrossRef] [Green Version]
- Pepe, M.; Lamort, A.; Stathopoulos, G. Transcriptome signatures of tobacco carcinogens hint the alteration of TAF6 as a specific feature in smokers lung cancer. ERJ Open Res. 2020, 6 (Suppl. S5), 24. [Google Scholar]
- Sagheer, S.H.; Whitaker-Menezes, D.; Han, J.Y.S.; Curry, J.M.; Martinez-Outschoorn, U.; Philp, N.J.; Galluzzi, L.; Buqué, A. Chapter 6—4NQO induced carcinogenesis: A mouse model for oral squamous cell carcinoma. In Methods in Cell Biology; Academic Press: Cambridge, MA, USA, 2021; Volume 163, pp. 93–111. [Google Scholar]
- George, A.; Ranganathan, K.; Rao, U.K. Expression of MMP-1 in histopathological different grades of oral squamous cell carcinoma and in normal buccal mucosa—An immunohistochemical study. Cancer Biomark 2010, 7, 275–283. [Google Scholar] [CrossRef]
- Stott-Miller, M.; Houck, J.R.; Lohavanichbutr, P.; Méndez, E.; Upton, M.P.; Futran, N.D.; Schwartz, S.M.; Chen, C. Tumor and Salivary Matrix Metalloproteinase Levels Are Strong Diagnostic Markers of Oral Squamous Cell Carcinoma. Cancer Epidemiol. Biomark. Prev. 2011, 20, 2628. [Google Scholar] [CrossRef] [PubMed] [Green Version]
- Nanda, D.P.; Dutta, K.; Ganguly, K.K.; Hajra, S.; Mandal, S.S.; Biswas, J.; Sinha, D. MMP-9 as a potential biomarker for carcinoma of oral cavity: A study in eastern India. Neoplasma 2014, 61, 747–757. [Google Scholar] [CrossRef] [PubMed] [Green Version]
- Shin, Y.-J.; Vu, H.; Lee, J.-H.; Kim, H.-D. Diagnostic and prognostic ability of salivary MMP-9 for oral squamous cell carcinoma: A pre-/post-surgery case and matched control study. PloS ONE 2021, 16, e0248167. [Google Scholar] [CrossRef] [PubMed]
- Kaminagakura, E.; Caris, A.; Coutinho-Camillo, C.; Soares, F.A.; Takahama-Júnior, A.; Kowalski, L.P. Protein expression of CYP1A1, CYP1B1, ALDH1A1, and ALDH2 in young patients with oral squamous cell carcinoma. Int. J. Oral Maxillofac. Surg. 2016, 45, 706–712. [Google Scholar] [CrossRef] [Green Version]
- Liberti, M.V.; Locasale, J.W. The Warburg Effect: How Does it Benefit Cancer Cells? Trends Biochem. Sci. 2016, 41, 211–218. [Google Scholar] [CrossRef] [Green Version]
- Leclerc, D.; Pham, D.N.T.; Lévesque, N.; Truongcao, M.; Foulkes, W.D.; Sapienza, C.; Rozen, R. Oncogenic role of PDK4 in human colon cancer cells. Br. J. Cancer 2017, 116, 930–936. [Google Scholar] [CrossRef]
- Atas, E.; Oberhuber, M.; Kenner, L. The Implications of PDK1–4 on Tumor Energy Metabolism, Aggressiveness and Therapy Resistance. Front. Oncol. 2020, 10, 2835. [Google Scholar] [CrossRef]
- Woolbright, B.L.; Choudhary, D.; Mikhalyuk, A.; Trammel, C.; Shanmugam, S.; Abbott, E.; Pilbeam, C.C.; Taylor, J.A., III. The Role of Pyruvate Dehydrogenase Kinase-4 (PDK4) in Bladder Cancer and Chemoresistance. Mol. Cancer Ther. 2018, 17, 2004–2012. [Google Scholar] [CrossRef] [Green Version]
- Nakazato, K.; Mogushi, K.; Kayamori, K.; Tsuchiya, M.; Takahashi, K.-I.; Sumino, J.; Michi, Y.; Yoda, T.; Uzawa, N. Glucose metabolism changes during the development and progression of oral tongue squamous cell carcinomas. Oncol. Lett. 2019, 18, 1372–1380. [Google Scholar] [CrossRef] [Green Version]
- Sur, S.; Nakanishi, H.; Flaveny, C.; Ippolito, J.E.; McHowat, J.; Ford, D.A.; Ray, R.B. Inhibition of the key metabolic pathways, glycolysis and lipogenesis, of oral cancer by bitter melon extract. Cell Commun. Signal. 2019, 17, 131. [Google Scholar] [CrossRef] [Green Version]
- Hanahan, D.; Weinberg Robert, A. Hallmarks of Cancer: The Next Generation. Cell 2011, 144, 646–674. [Google Scholar] [CrossRef] [Green Version]
- Olsson, M.; Zhivotovsky, B. Caspases and cancer. Cell Death Differ. 2011, 18, 1441–1449. [Google Scholar] [CrossRef] [Green Version]
- Mikeska, T.; Essakali, S.; Hewitt, C.A.; Carney, D.A.; Westerman, D.; Seymour, J.F.; Dobrovic, A. 1.30 Caspase 10 is Down-Regulated in Chronic Lymphocytic Leukemia. Clin. Lymphoma Myeloma Leuk. 2011, 11, S159. [Google Scholar] [CrossRef]
- Campbell, J.D.; Yau, C.; Bowlby, R.; Liu, Y.; Brennan, K.; Fan, H.; Taylor, A.M.; Wang, C.; Walter, V.; Akbani, R.; et al. Genomic, Pathway Network, and Immunologic Features Distinguishing Squamous Carcinomas. Cell Rep. 2018, 23, 194–212.e196. [Google Scholar] [CrossRef] [PubMed] [Green Version]
- Sathasivam, H.P.; Casement, J.; Bates, T.; Sloan, P.; Thomson, P.; Robinson, M.; Kist, R. Gene expression changes associated with malignant transformation of oral potentially malignant disorders. J. Oral Pathol. Med. 2021, 50, 60–67. [Google Scholar] [CrossRef] [PubMed]
- Huang, C.-C.; Cheng, S.-H.; Wu, C.-H.; Li, W.-Y.; Wang, J.-S.; Kung, M.-L.; Chu, T.-H.; Huang, S.-T.; Feng, C.-T.; Huang, S.-C.; et al. Delta-like 1 homologue promotes tumorigenesis and epithelial-mesenchymal transition of ovarian high-grade serous carcinoma through activation of Notch signaling. Oncogene 2019, 38, 3201–3215. [Google Scholar] [CrossRef]
- Li, L.; Tan, J.; Zhang, Y.; Han, N.; Di, X.; Xiao, T.; Cheng, S.; Gao, Y.; Liu, Y. DLK1 promotes lung cancer cell invasion through upregulation of MMP9 expression depending on Notch signaling. PloS ONE 2014, 9, e91509. [Google Scholar] [CrossRef] [Green Version]
- Martins, F.; de Sousa, S.C.; Dos Santos, E.; Woo, S.B.; Gallottini, M. PI3K-AKT-mTOR pathway proteins are differently expressed in oral carcinogenesis. J. Oral. Pathol. Med. 2016, 45, 746–752. [Google Scholar] [CrossRef]
- Harsha, C.; Banik, K.; Ang, H.L.; Girisa, S.; Vikkurthi, R.; Parama, D.; Rana, V.; Shabnam, B.; Khatoon, E.; Kumar, A.P.; et al. Targeting AKT/mTOR in Oral Cancer: Mechanisms and Advances in Clinical Trials. Int. J. Mol. Sci. 2020, 21, 3285. [Google Scholar] [CrossRef]
- Murugan, A.K.; Munirajan, A.K.; Tsuchida, N. Ras oncogenes in oral cancer: The past 20 years. Oral. Oncol. 2012, 48, 383–392. [Google Scholar] [CrossRef]
- Johnstone, S.; Logan, R.M. The role of vascular endothelial growth factor (VEGF) in oral dysplasia and oral squamous cell carcinoma. Oral. Oncol. 2006, 42, 337–342. [Google Scholar] [CrossRef] [PubMed]
- Shibuya, M. Vascular Endothelial Growth Factor (VEGF) and Its Receptor (VEGFR) Signaling in Angiogenesis: A Crucial Target for Anti- and Pro-Angiogenic Therapies. Genes Cancer 2011, 2, 1097–1105. [Google Scholar] [CrossRef] [PubMed]
- Kordbacheh, F.; Farah, C.S. Molecular Pathways and Druggable Targets in Head and Neck Squamous Cell Carcinoma. Cancers 2021, 13, 3453. [Google Scholar] [CrossRef] [PubMed]
- Vestweber, D. VE-cadherin: The major endothelial adhesion molecule controlling cellular junctions and blood vessel formation. Arter. Thromb. Vasc. Biol. 2008, 28, 223–232. [Google Scholar] [CrossRef] [PubMed] [Green Version]
- Tocci, P.; Blandino, G.; Bagnato, A. YAP and endothelin-1 signaling: An emerging alliance in cancer. J. Exp. Clin. Cancer Res. 2021, 40, 27. [Google Scholar] [CrossRef] [PubMed]
- Elaimy, A.L.; Mercurio, A.M. Convergence of VEGF and YAP/TAZ signaling: Implications for angiogenesis and cancer biology. Sci. Signal. 2018, 11, eaau1165. [Google Scholar] [CrossRef] [PubMed] [Green Version]
- Kujan, O.; Shearston, K.; Farah, C.S. The role of hypoxia in oral cancer and potentially malignant disorders: A review. J. Oral. Pathol. Med. 2017, 46, 246–252. [Google Scholar] [CrossRef]
- Liu, Z.; Zheng, Z.; Dong, L.; Guo, X.; Jia, X.; Wang, J.; Meng, L.; Cui, X.; Jiang, X. Efficacy and safety of apatinib in patients with recurrent or metastatic head and neck squamous cell carcinoma: A retrospective multi-center study. Sci. Rep. 2022, 12, 18327. [Google Scholar] [CrossRef]
- Kordbacheh, F.; Farah, C.S. Current and Emerging Molecular Therapies for Head and Neck Squamous Cell Carcinoma. Cancers 2021, 13, 5471. [Google Scholar] [CrossRef]
- Drabkin, H.A. Pazopanib and anti-VEGF therapy. Open Access J. Urol. 2010, 2, 35–40. [Google Scholar] [CrossRef] [Green Version]
- Yamamoto, Y.; Matsui, J.; Matsushima, T.; Obaishi, H.; Miyazaki, K.; Nakamura, K.; Tohyama, O.; Semba, T.; Yamaguchi, A.; Hoshi, S.S.; et al. Lenvatinib, an angiogenesis inhibitor targeting VEGFR/FGFR, shows broad antitumor activity in human tumor xenograft models associated with microvessel density and pericyte coverage. Vasc. Cell 2014, 6, 18. [Google Scholar] [CrossRef] [PubMed] [Green Version]
- Verheijen, R.B.; Beijnen, J.H.; Schellens, J.H.M.; Huitema, A.D.R.; Steeghs, N. Clinical Pharmacokinetics and Pharmacodynamics of Pazopanib: Towards Optimized Dosing. Clin. Pharmacokinet. 2017, 56, 987–997. [Google Scholar] [CrossRef] [PubMed] [Green Version]
- Australian Public Assessment Report for Lenvatinib Mesilate. Available online: https://www.google.com/url?sa=t&rct=j&q=&esrc=s&source=web&cd=&ved=2ahUKEwjT_-vwnIfyAhUA4zgGHTWWDfYQFjAAegQIBBAD&url=https%3A%2F%2Fwww.tga.gov.au%2Fsites%2Fdefault%2Ffiles%2Fauspar-lenvatinib-mesilate-160830.docx&usg=AOvVaw3Z2p1uNh2IM-ZmFwd2aaTb (accessed on 12 November 2022).
- Boettcher, M.; McManus, M.T. Choosing the Right Tool for the Job: RNAi, TALEN, or CRISPR. Mol. Cell 2015, 58, 575–585. [Google Scholar] [CrossRef] [PubMed] [Green Version]
- Friedrich, J.; Eder, W.; Castaneda, J.; Doss, M.; Huber, E.; Ebner, R.; Kunz-Schughart, L.A. A reliable tool to determine cell viability in complex 3-d culture: The acid phosphatase assay. J. Biomol. Screen 2007, 12, 925–937. [Google Scholar] [CrossRef] [PubMed] [Green Version]
- Vinci, M.; Box, C.; Eccles, S.A. Three-dimensional (3D) tumor spheroid invasion assay. J. Vis. Exp. JoVE 2015, 99, e52686. [Google Scholar]
- Li, H.; Durbin, R. Fast and accurate short read alignment with Burrows-Wheeler transform. Bioinformatics 2009, 25, 1754–1760. [Google Scholar] [CrossRef] [Green Version]
- Love, M.I.; Huber, W.; Anders, S. Moderated estimation of fold change and dispersion for RNA-seq data with DESeq2. Genome Biol. 2014, 15, 550. [Google Scholar] [CrossRef] [Green Version]
- Kuleshov, M.V.; Jones, M.R.; Rouillard, A.D.; Fernandez, N.F.; Duan, Q.; Wang, Z.; Koplev, S.; Jenkins, S.L.; Jagodnik, K.M.; Lachmann, A.; et al. Enrichr: A comprehensive gene set enrichment analysis web server 2016 update. Nucleic Acids Res. 2016, 44, W90–W97. [Google Scholar] [CrossRef] [Green Version]
- Martens, M.; Ammar, A.; Riutta, A.; Waagmeester, A.; Slenter Denise, N.; Hanspers, K.; AMiller, R.; Digles, D.; Lopes Elisson, N.; Ehrhart, F.; et al. WikiPathways: Connecting communities. Nucleic Acids Res. 2021, 49, D613–D621. [Google Scholar] [CrossRef]
- Liberzon, A.; Birger, C.; Thorvaldsdóttir, H.; Ghandi, M.; Mesirov, J.P.; Tamayo, P. The Molecular Signatures Database Hallmark Gene Set Collection. Cell Syst. 2015, 1, 417–425. [Google Scholar] [CrossRef] [Green Version]
- Kanehisa, M.; Goto, S. KEGG: Kyoto encyclopedia of genes and genomes. Nucleic Acids Res. 2000, 28, 27–30. [Google Scholar] [CrossRef] [PubMed]
- Kujan, O.; Oliver, R.J.; Khattab, A.; Roberts, S.A.; Thakker, N.; Sloan, P. Evaluation of a new binary system of grading oral epithelial dysplasia for prediction of malignant transformation. Oral. Oncol. 2006, 42, 987–993. [Google Scholar] [CrossRef] [PubMed]
- Kujan, O.; Agag, M.; Smaga, M.; Vaishnaw, Y.; Idrees, M.; Shearston, K.; Farah, C.S. PD-1/PD-L1, Treg-related proteins, and tumour-infiltrating lymphocytes are associated with the development of oral squamous cell carcinoma. Pathology 2022, 54, 409–416. [Google Scholar] [CrossRef] [PubMed]
- Schober, P.; Boer, C.; Schwarte, L.A. Correlation Coefficients: Appropriate Use and Interpretation. Anesth. Analg. 2018, 126, 1763–1768. [Google Scholar] [CrossRef] [PubMed]


| HOK Spheroids | DOK Spheroids | |||
|---|---|---|---|---|
| Length (µm) | Area (µm2) | Length (µm) | Area (µm2) | |
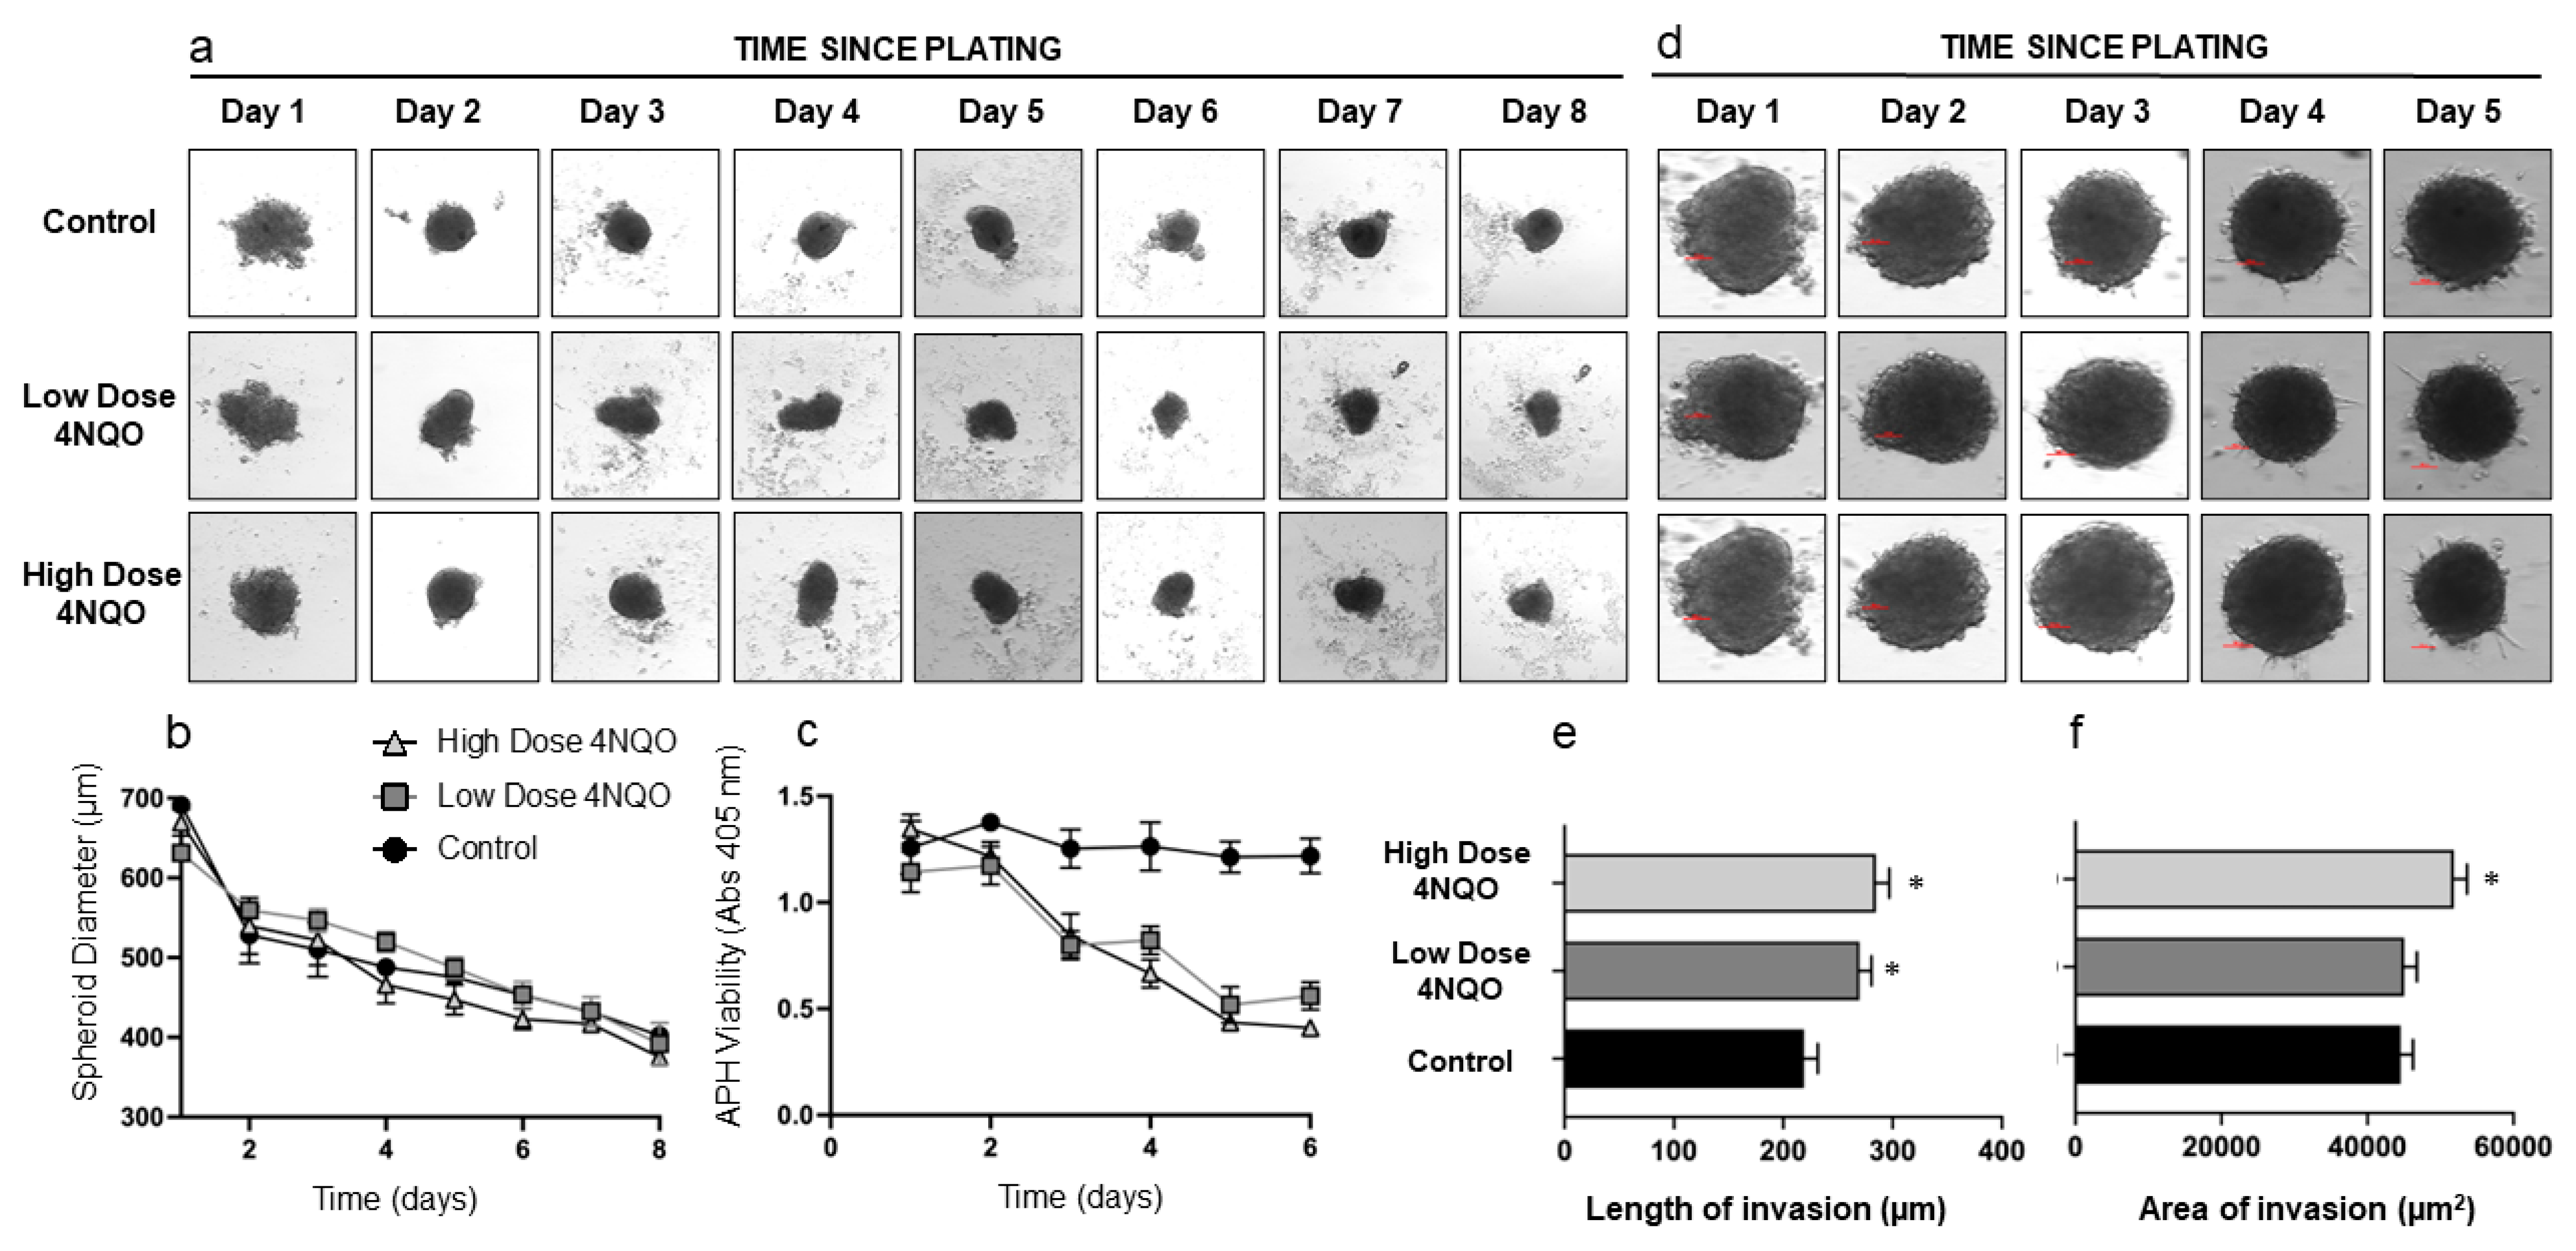
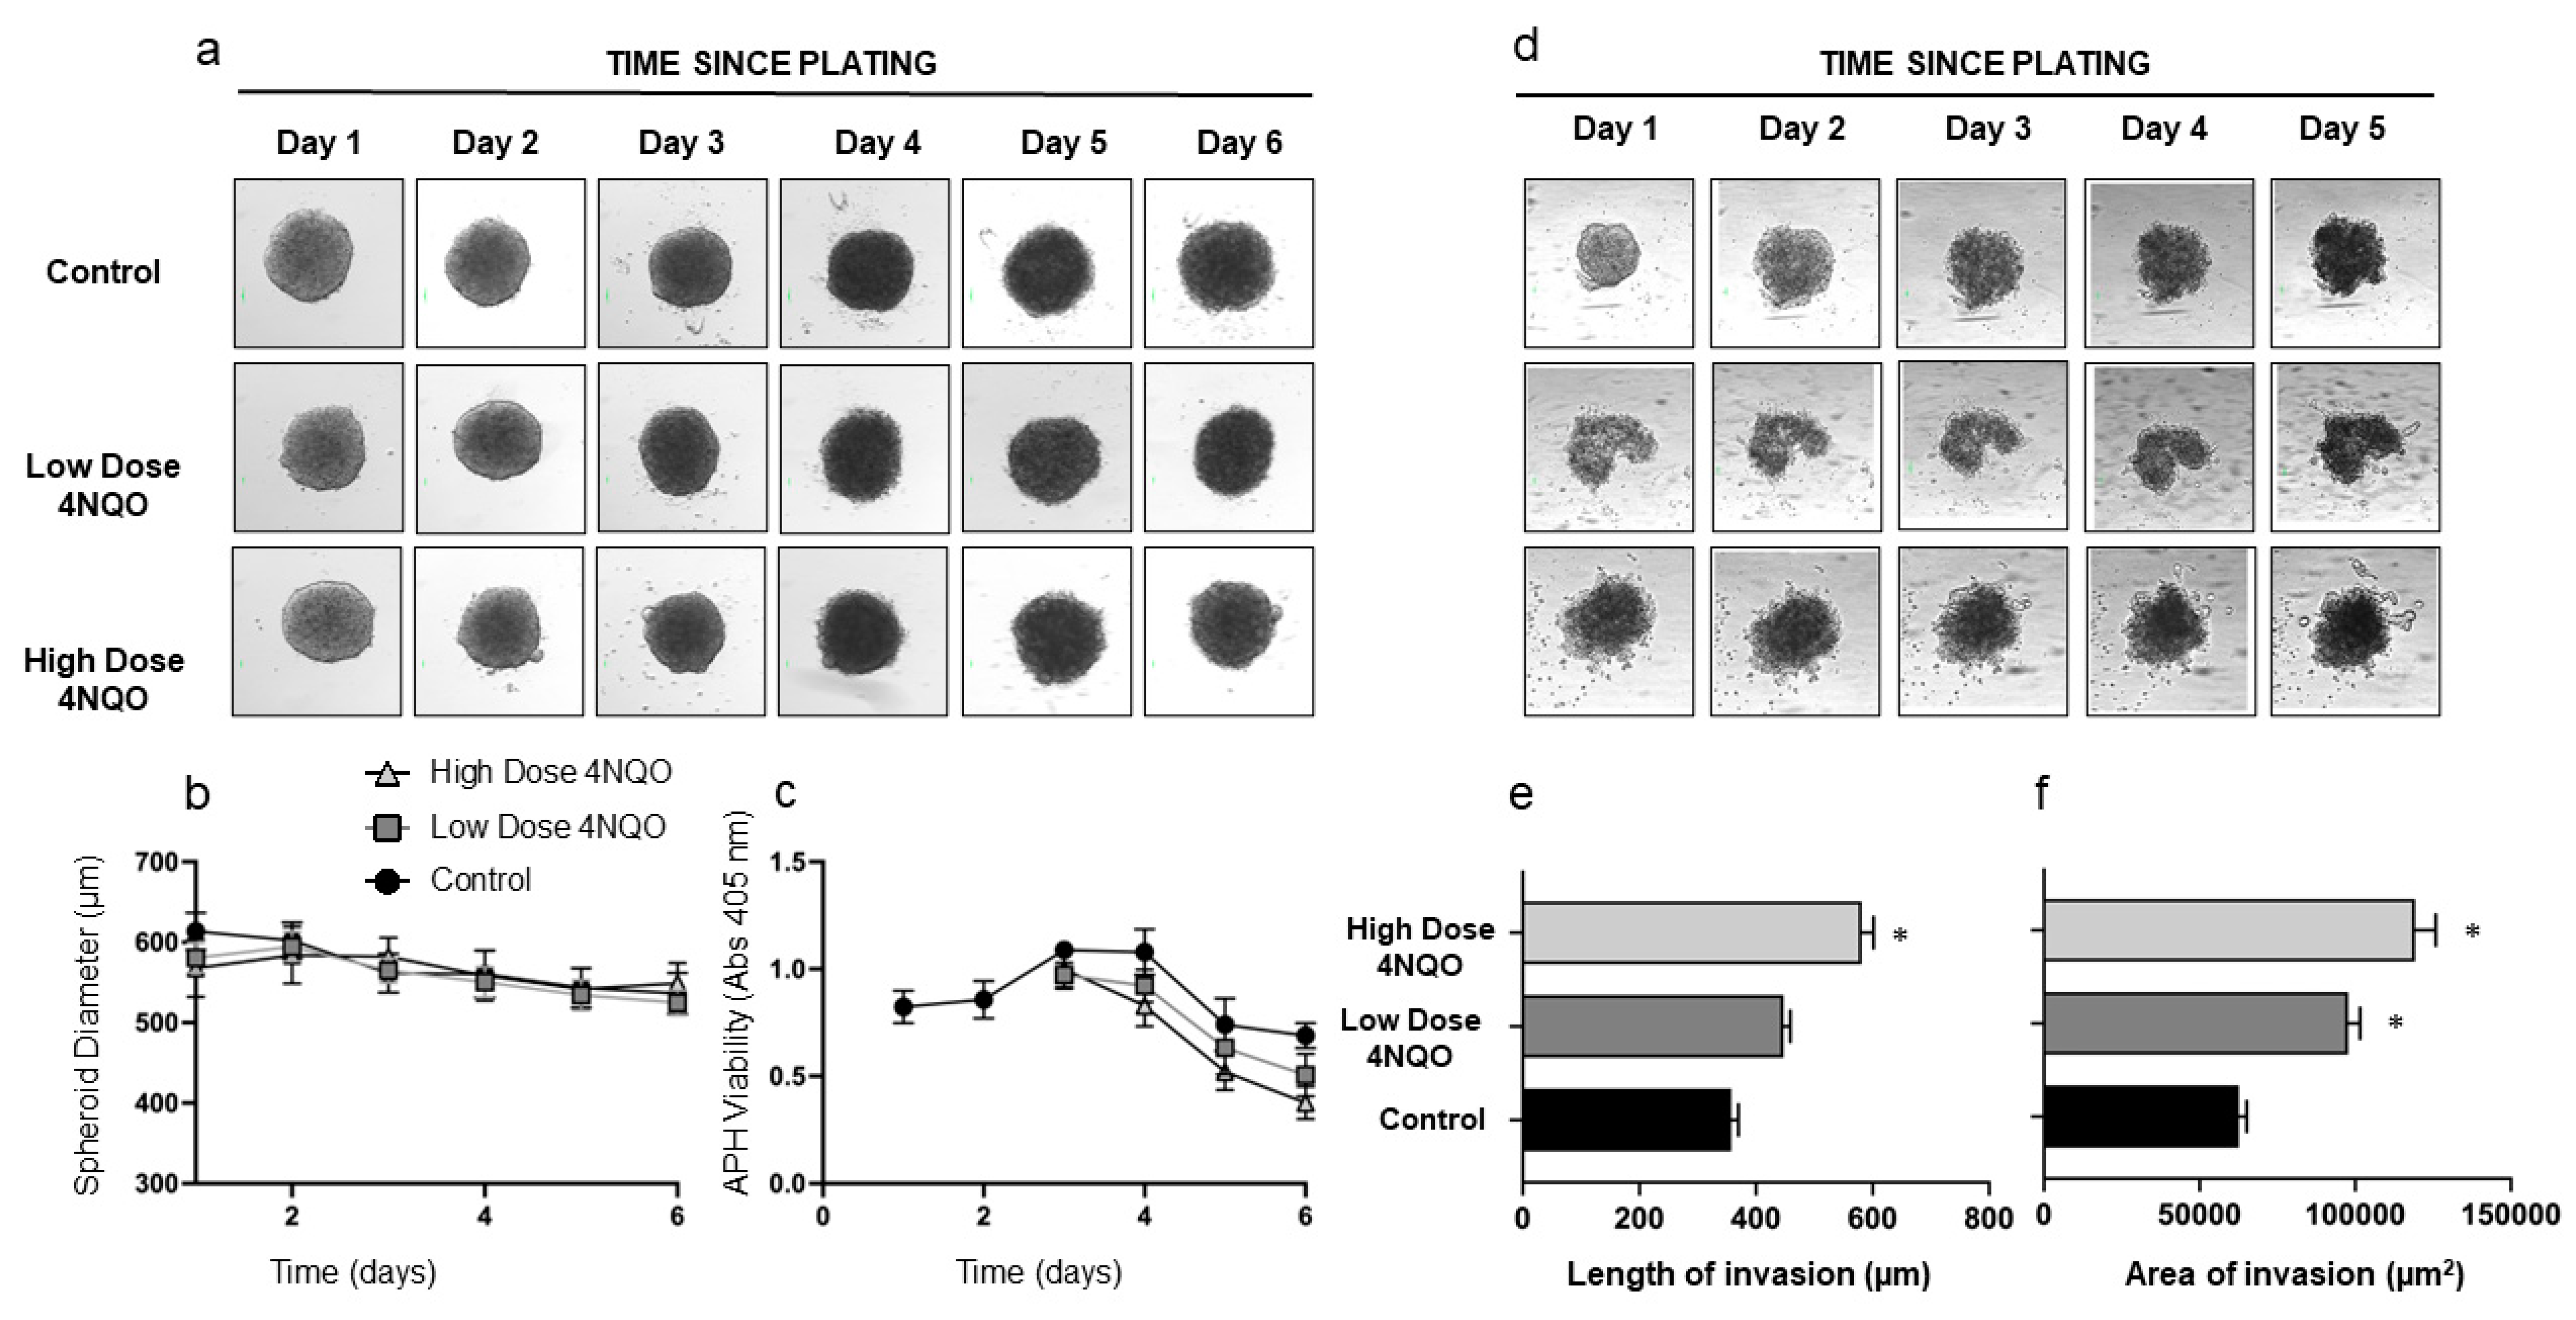
| Control | 247.0 ± 32.1 | 46,705.18 ± 1389.4 | 361.5 ± 87.6 | 62,749.8 ± 5463.1 |
| Low-dose-treated | 285.8 ± 30.1 * | 48,452.4 ± 1063.7 | 429.3 ± 54.4 | 101,822.2 ± 1842.1 * |
| High-dose-treated | 296.7 ± 62.1 * | 52,050.5 ± 1031.2 * | 563.3 ± 42.5 * | 119,331.0 ± 14,618.3 * |
| S No. | Pathways | Regulation | p-Value | |
|---|---|---|---|---|
| HOK Spheroids | 1 | Robo4 and VEGF signaling pathways crosstalk | Upregulated | 0.004492 |
| 2 | VEGFA-VEGFR2 Signaling Pathway | Upregulated | 0.01316 | |
| 3 | Angiogenesis | Upregulated | 0.01786 | |
| 4 | Canonical and non-canonical Notch signaling | Upregulated | 0.02007 | |
| 5 | Epithelial-to-mesenchymal transition in cancer | Upregulated | 0.1129 | |
| 6 | Ras Signaling | Upregulated | 0.1295 | |
| 7 | Focal adhesion | Upregulated | 0.1393 | |
| 8 | Xenobiotic metabolism | Upregulated | 0.14 | |
| 9 | Focal adhesion-PI3K-Akt-mTOR-signaling pathway | Upregulated | 0.2047 | |
| 10 | PI3K-Akt Signaling Pathway | Upregulated | 0.2269 | |
| DOK Spheroids | 11 | KRAS Signaling | Upregulated | 0.00001215 |
| 12 | Pathways in cancer | Upregulated | 0.0000309 | |
| 13 | Neovascularisation processes | Upregulated | 0.0001093 | |
| 14 | Matrix metalloproteinases | Upregulated | 0.0002256 | |
| 15 | Robo4 and VEGF signaling pathways crosstalk | Upregulated | 0.004492 | |
| 16 | Coagulation | Upregulated | 0.004679 | |
| 17 | Benzo(a)pyrene metabolism | Upregulated | 0.006731 | |
| 18 | PI3K/AKT/mTOR signaling | Upregulated | 0.07595 | |
| 19 | Fatty acid metabolism | Upregulated | 0.1122 | |
| 20 | Apoptosis modulation and signaling | Downregulated | 0.000001837 |
| Transformed HOK Spheroids | Transformed DOK Spheroids | |||
|---|---|---|---|---|
| Length (µm) | Area (µm2) | Length (µm) | Area (µm2) | |
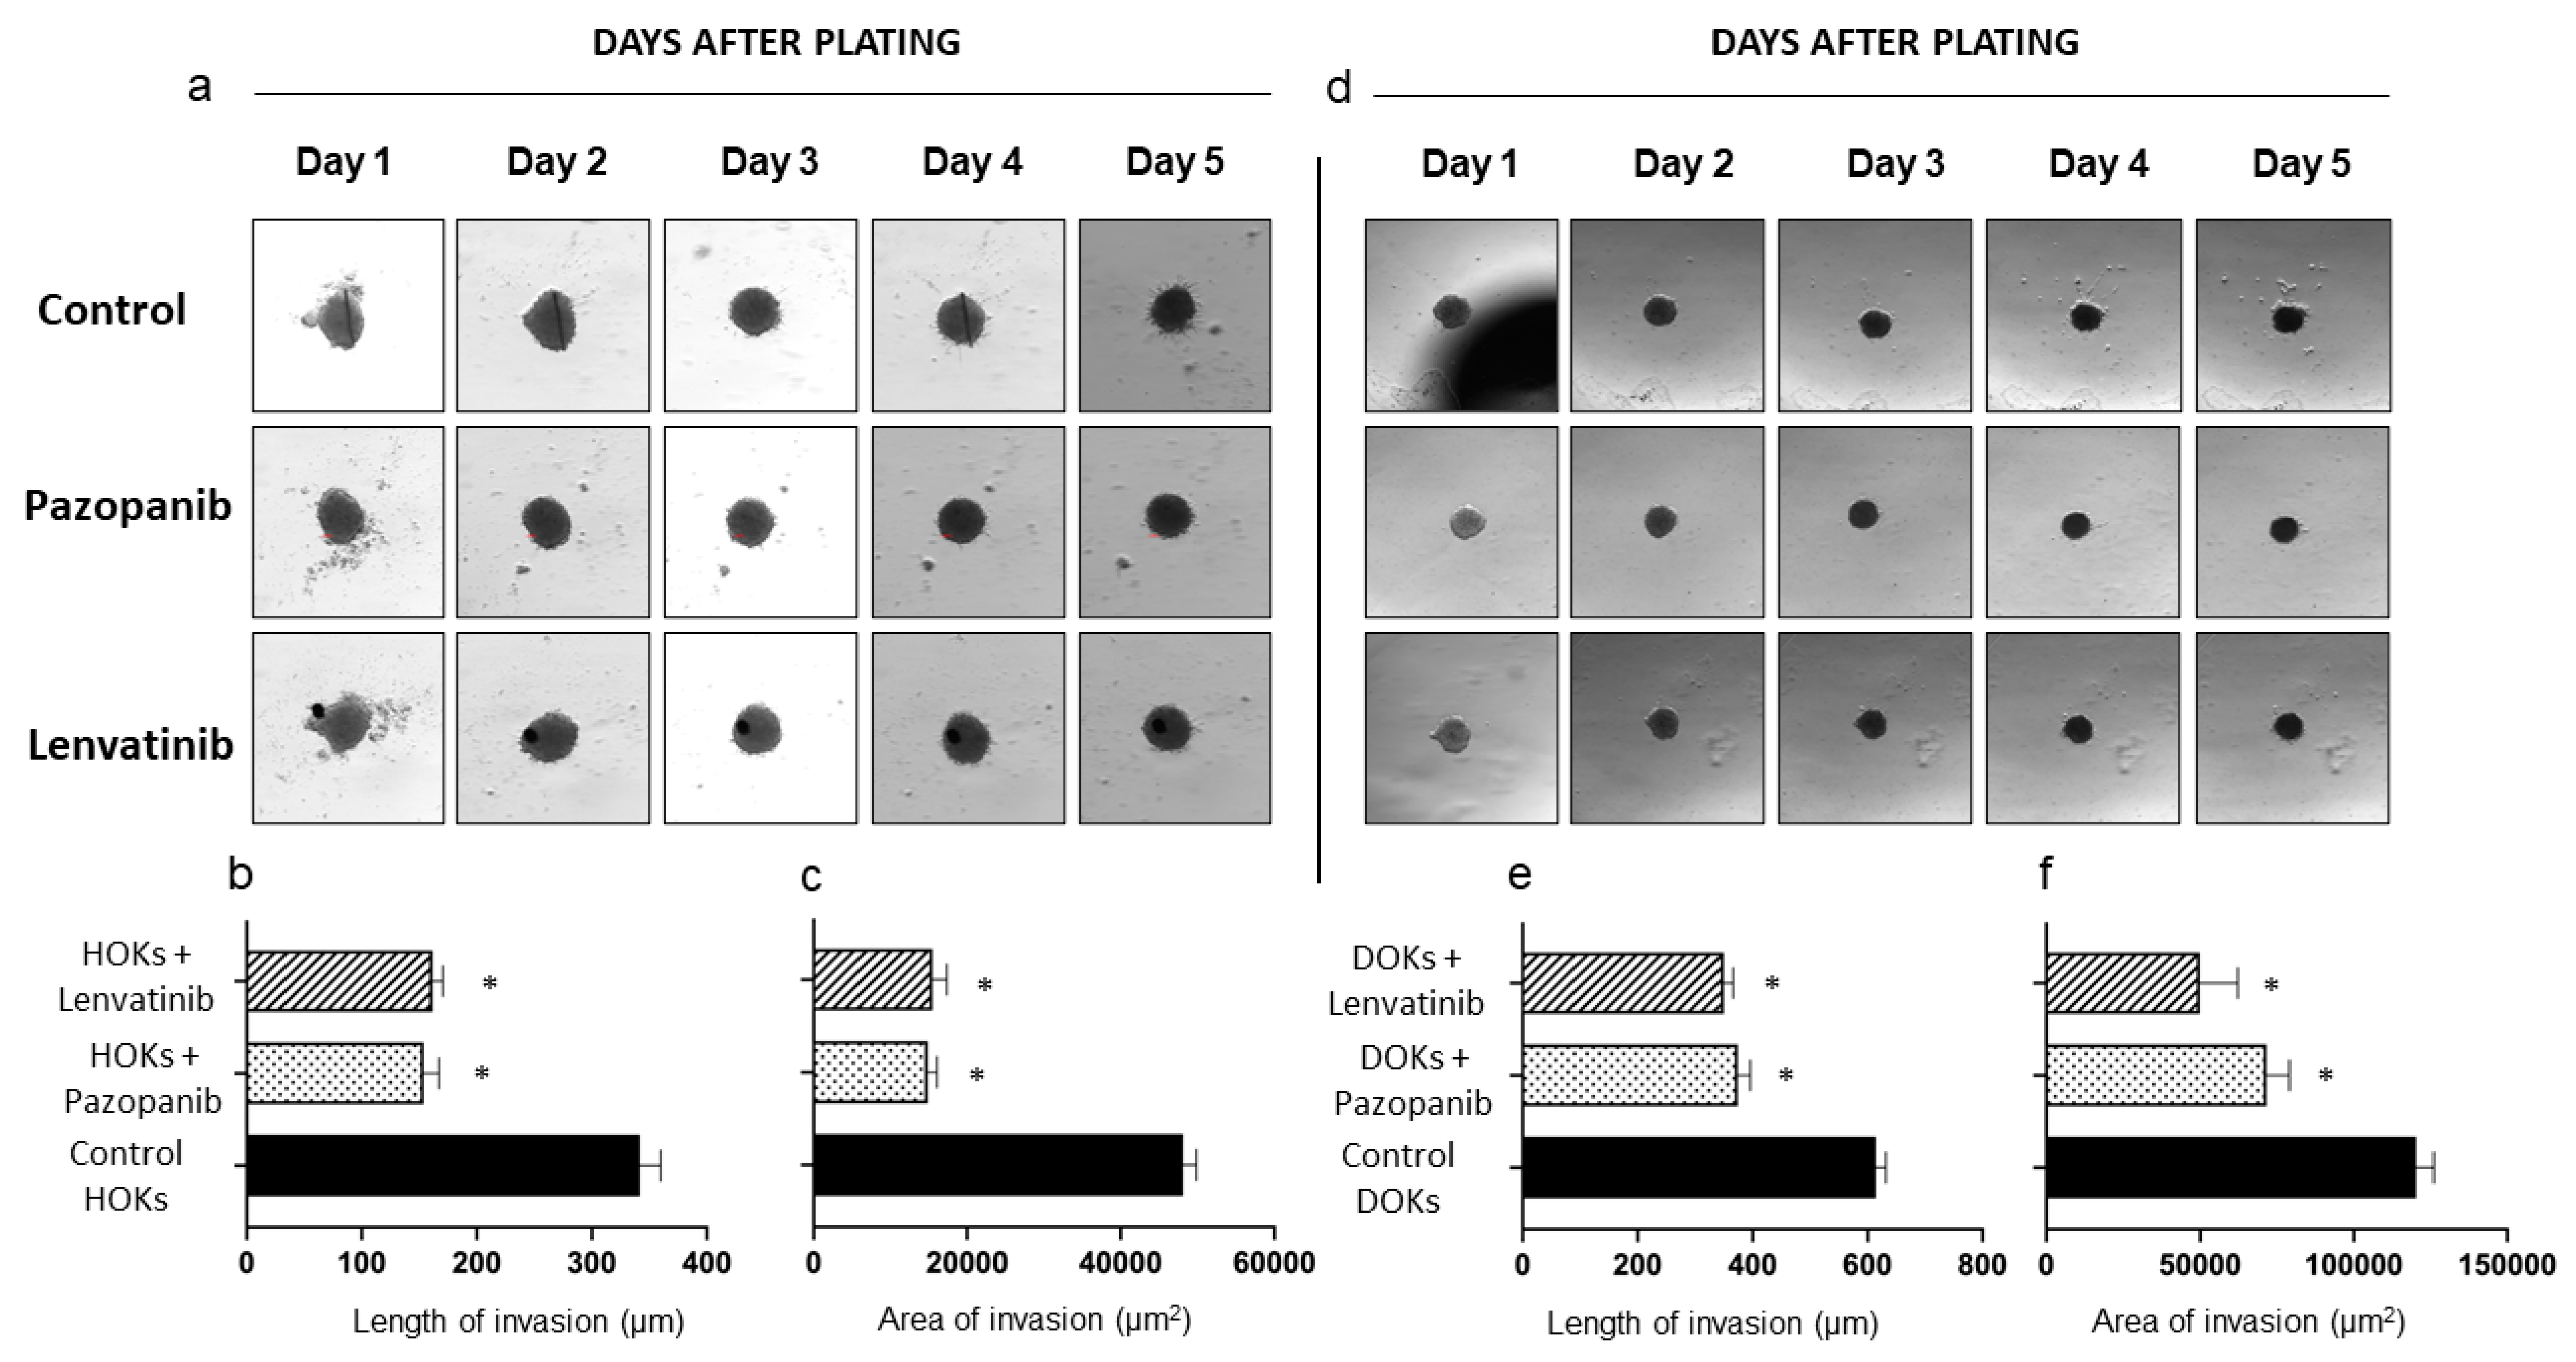
| Control | 341.6 ± 40.9 | 50,718 ± 814.0 | 614.2 ± 39.4 | 125,235.7 ± 3158.1 |
| Pazopanib-treated | 153.8 ± 29.3 * | 14,862.8 ± 2683.2 * | 373.8 ± 49.3 * | 71,685.5 ± 16,675.1 * |
| Lenvatinib-treated | 131.1 ± 20.4 * | 15,486.0 ± 4136.3 * | 341.3 ± 20.0 * | 49,848.6 ± 27,842.6 * |
Disclaimer/Publisher’s Note: The statements, opinions and data contained in all publications are solely those of the individual author(s) and contributor(s) and not of MDPI and/or the editor(s). MDPI and/or the editor(s) disclaim responsibility for any injury to people or property resulting from any ideas, methods, instructions or products referred to in the content. |
© 2023 by the authors. Licensee MDPI, Basel, Switzerland. This article is an open access article distributed under the terms and conditions of the Creative Commons Attribution (CC BY) license (https://creativecommons.org/licenses/by/4.0/).
Share and Cite
Chitturi Suryaprakash, R.T.; Shearston, K.; Farah, C.S.; Fox, S.A.; Iqbal, M.M.; Kadolsky, U.; Zhong, X.; Saxena, A.; Kujan, O. A Novel Preclinical In Vitro 3D Model of Oral Carcinogenesis for Biomarker Discovery and Drug Testing. Int. J. Mol. Sci. 2023, 24, 4096. https://doi.org/10.3390/ijms24044096
Chitturi Suryaprakash RT, Shearston K, Farah CS, Fox SA, Iqbal MM, Kadolsky U, Zhong X, Saxena A, Kujan O. A Novel Preclinical In Vitro 3D Model of Oral Carcinogenesis for Biomarker Discovery and Drug Testing. International Journal of Molecular Sciences. 2023; 24(4):4096. https://doi.org/10.3390/ijms24044096
Chicago/Turabian StyleChitturi Suryaprakash, Ravi Teja, Kate Shearston, Camile S. Farah, Simon A. Fox, Muhammad Munir Iqbal, Ulrich Kadolsky, Xiao Zhong, Alka Saxena, and Omar Kujan. 2023. "A Novel Preclinical In Vitro 3D Model of Oral Carcinogenesis for Biomarker Discovery and Drug Testing" International Journal of Molecular Sciences 24, no. 4: 4096. https://doi.org/10.3390/ijms24044096