
Transcriptome Mechanisms of Tomato Seedlings Induced by Low-Red to Far-Red Light Ratio under Calcium Nitrate Stress

 ,
,  ,
,  ,
,
Abstract
:
1. Introduction
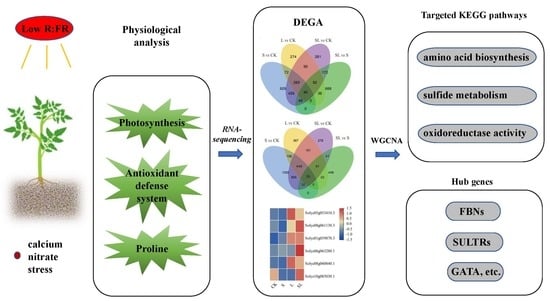
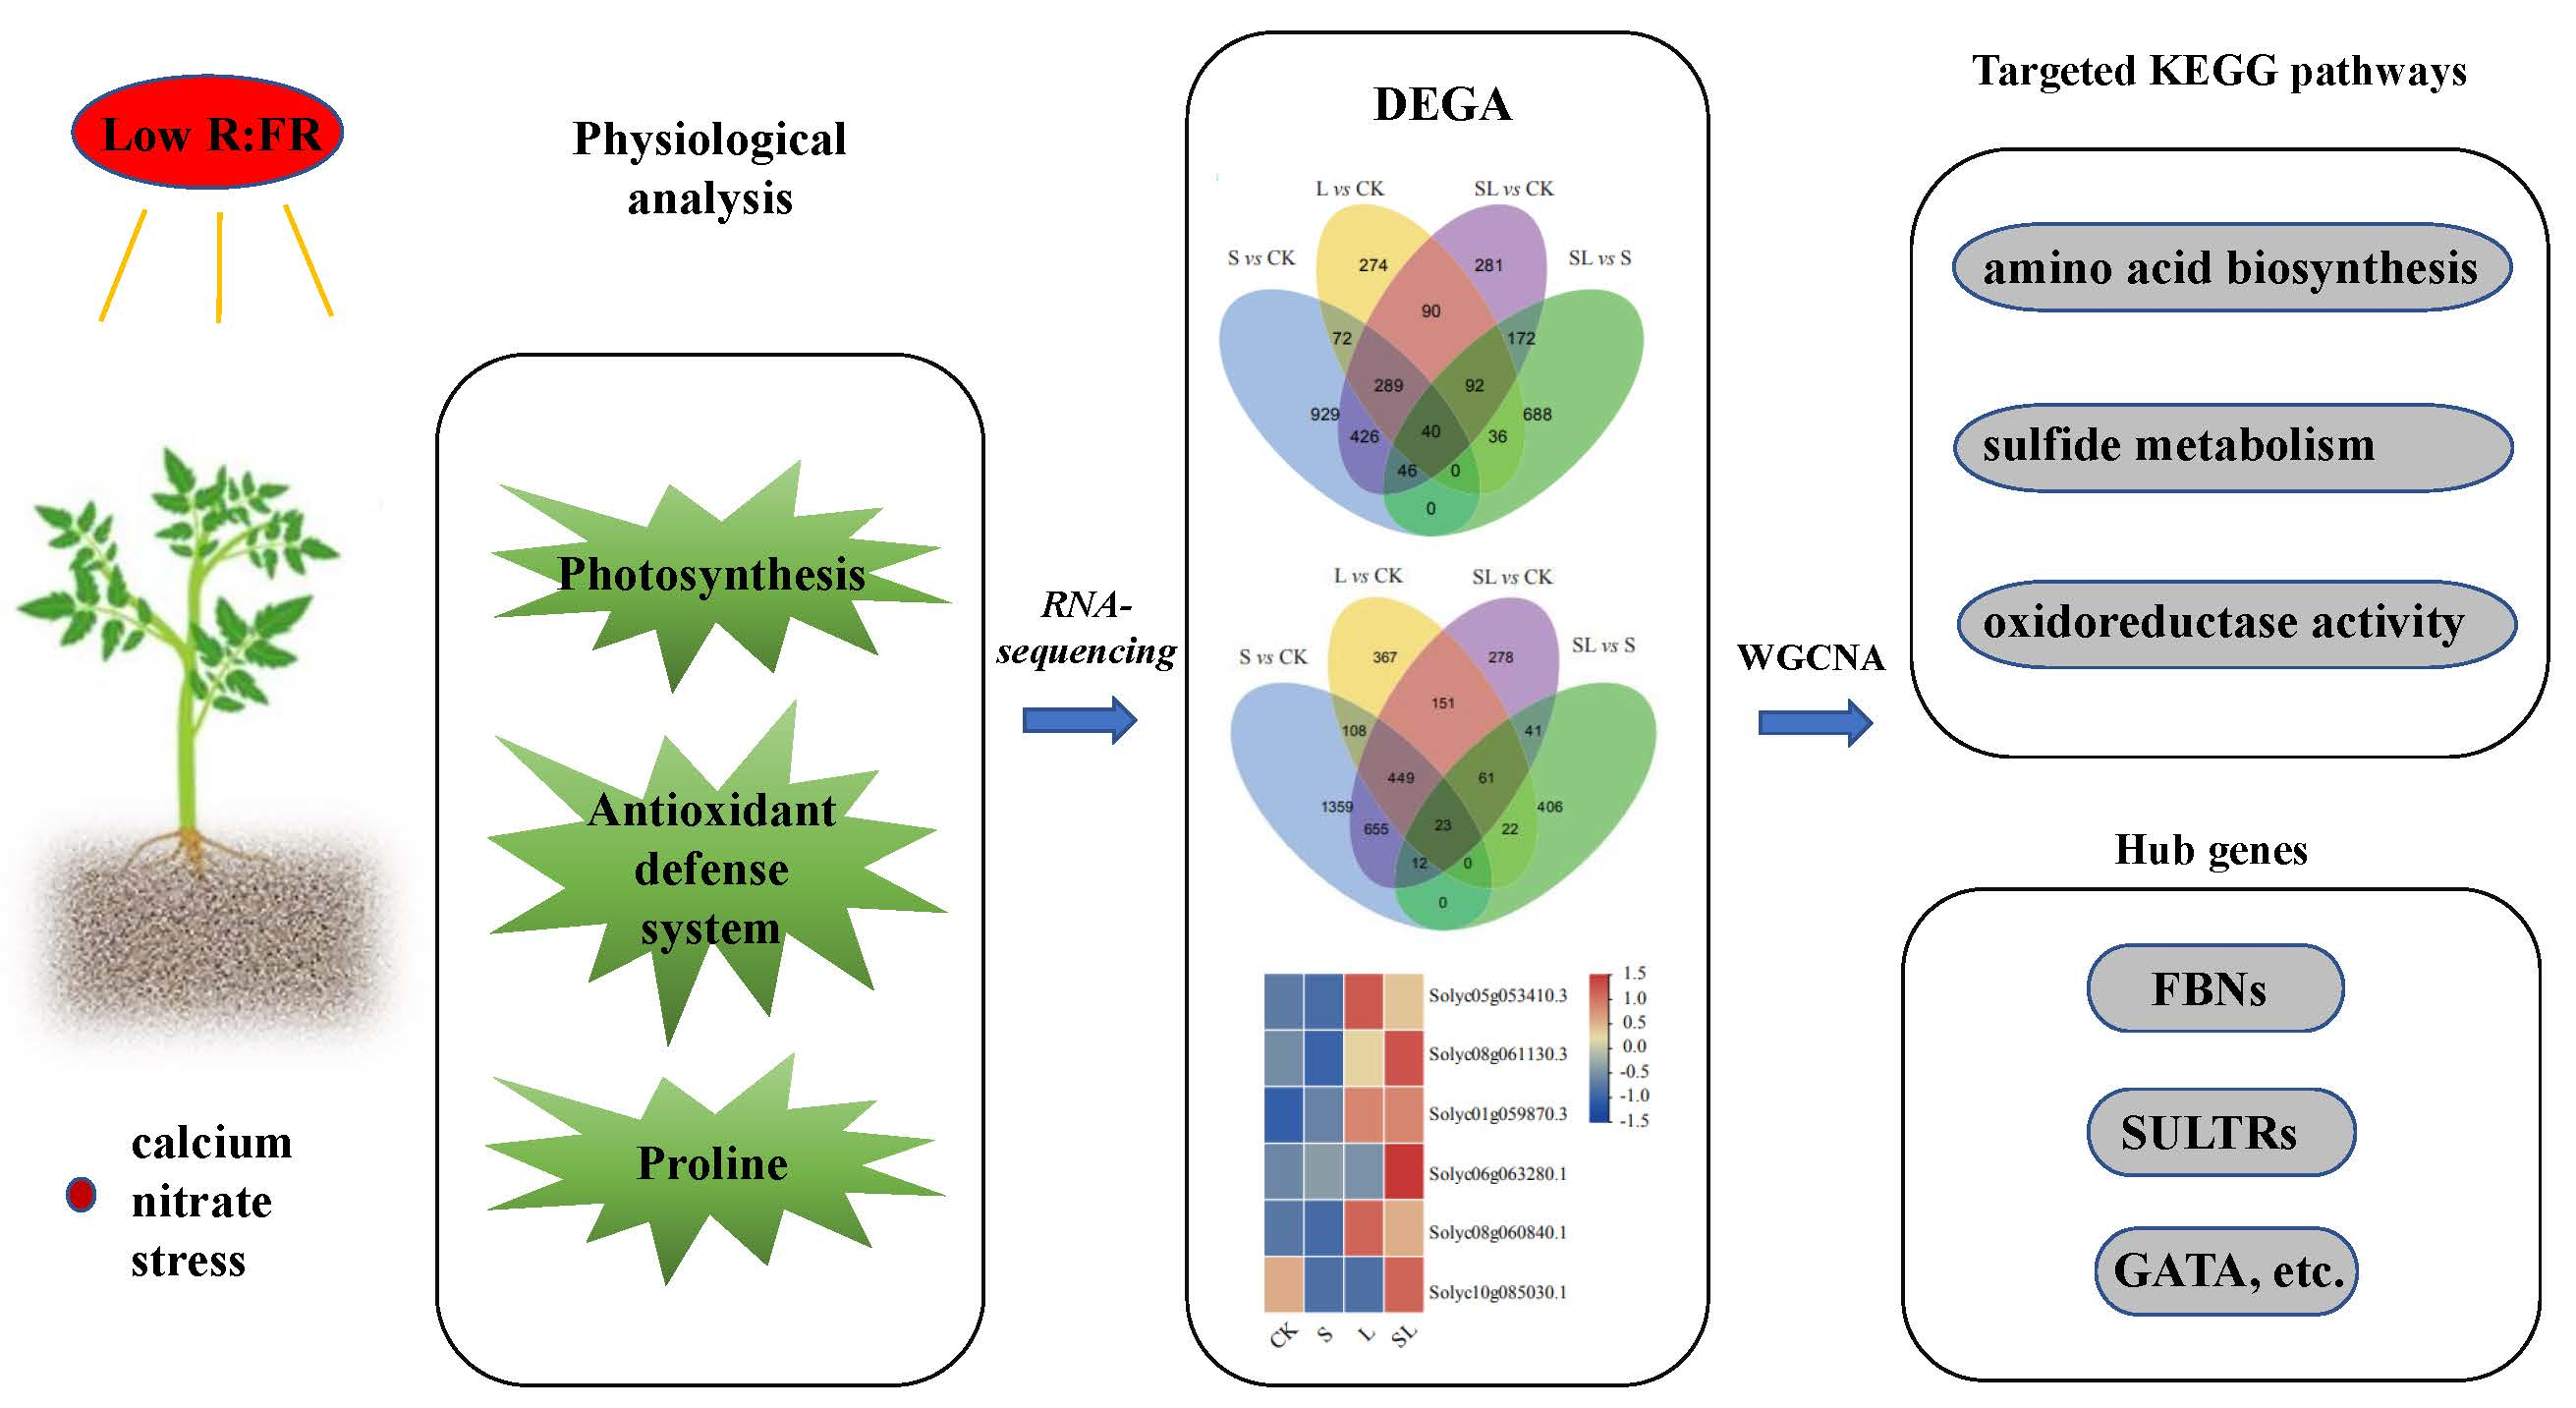
2. Results
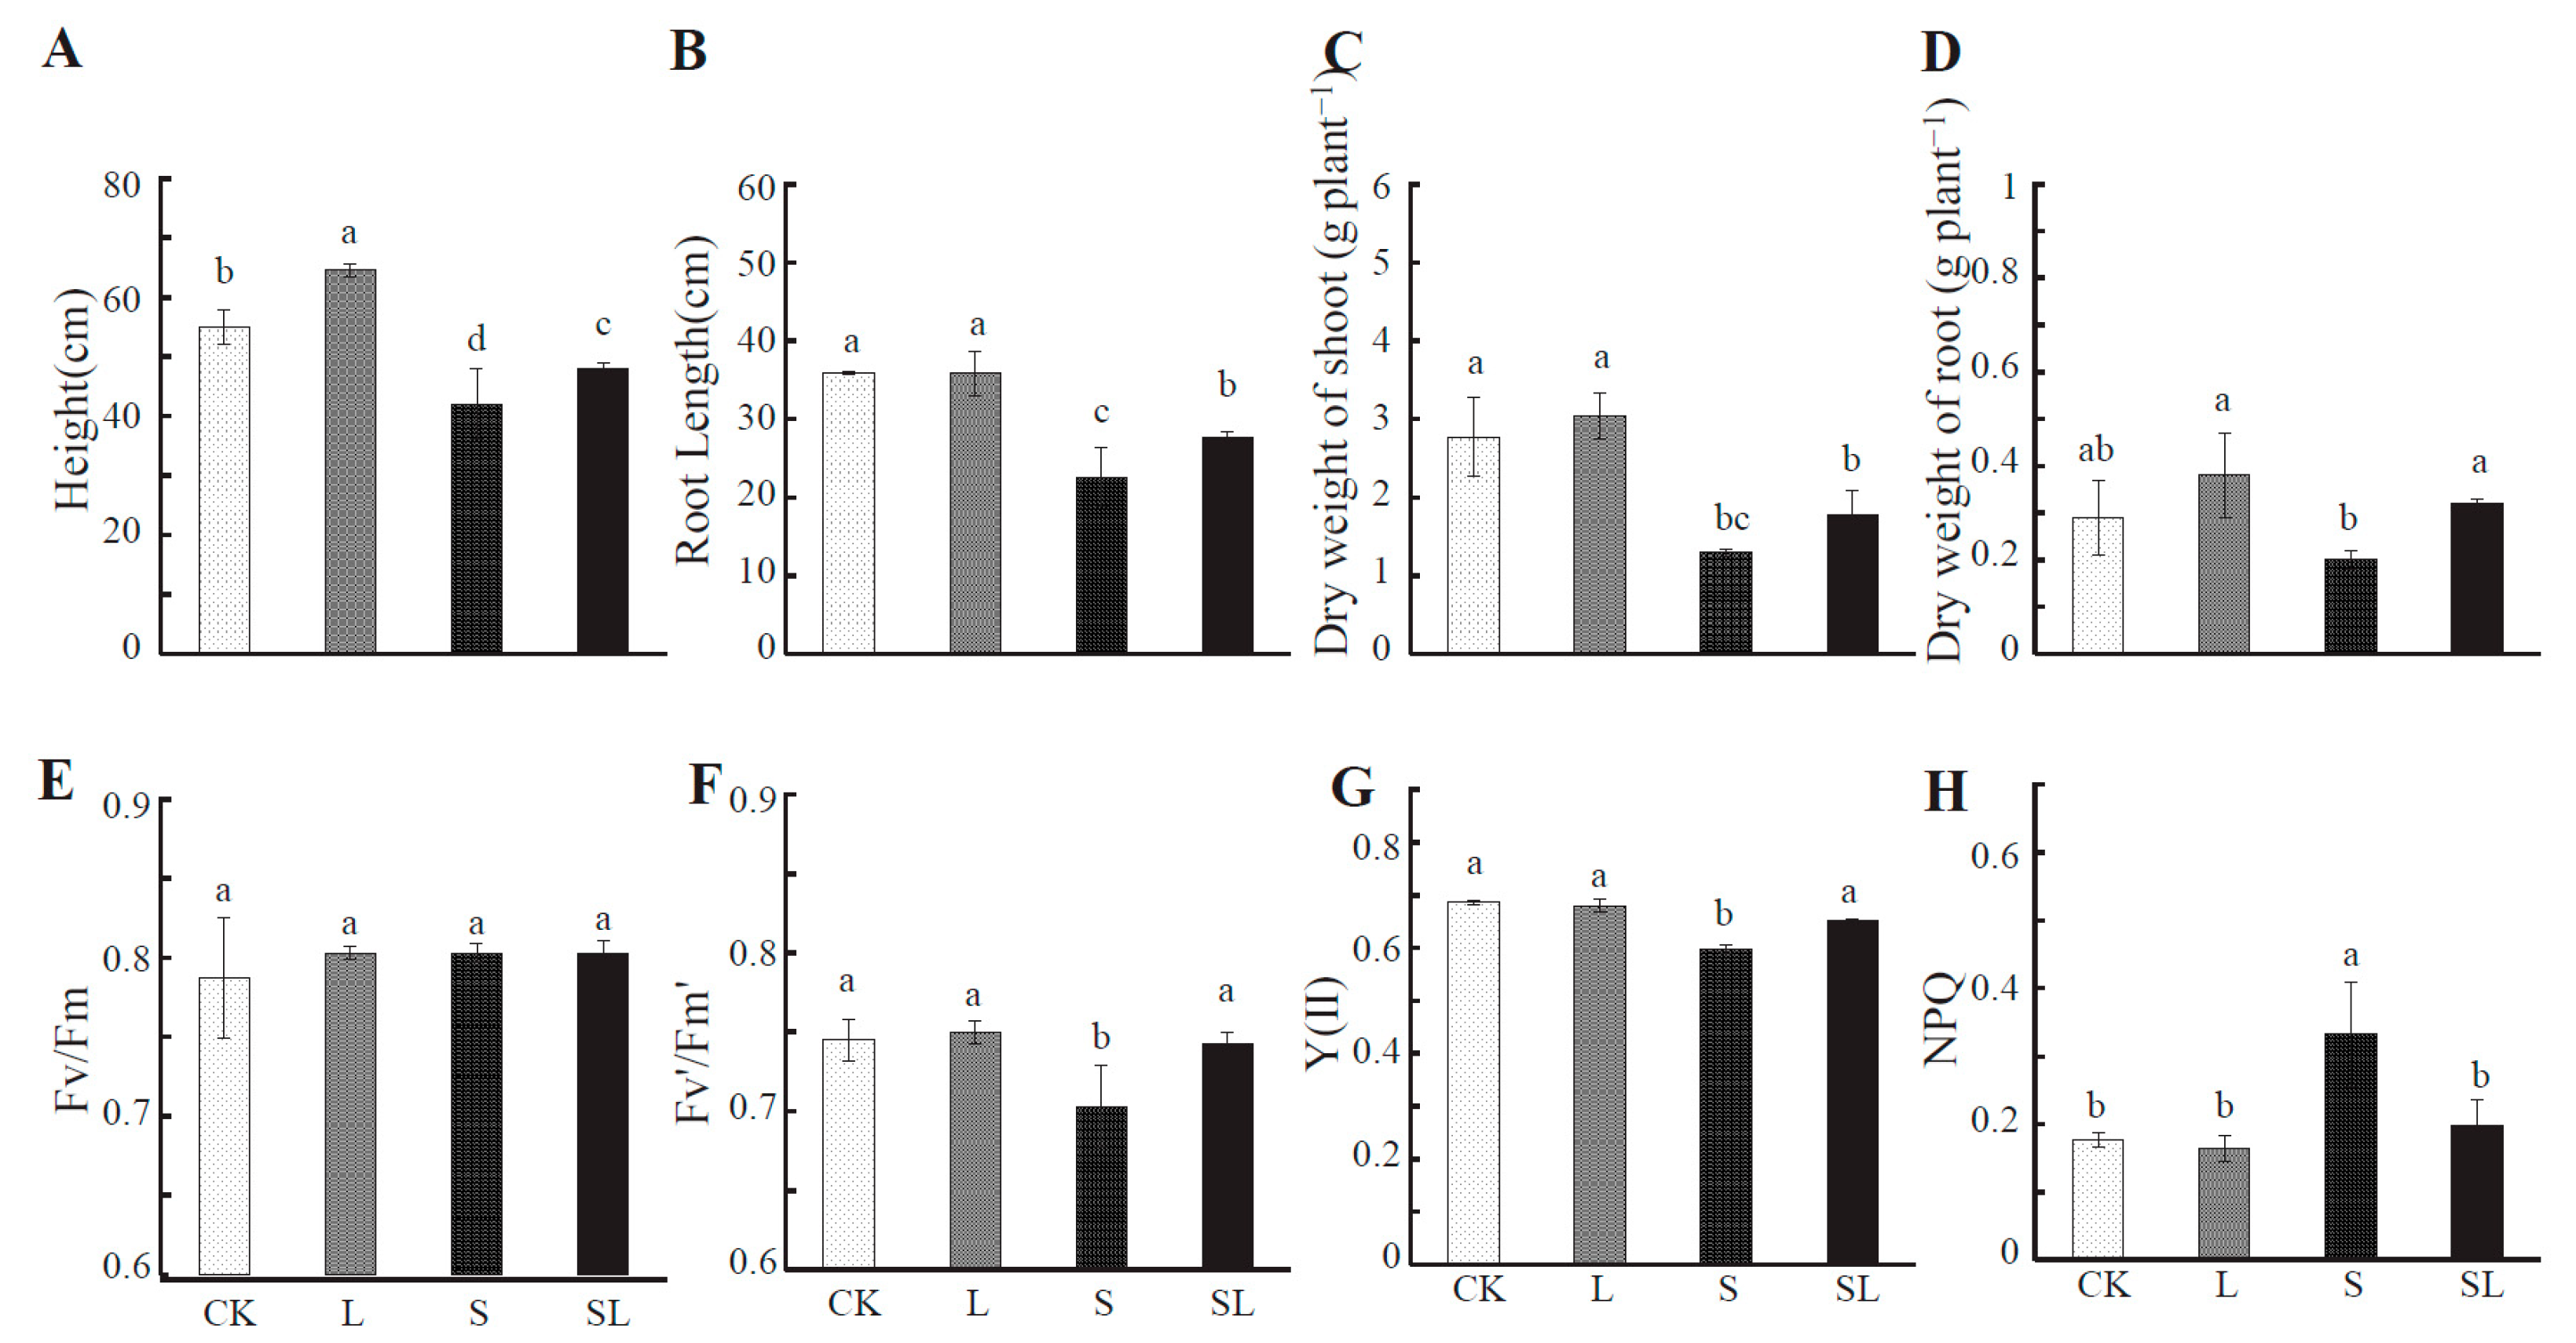
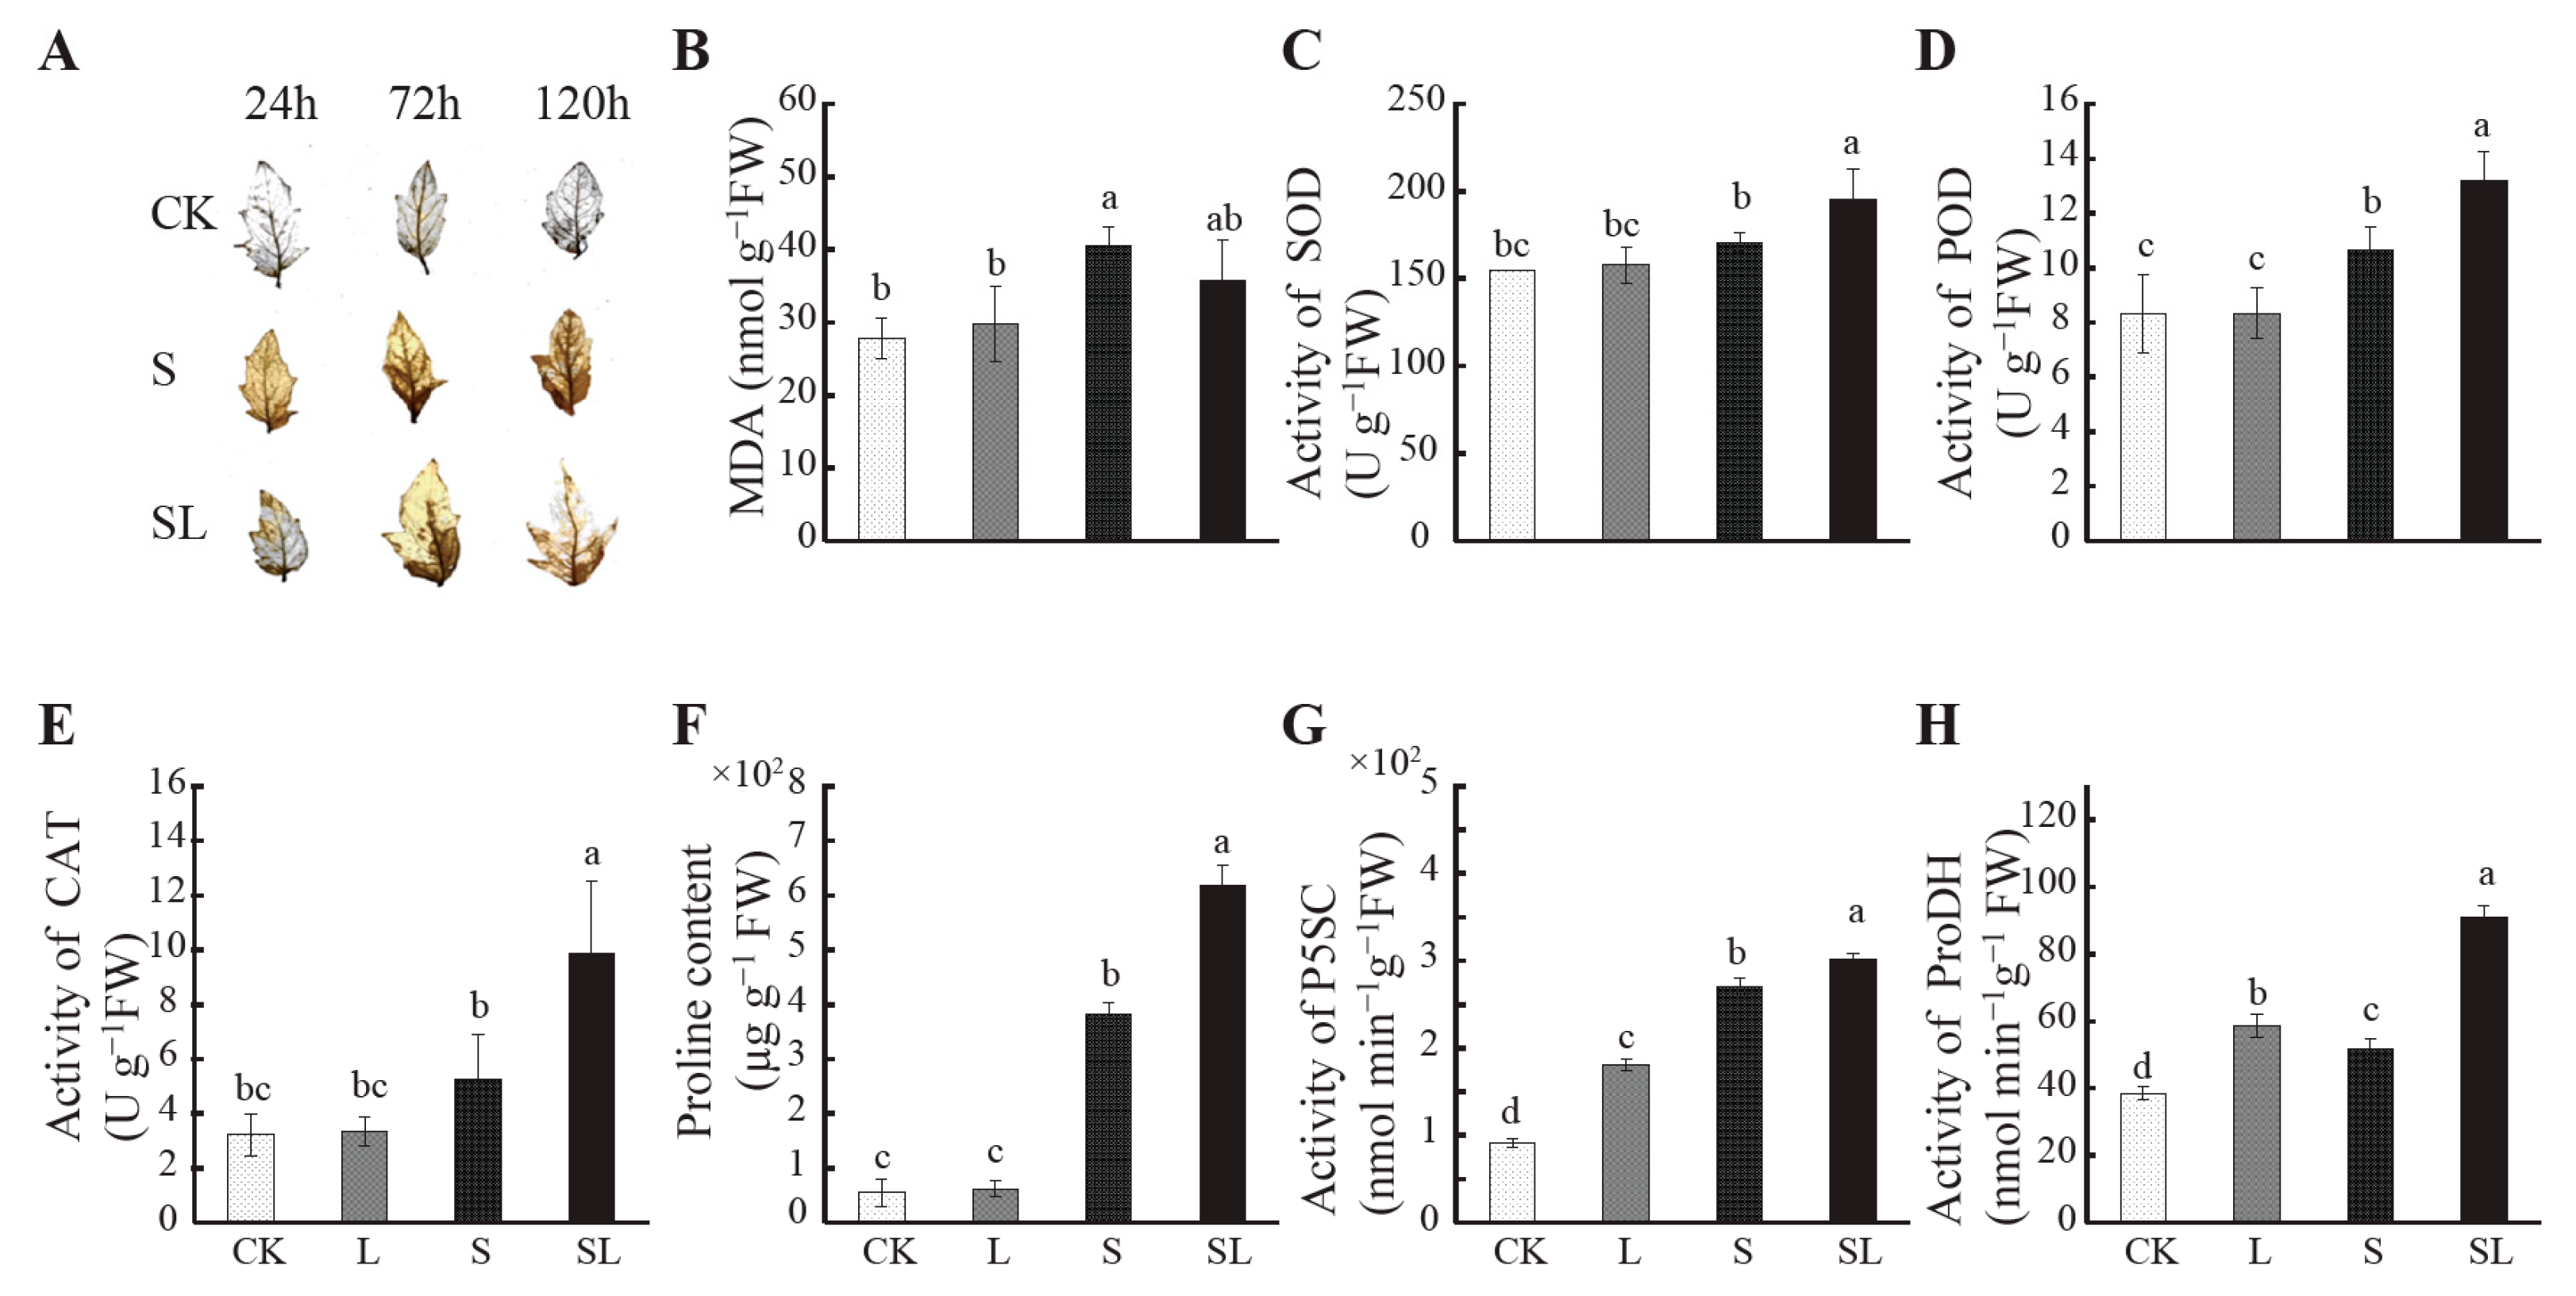
2.1. Response to Calcium Nitrate Stress
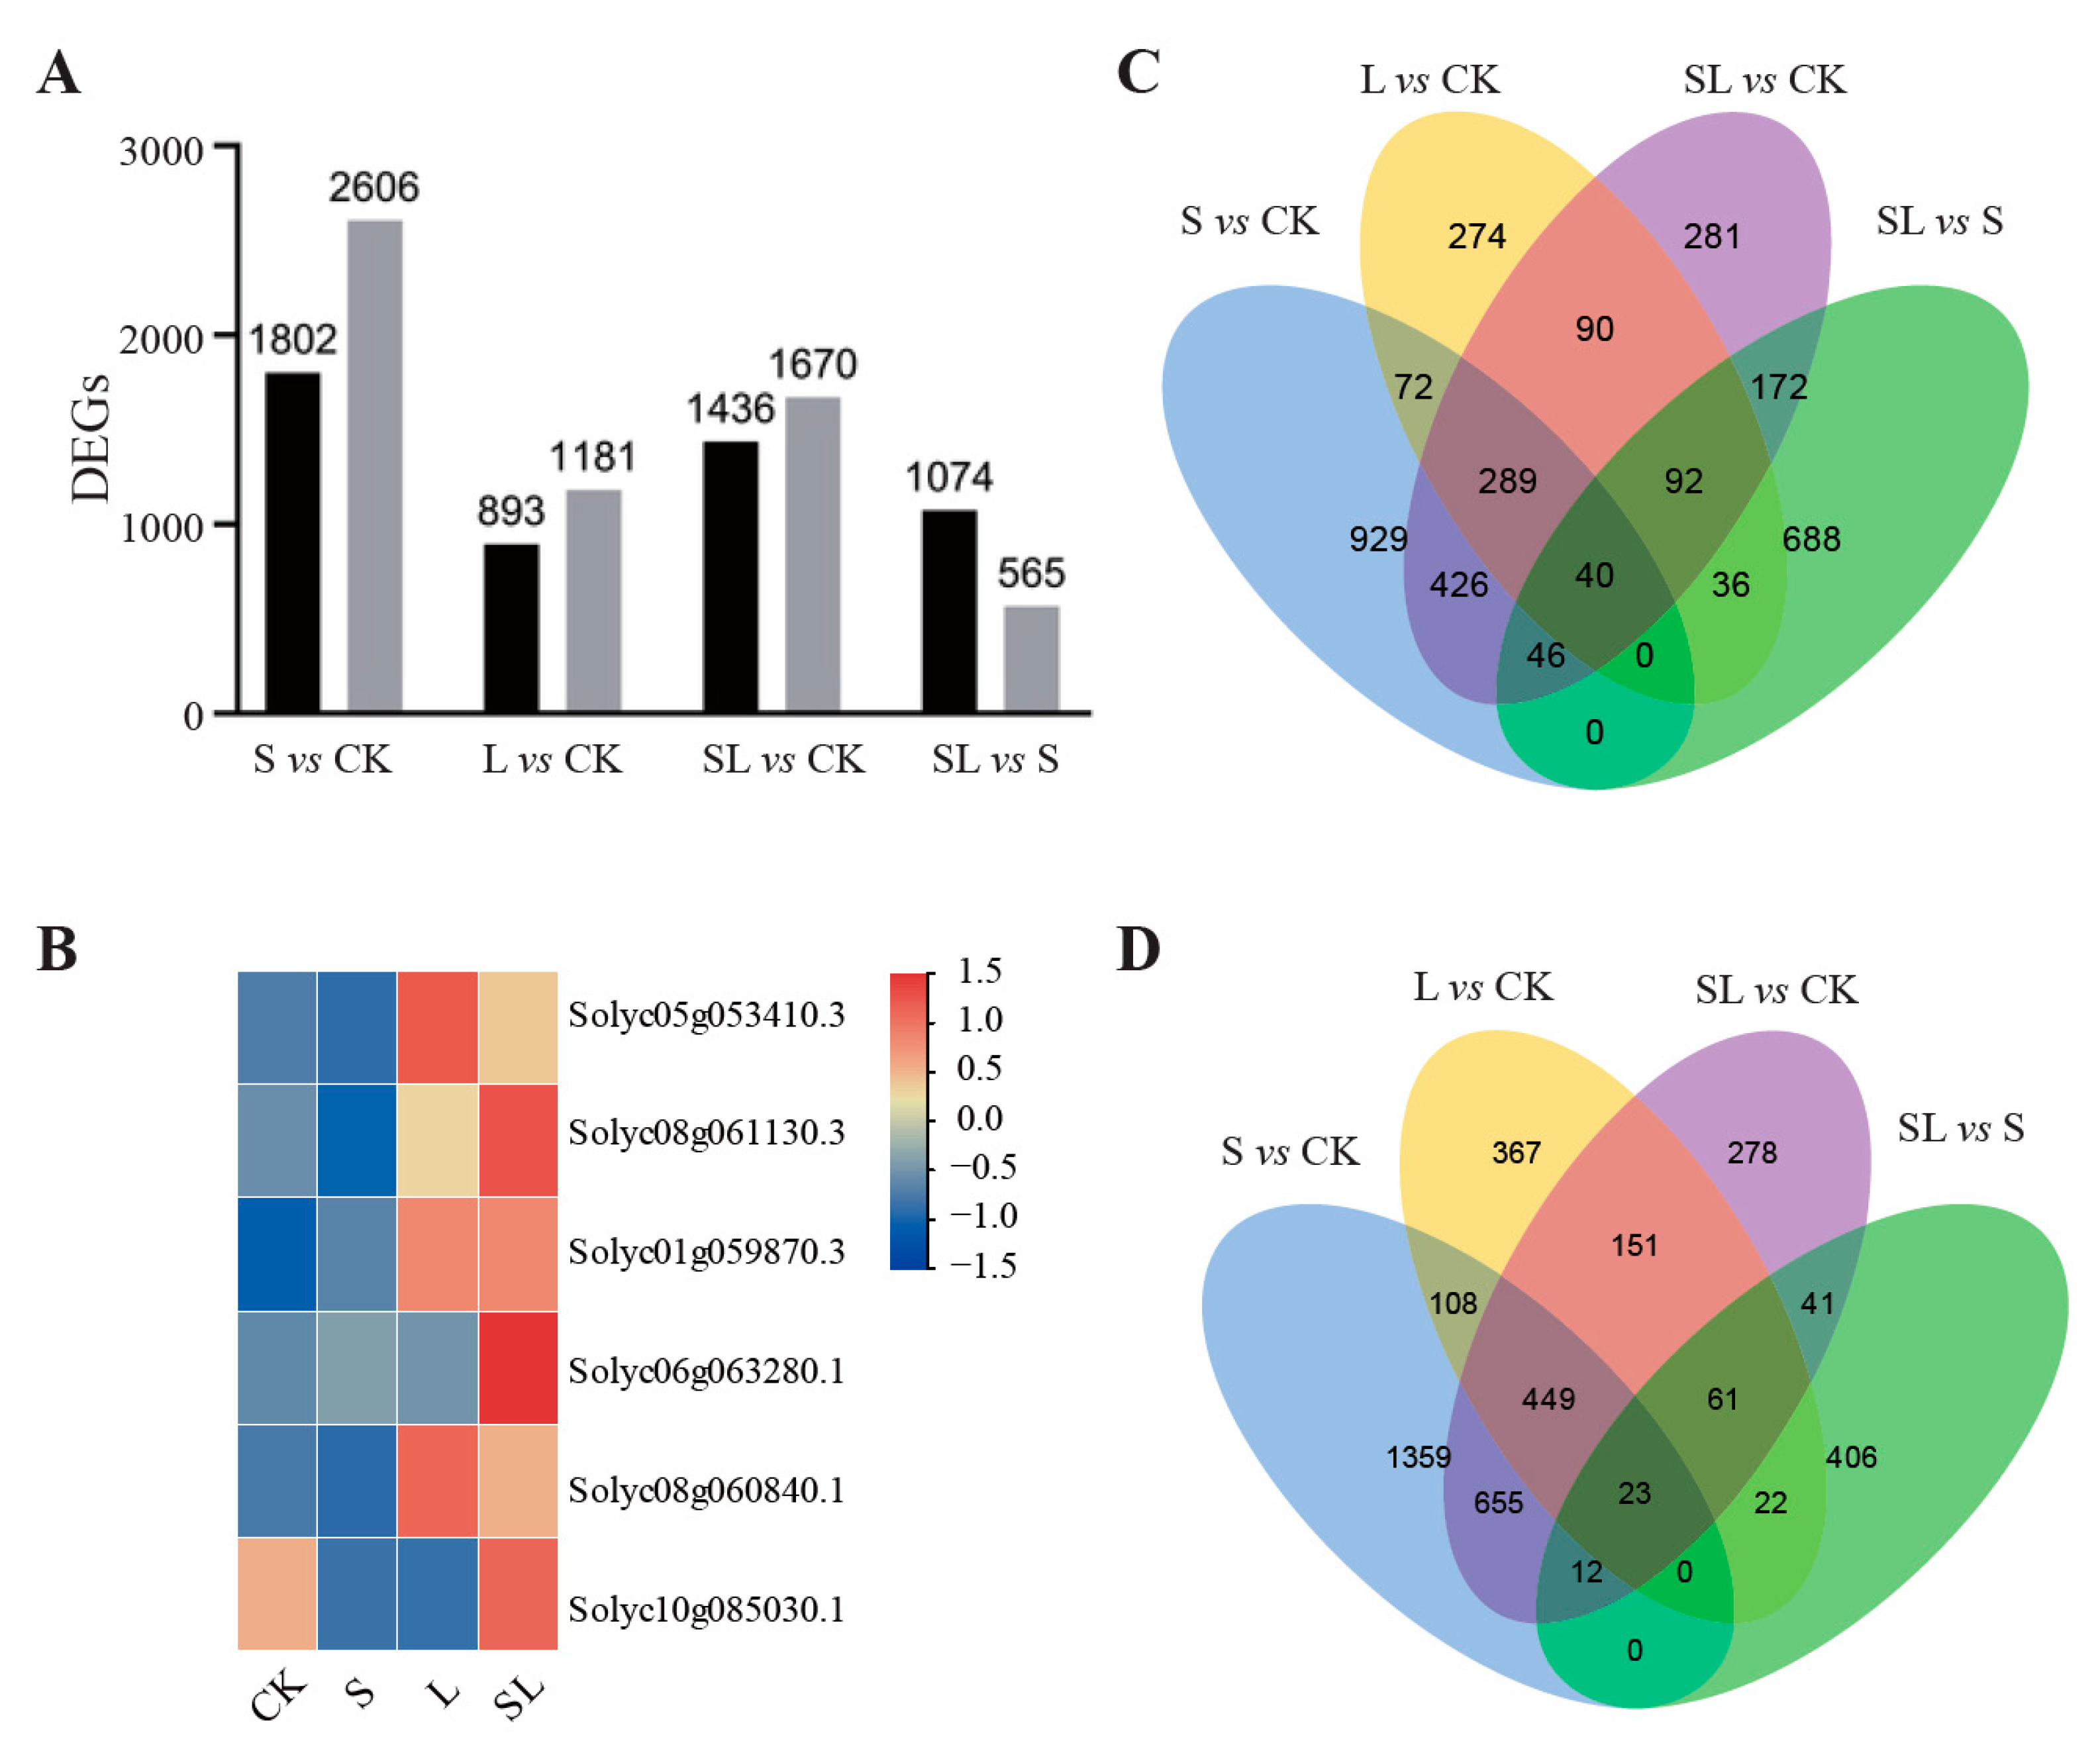
2.2. Sequencing and Transcriptome Assembly
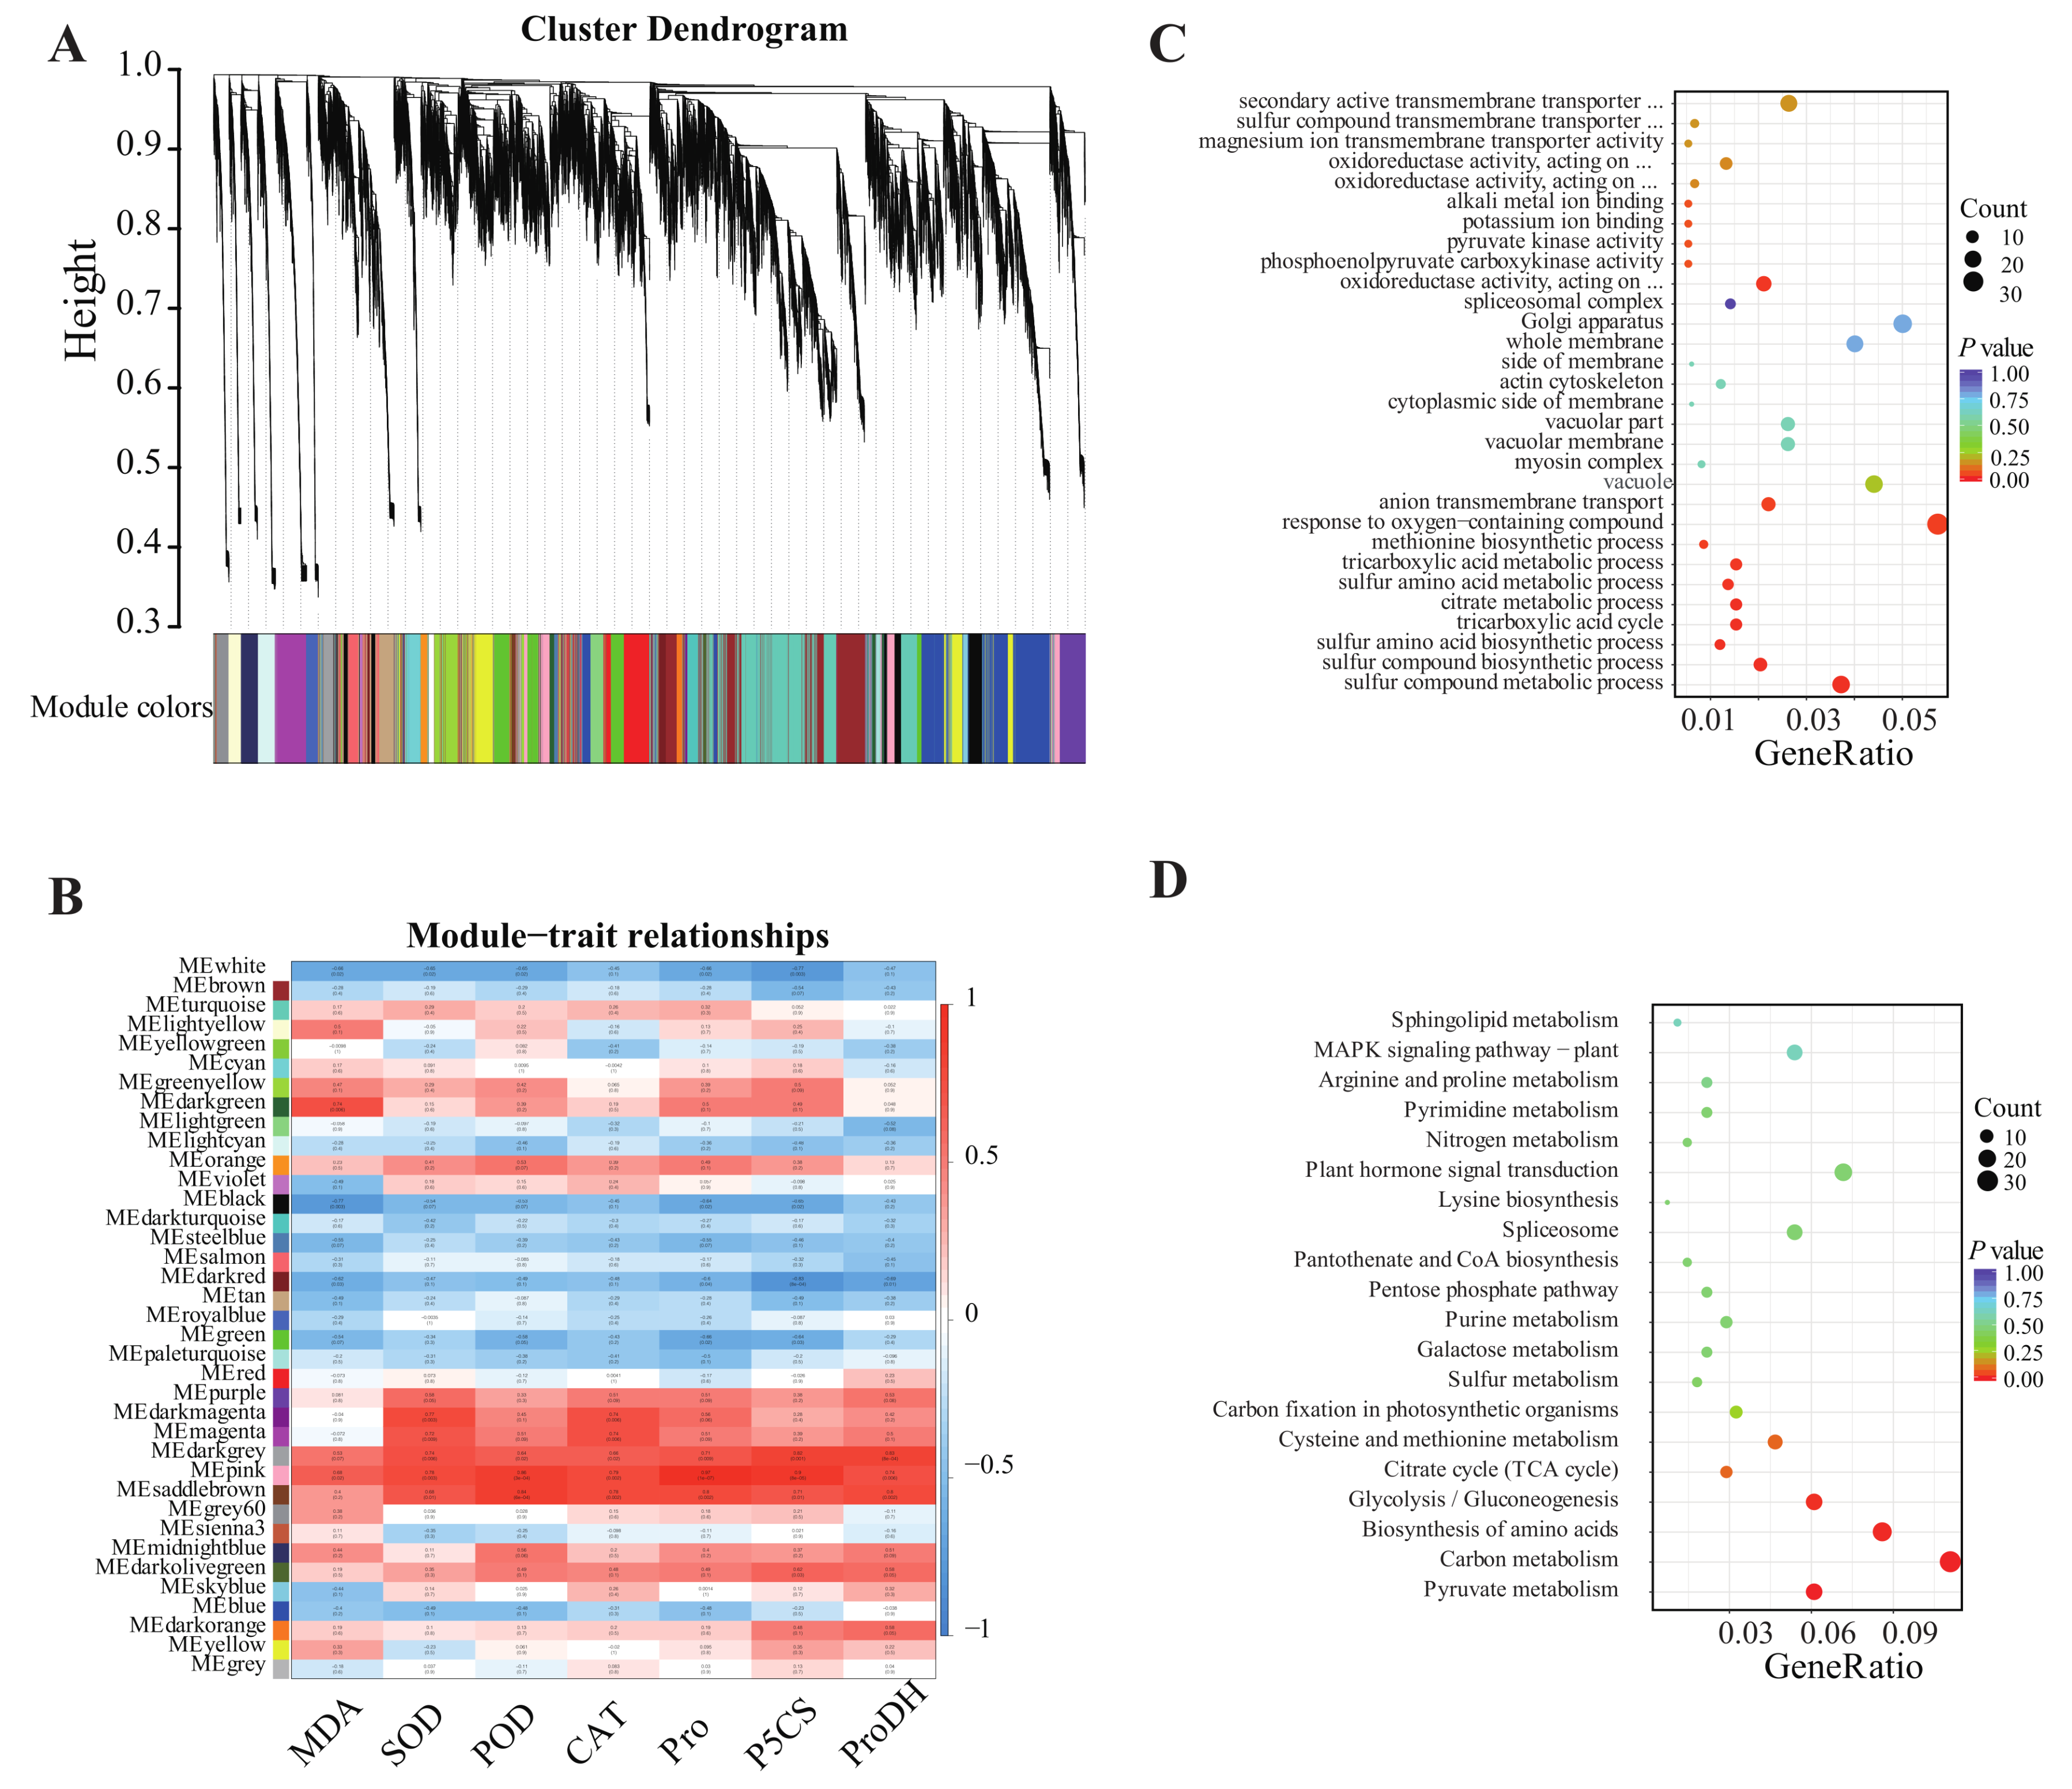
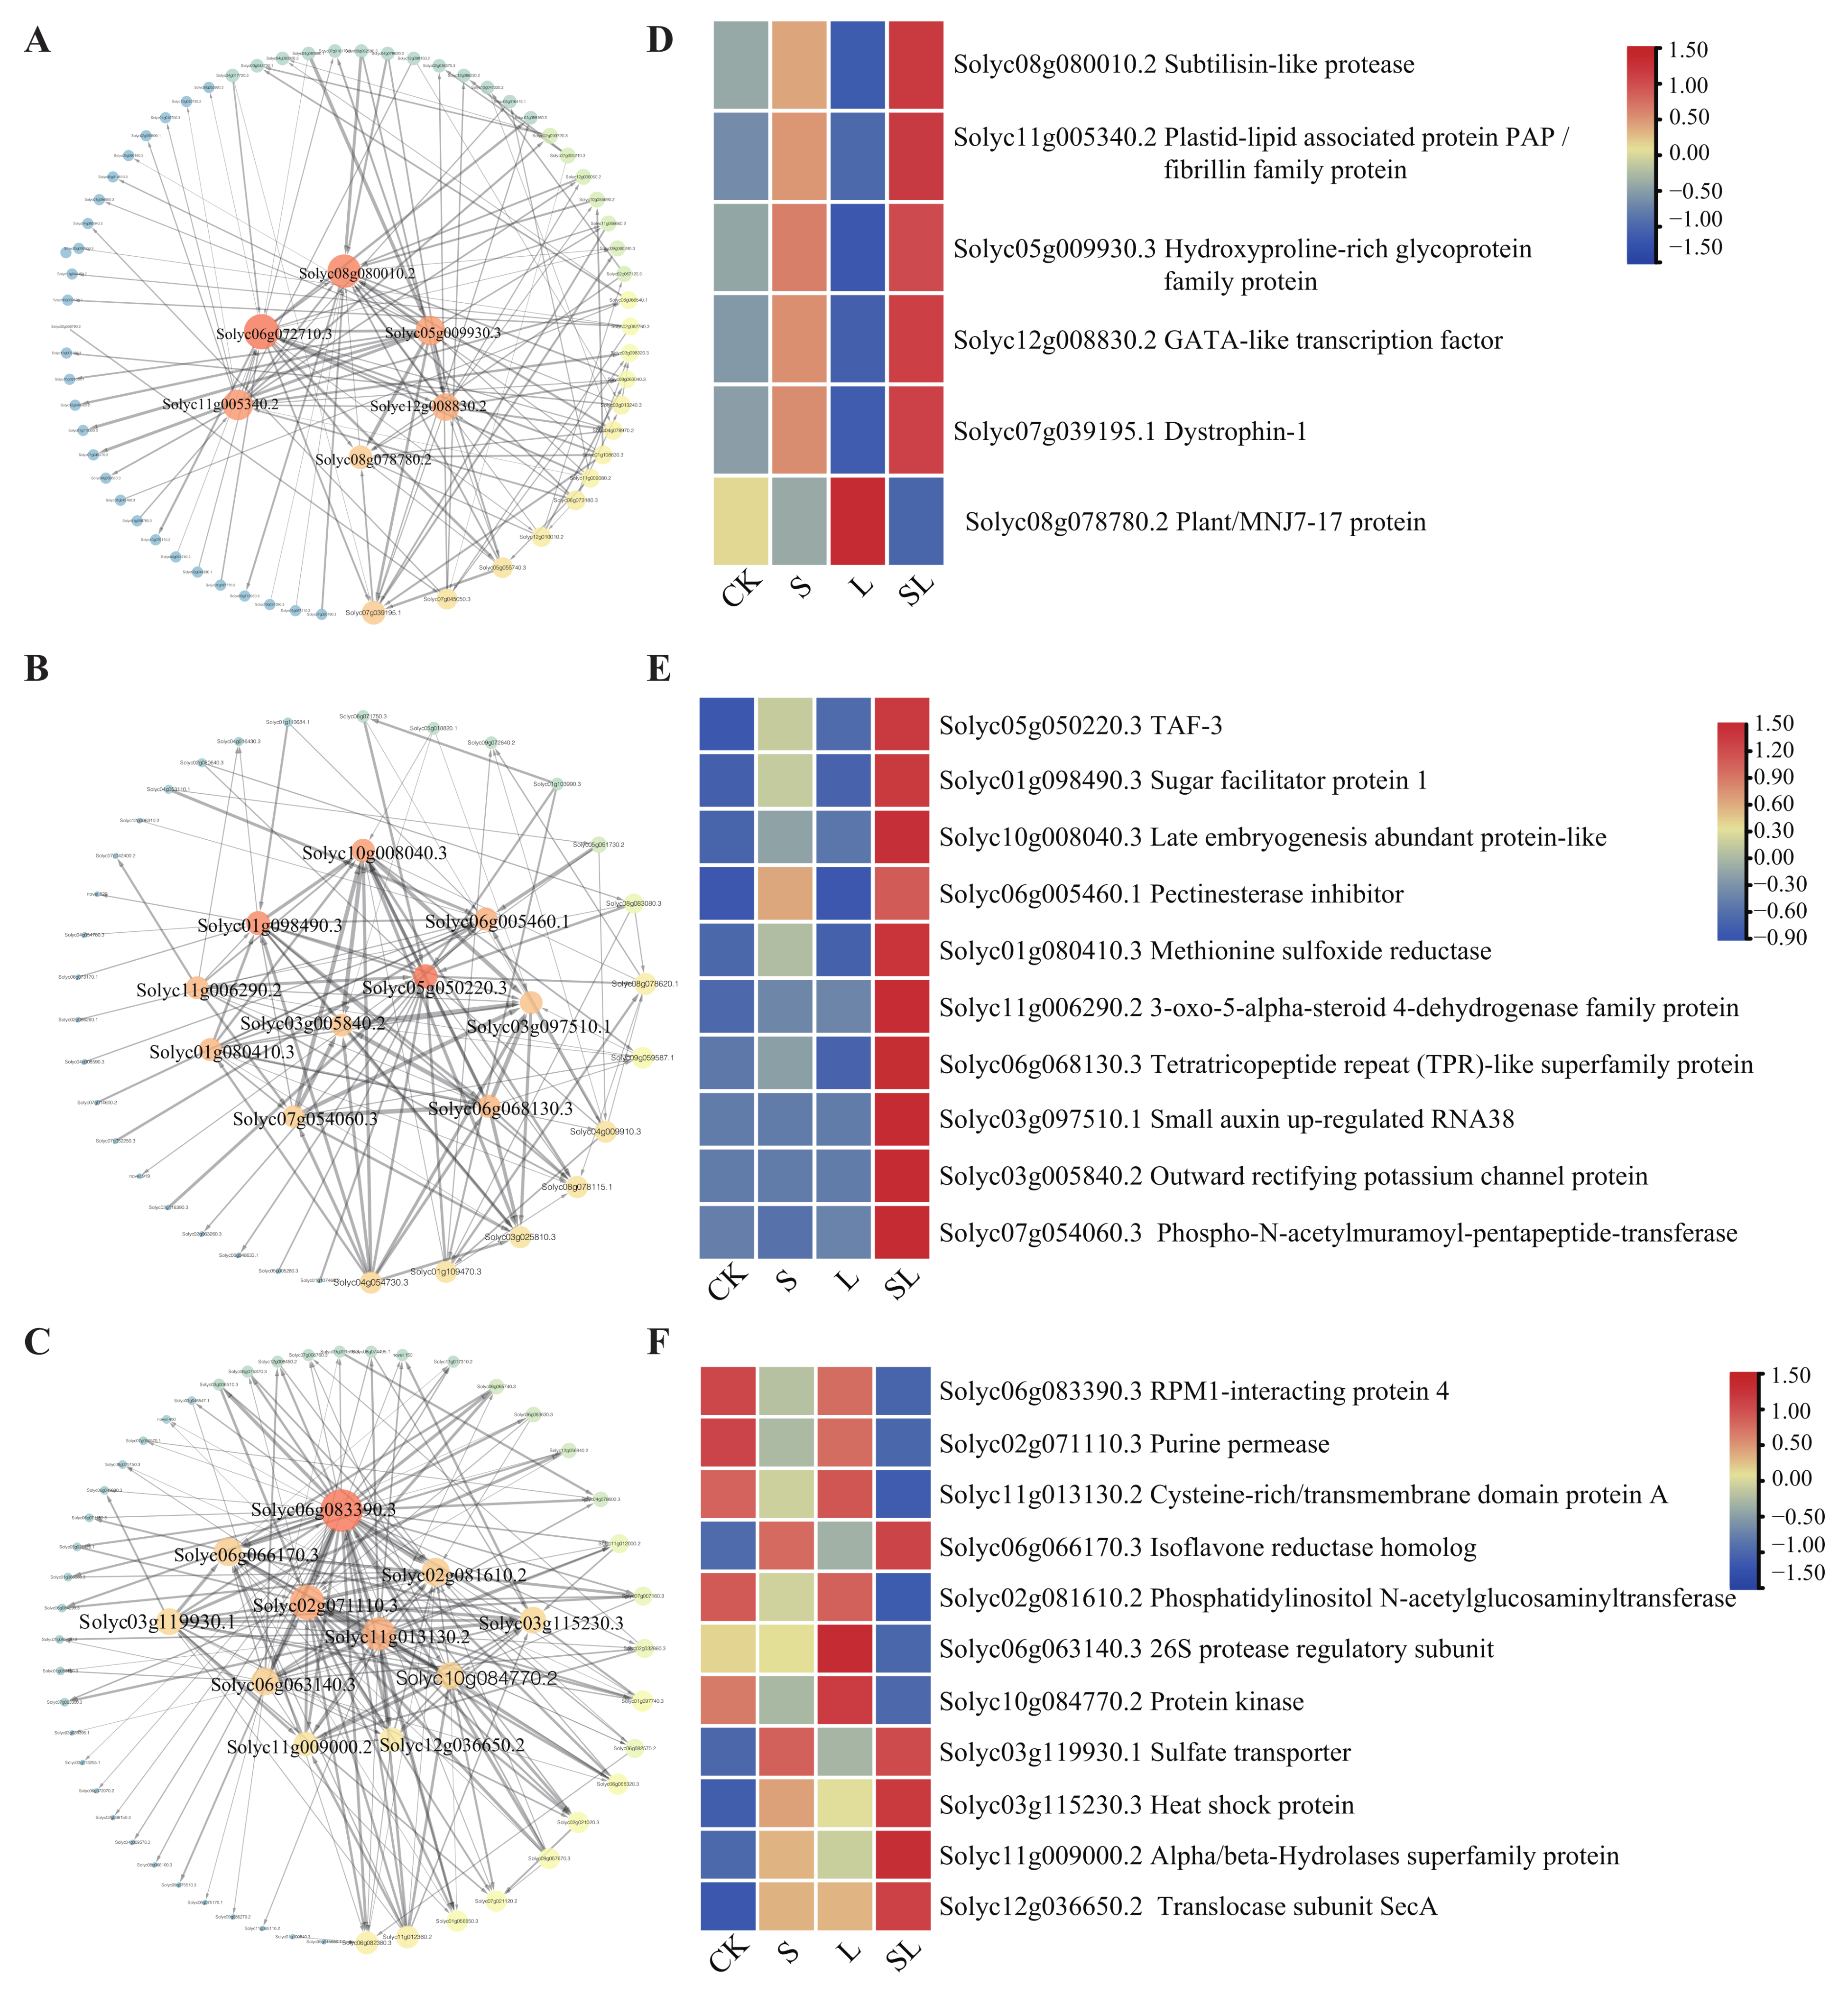
2.3. WGCNA Analysis
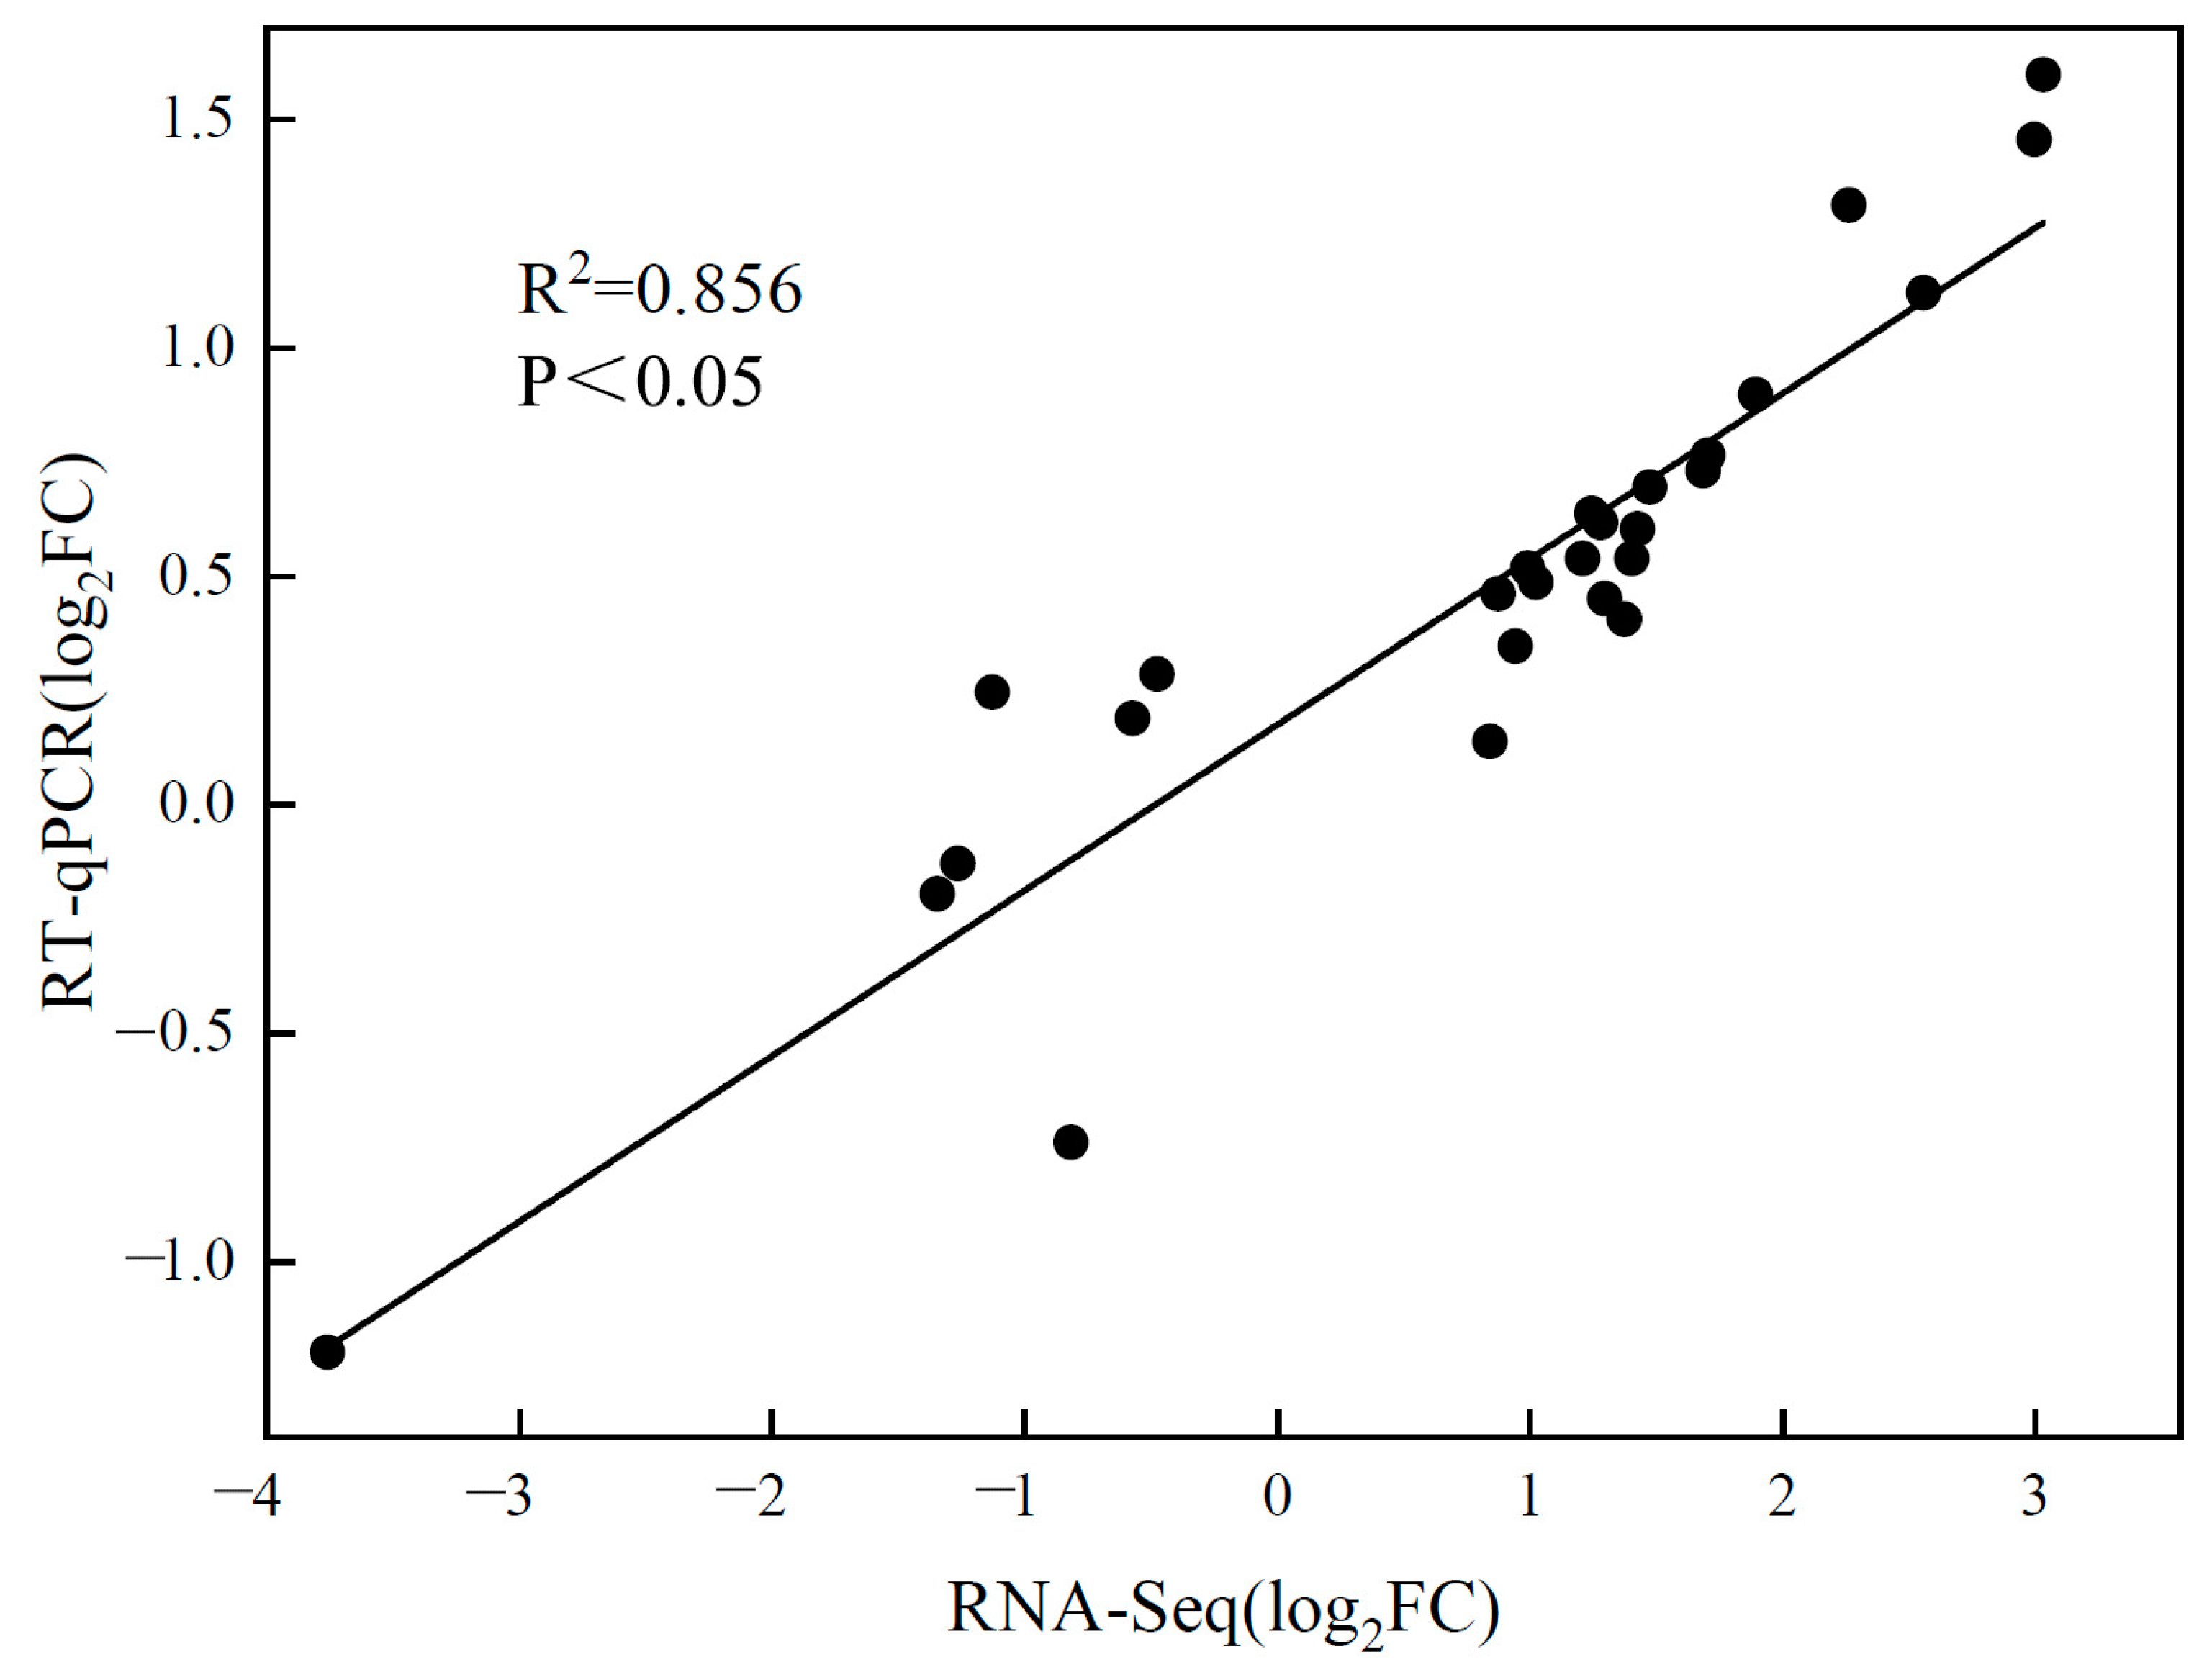
2.4. RT-qPCR Verification of RNA-Seq Data
3. Discussion
4. Materials and Methods
4.1. Plant Materials and Treatment Design
4.2. Determination of Morphological Indexes
4.2.1. Determination of Proline Metabolism, Malondialdehyde Content, and Antioxidant Enzyme Activity
4.2.2. Chlorophyll Fluorescence Parameters Determination
4.3. Transcriptome Analysis
4.4. Weighted Gene Co-Expression Network Analysis
4.5. RT-qPCR Validation
4.6. Data Processing and Analysis
5. Conclusions
Supplementary Materials
Author Contributions
Funding
Institutional Review Board Statement
Informed Consent Statement
Data Availability Statement
Acknowledgments
Conflicts of Interest
References
- Niu, M.; Wei, L.; Peng, Y.; Huang, Y.; Bie, Z. Mechanisms of increasing salt resistance of vegetables by grafting. Veg. Res. 2022, 2, 8. [Google Scholar] [CrossRef]
- Zhu, L.; Jia, X.; Li, M.; Wang, Y.; Zhang, J.; Hou, J.; Wang, X. Associative effectiveness of bio-organic fertilizer and soil conditioners derived from the fermentation of food waste applied to greenhouse saline soil in Shan Dong Province, China. Appl. Soil Ecol. 2021, 167, 104006. [Google Scholar] [CrossRef]
- Zhou, X.T.; Li, Z.L.; He, J.J.; Wang, X.Y.; Liu, Q.L.; Huang, J.; Xie, Y.D.; He, Z.Q. Effects of red to far-red light ratio on growth and photosynthetic characteristics of tomato seedlings under calcium nitrate stress. Photosynthetica 2021, 59, 625–632. [Google Scholar] [CrossRef]
- Zhang, D.; Li, J.; Niu, X.; Deng, C.; Guo, W. GhANN1 modulates the salinity tolerance by regulating ABA biosynthesis, ion homeostasis and phenylpropanoid pathway in cotton. Environ. Exp. Bot. 2021, 185, 104427. [Google Scholar] [CrossRef]
- Wu, J.; Zhao, Q.; Sun, D.; Wu, G.; Zhang, L.; Yuan, H.; Yu, Y.; Zhang, S.; Yang, X.; Li, Z. Transcriptome analysis of flax (Linum usitatissimum L.) undergoing osmotic stress. Ind. Crops Prod. 2018, 116, 215–223. [Google Scholar] [CrossRef]
- Hannachi, S.; Labeke, M.V. Salt stress affects germination, seedling growth and physiological responses differentially in eggplant cultivars (Solanum melongena L.). Sci. Hortic. 2018, 228, 56–65. [Google Scholar] [CrossRef]
- Wang, Z.Y.; Liang, Y.H.; Jin, Y.R.; Tong, X.L.; Wei, X.Y.; Ma, F.W.; Ma, B.Q.; Li, M.J. Ectopic expression of apple hexose transporter MdHT2.2 reduced the salt tolerance of tomato seedlings with decreased ROS-scavenging ability. Plant Physiol. Biochem. 2020, 156, 504–513. [Google Scholar] [CrossRef]
- Yi, C.Y.; Yao, K.Q.; Cai, S.Y.; Li, H.Z.; Zhou, J.; Xia, X.J.; Shi, K.; Yu, J.Q.; Foyer, C.H.; Zhou, Y.H. High atmospheric carbon dioxide-dependent alleviation of salt stress is linked to RESPIRATORY BURST OXIDASE 1 (RBOH1)-dependent H2O2 production in tomato (Solanum lycopersicum). J. Exp. Bot. 2016, 66, 7391–7404. [Google Scholar] [CrossRef]
- Zhen, S.; Iersel, M.V. Far-red light is needed for efficient photochemistry and photosynthesis. J. Plant Physiol. 2017, 209, 115–122. [Google Scholar] [CrossRef]
- Yang, F.; Liu, Q.; Cheng, Y.; Feng, L.; Wu, X.; Fan, Y.; Raza, M.A.; Wang, X.; Yong, T.; Liu, W. Low red/far-red ratio as a signal promotes carbon assimilation of soybean seedlings by increasing the photosynthetic capacity. BMC Plant Biol. 2020, 20, 148. [Google Scholar] [CrossRef] [Green Version]
- Cao, K.; Jie, Y.; Xu, D.; Ai, K.; Bao, E.; Zou, Z. Exposure to lower red to far-red light ratios improve tomato tolerance to salt stress. BMC Plant Biol. 2018, 18, 92. [Google Scholar] [CrossRef]
- Wang, F.; Zhang, L.; Chen, X.; Wu, X.; Xiang, X.; Zhou, J.; Xia, X.; Shi, K.; Yu, J.; Foyer, C.H.; et al. SlHY5 Integrates Temperature, Light, and Hormone Signaling to Balance Plant Growth and Cold Tolerance. Plant Physiol. 2018, 179, 749–760. [Google Scholar] [CrossRef]
- Chen, L.; Huang, J.; Liu, Q.; Li, Z.; Chen, X.; Han, J.; Gan, Y.; He, Y.; Jiang, C.; Tang, Y.; et al. Low R/FR Ratio Affects Pakchos Growth and Nitrate Content under Excess Nitrate Stress. Horticulturae 2022, 8, 186. [Google Scholar] [CrossRef]
- Hanson, B.; May, D.; Simnek, J.; Hopmans, J.; Hutmacher, R. Drip irrigation provides the salinity control needed for profitable irrigation of tomatoes in the San Joaquin Valley. Calif. Agric. 2009, 63, 131–136. [Google Scholar] [CrossRef]
- Zhao, G.; Guo, D.; Wang, L.; Li, H.; Wang, C.; Guo, X. Functions of RPM1-interacting protein 4 in plant immunity. Planta 2021, 253, 11. [Google Scholar] [CrossRef]
- Zhang, H.L.; Deng, C.; Wu, X.; Yao, J.; Zhang, Y.L.; Zhang, Y.N.; Deng, S.R.; Zhao, N.; Zhao, R.; Zhou, X.Y.; et al. Populus euphratica remorin 6.5 activates plasma membrane H+-ATPases to mediate salt tolerance. Tree Physiol. 2020, 40, 731–745. [Google Scholar] [CrossRef]
- Yavari, N.; Tripathi, R.; Wu, B.S.; Macpherson, S.; Lefsrud, M. The effect of light quality on plant physiology, photosynthetic, and stress response in Arabidopsis thaliana leaves. PLoS ONE 2021, 16, e0247380. [Google Scholar] [CrossRef]
- Zhang, G.W.; Liu, Z.L.; Zhou, J.G.; Zhu, Y.L. Effects of Ca(NO3)2 stress on oxidative damage, antioxidant enzymes activities and polyamine contents in roots of grafted and non-grafted tomato plants. Plant Growth Regul. 2008, 56, 7–19. [Google Scholar] [CrossRef]
- Kobra, M.; Yahya, E.; Ali, N.; Mohammad, P.; Javad, A.M. P5CS expression level and proline accumulation in the sensitive and tolerant wheat cultivars under control and drought stress conditions in the presence/absence of silicon and salicylic acid. J. Plant Interact. 2018, 13, 461–471. [Google Scholar] [CrossRef]
- Jia, X.M.; Zhu, Y.F.; Hu, Y.; Zhang, R.; Cheng, L.; Zhu, Z.L.; Zhao, T.; Zhang, X.; Wang, Y.X. Integrated physiologic, proteomic, and metabolomic analyses of malus halliana adaptation to saline-alkali stress. Hortic. Res. 2019, 6, 19. [Google Scholar] [CrossRef] [Green Version]
- Xu, Z.; Chen, X.; Lu, X.; Zhao, B.; Liu, J. Integrative analysis of transcriptome and metabolome reveal mechanism of tolerance to salt stress in oat (Avena sativa L.). Plant Physiol. Biochem. 2021, 160, 315–328. [Google Scholar] [CrossRef]
- Giordano, M.; Petropoulos, S.A.; Rouphael, Y. Response and Defence Mechanisms of Vegetable Crops against Drought, Heat and Salinity Stress. Agriculture 2021, 11, 463. [Google Scholar] [CrossRef]
- Hanson, J.A.; Dietz, T.H. The role of free amino acids in cellular osmoregulation in the freshwater bivalve Ligumia subrostrata (Say). Can. J. Zool. 2011, 54, 1927–1931. [Google Scholar] [CrossRef]
- Holland, C.K.; Lee, S.G. Amino Acids|Sulfur Amino Acid Metabolism. J. Jez. Oxford. 2021, 1, 114–126. [Google Scholar] [CrossRef]
- Abdel-Farid, I.B.; Marghany, M.R.; Rowezek, M.M.; Sheded, M.G. Effect of Salinity Stress on Growth and Metabolomic Profiling of Cucumis sativus and Solanum lycopersicum. Plants 2020, 9, 1626. [Google Scholar] [CrossRef]
- Zhao, T.; Wu, T.; Pei, T.; Wang, Z.; Yang, H.; Jiang, J.; Zhang, H.; Chen, X.; Li, J.; Xu, X. Overexpression of SlGATA17 Promotes Drought Tolerance in Transgenic Tomato Plants by Enhancing Activation of the Phenylpropanoid Biosynthetic Pathway. Front. Plant Sci. 2021, 12, 634888. [Google Scholar] [CrossRef]
- Laizet, Y.; Pontier, D.; Mache, R.; Kuntz, M. Subfamily Organization and Phylogenetic Origin of Genes Encoding Plastid Lipid-Associated Proteins of the Fibrillin Type. J. Genome Sci. Technol. 2004, 3, 19–28. [Google Scholar] [CrossRef]
- Singh, D.K.; McNellis, T.W. Fibrillin protein function: The tip of the iceberg? Trends Plant Sci. 2011, 16, 432–441. [Google Scholar] [CrossRef]
- Yang, Y.; Sulpice, R.; Himmelbach, A.; Meinhard, M.; Christmann, A.; Grill, E. Fibrillin expression is regulated by abscisic acid response regulators and is involved in abscisic acid-mediated photoprotection. Proc. Natl. Acad. Sci. USA 2006, 103, 6061–6066. [Google Scholar] [CrossRef]
- Youssef, A.; Laizet, Y.; Block, M.A.; Maréchal, E.; Alcaraz, J.P.; Larson, T.R.; Pontier, D.; Gaffé, J.; Kuntz, M. Plant lipid-associated fibrillin proteins condition jasmonate production under photosynthetic stress. Plant J. 2010, 61, 436–445. [Google Scholar] [CrossRef]
- Li, J.; Yang, J.; Zhu, B.; Xie, G. Overexpressing OsFBN1 enhances plastoglobule formation, reduces grain-filling percent and jasmonate levels under heat stress in rice. Plant Sci. 2019, 285, 230–238. [Google Scholar] [CrossRef]
- Yuan, Z.; Long, W.; Hu, H.; Liang, T.; Luo, X.; Hu, Z.; Zhu, R.; Wu, X. Genome-Wide Identification and Expansion Patterns of SULTR Gene Family in Gramineae Crops and Their Expression Profiles under Abiotic Stress in Oryza sativa. Genes 2021, 12, 634. [Google Scholar] [CrossRef]
- Huang, Q.; Wang, M.P.; Xia, Z.L. The SULTR gene family in maize (Zea mays L.): Gene cloning and expression analyses under sulfate starvation and abiotic stress. J. Plant Physiol. 2018, 220, 24–33. [Google Scholar] [CrossRef]
- Cao, M.J.; Wang, Z.; Zhao, Q.; Mao, J.L.; Speiser, A.; Wirtz, M.; Hell, R.; Zhu, J.K.; Xiang, C.B. Sulfate availability affects ABA levels and germination response to ABA and salt stress in Arabidopsis thaliana. Plant J. 2014, 77, 604–615. [Google Scholar] [CrossRef]
- Zhang, Y.N.; Wang, Y.; Zhang, H.L.; Yao, J.; Deng, J.Y.; Zhao, R.; Shen, X.; Chen, S.L. Over-expression of PeRIN4 enhanced salinity tolerance through up-regulation of PM H+-ATPase in Arabidopsis thaliana. J. Beijing For. Univ. 2017, 39, 1–8. [Google Scholar] [CrossRef]
- Qi, Y.; Zhang, C.; Zhao, T.; Yao, M.; Xu, X. A Genome-Wide Analysis of GATA Transcription Factor Family in Tomato and Analysis of Expression Patterns. Int. J. Agric. Biol. Eng. 2018, 20, 1274–1282. [Google Scholar] [CrossRef]
- Shi, J.N.; Liu, M.Q.; Liu, J.; Chen, Y.Z.; Lu, C.F. Sequence analysis and expression pattern of AmZFPG encoding a GATA type zinc finger protein in Ammopiptanthus mongolicus. J. Beijing For. Univ. 2011, 33, 21–25. [Google Scholar] [CrossRef]
- Gururani, M.A.; Ganesan, M.; Song, I. Transgenic turfgrasses expressing hyperactive Ser599Ala phytochrome A mutant exhibit abiotic stress tolerance. Plant Growth Regul. 2016, 35, 11–21. [Google Scholar] [CrossRef]
- Cakmak, I.; Horst, W.J. Effect of aluminium on lipid peroxidation, superoxide dismutase, catalase, and peroxidase activities in root tips of soybean (Glycine max). Physiol. Plant. 1991, 83, 3. [Google Scholar] [CrossRef]
- Beauchamp, C.; Fridovich, I. Superoxide dismutase: Improved assays and an assay applicable to acrylamide gels. Anal. Biochem. 1971, 44, 276–287. [Google Scholar] [CrossRef]
- Kraus, T.E.; Fletcher, R.A. Paclobutrazol Protects Wheat Seedlings from Heat and Paraquat Injury.Is Detoxification of Active Oxygen Involved? Plant Cell Physiol. 1994, 35, 45–52. [Google Scholar]
- Chance, B.; Maehly, A.C. Assay of catalase and peroxidases. Methods Enzymol. 1955, 2, 764–775. [Google Scholar] [CrossRef]
- Zhou, X.T.; Zhao, H.L.; Cao, K.; Hu, L.P.; Du, T.H.; Baluška, F.; Zou, Z.R. Beneficial Roles of Melatonin on Redox Regulation of Photosynthetic Electron Transport and Synthesis of D1 Protein in Tomato Seedlings under Salt Stress. Front. Plant Sci. 2016, 7, 1823. [Google Scholar] [CrossRef]
- Baker, N.R. Chlorophyll fluorescence: A probe of photosynthesis in vivo. Annu. Rev. Plant Biol. 2008, 59, 89–113. [Google Scholar] [CrossRef]
- Kim, D.; Langmead, B.; Salzberg, S.L. HISAT: A fast spliced aligner with low memory requirements. Nat. Methods. 2015, 12, 357–360. [Google Scholar] [CrossRef]
- Langfelder, P.; Horvath, S. WGCNA: An R package for weighted correlation network analysis. BMC Bioinf. 2019, 9, 559. [Google Scholar] [CrossRef] [Green Version]


| Treatment | Nutrient Solution | Light Source |
|---|---|---|
| CK | 1/2 Hoagland’s solution | white LED (R:FR = 4.2) |
| L | 1/2 Hoagland’s solution | white LED + far-red LED (R:FR = 0.7) |
| S | 1/2 Hoagland’s solution Including 160 mM of Ca(NO3)2 | white LED (R:FR = 4.2) |
| SL | 1/2 Hoagland’s solution Including 160 mM of Ca(NO3)2 | white LED + far-red LED (R:FR = 0.7) |
Disclaimer/Publisher’s Note: The statements, opinions and data contained in all publications are solely those of the individual author(s) and contributor(s) and not of MDPI and/or the editor(s). MDPI and/or the editor(s) disclaim responsibility for any injury to people or property resulting from any ideas, methods, instructions or products referred to in the content. |
© 2023 by the authors. Licensee MDPI, Basel, Switzerland. This article is an open access article distributed under the terms and conditions of the Creative Commons Attribution (CC BY) license (https://creativecommons.org/licenses/by/4.0/).
Share and Cite
Zhou, X.; Huang, J.; Gan, Y.; Li, Z.; Su, L.; He, Z.; Yang, J.; Wang, Z.; Jiang, C.; Huang, Z.; et al. Transcriptome Mechanisms of Tomato Seedlings Induced by Low-Red to Far-Red Light Ratio under Calcium Nitrate Stress. Int. J. Mol. Sci. 2023, 24, 3738. https://doi.org/10.3390/ijms24043738
Zhou X, Huang J, Gan Y, Li Z, Su L, He Z, Yang J, Wang Z, Jiang C, Huang Z, et al. Transcriptome Mechanisms of Tomato Seedlings Induced by Low-Red to Far-Red Light Ratio under Calcium Nitrate Stress. International Journal of Molecular Sciences. 2023; 24(4):3738. https://doi.org/10.3390/ijms24043738
Chicago/Turabian StyleZhou, Xiaoting, Jia Huang, Yirong Gan, Zelin Li, Lihong Su, Zhongqun He, Junwei Yang, Zhihui Wang, Chengyao Jiang, Zhi Huang, and et al. 2023. "Transcriptome Mechanisms of Tomato Seedlings Induced by Low-Red to Far-Red Light Ratio under Calcium Nitrate Stress" International Journal of Molecular Sciences 24, no. 4: 3738. https://doi.org/10.3390/ijms24043738