

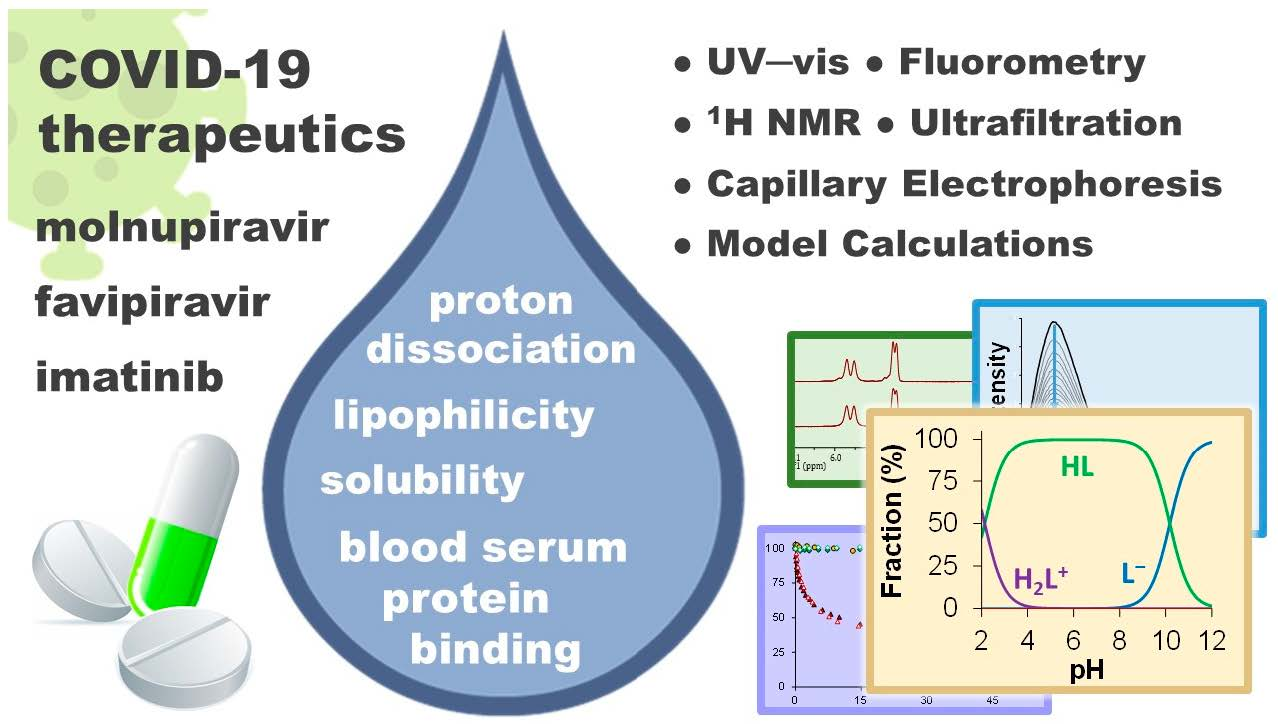
Evaluation of In Vitro Distribution and Plasma Protein Binding of Selected Antiviral Drugs (Favipiravir, Molnupiravir and Imatinib) against SARS-CoV-2

Abstract
:
1. Introduction
2. Results and Discussion
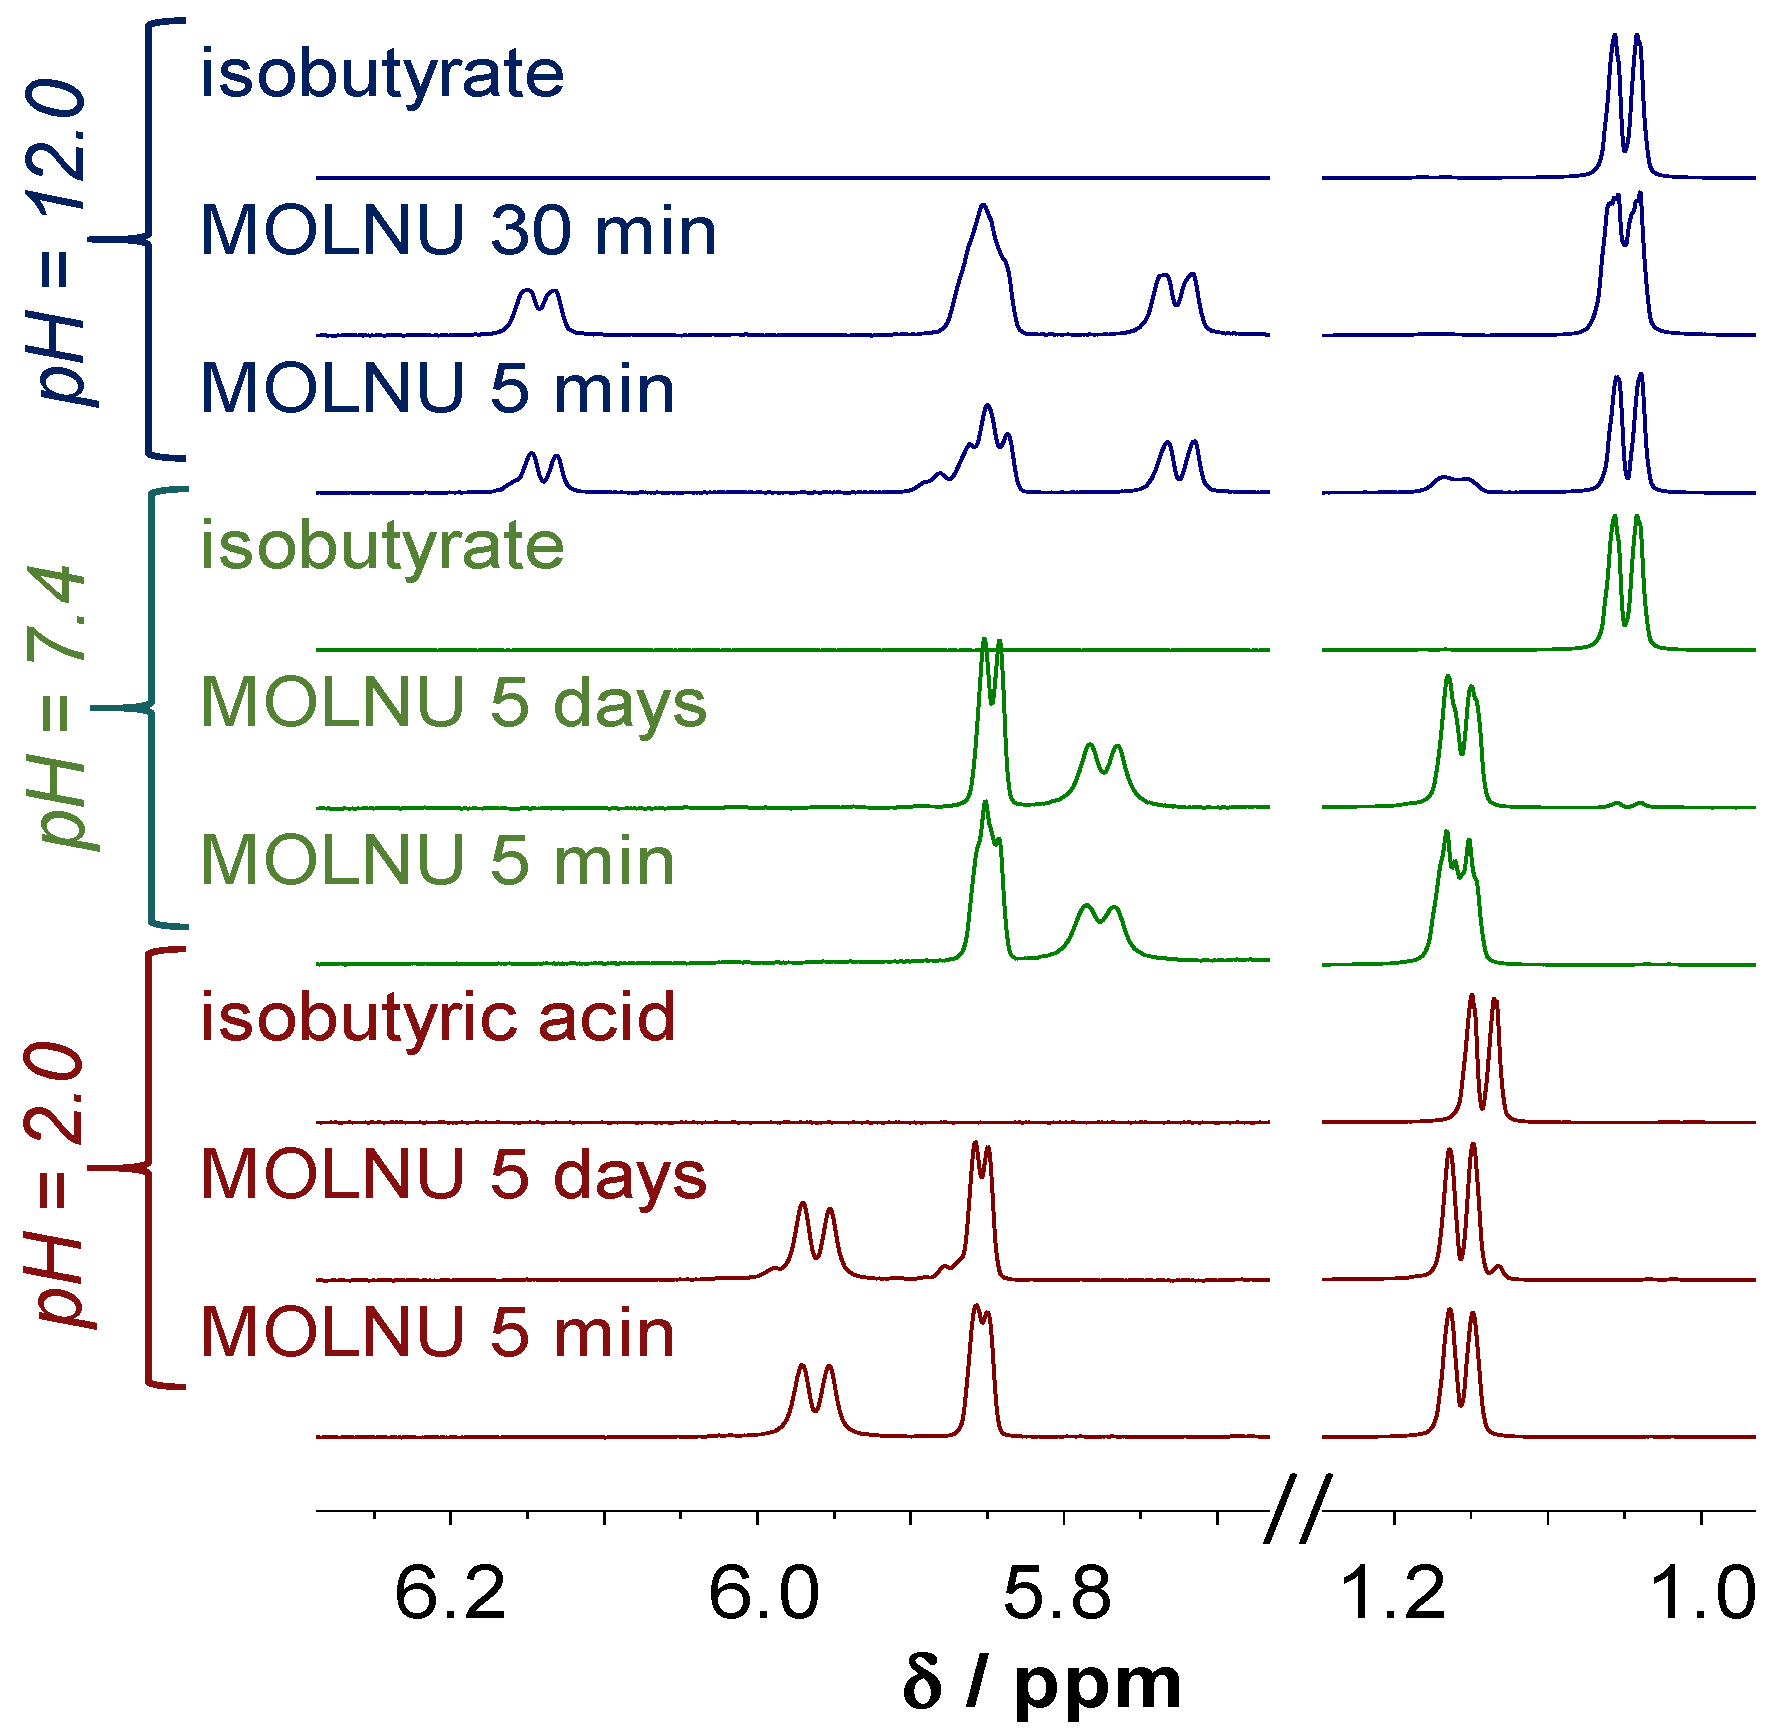
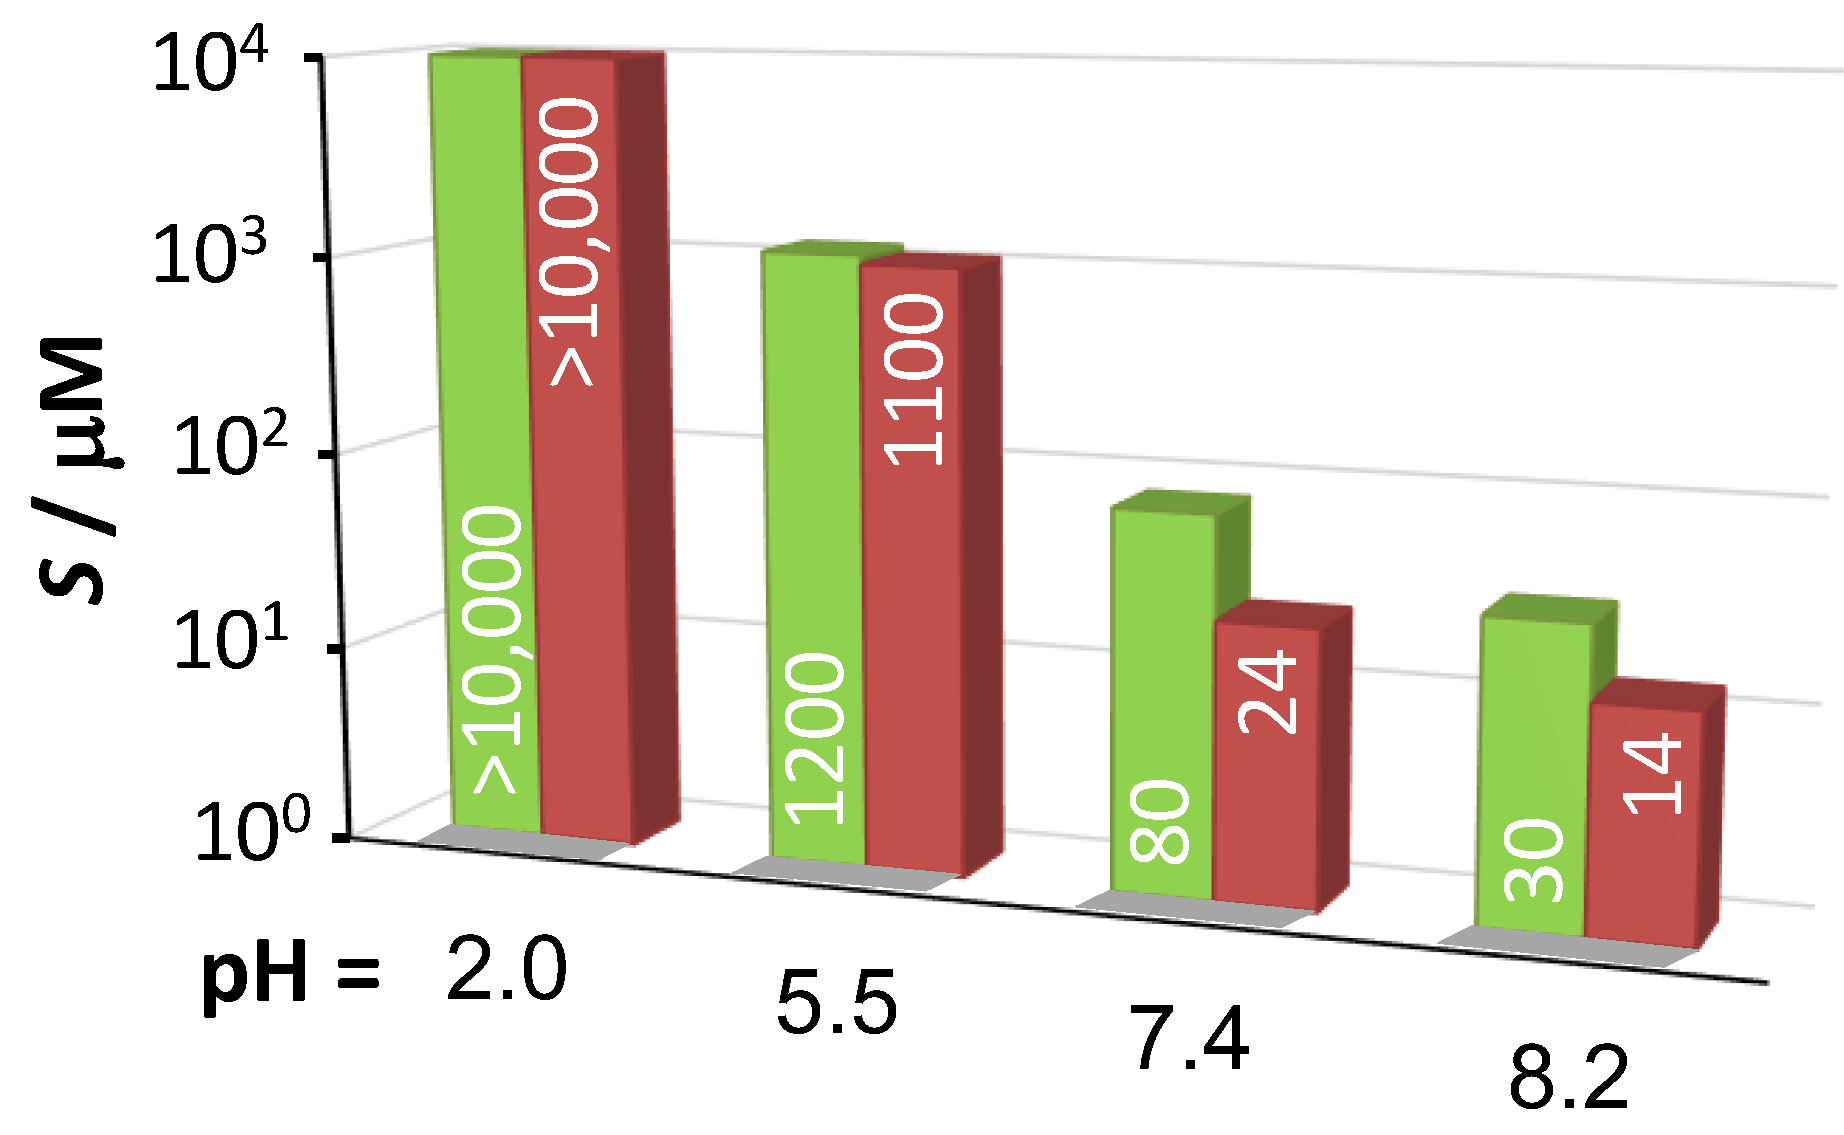
2.1. Aqueous Stability and Solubility
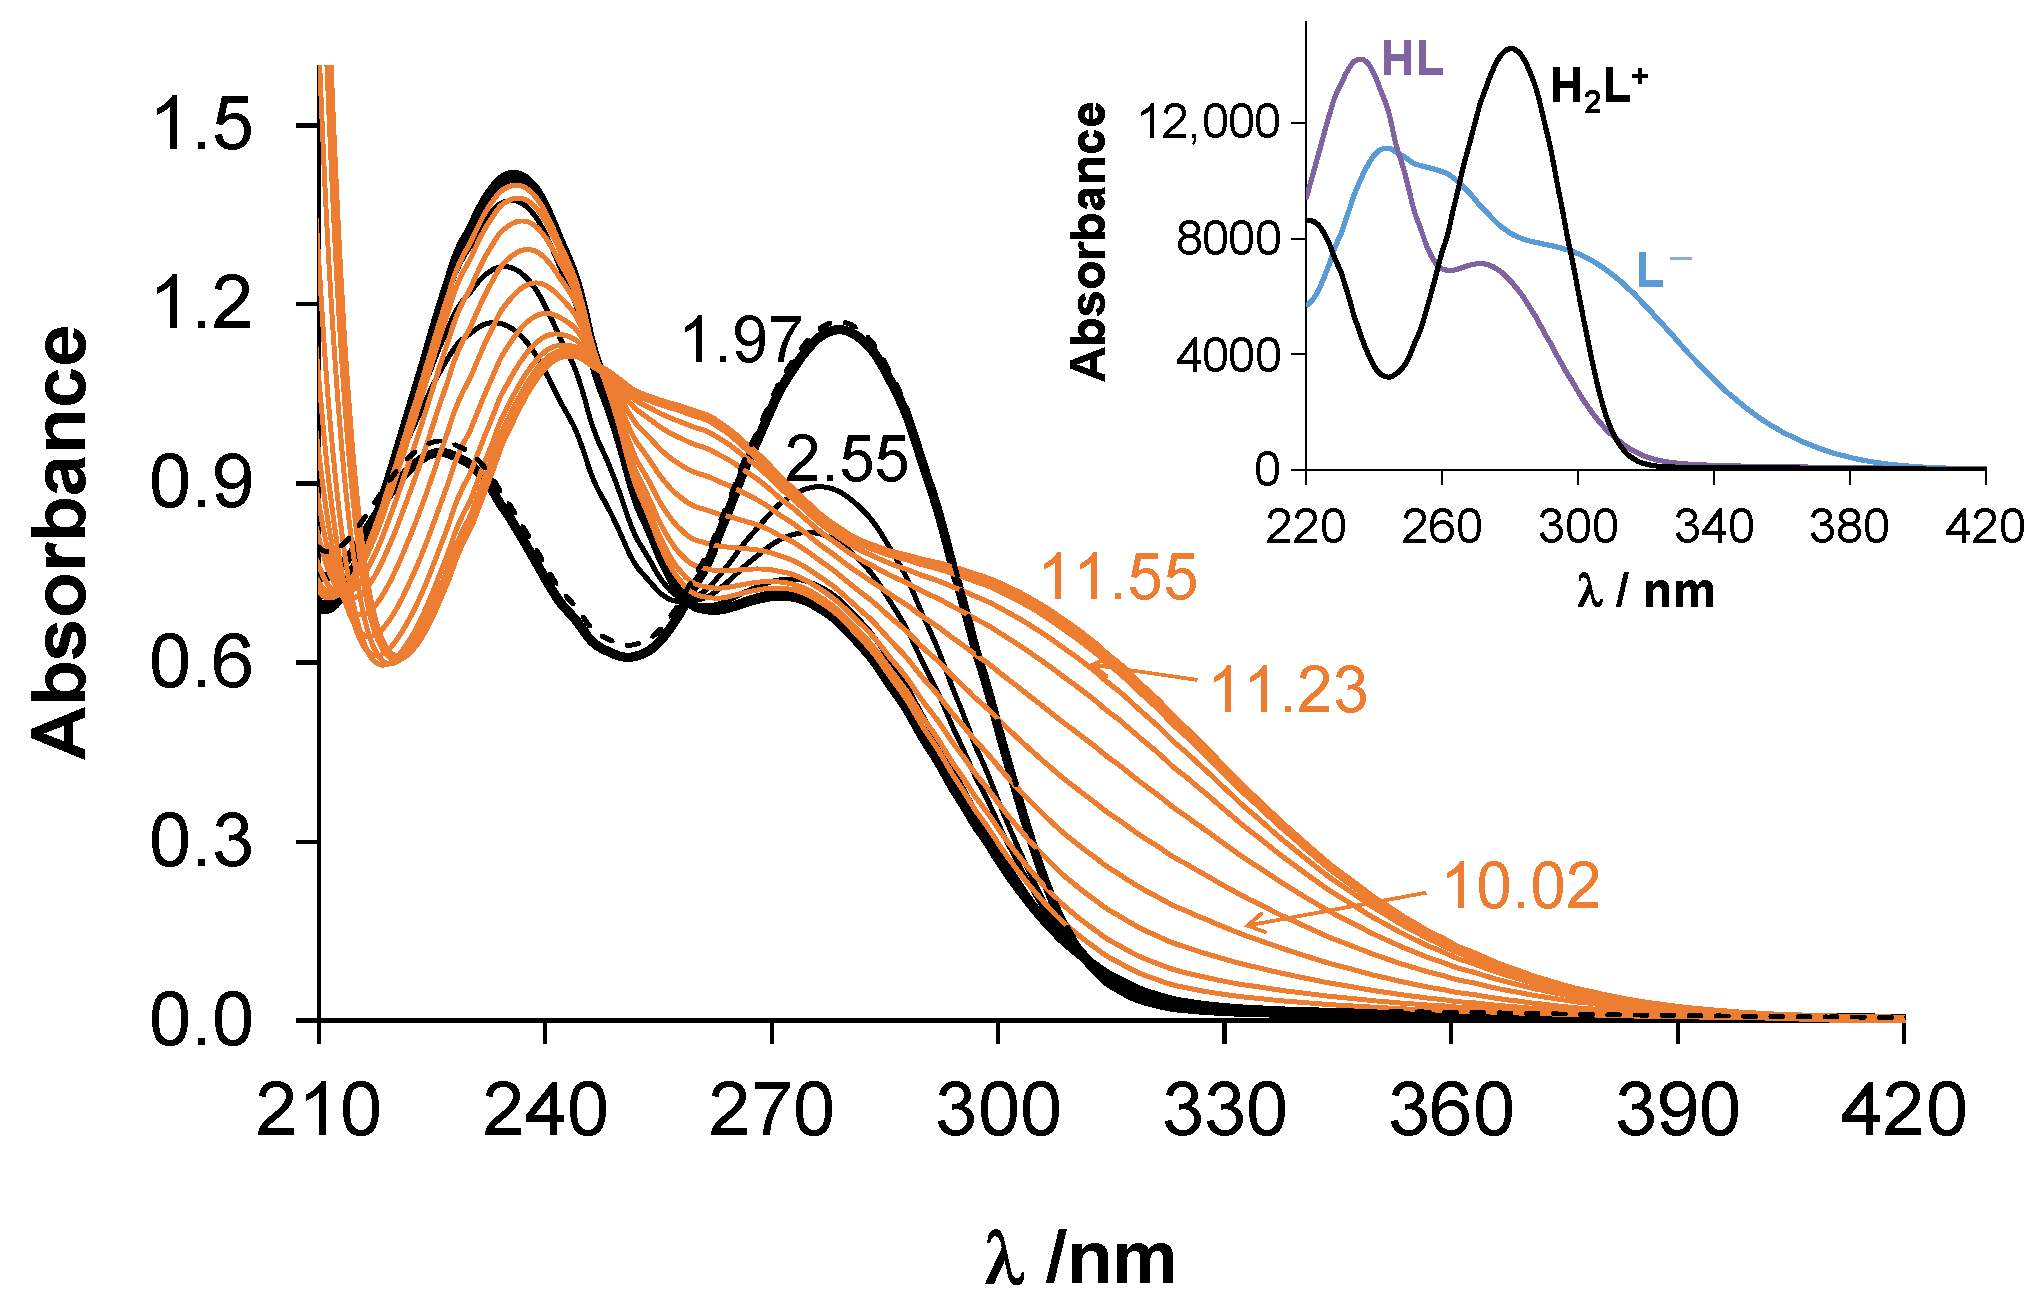
2.2. Proton Dissociation Processes

| IMA | FAVI | MOLNU | |
|---|---|---|---|
| Proton dissociation processes | |||
| pKa1 1.72 ± 0.01 (UV-vis) pKa2 3.06 ± 0.05 (pHm) pKa3 3.86 ± 0.03 (pHm) pKa4 >7.0 (pHm) 7.9 ± 0.1 (o/w part.) | pKa1 5.11 ± 0.01 (pHm) 5.08 ± 0.01 (UV-vis) 5.17 ± 0.01 (fluor) 5.1 ± 0.1 (o/w part.) | pKa1 2.14 ± 0.01 (pHm) 2.11 ± 0.01 (UV-vis) pKa2 10.18 ± 0.02 (pHm) 10.34 ± 0.01 (UV-vis) | |
| n-octanol/water distribution | |||
| logD2.0 25 °C | −2.6 ± 0.01 | +0.15 ± 0.01 | −0.68 ± 0.02 a |
| logD7.4 25 °C | +2.4 ± 0.1 | −1.99 ± 0.06 | −0.29 ± 0.02 a |
| logD7.4 37 °C | +2.9 ± 0.1 | −1.82 ± 0.05 | −0.17 ± 0.03 |
| Species at pH 7.4 | |||
| HL+: 76% b L: 24% c | L−:100% | HL: 100% | |
| Species at pH 2.0 | |||
| H4L4+: 33% H3L3+: 62% | HL:100% | H2L+: 58% HL: 42% | |
| H2L2+: 5% | |||
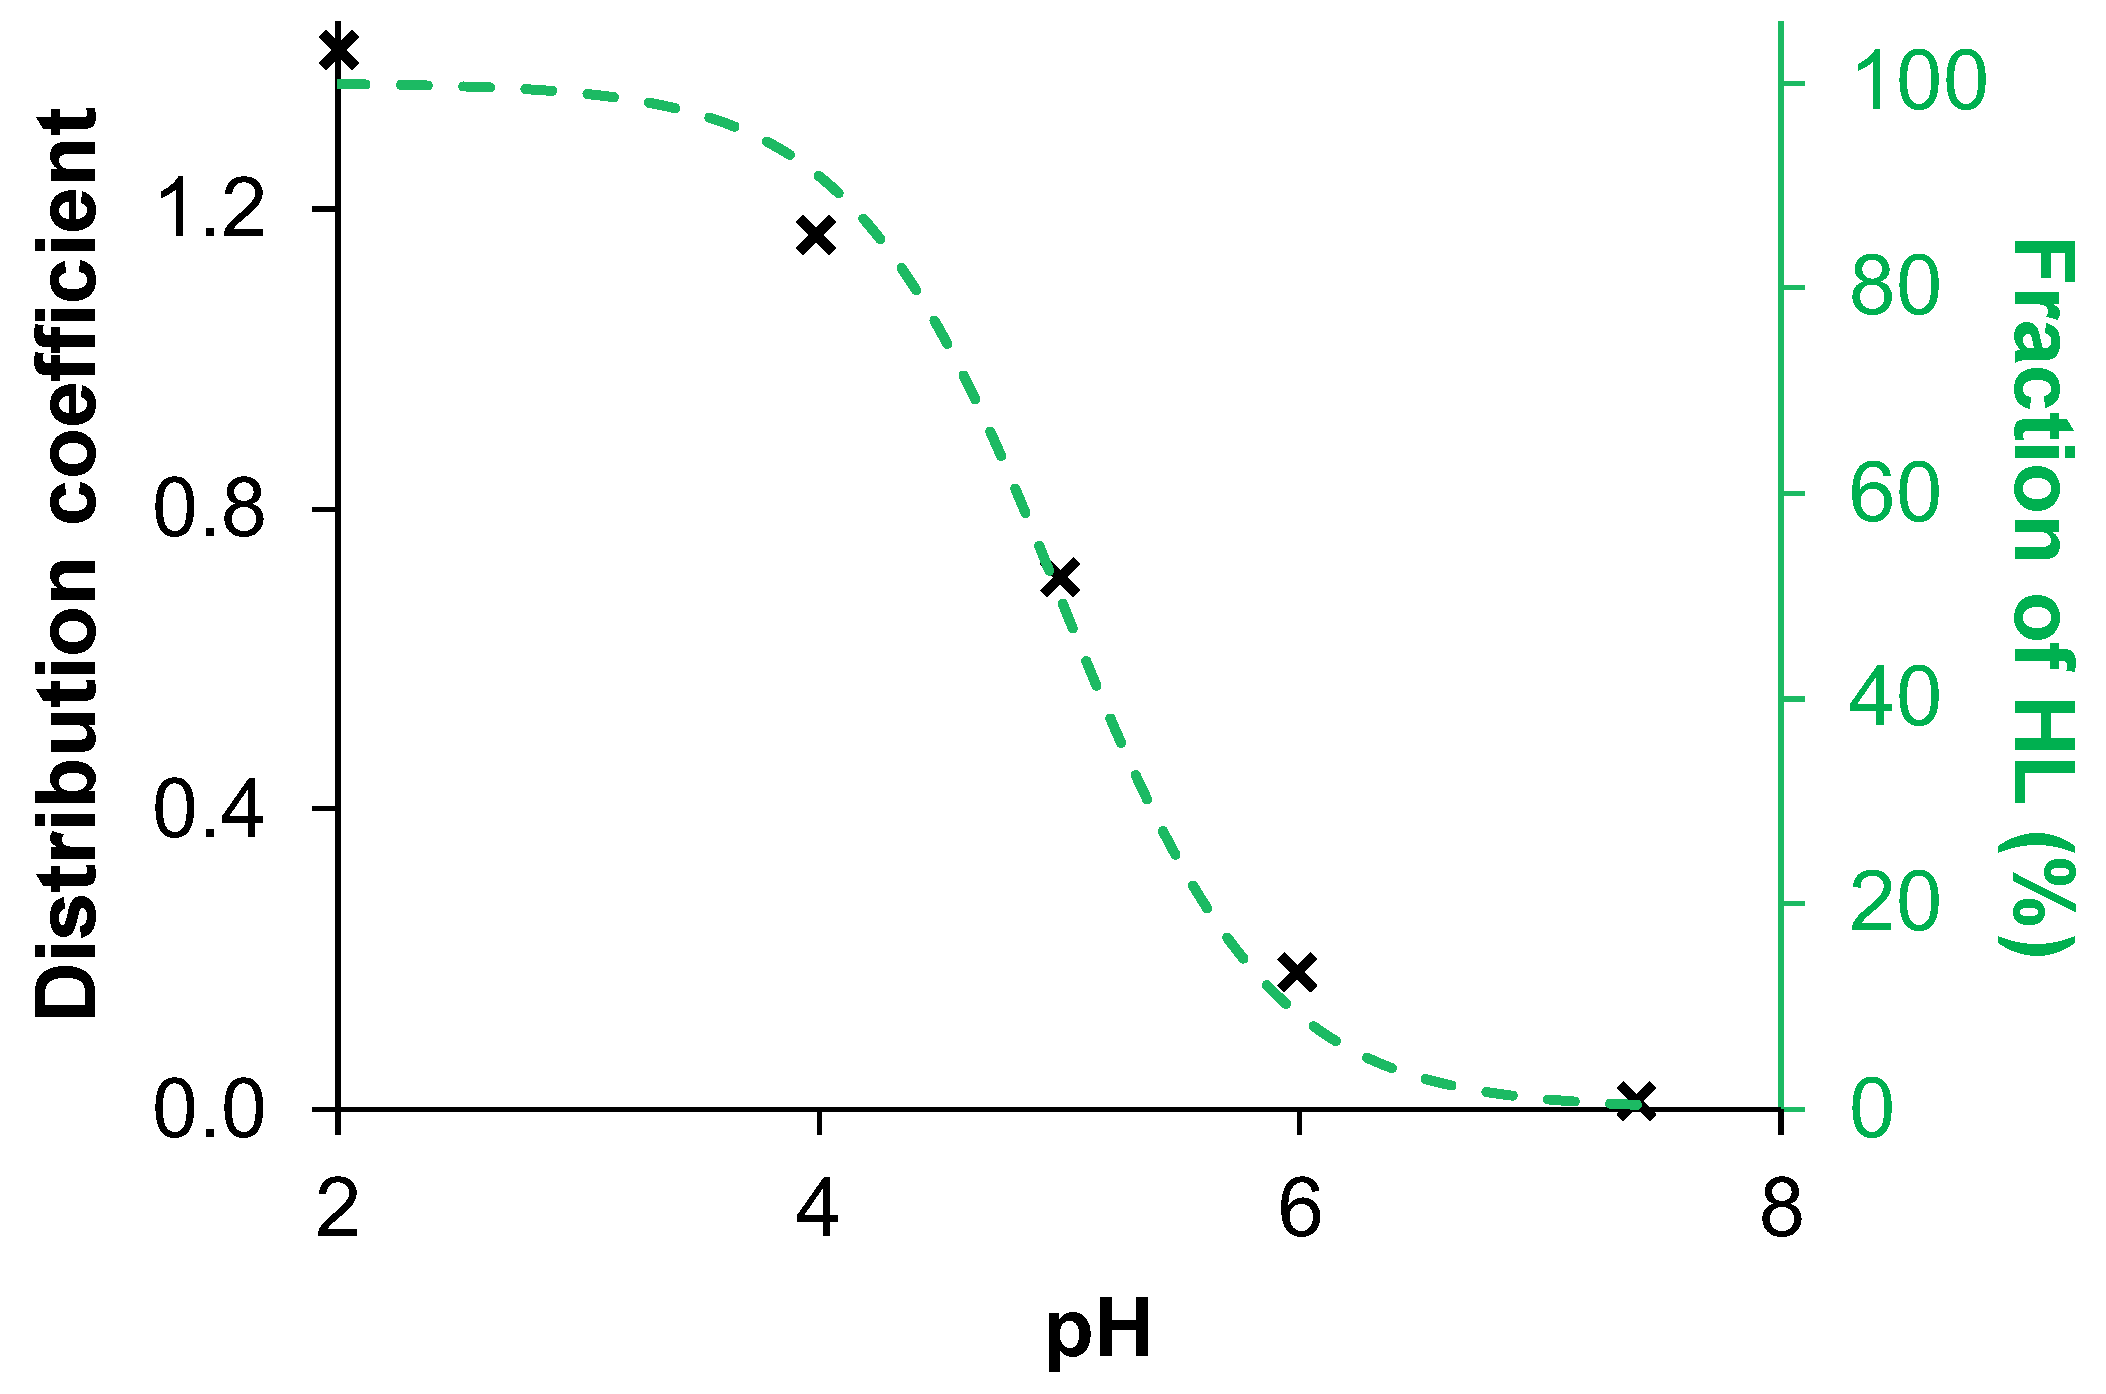
2.3. Lipophilicity
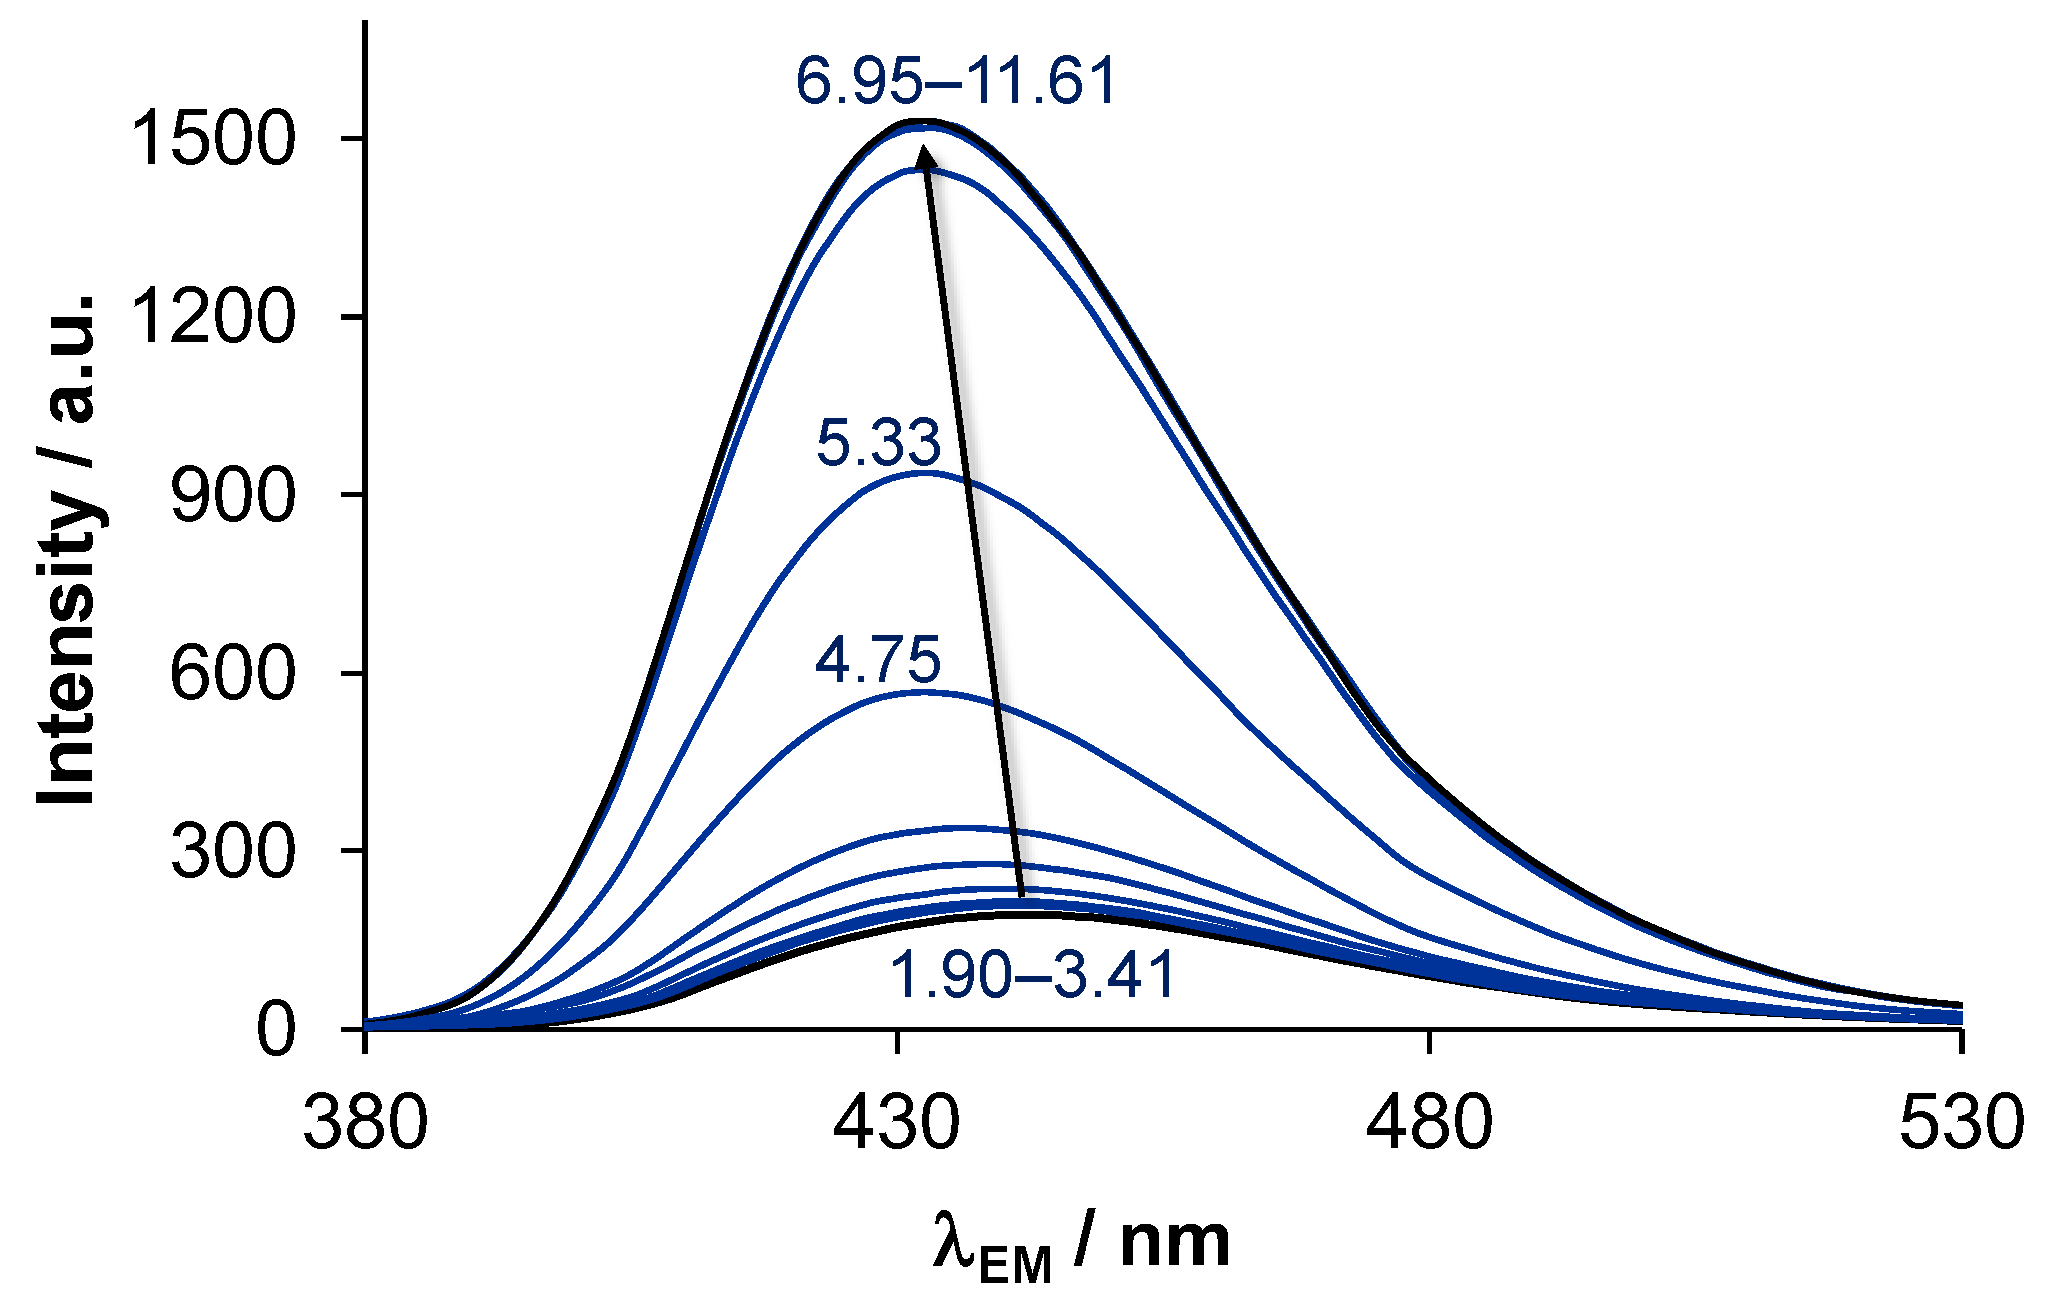
2.4. Fluorescence Properties of FAVI and IMA
2.5. Interaction with Blood Serum Proteins Human Serum Albumin and α1-Acid Glycoprotein
2.6. Discussion of the In Vitro Blood Serum Distribution of the Compounds
3. Materials and Methods
3.1. Materials
3.2. Stock Solutions and Sample Preparation
3.3. pH-Potentiometry
3.4. Thermodynamic Solubility (S)
3.5. Lipophilicity
3.6. 1H NMR Spectroscopy
3.7. Spectrofluorometry
3.8. UV-Visible Spectrophotometry
3.9. Ultrafiltration
3.10. Capillary Electrophoresis
3.11. Model Calculations
4. Conclusions
Supplementary Materials
Author Contributions
Funding
Institutional Review Board Statement
Informed Consent Statement
Data Availability Statement
Conflicts of Interest
References
- Bernal, A.J.; Gomes da Silva, M.M.; Musungaie, D.B.; Kovalchuk, E.; Gonzalez, A.; Delos Reyes, V.; Martín-Quirós, A.; Caraco, Y.; Williams-Diaz, A.; Brown, M.L.; et al. Molnupiravir for Oral Treatment of COVID-19 in Nonhospitalized Patients. N. Engl. J. Med. 2021, 386, 509–520. [Google Scholar] [CrossRef]
- Ghasemnejad-Berenji, M.; Pashapour, S. Favipiravir and COVID-19: A Simplifed Summary. Drug Res. 2021, 71, 166–170. [Google Scholar] [CrossRef] [PubMed]
- Zhong, J.; Tang, J.; Ye, C.; Dong, L. The immunology of COVID-19: Is immune modulation an option for treatment? Lancet Rheumatol. 2020, 2, e428–e436. [Google Scholar] [CrossRef] [PubMed]
- Felsenstein, S.; Herbert, J.A.; McNamara, P.S.; Hedrich, C.M. COVID-19: Immunology and treatment options. Clin. Immunol. 2020, 215, 108448. [Google Scholar] [CrossRef]
- Shiraki, K.; Daikoku, T. Favipiravir, an anti-influenza drug against life-threatening RNA virus infections. Pharmacol. Ther. 2020, 209, 107512. [Google Scholar] [CrossRef]
- Furuta, Y.; Komeno, T.; Nakamura, T. Favipiravir (T-705), a broad spectrum inhibitor of viral RNA polymerase. Proc. Jpn. Acad. Ser. B Phys. Biol. Sci. P. 2017, 93, 449–463. [Google Scholar] [CrossRef]
- Imran, M.; Arora, M.K.; Asdaq, S.M.B.; Khan, S.A.; Alaqel, S.I.; Alshammari, M.K.; Alshehri, M.M.; Alshrari, A.S.; Ali, A.M.; Al-shammeri, A.M.; et al. Abida, Discovery, Development, and Patent Trends on Molnupiravir: A Prospective Oral Treatment for COVID-19. Molecules 2021, 26, 5795. [Google Scholar] [CrossRef] [PubMed]
- Fact Sheet on Lagevrio for Healthcare Providers, Food and Drug Administration, USA. Available online: https://www.google.com/url?sa=t&rct=j&q=&esrc=s&source=web&cd=&ved=2ahUKEwjDotWU9rb5AhUihv0HHbKdD18QFnoECAMQAQ&url=https%3A%2F%2Fwww.fda.gov%2Fmedia%2F155054%2Fdownload&usg=AOvVaw3qU8nc9v1fTeeYaUUYTX8Q (accessed on 1 November 2022).
- Toots, M.; Yoon, J.-J.; Cox, R.M.; Hart, M.; Sticher, Z.M.; Makhsous, N.; Plesker, R.; Barrena, A.H.; Reddy, P.G.; Mitchell, D.G.; et al. Characterization of orally efficacious influenza drug with high resistance barrier in ferrets and human airway epithelia. Sci. Transl. Med. 2019, 11, eaax5866. [Google Scholar] [CrossRef]
- Rosenke, K.; Hansen, F.; Schwarz, B.; Feldmann, F.; Haddock, E.; Rosenke, R.; Barbian, K.; Meade-White, K.; Okumura, A.; Leventhal, S.; et al. Orally delivered MK-4482 inhibits SARS-CoV-2 replication in the Syrian hamster model. Nat. Commun. 2021, 12, 2295. [Google Scholar] [CrossRef]
- Breccia, M.; Abruzzese, E.; Bocchia, M.; Bonifacio, M.; Castagnetti, F.; Fava, C.; Galimberti, S.; Gozzini, A.; Gugliotta, G.; Iurlo, A.; et al. Chronic myeloid leukemia management at the time of the COVID-19 pandemic in Italy. A campus CML survey. Leukemia 2020, 34, 2260–2261. [Google Scholar] [CrossRef]
- Morales-Ortega, A.; Rivas-Prado, L.; Frutos-Pérez, B.; Jaenes-Barrios, B.; Farfán-Sedano, A.I.; García-Parra, C.J.; Hernández-Muniesa, B.; Duarte-Millán, M.Á.; Madroñal-Cerezo, M.E.; Ontañón-Nasarre, A.; et al. Early clinical experience with imatinib in COVID-19: Searching for a dual effect. J. Infect. 2021, 82, 186–230. [Google Scholar] [CrossRef] [PubMed]
- Bernal-Bello, D.; Morales-Ortega, A.; Farfán-Sedano, A.I.; de Tena, J.G.; San Martín-López, J.V. Imatinib in COVID-19: Hope and caution. Lancet 2021, 9, 938–939. [Google Scholar] [CrossRef] [PubMed]
- Report on the Deliberation Results of Avigan, Evaluation and Licensing Division, Pharmaceutical and Food Safety Bureau, Japan. 2014. Available online: https://www.google.com/url?sa=t&rct=j&q=&esrc=s&source=web&cd=&ved=2ahUKEwi5o9jB67b5AhU4g_0HHb65CkgQFnoECAMQAQ&url=https%3A%2F%2Fwww.pmda.go.jp%2Ffiles%2F000210319.pdf&usg=AOvVaw3TkoBl8Vr660a8OFm-CtE3 (accessed on 1 November 2022).
- Product Assessment Report of Molnupiravir, European Medicines Agency, European Union. 2022. Available online: https://www.google.com/url?sa=t&rct=j&q=&esrc=s&source=web&cd=&cad=rja&uact=8&ved=2ahUKEwj4lcP16rv5AhWchv0HHcLtDW0QFnoECAIQAQ&url=https%3A%2F%2Fwww.ema.europa.eu%2Fen%2Fdocuments%2Freferral%2Flagevrio-also-known-molnupiravir-mk-4482-covid-19-article-53-procedure-assessment-report_en.pdf&usg=AOvVaw3l1W4pGFCLhRRx3AAV3n7Q (accessed on 1 November 2022).
- Drugbank Datasheet of Molnupiravir. Available online: https://go.drugbank.com/drugs/DB15661 (accessed on 1 November 2022).
- Datasheet of Favipiravir (CID=492405) in PubChem Database, National Institutes of Health, USA. Available online: https://www.google.com/url?sa=t&rct=j&q=&esrc=s&source=web&cd=&cad=rja&uact=8&ved=2ahUKEwjQ6J-_-sX5AhVc57sIHRyoAbsQFnoECAIQAQ&url=https%3A%2F%2Fpubchem.ncbi.nlm.nih.gov%2Fcompound%2FFavipiravir&usg=AOvVaw0n7yFNzOZ5eAh_frYbg5F6 (accessed on 1 September 2022).
- Joshi, S.; Parkar, J.; Ansari, A.; Vora, A.; Talwar, D.; Tiwaskar, M.; Patil, S.; Barkate, H. Role of favipiravir in the treatment of COVID-19. Int. J. Infect. Dis. 2021, 102, 501–508. [Google Scholar] [CrossRef] [PubMed]
- Siripongboonsitti, T.; Ungtrakul, T.; Watanapokasin, N.; Timsri, P.; Wongpakdee, K.; Wattanasin, P.; Pavitrapok, C.; Khunvichai, A.; Jamnongtanachot, P.; Mueannoom, W.; et al. Pharmacokinetic Comparison of Favipiravir Oral Solution and Tablet Formulations in Healthy Thai Volunteers. Clin. Pharmacol. Drug. Dev. 2022, 12, 14–20. [Google Scholar] [CrossRef] [PubMed]
- Mentré, F.; Taburet, A.-M.; Guedj, J.; Anglaret, X.; Keïta, S.; Lamballerie, X.; Malvy, D. Dose regimen of favipiravir for Ebola virus disease. Lancet Infect. Dis. 2015, 15, 150–151. [Google Scholar] [CrossRef]
- Du, Y.-X.; Chen, X.-P. Favipiravir: Pharmacokinetics and Concerns About Clinical Trials for 2019-nCoV Infection. Clin. Pharmacol. Ther. 2020, 108, 242–247. [Google Scholar] [CrossRef]
- Megahed, S.M.; Habib, A.A.; Hammad, S.F.; Kamal, A.H. Experimental design approach for development of spectrofluorimetric method for determination of favipiravir; a potential therapeutic agent against COVID-19 virus: Application to spiked human plasma. Spectrochim. Acta A Mol. Biomol. Spectrosc. 2021, 249, 119241. [Google Scholar] [CrossRef]
- Turan, Ç.; Metin, N.; Utlu, Z.; Yıldız, T.T.; Sakat, S.C. Evaluation of the frequency and intensity of favipiravir-associated yellow-green fluorescence in lunulae, hair, and face. J. Cosmet. Dermatol. 2022, 21, 1199–1207. [Google Scholar]
- Kayıran, M.A.; Cebeci, F.; Erdemir, V.A.; Aksoy, H.; Akdeniz, N.; Gürel, M.S. Fluorescence of nails and hair on Wood’s lamp examination in Covid pandemic; undefined effect of Favipiravir in humans. Dermatol. Ther. 2021, 34, e14740. [Google Scholar] [CrossRef]
- Doran, M.A.; Aytogan, H.; Ayintap, E. Fluorescence of ocular surface in a Covid -19 patient after Favipiravir treatment: A case report. Virol. J. 2021, 18, 146. [Google Scholar] [CrossRef]
- Fitos, I.; Visy, J.; Zsila, F.; Mády, G.; Simonyi, M. Selective binding of imatinib to the genetic variants of human α1-acid glycoprotein. Biochim. Biophys. Acta 2006, 1760, 1704–1712. [Google Scholar] [CrossRef] [PubMed]
- Mic, M.; Pîrnău, A.; Floare, C.G.; Bogdan, M. Study of the binding affinity between imatinib and α-1 glycoprotein using nuclear spin relaxation and isothermal titration calorimetry. Int. J. Biol. Macromol. 2020, 147, 326–332. [Google Scholar] [CrossRef] [PubMed]
- Di Muzio, E.; Polticelli, F.; Trezza, V.; Fanali, G.; Fasano, M.; Ascenzi, P. Imatinib binding to human serum albumin modulates heme association and reactivity. Arch. Biochem. Biophys. 2014, 560, 100–112. [Google Scholar] [CrossRef] [PubMed]
- Delbaldo, C.; Chatelut, E.; Re, M.; Deroussent, A.; Seronie-Vivien, S.; Jambu, A.; Berthaud, P.; Cesne, A.L.; Blay, J.-Y.; Vassal, G. Pharmacokinetic-pharmacodynamic relationships of imatinib and its main metabolite in patients with advanced gastrointestinal stromal tumors. Clin. Cancer. Res. 2006, 12, 6073–6078. [Google Scholar] [CrossRef]
- Beckmann, S.; Long, T.; Scheld, C.; Geyer, R.; Caffrey, C.R.; Grevelding, C.G. Serum albumin and a-1 acid glycoprotein impede the killing of Schistosoma mansoni by the tyrosine kinase inhibitor Imatinib. Int. J. Parasitol-Drug. 2014, 4, 287–295. [Google Scholar] [CrossRef]
- Hegde, A.H.; Punith, R.; Seetharamappa, J. Optical, structural and thermodynamic studies of the association of an anti-leucamic drug imatinib mesylate with transport protein. J. Fluoresc. 2012, 22, 521–528. [Google Scholar] [CrossRef]
- Gambacorti-Passerini, C.; Barni, R.; Coutre, P.; Zucchetti, M.; Cabrita, G.; Cleris, L.; Rossi, F.; Gianazza, E.; Brueggen, J.; Cozens, R.; et al. Role of α1 acid glycoprotein in the in vivo resistance of human BCR-ABL+ leukemic cells to the Abl inhibitor STI571. J. Natl. Cancer Inst. 2000, 92, 1641–1650. [Google Scholar] [CrossRef]
- Gambacorti-Passerini, C.; Zucchetti, M.; Russo, D.; Frapolli, R.; Verga, M.; Bungaro, S.; Tornaghi, L.; Rossi, F.; Pioltelli, P.; Pogliani, E.; et al. α1 acid glycoprotein binds to imatinib (STI571) and substantially alters its pharmacokinetics in chronic myeloid leukemia patients. Clin. Cancer Res. 2003, 9, 625–632. [Google Scholar]
- Hochepied, T.; Berger, F.G.; Baumann, H.; Libert, C. α1-Acid glycoprotein: An acute phase protein with inflammatory and immunomodulating properties. Cytokine Growth Factor Rev. 2003, 14, 25–34. [Google Scholar] [CrossRef]
- Jain, S.; Gautam, V.; Naseem, S. Acute-phase proteins: As diagnostic tool. J. Pharm. Bioallied Sci. 2011, 1, 118–127. [Google Scholar] [CrossRef]
- Bteich, M. An overview of albumin and alpha-1-acid glycoprotein main characteristics: Highlighting the roles of amino acids in binding kinetics and molecular interactions. Heliyon 2019, 5, e02879. [Google Scholar] [CrossRef] [PubMed]
- Peters, T. All about Albumin: Biochemistry, Genetics and Medical Applications; Academic Press: San Diego, CA, USA, 1996. [Google Scholar]
- Larghero, J.; Leguay, T.; Mourah, S.; Madelaine-Chambrin, I.; Taksin, A.-L.; Raffoux, E.; Bastie, J.-N.; Degos, L.; Berthaud, P.; Marolleau, J.-P.; et al. Relationship between elevated levels of α1-acid glycoprotein in chronic myelogenous leukemia in blast crisis and pharmacological resistance to imatinib (Gleevec®) in vitro and in vivo. Biochem. Pharmacol. 2003, 66, 1907–1913. [Google Scholar] [CrossRef]
- Kretz, O.; Weiss, H.M.; Schumacher, M.M.; Gross, G. In vitro blood distribution and plasma protein binding of the tyrosine kinase inhibitor imatinib and its active metabolite, CGP74588, in rat, mouse, dog, monkey, healthy human and patients with acute lymphatic leukaemia. Br. J. Clin. Pharmacol. 2004, 58, 212–216. [Google Scholar] [CrossRef]
- Friedman, M.L.; Schlueter, K.T.; Kirley, T.L.; Halsall, H.B. Fluorescence quenching of human orosomucoid. Accessibility to drugs and small quenching agents. Biochem. J. 1985, 232, 863–867. [Google Scholar] [CrossRef]
- Shapiro, R.; Klein, R.S. The deamination of cytidine and cytosine by acidic buffer solutions. Mutagenic implications. Biochemistry 1966, 5, 2358–2362. [Google Scholar] [CrossRef] [PubMed]
- Ulmann, J.; McCarthy, B.J. Alkali deamination of cytosine residues in DNA. Biochim. Biophys. Acta 1973, 294, 396–404. [Google Scholar] [CrossRef]
- Antonov, L. Favipiravir tautomerism: A theoretical insight. Theor. Chem. Accounts 2020, 139, 145. [Google Scholar] [CrossRef] [PubMed]
- da Silva, G. Protonation, Tautomerism, and Base Pairing of the Antiviral Favipiravir (T-705). ChemRxiv 2020. [Google Scholar] [CrossRef]
- Liang, G.; Tribolet, R.; Sigel, H. Ternary complexes in solution. 50. Dependence of intramolecular hydrophobic ligand-ligand interactions on ligand structure, geometry of the coordination sphere of the metal ion, and solvent composition. Opposing solvent effects. Inorg. Chem. 1988, 27, 2877–2887. [Google Scholar] [CrossRef]
- Castro, B.; Pereira, J.; Gameiro, P.; Lima, J.L.F.C. Multinuclear NMR and potentiometric studies on the interaction of zinc and cadmium with cytidine and glycylglycine. The effect of the anion. J. Inorg. Biochem. 1992, 45, 53–64. [Google Scholar] [CrossRef]
- Mohamed, M.; Shehata, M.; Shoukry, M. Trimethyltin(IV) complexes with some selected DNA constituents. J. Coord. Chem. 2001, 53, 125. [Google Scholar] [CrossRef]
- Szakács, Z.; Béni, S.; Varga, Z.; Örfi, L.; Kéri, G.; Noszál, B. Acid-base profiling of imatinib (Gleevec) and its fragments. J. Med. Chem. 2005, 48, 249–255. [Google Scholar] [CrossRef] [PubMed]
- Goncharov, N.V.; Belinskaia, D.A.; Shmurak, V.I.; Terpilowski, M.A.; Jenkins, R.O.; Avdonin, P.V. Serum Albumin Binding and Esterase Activity: Mechanistic Interactions with Organophosphates. Molecules 2017, 22, 1201. [Google Scholar] [CrossRef] [PubMed]
- Li, B.; Sedlacek, M.; Manoharan, I.; Boopathy, R.; Duysen, E.G.; Masson, P.; Lockridge, O. Butyrylcholinesterase, paraoxonase, and albumin esterase, but not carboxylesterase, are present in human plasma. Biochem. Pharmacol. 2005, 70, 1673–1684. [Google Scholar] [CrossRef]
- Fife, T.H.; Przystas, T.J. Divalent metal ion catalysis in the hydrolysis of esters of picolinic acid. Metal ion promoted hydroxide ion and water catalyzed reactions. J. Am. Chem. Soc. 1985, 107, 1041–1047. [Google Scholar] [CrossRef]
- Zékány, L.; Nagypál, I. Computational Methods for the Determination of Stability Constants; Leggett, D.L., Ed.; Plenum Press: New York, NY, USA, 1985; pp. 291–353. [Google Scholar]
- Zsila, F. Subdomain IB is the third major drug binding region of human serum albumin: Toward the three-sites model. Mol. Pharm. 2013, 10, 1668–1682. [Google Scholar] [CrossRef] [PubMed]
- Dömötör, O.; Hartinger, C.G.; Bytzek, A.K.; Kiss, T.; Keppler, B.K.; Enyedy, É.A. Characterization of the binding sites of the anticancer ruthenium(III) complexes KP1019 and KP1339 on human serum albumin via competition studies. J. Biol. Inorg. Chem. 2013, 18, 9–17. [Google Scholar] [CrossRef]
- Dömötör, O.; Enyedy, É.A. Binding mechanisms of half-sandwich Rh(III) and Ru(II) arene complexes on human serum albumin: A comparative study. J. Biol. Inorg. Chem. 2019, 24, 703–719. [Google Scholar] [CrossRef]
- Yasgar, A.; Furdas, S.D.; Maloney, D.J.; Jadhav, A.; Jung, M.; Simeonov, A. High-throughput 1,536-well fluorescence polarization assays for α1-acid glycoprotein and human serum albumin binding. PLoS ONE 2012, 7, e45594. [Google Scholar] [CrossRef] [PubMed]
- Smith, S.A.; Waters, N.J. Pharmacokinetic and pharmacodynamic considerations for drugs binding to alpha-1-acid glycoprotein. Pharm. Res. 2019, 36, 30. [Google Scholar] [CrossRef]
- El-Gamel, S.; Wollert, U.; Müller, W.E. Optical studies on the specific interaction of dipyridamole with α1-acid glycoprotein (orosomucoid). J. Pharm. Pharmacol. 1982, 34, 152–157. [Google Scholar] [CrossRef] [PubMed]
- Lakowicz, J.R. Principles of Fluorescence Spectroscopy; Springer: New York, NY, USA, 2006. [Google Scholar]
- Browne, S.P.; Slaughter, E.A.; Couch, R.A.; Rudnic, E.M.; McLean, A.M. The influence of plasma butyrylcholinesterase concentration on the in vitro hydrolysis of cocaine in human plasma. Biopharm. Drug Dispos. 1998, 19, 309–314. [Google Scholar] [CrossRef]
- Wang, D.; Zou, L.; Jin, Q.; Hou, J.; Ge, G.; Yang, L. Human carboxylesterases: A comprehensive review. Acta Pharm. Sin. B 2018, 8, 699–712. [Google Scholar] [CrossRef] [PubMed]
- Jørgensen, H.G.; Elliott, M.A.; Allan, E.K.; Carr, C.E.; Holyoake, T.L.; Smith, K.D. α1-Acid glycoprotein expressed in the plasma of chronic myeloid leukemia patients does not mediate significant in vitro resistance to STI571. Blood 2002, 99, 713–715. [Google Scholar] [CrossRef]
- Ingram, N.; Dishinger, C.; Wood, J.; Hutzler, M.; Smith, S.; Huskin, M. Effect of the plasticizer DEHP in blood collection bags on human plasma fraction unbound determination for Alpha-1-Acid Glycoprotein (AAG) binding drugs. AAPS J. 2019, 21, 5. [Google Scholar] [CrossRef]
- Grzeskowiak, R. Extractables and Leachables in Microcentrifuge Tubes—Extensive HPLC/GC/MS Analysis. Eppendorf AG Application Note No. 417. Available online: https://www.google.com/url?sa=t&rct=j&q=&esrc=s&source=web&cd=&ved=2ahUKEwiLrIDnme_8AhWv7rsIHRztAL0QFnoECBQQAQ&url=https%3A%2F%2Fwww.eppendorf.com%2Fproduct-media%2Fdoc%2Fen%2F625557%2FConsumables_Application-Note_417_Microcentrifuge-Tubes_Extractables-Leachables-Microcentrifuge-Tubes-Extensive-HPLC-GC-MS-Analysis.pdf&usg=AOvVaw0KFoXVJAZUXAWtAYwhtJWt. (accessed on 20 January 2023).
- Beaven, G.H.; Chen, S.-H.; D’albis, A.; Gratzer, W.B. A Spectroscopic Study of the Haemin–Human-Serum-Albumin System. Eur. J. Biochem. 1974, 42, 539–546. [Google Scholar] [CrossRef]
- AlAjmi, M.F.; Rehman, M.T.; Khan, R.A.; Khan, M.A.; Muteeb, G.; Khan, M.S.; Noman, O.M.; Alsalme, A.; Hussain, A. Understanding the interaction between α-1-acid glycoprotein (AGP) and potential Cu/Zn metallo-drugs of benzimidazole derived organic motifs: A multi-spectroscopic and molecular docking study. Spectrochim. Acta A Mol. Biomol. Spectrosc. 2020, 225, 117457. [Google Scholar] [CrossRef]
- Zsila, F.; Iwao, Y. The drug binding site of human α1-acid glycoprotein: Insight from induced circular dichroism and electronic absorption spectra. Biochim. Biophys. Acta 2007, 1770, 797–809. [Google Scholar] [CrossRef]
- Luk, C.K. Study of the nature of the metal-binding sites and estimate of the distance between the metal-binding sites in transferrin using trivalent lanthanide ions as fuorescent probes. Biochemistry 1971, 10, 2838–2843. [Google Scholar] [CrossRef]
- Enyedy, É.A.; Dömötör, O.; Varga, E.; Kiss, T.; Trondl, R.; Hartinger, C.G.; Keppler, B.K. Comparative solution equilibrium studies of anticancer gallium(III) complexes of 8-hydroxyquinoline and hydroxy(thio)pyrone ligands. J. Inorg. Biochem. 2012, 117, 189–197. [Google Scholar] [CrossRef]
- Dömötör, O.; Aicher, S.; Schmidlehner, M.; Novak, M.S.; Roller, A.; Jakupec, M.A.; Kandioller, W.; Hartinger, C.G.; Keppler, B.K.; Enyedy, É.A. Antitumor pentamethylcyclopentadienyl rhodium complexes of maltol and allomaltol: Synthesis, solution speciation and bioactivity. J. Inorg. Biochem. 2014, 134, 57–65. [Google Scholar] [CrossRef]
- Gans, P.; Sabatini, A.; Vacca, A. Investigation of equilibria in solution. Determination of equilibrium constants with the HYPERQUAD suite of programs. Talanta 1996, 43, 1739–1753. [Google Scholar] [CrossRef]
- Irving, H.M.; Miles, M.G.; Pettit, L.D. A study of some problems in determining the stoicheiometric proton dissociation constants of complexes by potentiometric titrations using a glass electrode. Anal. Chim. Acta 1967, 38, 475–488. [Google Scholar] [CrossRef]
- SCQuery. The IUPAC Stability Constants Database, Academic Software, Version 5.5; Royal Society of Chemistry: London, UK, 1993. [Google Scholar]
- Żołek, T.; Dömötör, O.; Ostrowska, K.; Enyedy, É.A.; Maciejewska, D. Evaluation of blood-brain barrier penetration and examination of binding to human serum albumin of 7-O-arylpiperazinylcoumarins as potential antipsychotic agents. Bioorganic Chem. 2019, 84, 211–225. [Google Scholar] [CrossRef]
- Enyedy, É.A.; Dömötör, O.; Bali, K.; Hetényi, A.; Tuccinardi, T.; Keppler, B.K. Interaction of the anticancer gallium(III) complexes of 8-hydroxyquinoline and maltol with human serum proteins. J. Biol. Inorg. Chem. 2015, 20, 77–88. [Google Scholar] [CrossRef]
- Puigdomenech, I. Making Equilibrium Diagrams Using Sophisticated Algorithms (MEDUSA). Available online: https://www.kth.se/che/medusa/ (accessed on 20 January 2023).


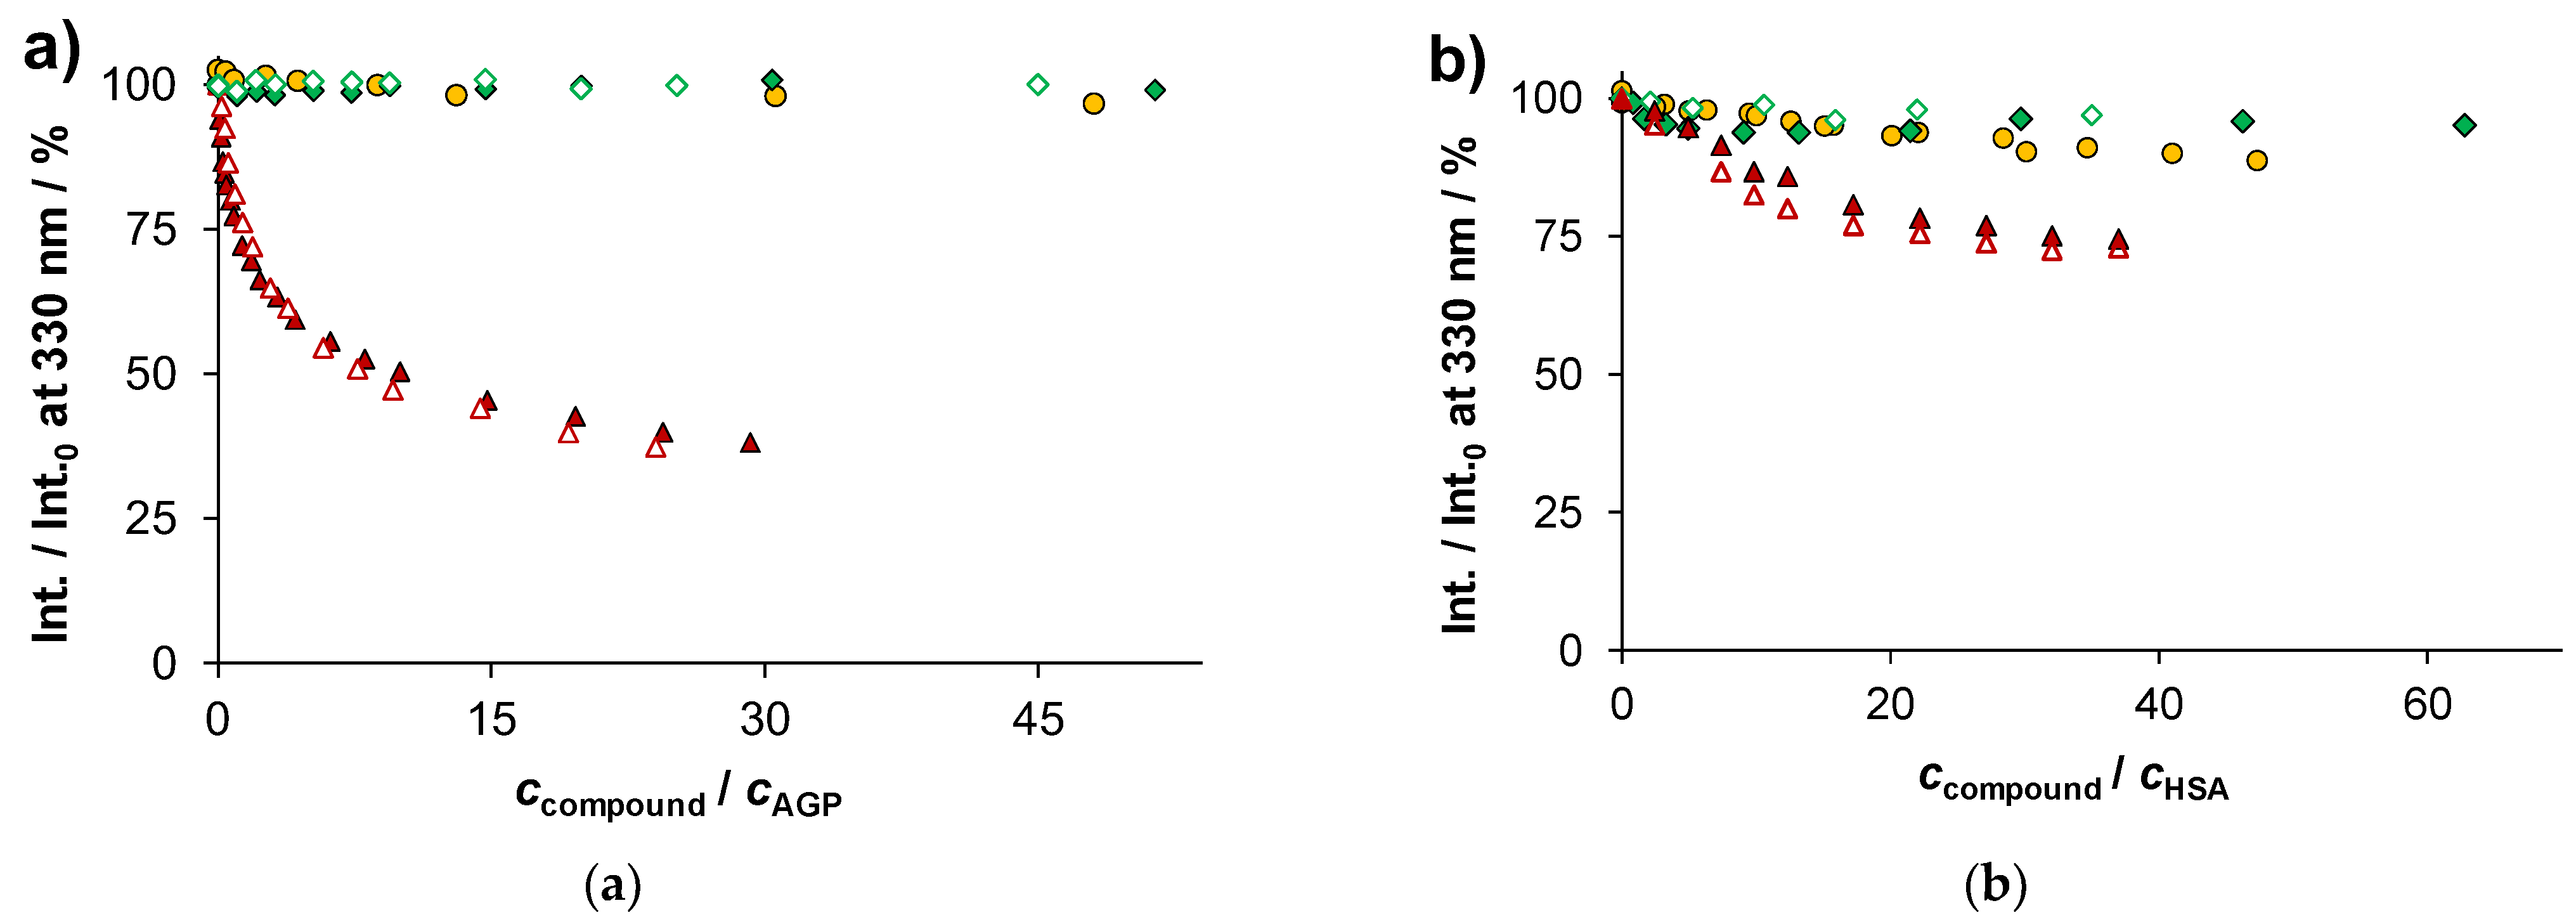
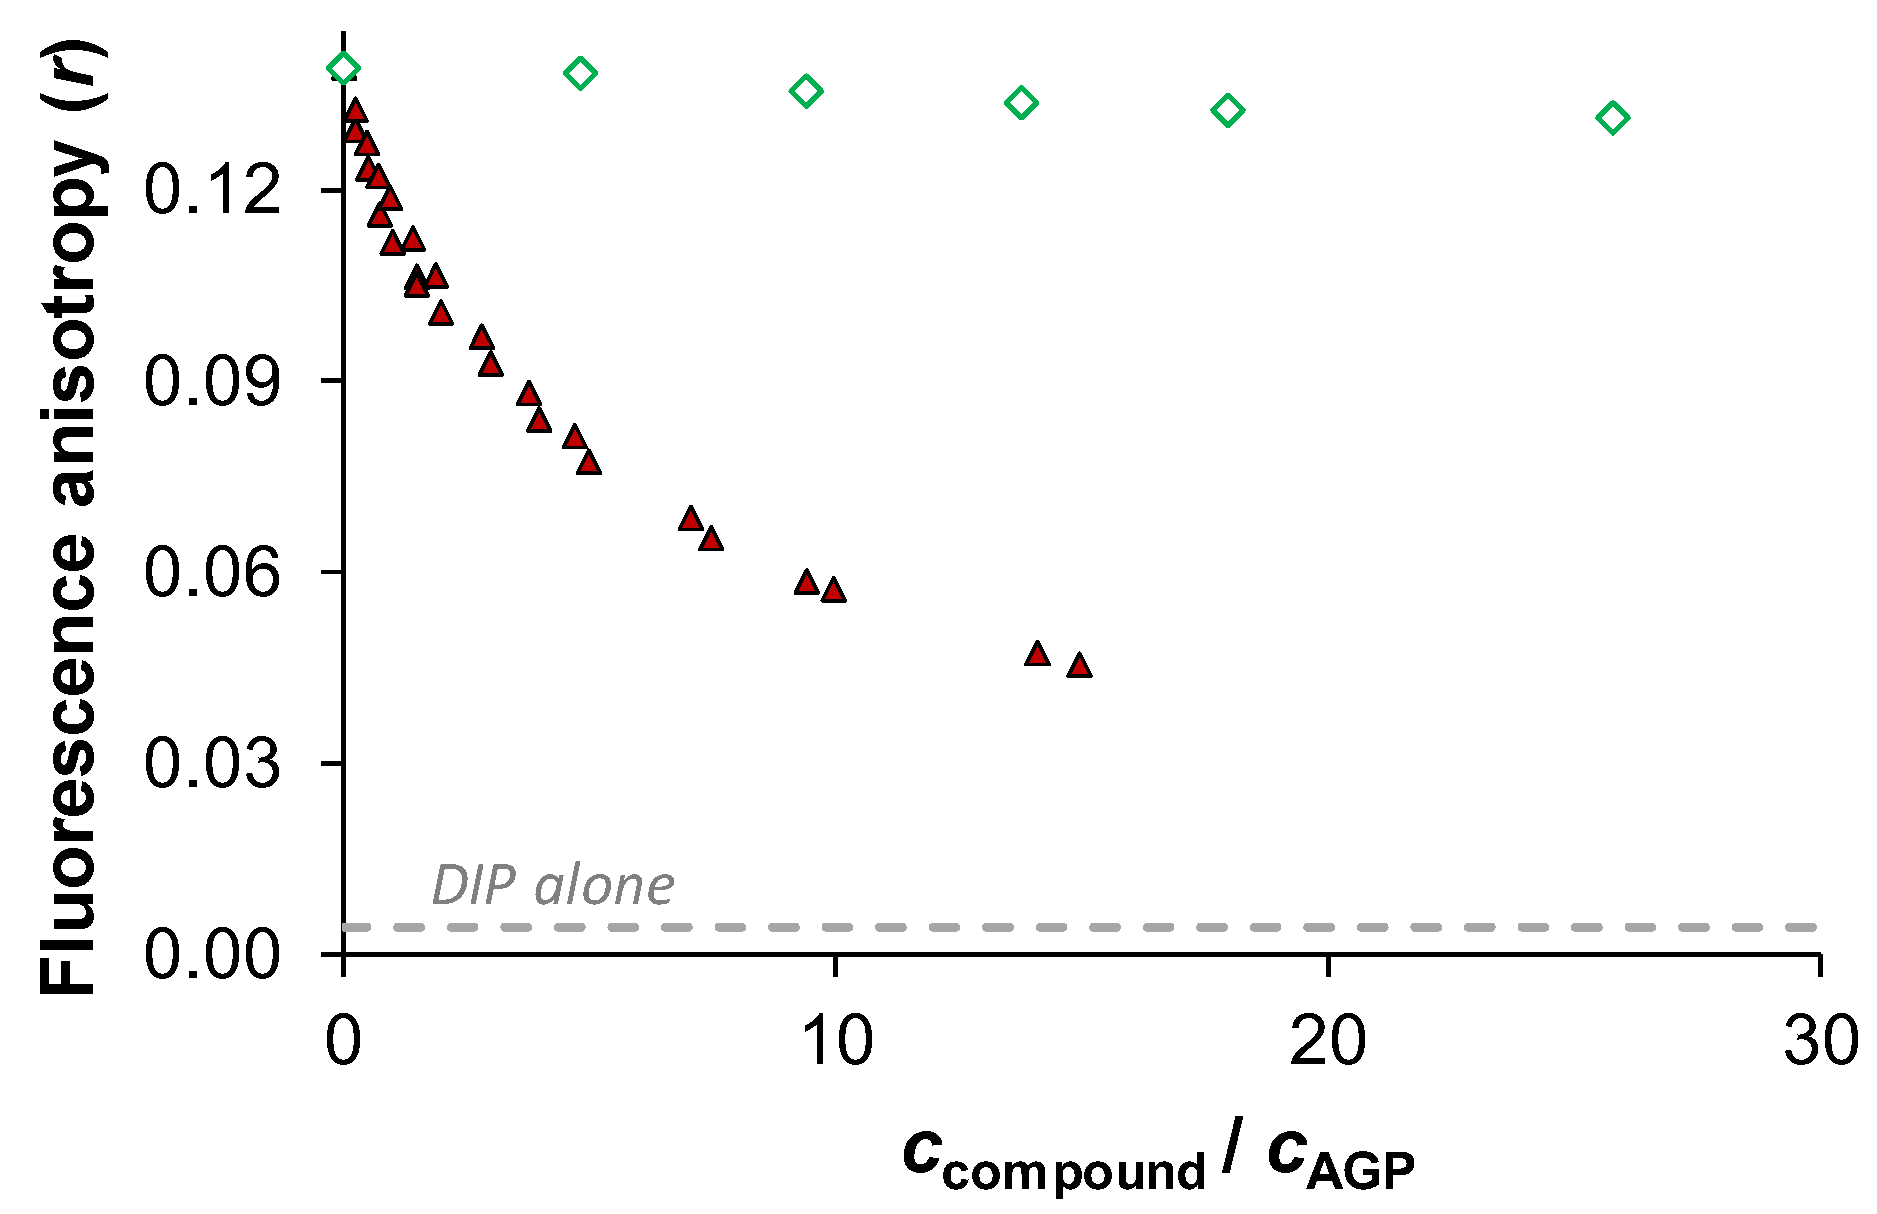
 ) on the fluorescence of (a) AGP or (b) HSA at 25 °C; the quenching experiments with IMA were measured at 37 °C as well (∆) [cAGP = 0.5 μM; cHSA = 1 μM; λEX = 280 nm; λEM = 330 nm; pH = 7.4 (PBS)].
) on the fluorescence of (a) AGP or (b) HSA at 25 °C; the quenching experiments with IMA were measured at 37 °C as well (∆) [cAGP = 0.5 μM; cHSA = 1 μM; λEX = 280 nm; λEM = 330 nm; pH = 7.4 (PBS)].
) on the fluorescence of (a) AGP or (b) HSA at 25 °C; the quenching experiments with IMA were measured at 37 °C as well (∆) [cAGP = 0.5 μM; cHSA = 1 μM; λEX = 280 nm; λEM = 330 nm; pH = 7.4 (PBS)].


| λEX (max) (nm) | λEM (max) (nm) | Relative Intensity b | τ1 (ns) | τ2 (ns) | α1 % | α2 % | |
|---|---|---|---|---|---|---|---|
| water pH 7.4 | 362 | 428 | 1.00 | 10.00 ± 0.01 | - | 100 | - |
| water pH 2.0 | 322, 365 | 438 | 0.16 | 5.64 ± 0.01 | - | 100 | - |
| n-octanol | 372 | 435 | 0.36 | 6.4 ± 0.2 | 9.74 ± 0.03 | 37 | 63 |
| ethanol | 330, 368 | 432 | 0.14 | 3.8 ± 0.1 | 8.05 ± 0.01 | 25 | 75 |
| Protein (Variant/Type) {Storage} | pH (Buffer) | T/°C | Method | K′ | logK′ | Reference |
|---|---|---|---|---|---|---|
| AGP | 4.95 (acetate) 4.95 (acetate) | 25 25 | ITC b NMR c | 8.7 × 10² 3.2 × 10³ | 2.94 3.51 | [27] |
| (PBS) | n.d. d | ultrafiltration | 4.9 × 10⁶ | 6.69 | [32] | |
| (native) (F1-S) | 7.4 (ringer) 7.4 (ringer) | 37 37 | circular dichroism | 2.4 × 10⁶ 1.7 × 10⁶ | 6.38 6.23 | [26] |
| {glass, freshly prep.} {plastic, 2 months} e {glass, freshly prep.} {glass, freshly prep.} | 7.4 (PBS) 7.4 (PBS) 7.4 (PBS) 7.4 (PBS) | 25 25 37 25 | fluorometry fluorometry fluorometry FACE | 6.3 × 10⁵ 1.0 × 10⁶ 1.0 × 10⁶ 1.6 × 10⁵ | 5.8 ± 0.1 6.0 ± 0.1 6.0 ± 0.1 5.2 ± 0.1 | present study |
| HSA | (PBS) | n.d.d | ultrafiltration | 2.3 × 10⁵ | 5.36 | [32] |
| (fatty acid free) (fatty acid free) | 7.0 (phos.) f | 20 37 | fluorometry fluorometry | 1.2 × 10⁵ 1.0 × 10⁵ | 5.08 g 5.02 g | [28] |
| 7.4 (phos.) f 7.4 (phos.) f | 27 37 | fluorometry fluorometry | 1.3 × 10⁵ 1.0 × 10⁵ | 5.1 5.0 | [31] | |
| 7.4 (ringer) | rt h | affinity LC i | ~3×10⁴ | 4.5 | [26] | |
| 7.4 (PBS) | 25 | fluorometry | ≤104 | ≤4.0 | present study | |
| 7.4 (PBS) | 37 | fluorometry | ≤104 | ≤4.0 | ||
| 7.4 (PBS) | 25 | FACE | no binding found | |||
Disclaimer/Publisher’s Note: The statements, opinions and data contained in all publications are solely those of the individual author(s) and contributor(s) and not of MDPI and/or the editor(s). MDPI and/or the editor(s) disclaim responsibility for any injury to people or property resulting from any ideas, methods, instructions or products referred to in the content. |
© 2023 by the authors. Licensee MDPI, Basel, Switzerland. This article is an open access article distributed under the terms and conditions of the Creative Commons Attribution (CC BY) license (https://creativecommons.org/licenses/by/4.0/).
Share and Cite
Dömötör, O.; Enyedy, É.A. Evaluation of In Vitro Distribution and Plasma Protein Binding of Selected Antiviral Drugs (Favipiravir, Molnupiravir and Imatinib) against SARS-CoV-2. Int. J. Mol. Sci. 2023, 24, 2849. https://doi.org/10.3390/ijms24032849
Dömötör O, Enyedy ÉA. Evaluation of In Vitro Distribution and Plasma Protein Binding of Selected Antiviral Drugs (Favipiravir, Molnupiravir and Imatinib) against SARS-CoV-2. International Journal of Molecular Sciences. 2023; 24(3):2849. https://doi.org/10.3390/ijms24032849
Chicago/Turabian StyleDömötör, Orsolya, and Éva A. Enyedy. 2023. "Evaluation of In Vitro Distribution and Plasma Protein Binding of Selected Antiviral Drugs (Favipiravir, Molnupiravir and Imatinib) against SARS-CoV-2" International Journal of Molecular Sciences 24, no. 3: 2849. https://doi.org/10.3390/ijms24032849