
DNA Damage Response Gene Signature as Potential Treatment Markers for Oral Squamous Cell Carcinoma
 , , and
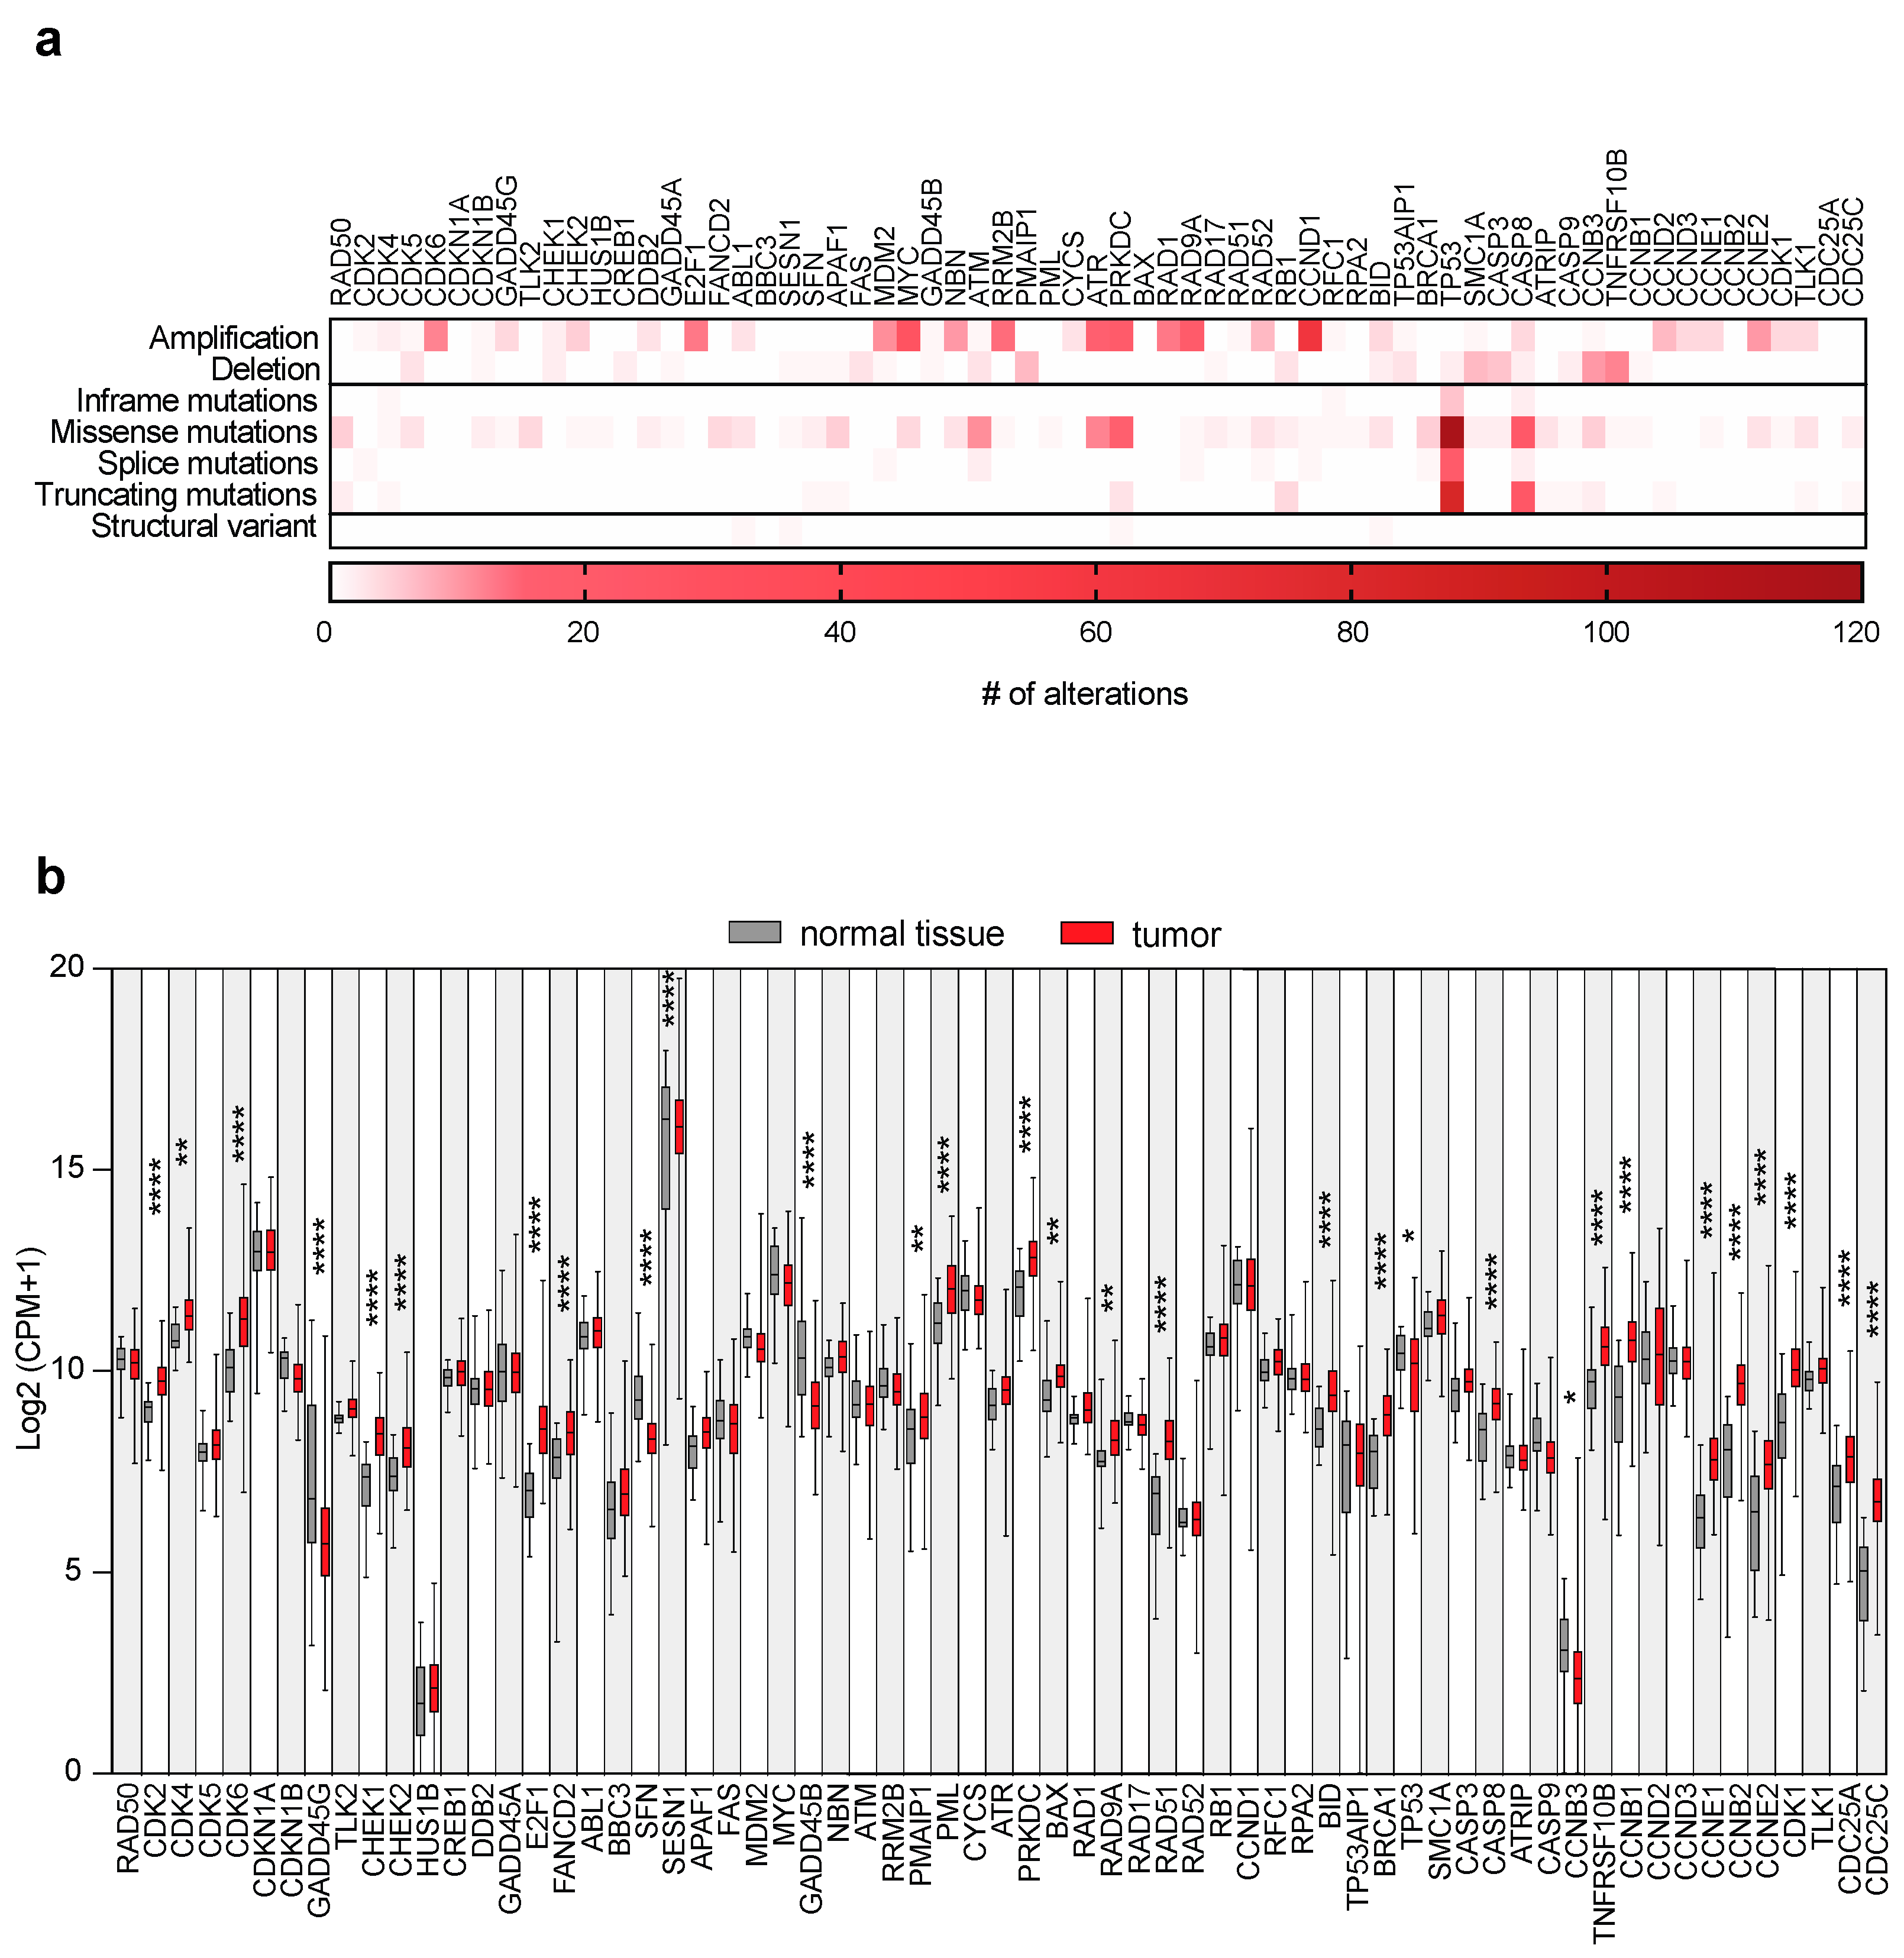
Abstract
:1. Introduction
2. Results
2.1. DDR Gene Alterations and Expressions in OSCC Patients
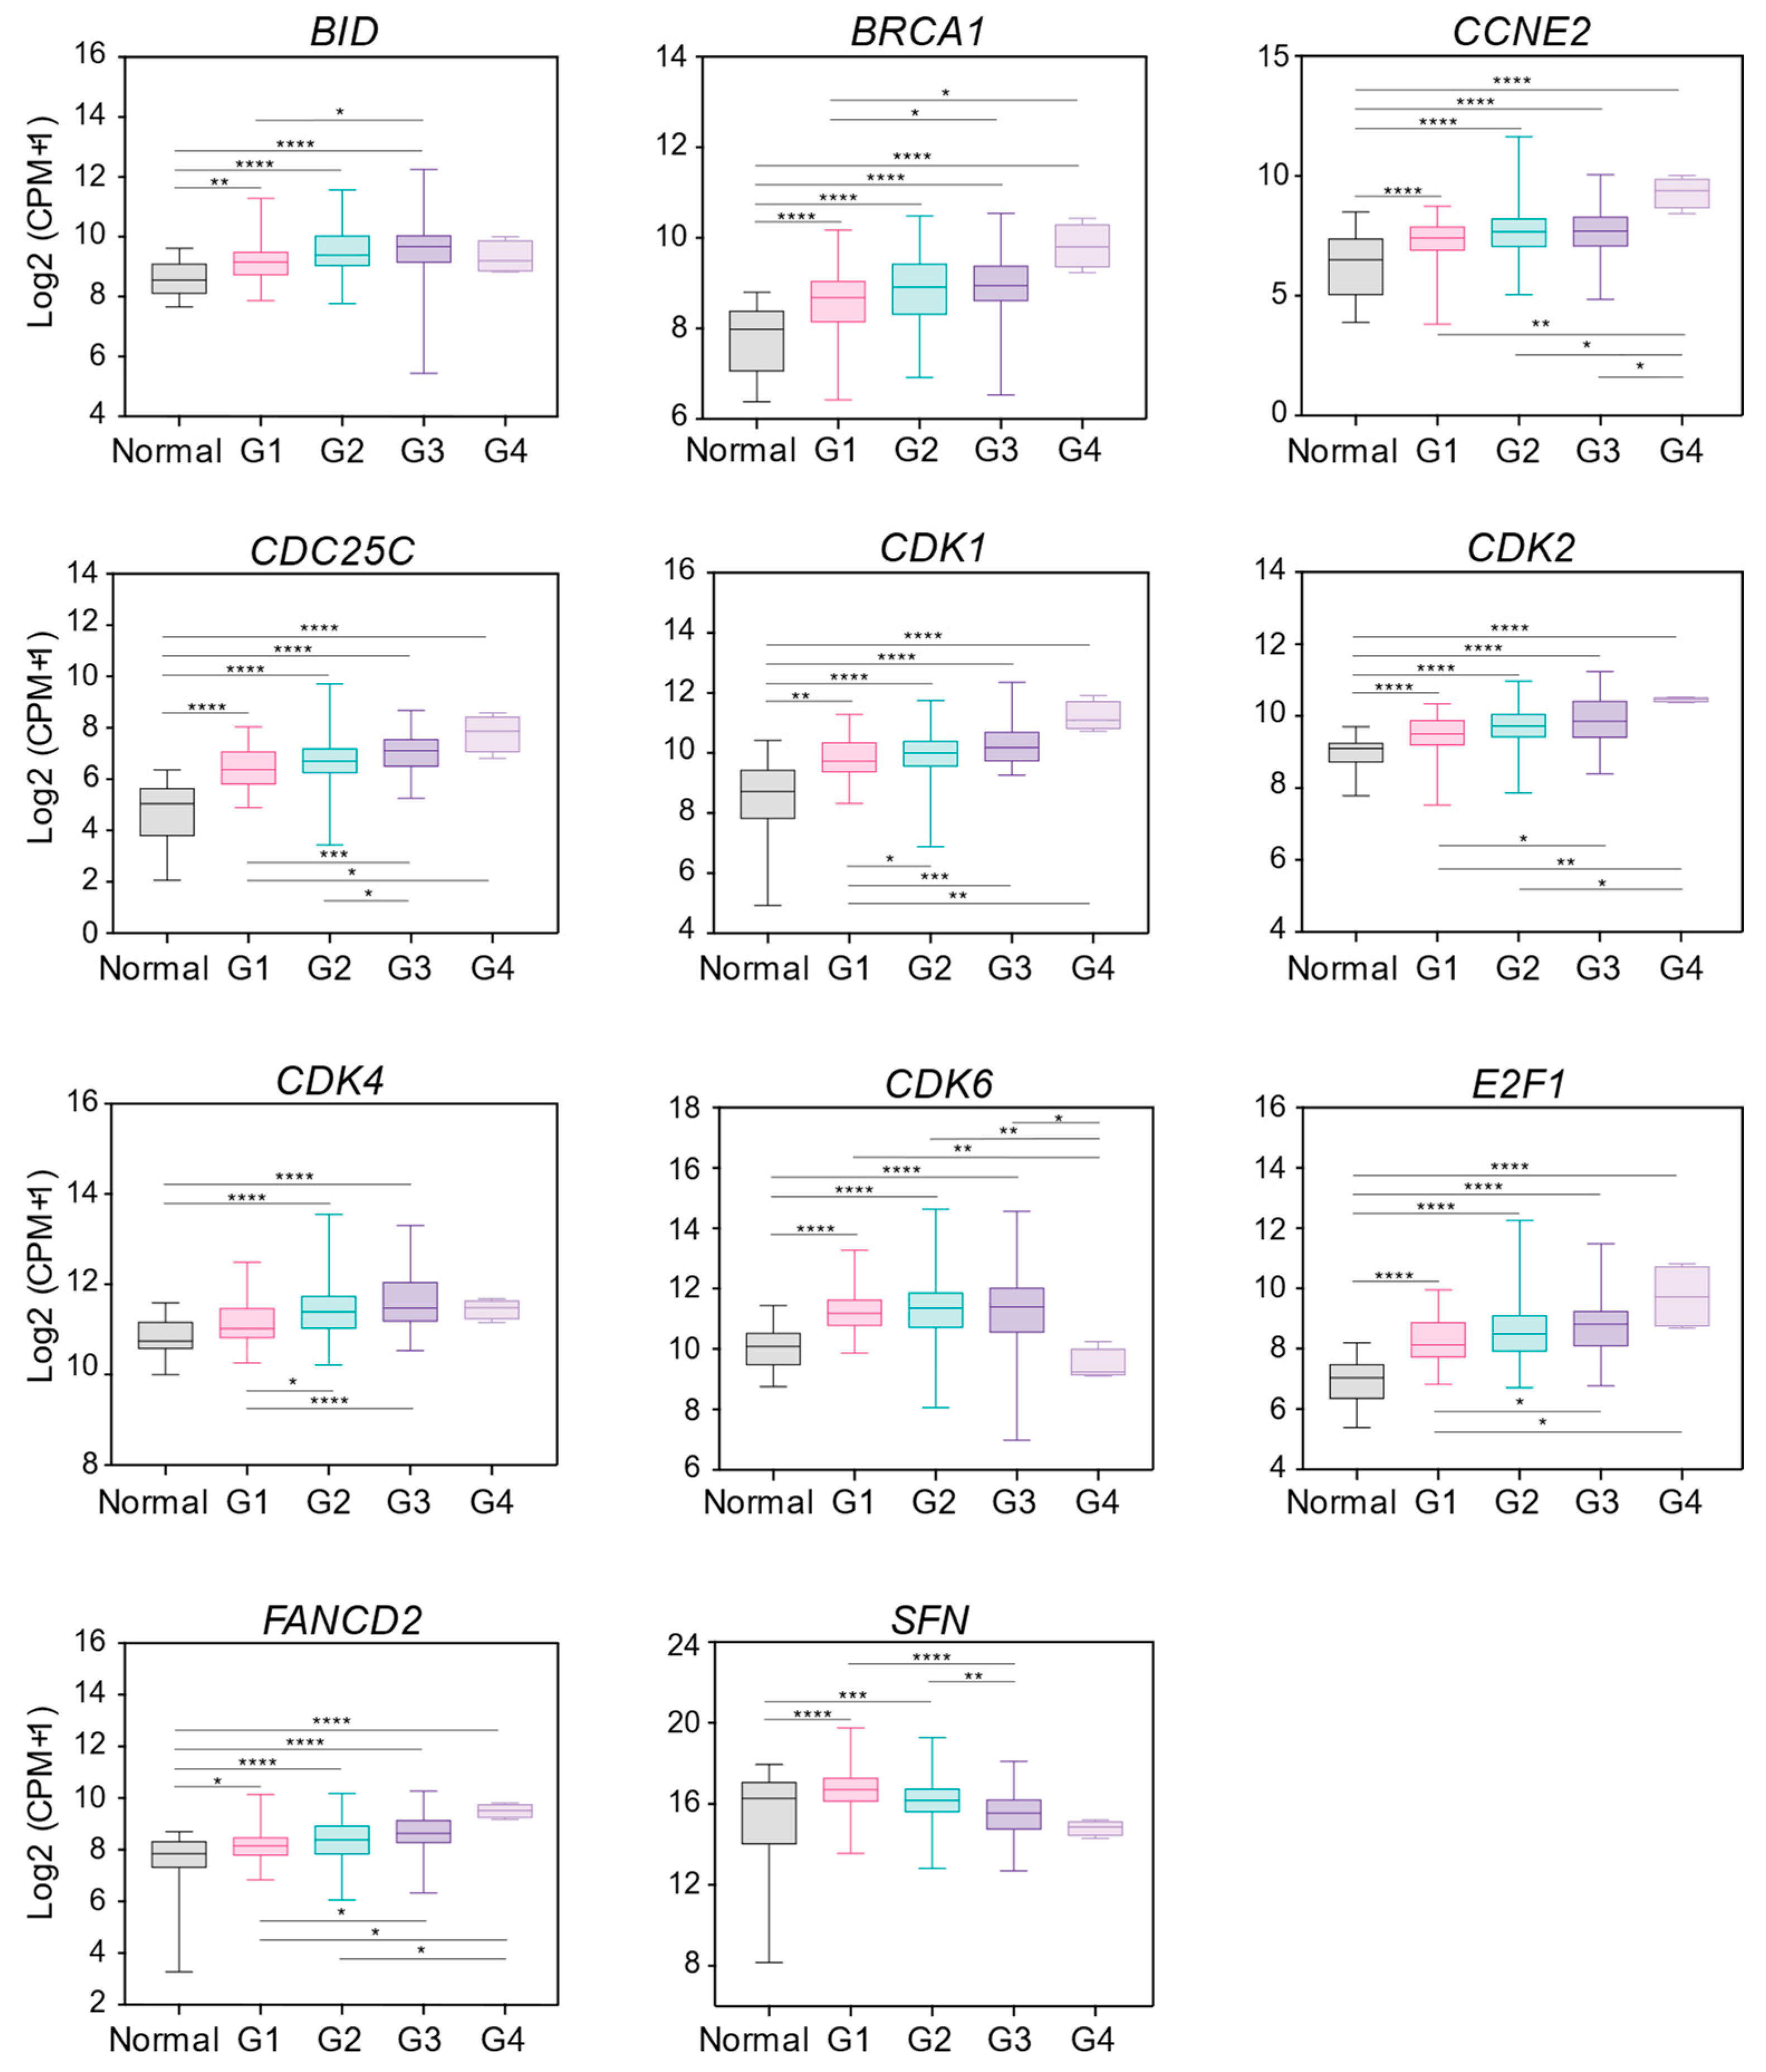
2.2. DDR Gene Expression Changes Correlate with Grading Parameters of OSCC Patients
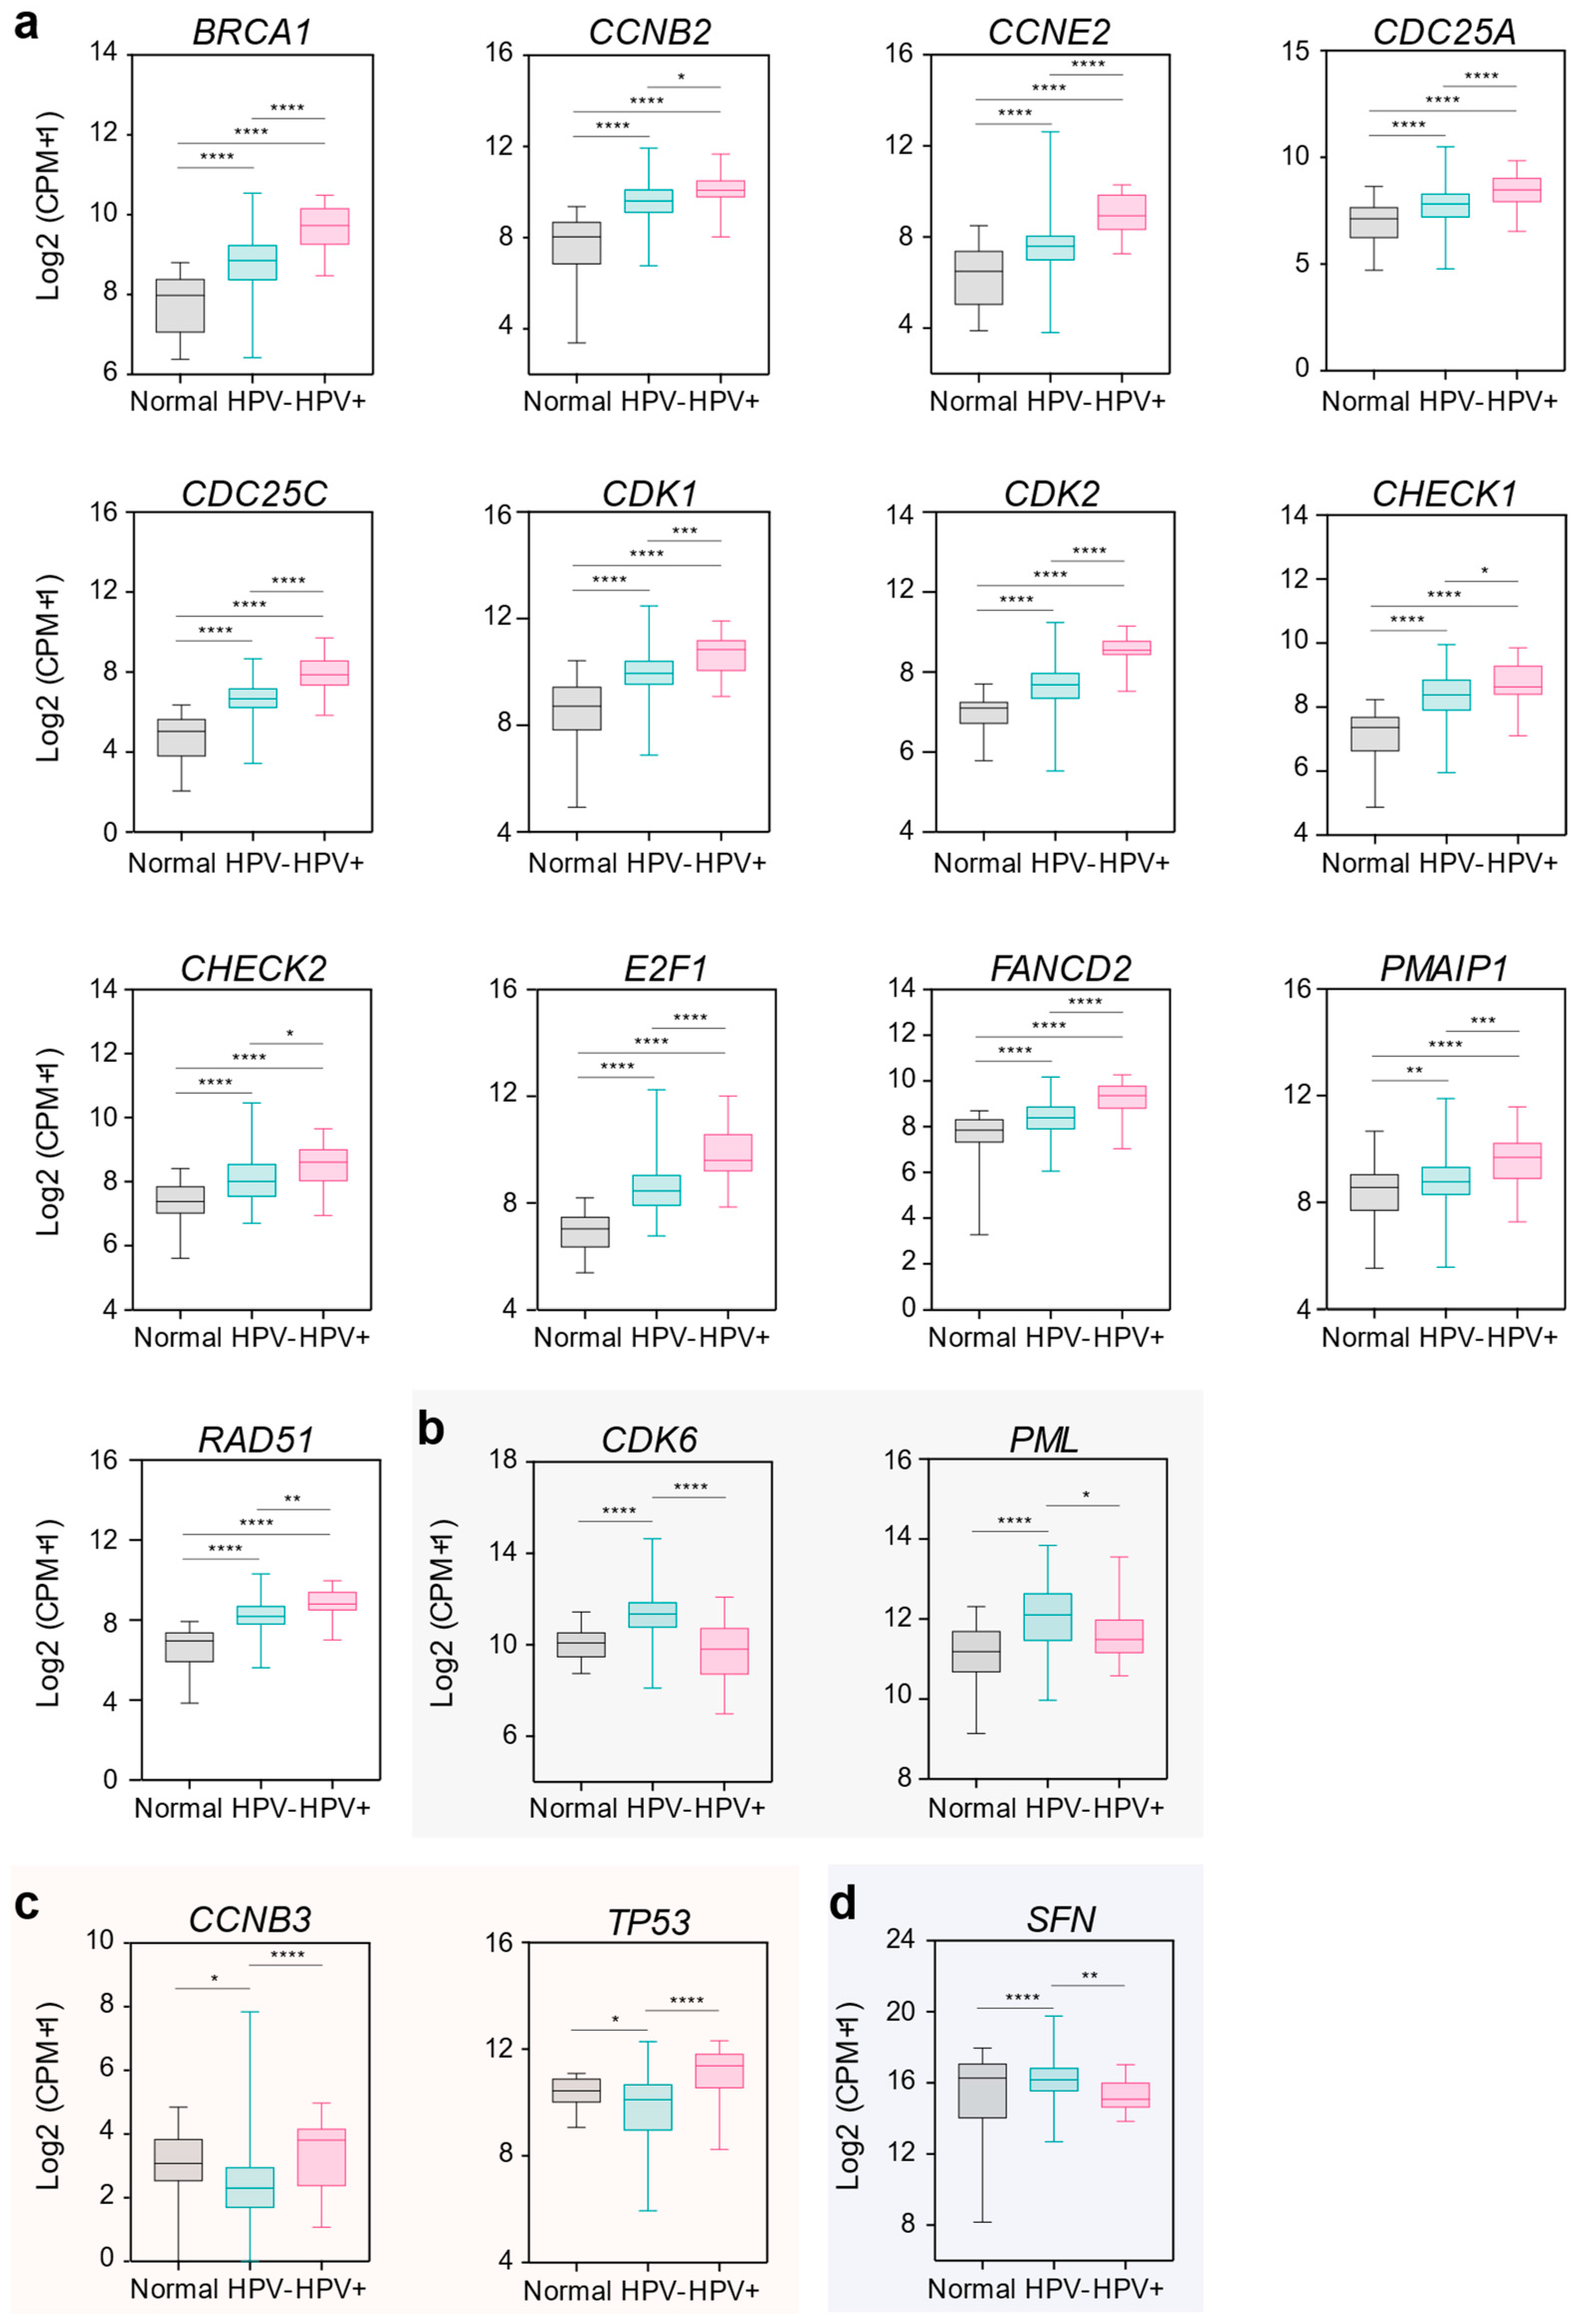
2.3. DDR Gene Expression Associates with HPV Infection in OSCC Patients
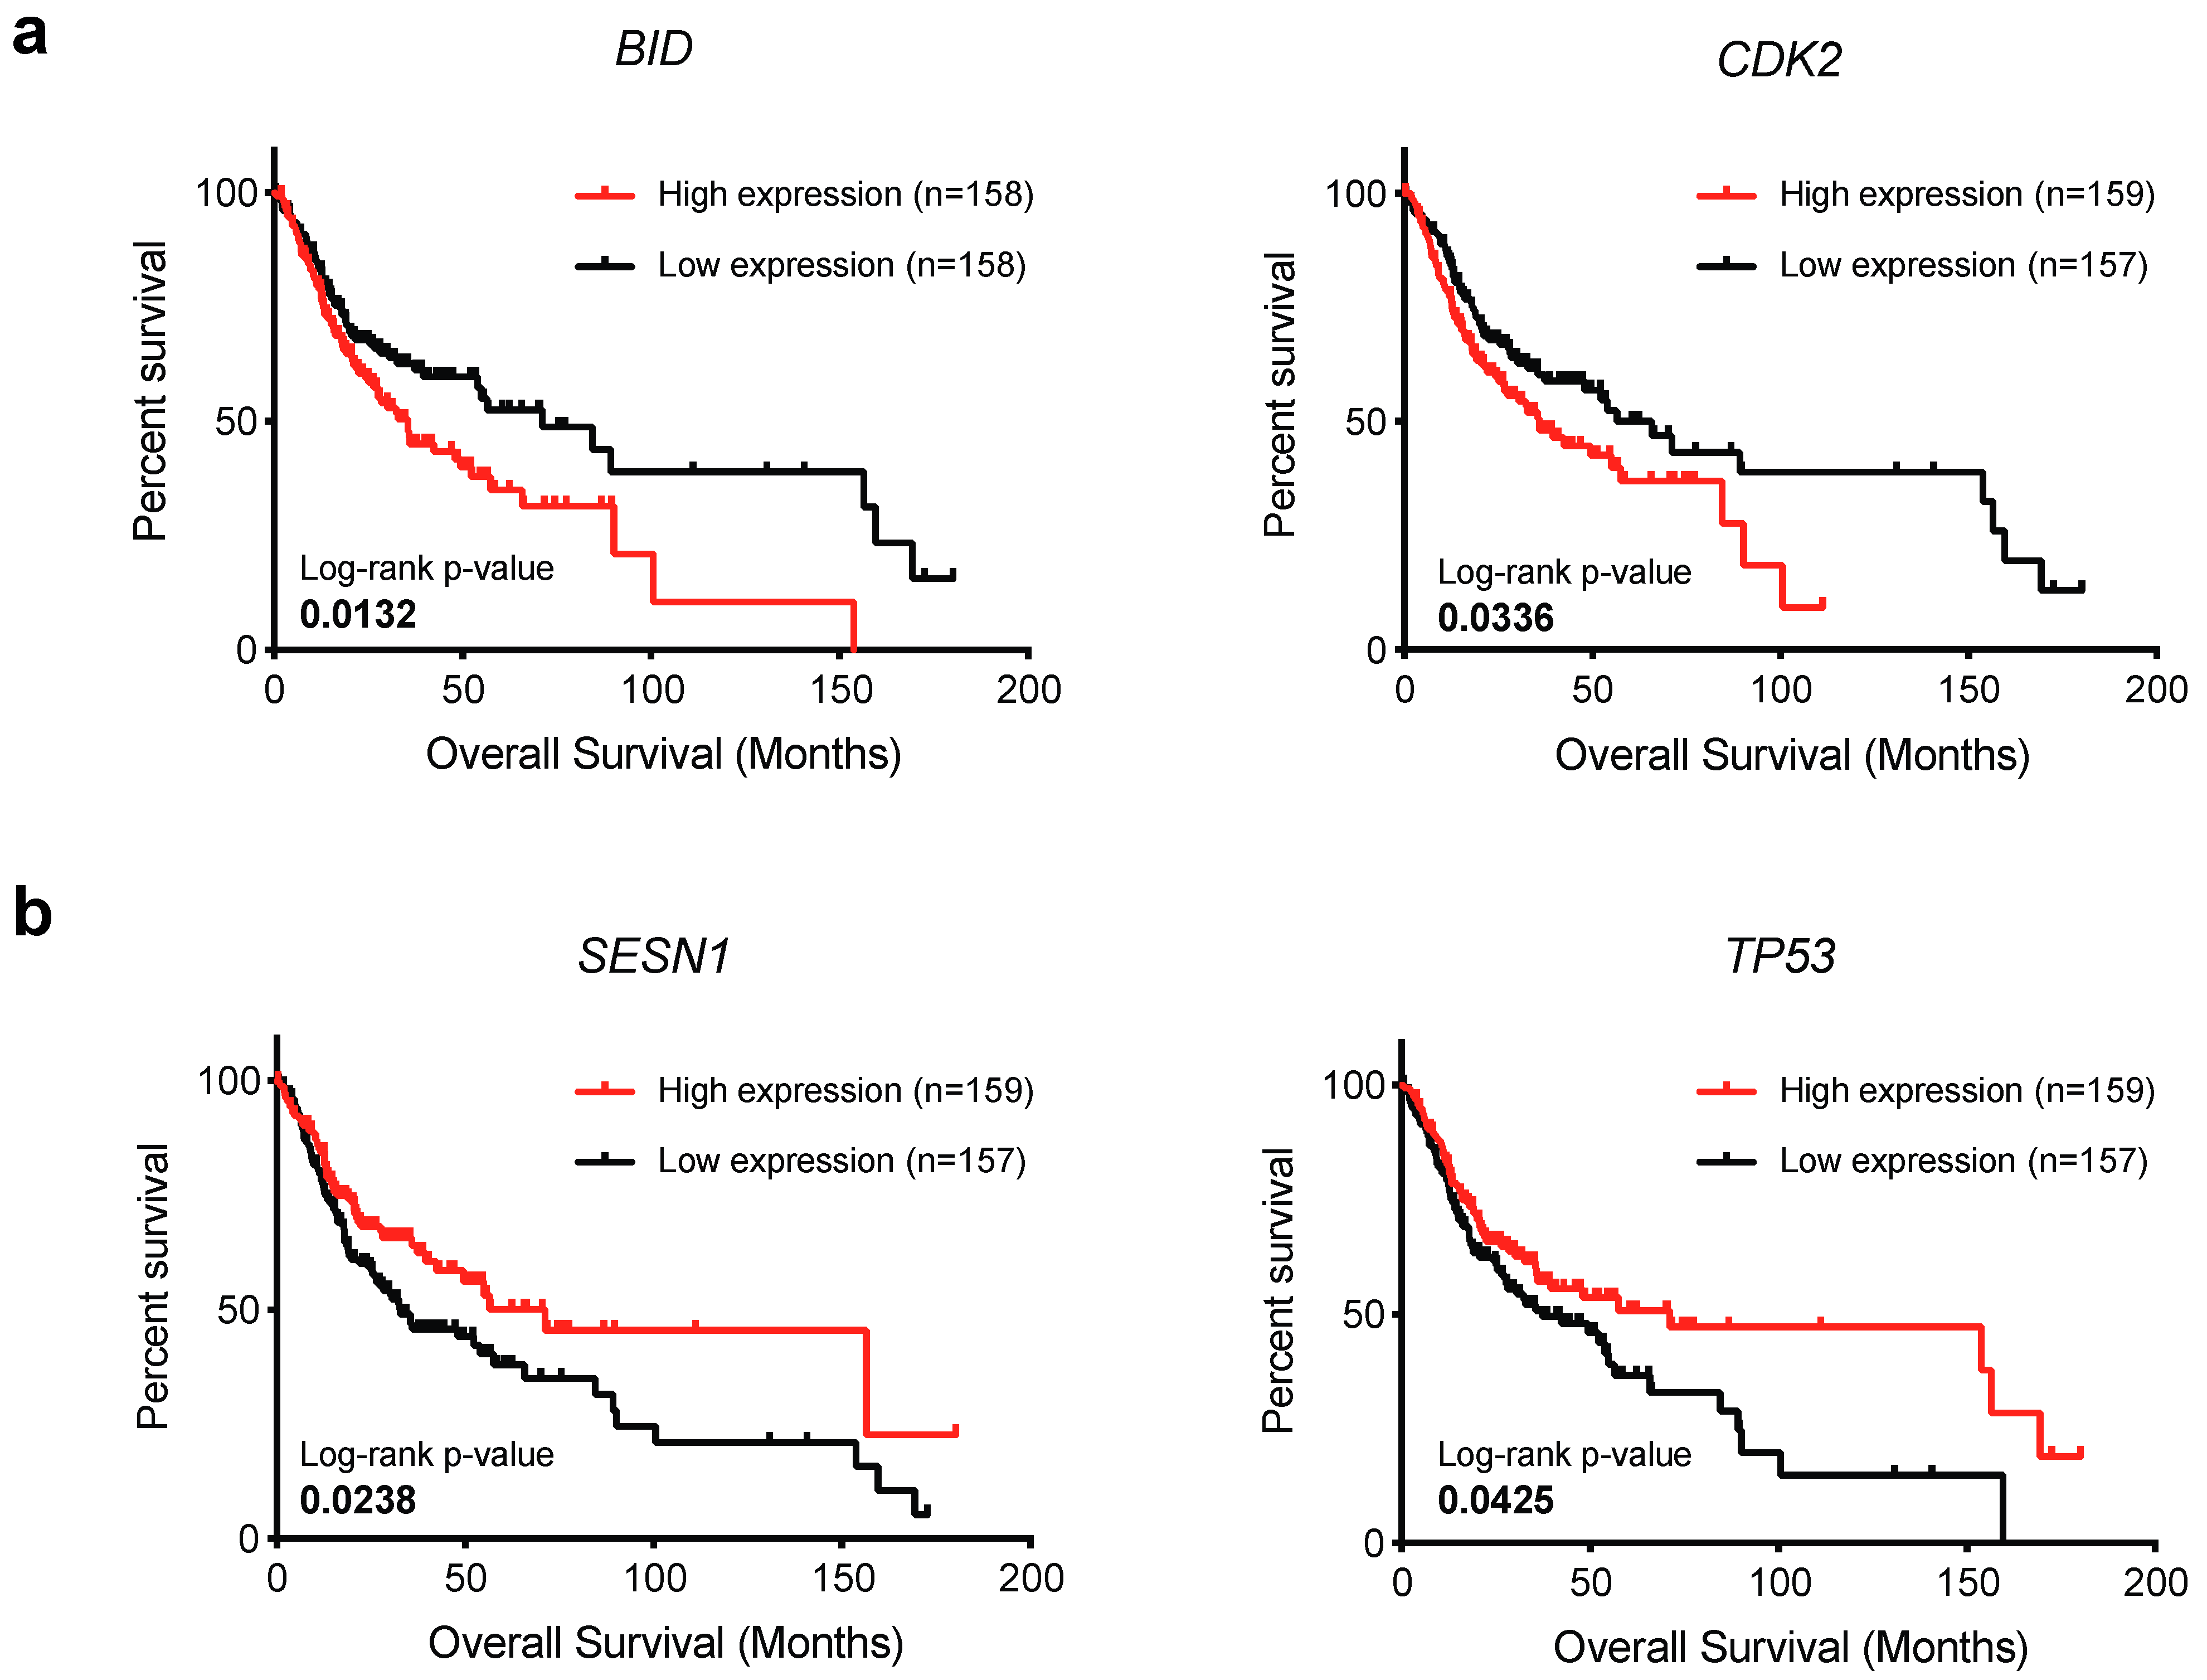
2.4. BID and CDK2 Expression Impacts on OSCC Patient’s Survival
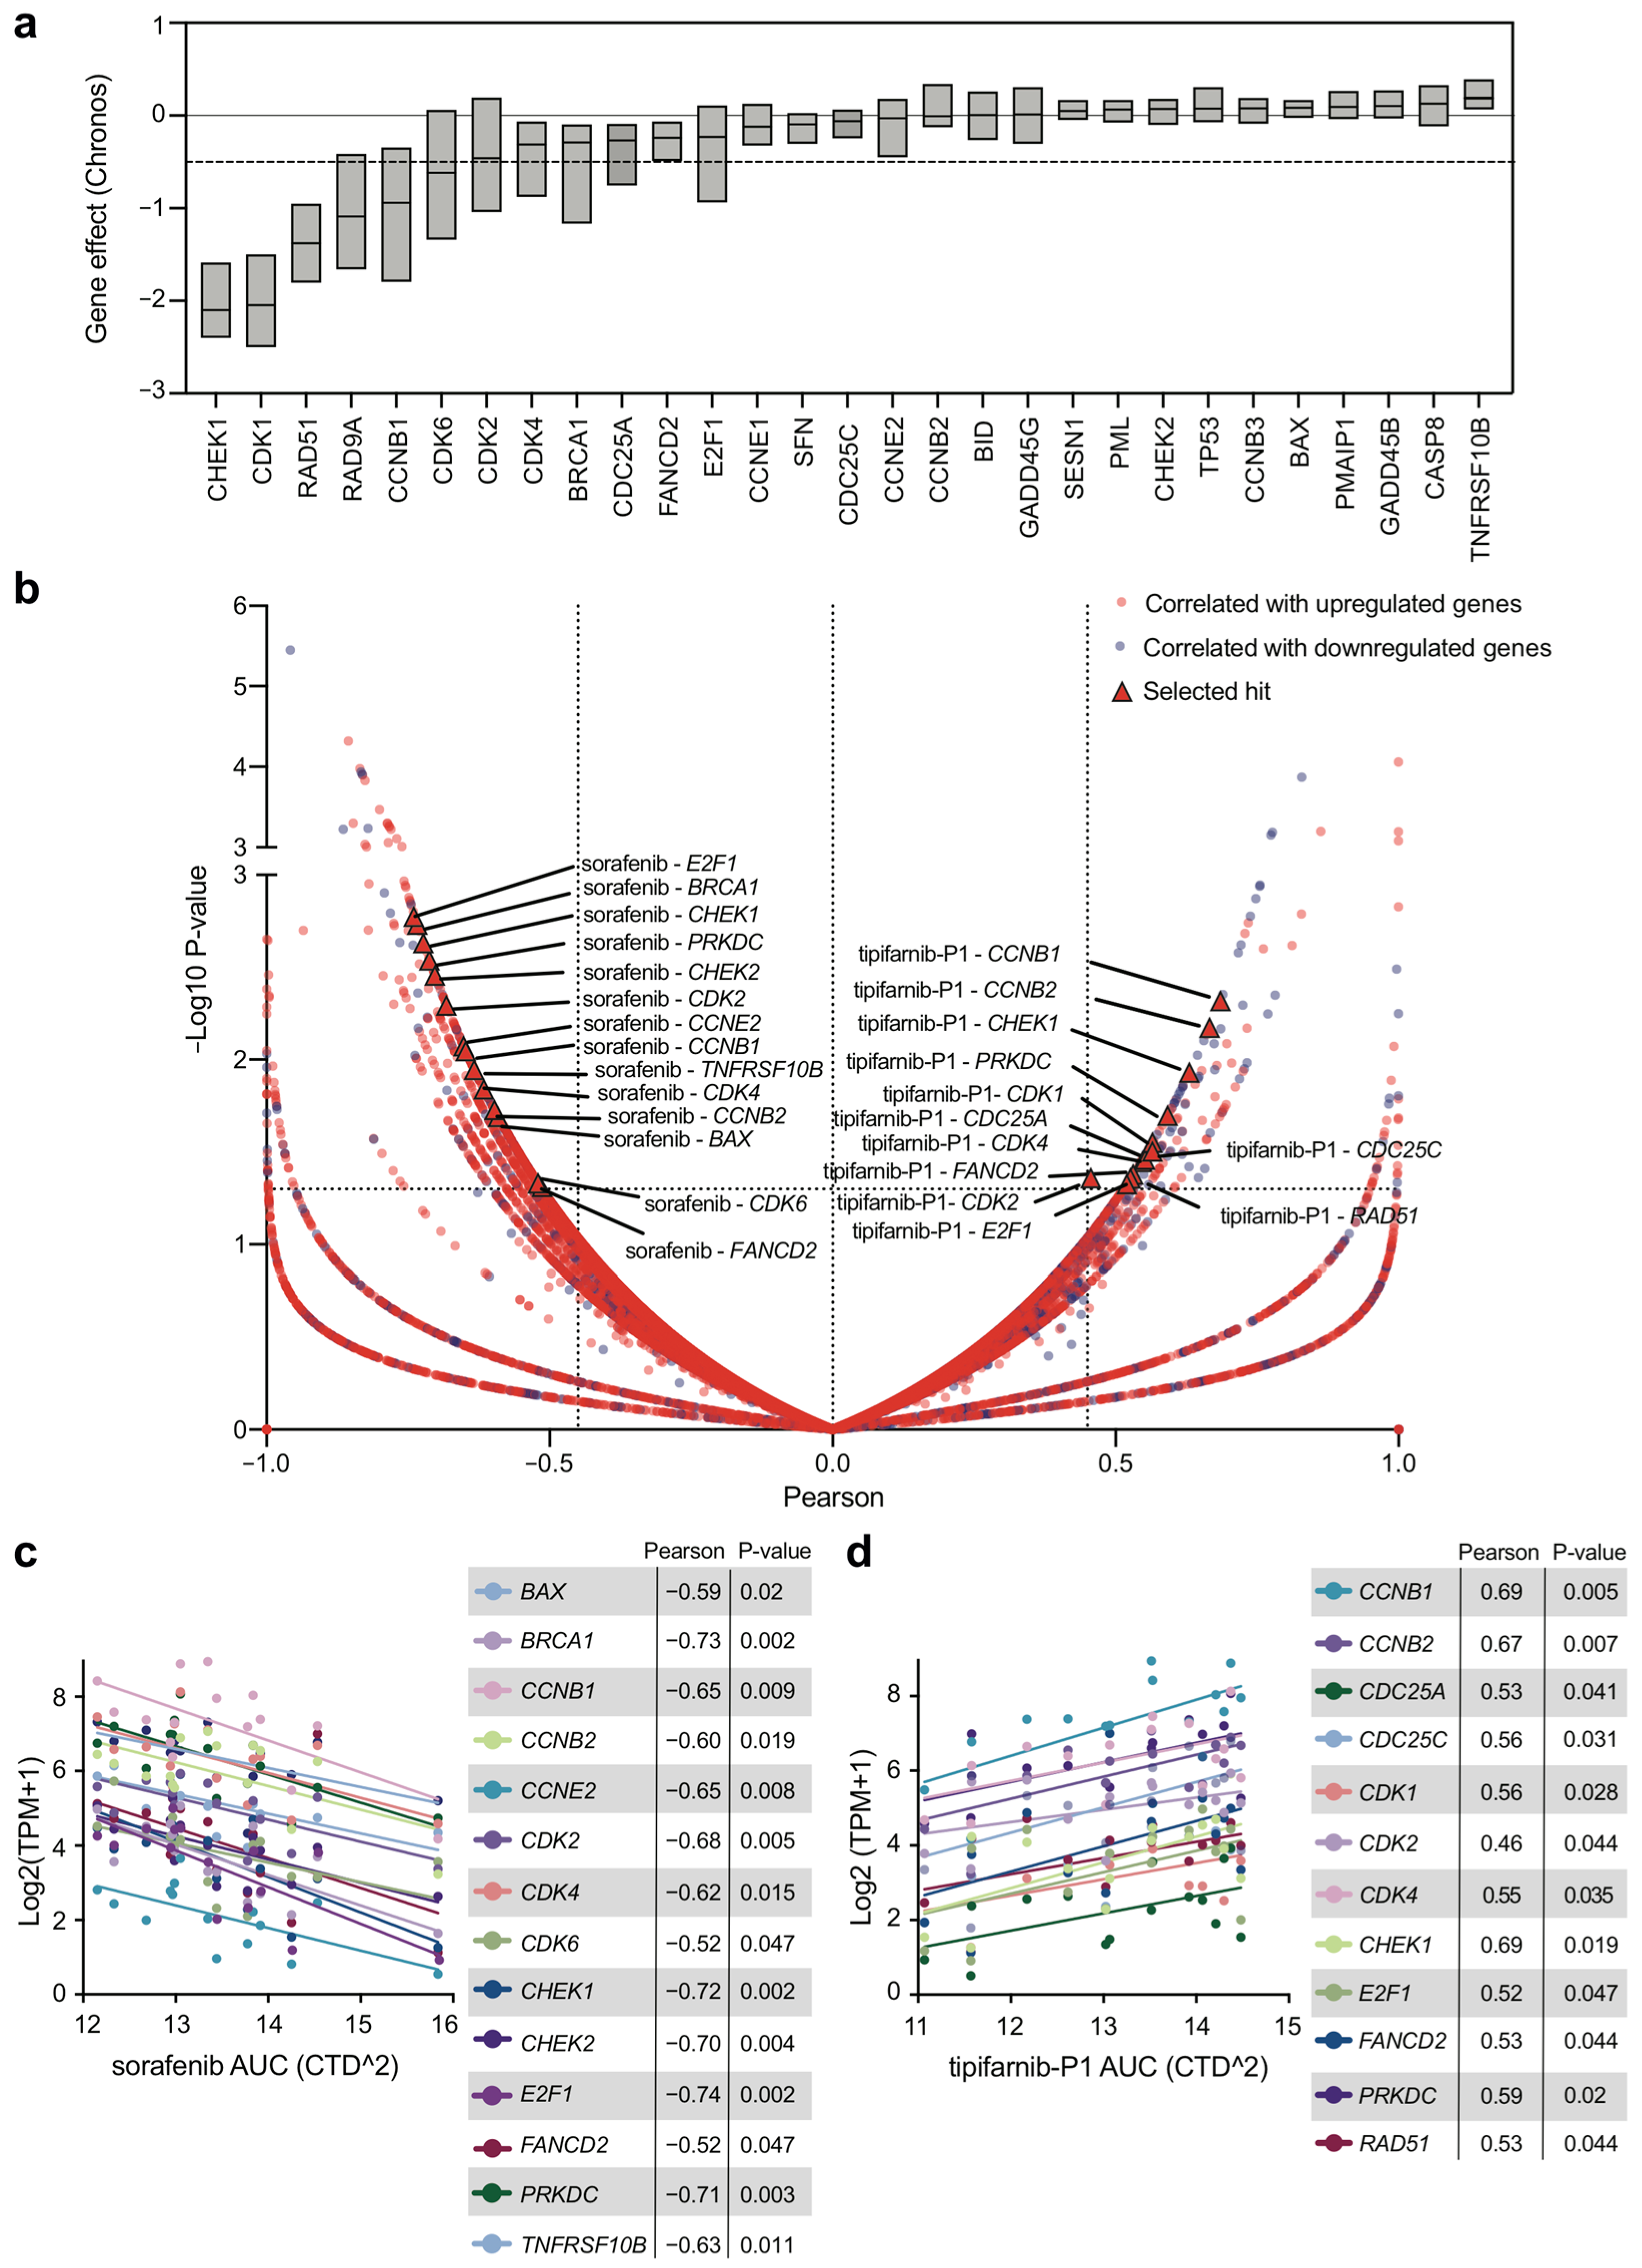
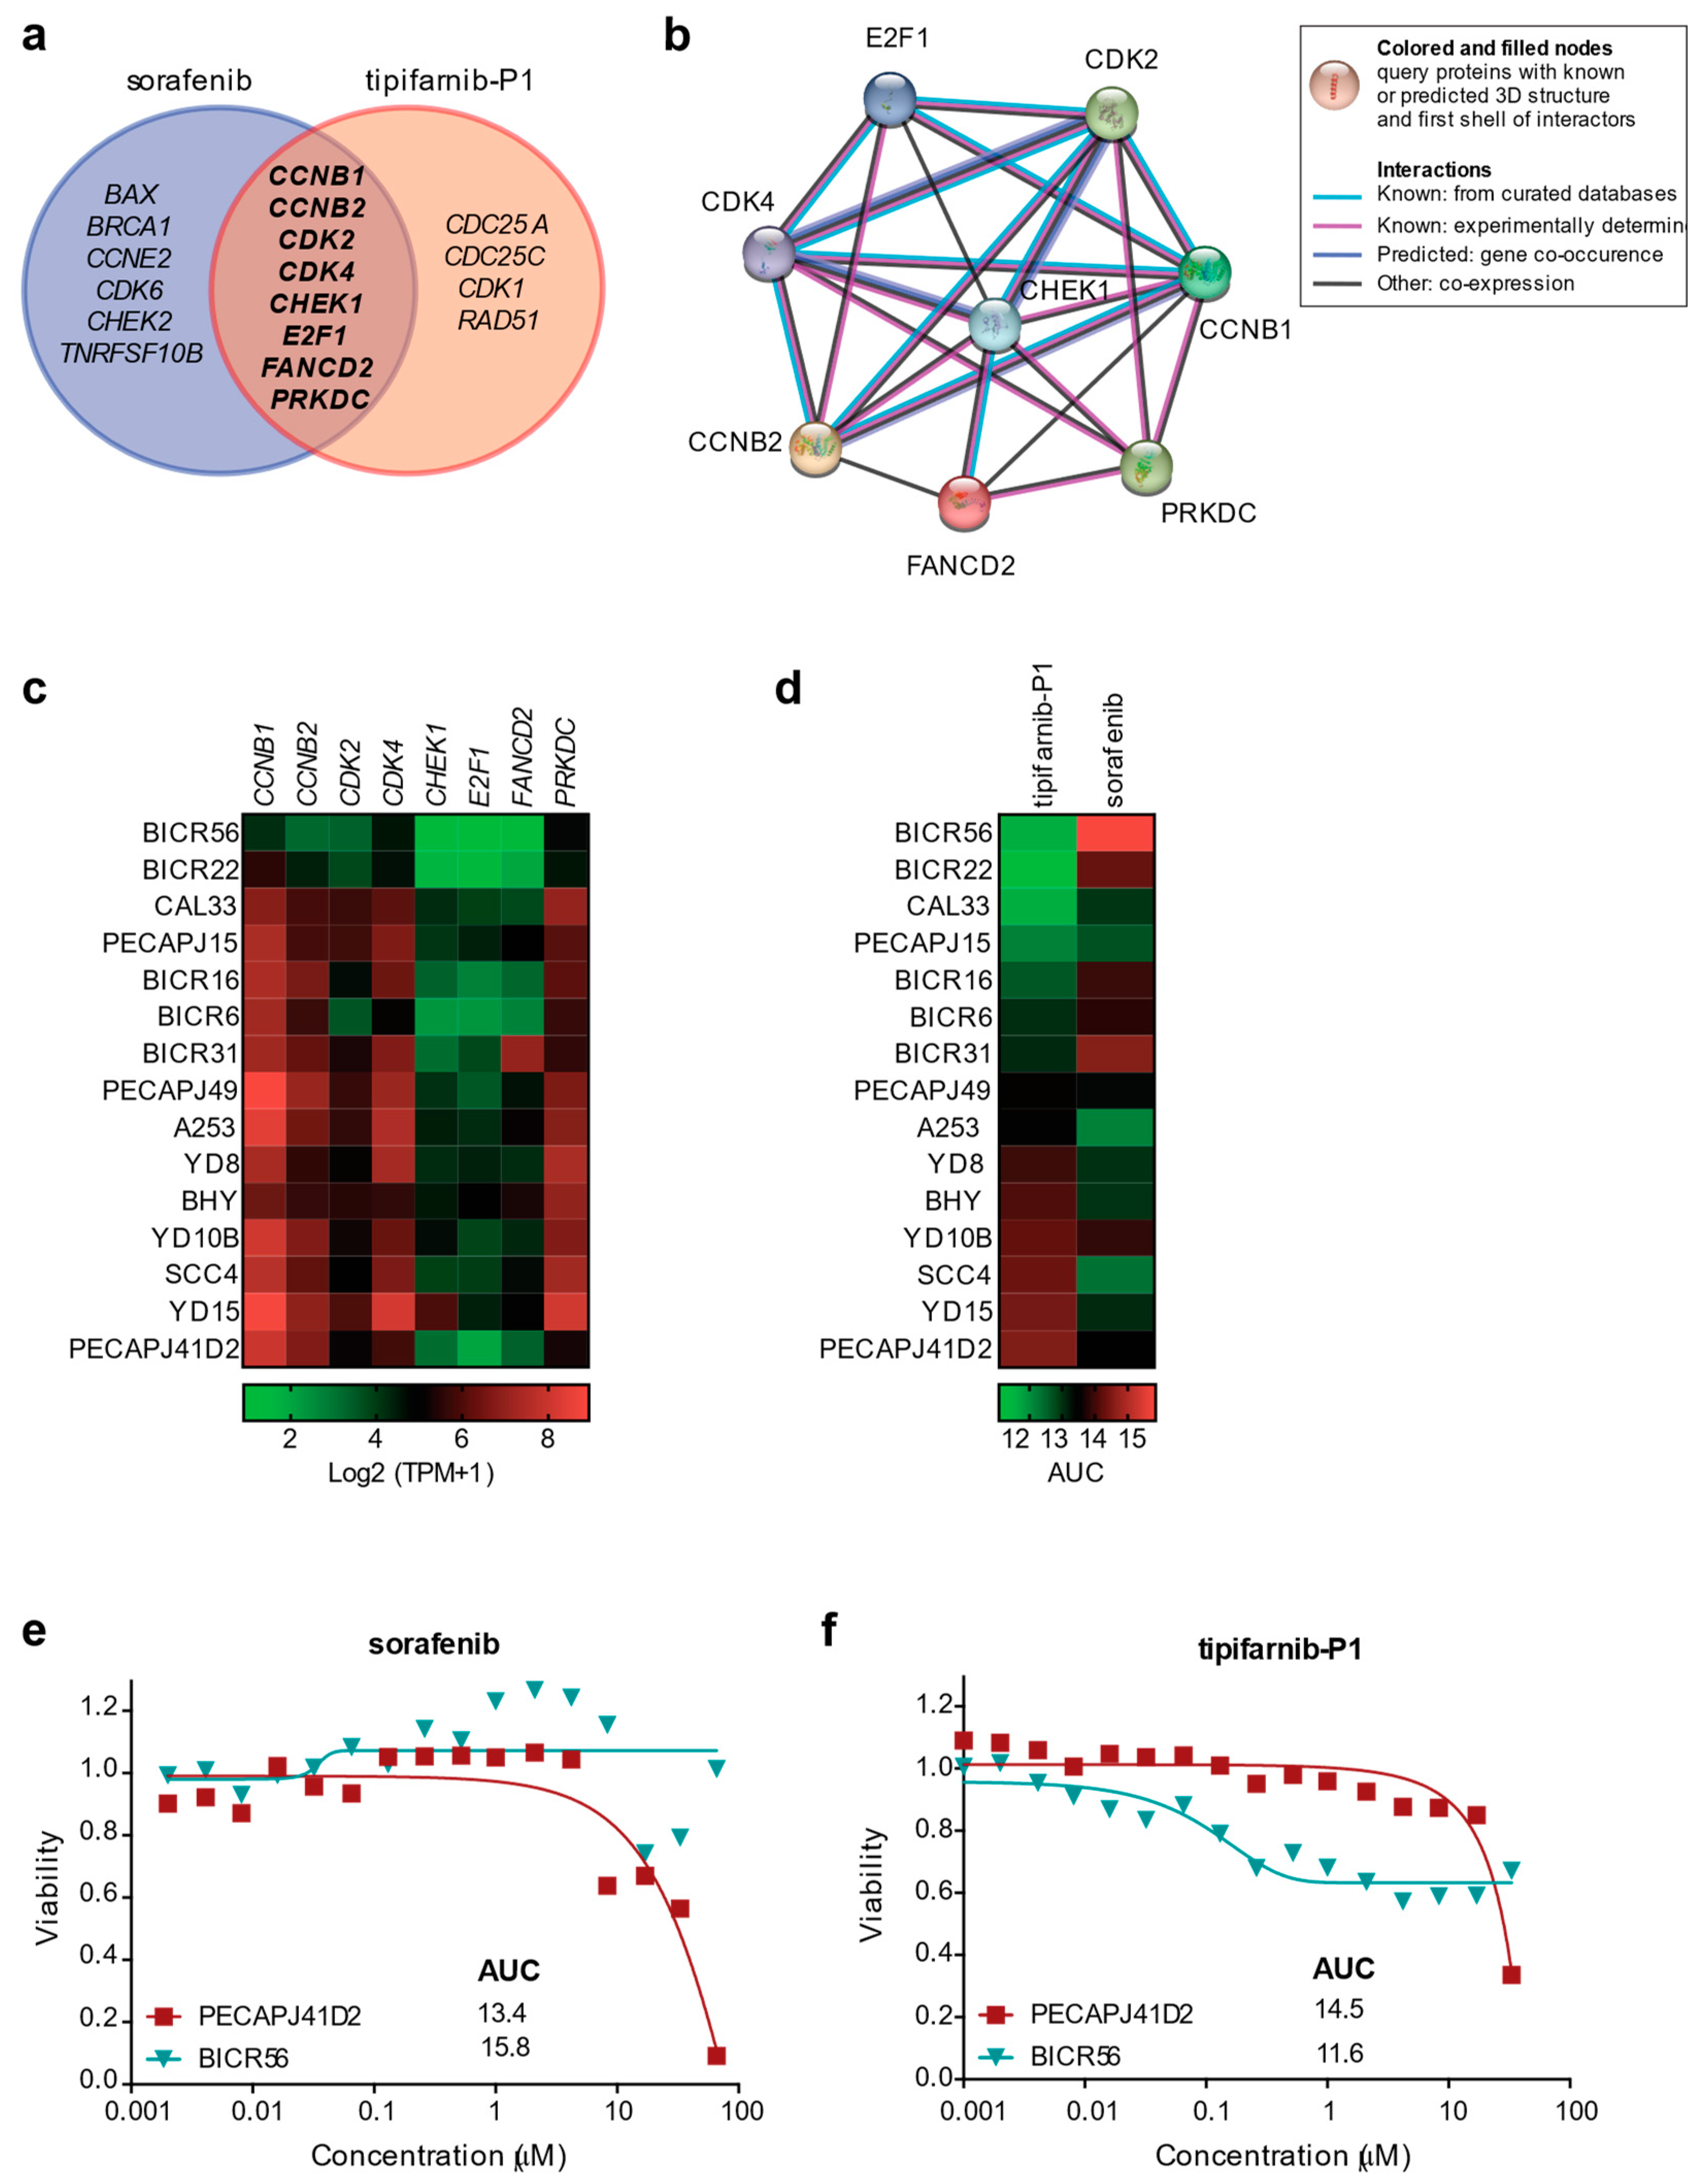
2.5. Expression of DDR Genes Affects Survival and Drug Response of OSCC Tumor Cell Lines In Vitro
3. Discussion
4. Materials and Methods
4.1. Head and Neck Oral Squamous Cell Carcinoma Data
4.2. DNA Damage Response Gene List
4.3. Alteration Frequency Analysis
4.4. Gene Expression Analysis
4.5. Survival Analysis
4.6. Dependency Analysis
4.7. Gene Expression and Drug Sensitivity Analysis
4.8. Statistical Analysis
Supplementary Materials
Author Contributions
Funding
Institutional Review Board Statement
Informed Consent Statement
Data Availability Statement
Conflicts of Interest
References
- Panarese, I.; Aquino, G.; Ronchi, A.; Longo, F.; Montella, M.; Cozzolino, I.; Roccuzzo, G.; Colella, G.; Caraglia, M.; Franco, R. Oral and Oropharyngeal squamous cell carcinoma: Prognostic and predictive parameters in the etiopathogenetic route. Expert Rev. Anticancer Ther. 2019, 19, 105–119. [Google Scholar] [CrossRef] [PubMed]
- Ahmad, W.M.A.W.; Yaqoob, M.A.; Noor, N.F.M.; Ghazali, F.M.M.; Rahman, N.A.; Tang, L.; Aleng, N.A.; Alam, M.K. The Predictive Model of Oral Squamous Cell Survival Carcinoma: A Methodology of Validation. BioMed Res. Int. 2021, 2021, 5436894. [Google Scholar] [CrossRef]
- Du, E.; Mazul, A.L.; Farquhar, D.; Brennan, P.; Anantharaman, D.; Abedi-Ardekani, B.; Weissler, M.C.; Hayes, D.N.; Olshan, A.F.; Zevallos, J.P. Long-term Survival in Head and Neck Cancer: Impact of Site, Stage, Smoking, and Human Papillomavirus Status. Laryngoscope 2019, 129, 2506–2513. [Google Scholar] [CrossRef] [PubMed]
- Chomyn, A.; Meola, G.; Bresolin, N.; Lai, S.T.; Scarlato, G.; Attardi, G. In vitro genetic transfer of protein synthesis and respiration defects to mitochondrial DNA-less cells with myopathy-patient mitochondria. Mol. Cell. Biol. 1991, 11, 2236–2244. [Google Scholar] [CrossRef] [PubMed]
- Kobayashi, K.; Hisamatsu, K.; Suzui, N.; Hara, A.; Tomita, H.; Miyazaki, T. A Review of HPV-Related Head and Neck Cancer. J. Clin. Med. 2018, 7, 241. [Google Scholar] [CrossRef] [PubMed] [Green Version]
- Gupta, S.; Gupta, S. Role of human papillomavirus in oral squamous cell carcinoma and oral potentially malignant disorders: A review of the literature. Indian J. Dent. 2015, 6, 91–98. [Google Scholar] [CrossRef] [PubMed]
- Gondivkar, S.M.; Gadbail, A.R.; Sarode, S.C.; Hedaoo, A.; Dasgupta, S.; Sharma, B.; Sharma, A.; Gondivkar, R.S.; Yuwanati, M.; Patil, S.; et al. Oral and general health-related quality of life in oral squamous cell carcinoma patients- comparative analysis of different treatment regims. J. Oral Biol. Craniofacial Res. 2021, 11, 125–131. [Google Scholar] [CrossRef]
- Johnson, D.E.; Burtness, B.; Leemans, C.R.; Lui, V.W.Y.; Bauman, J.E.; Grandis, J.R. Head and neck squamous cell carcinoma. Nat. Rev. Dis. Prim. 2020, 6, 92. [Google Scholar] [CrossRef]
- Khanna, V.; Karjodkar, F.; Robbins, S.; Behl, M.; Arya, S.; Tripathi, A. Estimation of serum ferritin level in potentially malignant disorders, oral squamous cell carcinoma, and treated cases of oral squamous cell carcinoma. J. Cancer Res. Ther. 2017, 13, 550–555. [Google Scholar] [CrossRef]
- Knochelmann, H.M.; Horton, J.D.; Liu, S.; Armeson, K.; Kaczmar, J.M.; Wyatt, M.M.; Richardson, M.S.; Lomeli, S.H.; Xiong, Y.; Graboyes, E.M.; et al. Neoadjuvant presurgical PD-1 inhibition in oral cavity squamous cell carcinoma. Cell Rep. Med. 2021, 2, 100426. [Google Scholar] [CrossRef]
- Chai, A.W.Y.; Lim, K.P.; Cheong, S.C. Translational genomics and recent advances in oral squamous cell carcinoma. Semin. Cancer Biol. 2020, 61, 71–83. [Google Scholar] [CrossRef]
- Jackson, S.P.; Bartek, J. The DNA-damage response in human biology and disease. Nature 2009, 461, 1071–1078. [Google Scholar] [CrossRef] [PubMed] [Green Version]
- Tubbs, A.; Nussenzweig, A. Endogenous DNA Damage as a Source of Genomic Instability in Cancer. Cell 2017, 168, 644–656. [Google Scholar] [CrossRef] [PubMed] [Green Version]
- Jiang, M.; Jia, K.; Wang, L.; Li, W.; Chen, B.; Liu, Y.; Wang, H.; Zhao, S.; He, Y.; Zhou, C. Alterations of DNA damage repair in cancer: From mechanisms to applications. Ann. Transl. Med. 2020, 8, 1685. [Google Scholar] [CrossRef]
- Hanahan, D.; Weinberg, R.A. Hallmarks of cancer: The next generation. Cell 2011, 144, 646–674. [Google Scholar] [CrossRef] [Green Version]
- Lord, C.J.; Ashworth, A. PARP inhibitors: Synthetic lethality in the clinic. Science 2017, 355, 1152–1158. [Google Scholar] [CrossRef] [PubMed]
- Carusillo, A.; Mussolino, C. DNA Damage: From Threat to Treatment. Cells 2020, 9, 1665. [Google Scholar] [CrossRef] [PubMed]
- Groelly, F.J.; Fawkes, M.; Dagg, R.A.; Blackford, A.N.; Tarsounas, M. Targeting DNA damage response pathways in cancer. Nat. Rev. Cancer 2022, 23, 78–94. [Google Scholar] [CrossRef]
- Hsu, F.-T.; Chang, B.; Chiang, I.-T.; Wu, T.-H.; Hwang, J.-J. Synergistic effect of sorafenib with ionizing radiation on human oral cancer cells. In Vivo 2014, 28, 925–933. [Google Scholar]
- Ho, A.L.; Brana, I.; Haddad, R.; Bauman, J.; Bible, K.; Oosting, S.; Wong, D.J.; Ahn, M.-J.; Boni, V.; Even, C.; et al. Tipifarnib in Head and Neck Squamous Cell Carcinoma with HRAS Mutations. J. Clin. Oncol. 2021, 39, 1856–1864. [Google Scholar] [CrossRef]
- Zhou, G.; Liu, Z.; Myers, J.N. TP53 Mutations in Head and Neck Squamous Cell Carcinoma and Their Impact on Disease Progression and Treatment Response. J. Cell. Biochem. 2016, 117, 2682–2692. [Google Scholar] [CrossRef] [PubMed]
- Sarradin, V.; Siegfried, A.; Uro-Coste, E.; Delord, J.-P. WHO classification of head and neck tumours 2017: Main novelties and update of diagnostic methods. Bull. Cancer 2018, 105, 596–602. [Google Scholar] [CrossRef] [PubMed]
- Venkatesh, A.; Elengkumaran, S.; Ravindran, C.; Malathi, N. Association of Human Papilloma Virus in Oral Squamous Cell Carcinoma: An Alarming Need for Human Papillomavirus 16 Screening in Cancer Patients. J. Pharm. Bioallied Sci. 2021, 13, S1224–S1227. [Google Scholar] [CrossRef] [PubMed]
- Rees, M.G.; Seashore-Ludlow, B.; Cheah, J.H.; Adams, D.J.; Price, E.V.; Gill, S.; Javaid, S.; Coletti, M.E.; Jones, V.L.; Bodycombe, N.E.; et al. Correlating chemical sensitivity and basal gene expression reveals mechanism of action. Nat. Chem. Biol. 2016, 12, 109–116. [Google Scholar] [CrossRef] [PubMed]
- Bugshan, A.; Farooq, I. Oral squamous cell carcinoma: Metastasis, potentially associated malignant disorders, etiology and recent advancements in diagnosis. F1000Research 2020, 9, 229. [Google Scholar] [CrossRef]
- Barillari, G.; Melaiu, O.; Gargari, M.; Pomella, S.; Bei, R.; Campanella, V. The Multiple Roles of CD147 in the Development and Progression of Oral Squamous Cell Carcinoma: An Overview. Int. J. Mol. Sci. 2022, 23, 8336. [Google Scholar] [CrossRef]
- Almangush, A.; Mäkitie, A.A.; Triantafyllou, A.; de Bree, R.; Strojan, P.; Rinaldo, A.; Hernandez-Prera, J.C.; Suárez, C.; Kowalski, L.P.; Ferlito, A.; et al. Staging and grading of oral squamous cell carcinoma: An update. Oral Oncol. 2020, 107, 104799. [Google Scholar] [CrossRef]
- Cheng, Y.; Li, S.; Gao, L.; Zhi, K.; Ren, W. The Molecular Basis and Therapeutic Aspects of Cisplatin Resistance in Oral Squamous Cell Carcinoma. Front. Oncol. 2021, 11, 761379. [Google Scholar] [CrossRef]
- Cancer Genome Atlas Network. Cancer Genome Atlas Network Comprehensive genomic characterization of head and neck squamous cell carcinomas. Nature 2015, 517, 576–582. [Google Scholar] [CrossRef] [Green Version]
- Lindemann, A.; Takahashi, H.; Patel, A.A.; Osman, A.A.; Myers, J.N. Targeting the DNA Damage Response in OSCC with TP53 Mutations. J. Dent. Res. 2018, 97, 635–644. [Google Scholar] [CrossRef]
- Agrawal, N.; Frederick, M.J.; Pickering, C.R.; Bettegowda, C.; Chang, K.; Li, R.J.; Fakhry, C.; Xie, T.-X.; Zhang, J.; Wang, J.; et al. Exome sequencing of head and neck squamous cell carcinoma reveals inactivating mutations in NOTCH1. Science 2011, 333, 1154–1157. [Google Scholar] [CrossRef] [PubMed]
- Pickering, C.R.; Zhang, J.; Yoo, S.Y.; Bengtsson, L.; Moorthy, S.; Neskey, D.M.; Zhao, M.; Ortega Alves, M.V.; Chang, K.; Drummond, J.; et al. Integrative genomic characterization of oral squamous cell carcinoma identifies frequent somatic drivers. Cancer Discov. 2013, 3, 770–781. [Google Scholar] [CrossRef] [PubMed] [Green Version]
- Singh, R.; Das, S.; Datta, S.; Mazumdar, A.; Biswas, N.K.; Maitra, A.; Majumder, P.P.; Ghose, S.; Roy, B. Study of Caspase 8 mutation in oral cancer and adjacent precancer tissues and implication in progression. PLoS ONE 2020, 15, e0233058. [Google Scholar] [CrossRef] [PubMed]
- Leemans, C.R.; Braakhuis, B.J.M.; Brakenhoff, R.H. The molecular biology of head and neck cancer. Nat. Rev. Cancer 2011, 11, 9–22. [Google Scholar] [CrossRef]
- Matthews, H.K.; Bertoli, C.; de Bruin, R.A.M. Cell cycle control in cancer. Nat. Rev. Mol. Cell Biol. 2022, 23, 74–88. [Google Scholar] [CrossRef]
- Mihara, M.; Shintani, S.; Nakahara, Y.; Kiyota, A.; Ueyama, Y.; Matsumura, T.; Wong, D.T. Overexpression of CDK2 is a prognostic indicator of oral cancer progression. Jpn. J. Cancer Res. 2001, 92, 352–360. [Google Scholar] [CrossRef]
- Laban, S.; Steinmeister, L.; Gleißner, L.; Grob, T.J.; Grénman, R.; Petersen, C.; Gal, A.; Knecht, R.; Dikomey, E.; Kriegs, M. Sorafenib sensitizes head and neck squamous cell carcinoma cells to ionizing radiation. Radiother. Oncol. 2013, 109, 286–292. [Google Scholar] [CrossRef]
- Möckelmann, N.; Rieckmann, T.; Busch, C.-J.; Becker, B.; Gleißner, L.; Hoffer, K.; Omniczynski, M.; Steinmeister, L.; Laban, S.; Grénman, R.; et al. Effect of sorafenib on cisplatin-based chemoradiation in head and neck cancer cells. Oncotarget 2016, 7, 23542–23551. [Google Scholar] [CrossRef] [Green Version]
- End, D.W.; Smets, G.; Todd, A.V.; Applegate, T.L.; Fuery, C.J.; Angibaud, P.; Venet, M.; Sanz, G.; Poignet, H.; Skrzat, S.; et al. Characterization of the antitumor effects of the selective farnesyl protein transferase inhibitor R115777 in vivo and in vitro. Cancer Res. 2001, 61, 131–137. [Google Scholar]
- Untch, B.R.; Dos Anjos, V.; Garcia-Rendueles, M.E.R.; Knauf, J.A.; Krishnamoorthy, G.P.; Saqcena, M.; Bhanot, U.K.; Socci, N.D.; Ho, A.L.; Ghossein, R.; et al. Tipifarnib Inhibits HRAS-Driven Dedifferentiated Thyroid Cancers. Cancer Res. 2018, 78, 4642–4657. [Google Scholar] [CrossRef] [Green Version]
- Goldman, M.J.; Craft, B.; Hastie, M.; Repečka, K.; McDade, F.; Kamath, A.; Banerjee, A.; Luo, Y.; Rogers, D.; Brooks, A.N.; et al. Visualizing and interpreting cancer genomics data via the Xena platform. Nat. Biotechnol. 2020, 38, 675–678. [Google Scholar] [CrossRef] [PubMed]


Disclaimer/Publisher’s Note: The statements, opinions and data contained in all publications are solely those of the individual author(s) and contributor(s) and not of MDPI and/or the editor(s). MDPI and/or the editor(s) disclaim responsibility for any injury to people or property resulting from any ideas, methods, instructions or products referred to in the content. |
© 2023 by the authors. Licensee MDPI, Basel, Switzerland. This article is an open access article distributed under the terms and conditions of the Creative Commons Attribution (CC BY) license (https://creativecommons.org/licenses/by/4.0/).
Share and Cite
Pomella, S.; Cassandri, M.; Melaiu, O.; Marampon, F.; Gargari, M.; Campanella, V.; Rota, R.; Barillari, G. DNA Damage Response Gene Signature as Potential Treatment Markers for Oral Squamous Cell Carcinoma. Int. J. Mol. Sci. 2023, 24, 2673. https://doi.org/10.3390/ijms24032673
Pomella S, Cassandri M, Melaiu O, Marampon F, Gargari M, Campanella V, Rota R, Barillari G. DNA Damage Response Gene Signature as Potential Treatment Markers for Oral Squamous Cell Carcinoma. International Journal of Molecular Sciences. 2023; 24(3):2673. https://doi.org/10.3390/ijms24032673
Chicago/Turabian StylePomella, Silvia, Matteo Cassandri, Ombretta Melaiu, Francesco Marampon, Marco Gargari, Vincenzo Campanella, Rossella Rota, and Giovanni Barillari. 2023. "DNA Damage Response Gene Signature as Potential Treatment Markers for Oral Squamous Cell Carcinoma" International Journal of Molecular Sciences 24, no. 3: 2673. https://doi.org/10.3390/ijms24032673