Article

The Chromosome-Level Genome of Hestina assimilis (Lepidoptera: Nymphalidae) Reveals the Evolution of Saprophagy-Related Genes in Brush-Footed Butterflies

1
College of Life Sciences, Shaanxi Normal University, Xi’an 710119, China
2
School of Chemistry and Bioengineering, Hechi University, Yizhou 546300, China
*
Authors to whom correspondence should be addressed.
These authors contributed equally to this work.
Int. J. Mol. Sci. 2023, 24(3), 2087; https://doi.org/10.3390/ijms24032087
Submission received: 10 November 2022 / Revised: 6 January 2023 / Accepted: 16 January 2023 / Published: 20 January 2023
(This article belongs to the Collection Feature Papers in Molecular Genetics and Genomics)

Abstract

:
Most butterflies feed on nectar, while some saprophagous butterflies forage on various non-nectar foods. To date, little is known about the genomic and molecular shifts associated with the evolution of the saprophagous feeding strategy. Here, we assembled the high-quality chromosome-level genome of Hestina assimilis to explore its saprophagous molecular and genetic mechanisms. This chromosome-level genome of H. assimilis is 412.82 Mb, with a scaffold N50 of 15.70 Mb. In total, 98.11% of contigs were anchored to 30 chromosomes. Compared with H. assimilis and other Nymphalidae butterflies, the genes of metabolism and detoxification experienced expansions. We annotated 80 cytochrome P450 (CYP) genes in the H. assimilis genome, among which genes belonging to the CYP4 subfamily were significantly expanded (p < 0.01). These P450 genes were unevenly distributed and mainly concentrated on chromosomes 6–9. We identified 33 olfactory receptor (OR), 20 odorant-binding protein (OBP), and six gustatory receptor (GR) genes in the H. assimilis genome, which were fewer than in the nectarivorous Danaus plexippus. A decreased number of OBP, OR, and GR genes implied that H. assimilis should resort less to olfaction and gustation than their nectarivorous counterparts, which need highly specialized olfactory and gustatory functions. Moreover, we found one site under positive selection occurred in residue 996 (phenylalanine) of GR genes exclusive to H. assimilis, which is conservative in most lineages. Our study provides support for the adaptive evolution of feeding habits in butterflies.

1. Introduction

Evolutionary shifts related to changes in feeding habits are considered one of the most critical events in animal evolution [1,2,3]. The brush-footed butterfly (family Nymphalidae) is one of the most species-rich butterfly taxa, with more than 6000 species [4]. While most adults are nectarivorous flower visitors and strongly depend on flower nectar and pollen, some butterflies forage for various non-nectar foods, such as rotting fruit, honeydew, tree sap, mud, carrion, and dung [5,6,7]. These species have significant morphological variation in their proboscis, which appears to be related to their specialization and adaptation concerning the physical properties of humus [8] and physiological characteristics associated with the processing of non-nectar foods. Non-nectar foods differ significantly from flower nectar in their chemical properties, including low sugar concentrations and fermentation products (ethanol and acetic acid) [5,9]. Research shows that ethanol and acetic acid, together with low concentrations of sugar, synergistically stimulate the feeding behavior of saprophagous butterflies [5,10]. Although such feeding habits are intriguing from the ecological and evolutionary aspects of food utilization in adult butterflies, the genomic and molecular shifts associated with the evolution of the saprophagous feeding strategy remain largely unknown.
Hestina assimilis Linnaeus (1758) is a larger species of Nymphalidae with strong adaptability and a wide distribution [11]. It recognized by 4–5 red spots on the outer edge of its hind wing; thus, it is commonly known as a red ring skirt [12]. It is a typical saprophagous butterfly, and the adults can utilize the diluted liquid of rotting foods such as tree sap, rotting fruits, and even feces. Due to this trait, the survival range and population size of H. assimilis can expand continuously [13]. Therefore, H. assimilis can serve as an ideal model for exploring the mechanisms of saprophagy [14].
Cytochrome P450 monooxygenases (CYPs) can specifically and non-specifically neutralize various types of humus [15,16,17]. Most CYP3 genes are involved in the metabolic detoxification of secondary plant substances to help insects better adapt to host plants [18,19]. The CYP4 subfamily has been associated with lipid metabolism, epidermal hydrocarbon formation, and insect olfactory recognition regulation [20]. Several CYP2 and mitochondria P450 genes play vital roles in regulating the growth and development or preventing the invasion of pathogens and substances [20,21]. Chemoreceptions provide attractive models to understand how organisms adapt to diverse diets because they lie between external environmental signals and internal physiological responses [22]. Olfactory receptors (ORs) and odorant-binding proteins (OBPs) participate in the olfactory response of insects by recognizing and binding host plant volatiles [20]. Olfactory responses are fundamental to the life cycles of insects, which they use for foraging, communicating with conspecifics, and recognizing predators [23]. The differences in food selection are likely to reflect the difference in their gustatory responsiveness. Gustatory receptors (GRs) are well known for their functions in sensory neurons in detecting food and toxins [24]. The expression of GRs across different tissues and sexes is a strong candidate for mediating unusual feeding behavior [25]. Therefore, identifying these gene families is beneficial for elucidating the mechanism of the dietary transition in immunity, recognition, and detection.
Here, we generated a chromosome-level reference genome of H. assimilis, and used a comparative genomic approach to identify gene families that could facilitate saprophagous behavior or physiological means. This work serves as a valuable genomic resource for understanding the ecological and evolutionary characteristics of H. assimilis.

2. Results

2.1. High-Quality Chromosome-Level Assembly, Gene Prediction, and Functional Annotation

We obtained 62.39 Gb (147×) of nanopore long reads and 69.43 Gb (165×) of Illumina paired-end reads to construct the contig-level genome for this butterfly. We yielded a 422.61 Mb assembly (scaffold number: 53, N50: 14.28 Mb), which was consistent with the genome size estimated based on the k-mer analysis (421.41 Mb) (Figure S1). Combined with the 88.21 Gb (200×) of Hi-C fragment libraries sequencing, 98.11% of scaffolds from H. assimilis anchored onto 30 chromosomes, ranging from 5.17 Mb to 23.25 Mb in length (Figure S2), which suggested that the karyotype of H. assimilis was 30. Finally, a 412.82 Mb assembly (scaffold N50: 15.70 Mb; GC content: 35.45%) of haplotype genomes without a heterozygous sequence was yielded with 95.80% completeness of the BUSCO analysis (lepidoptera_odb10 database), which was adequate for further research.
We identified ~35.07% of the assembled genomes as repetitive sequences (Table S1). Among them, the repetitive sequences dominated with long interspersed nuclear elements (LINEs, 9.56%) and short interspersed nuclear elements (SINEs, 9.53%). We compared the repeats of H. assimilis with other species in the same family, and the proportions and length of repeats in each species were not correlated with dietary differences (Figure S3). After masking the repeat elements, we identified 16,120 protein-coding genes with a 95.10% BUSCO value in the H. assimilis genome. In total, 12,095 (75.03%) and 13,965 (86.63%) predicted genes were supported through the use of functional annotation from the InterProScan and NR databases (Tables S2 and S3). The average lengths of genes and CDSs were 9983 bp and 1440 bp, respectively, compared to other Lepidoptera species (Figure S4).

2.2. Synteny Analysis

Using Melitaea cinxia as a reference, a synteny plot revealed the sex chromosomes among 30 super-scaffolds. Our results showed that chromosome one of H. assimilis was syntenic to the Z chromosome (chromosome one) and autosomes (chromosome 26) of M. cinxia (Figure 1). Then, we assessed the sequencing coverage and constructed 3D chromatin structure analyses using an Hi-C read pair. The average coverage was consistent across the entire Z chromosome length. Moreover, the frequency of the Hi-C read pair interactions was the same as that of other unfused genomic regions, suggesting a Z-autosome fusion event in H. assimilis (Figure S5). To further confirm this event, we performed the homology-based chromosomal assignments using Danaus plexippus as a reference, concluding that the Z-autosome fusion did exist in H. assimilis (Figure 1).

2.3. Phylogenetic and Positive Selection Analysis

We aligned the 1453 single-copy orthologous genes of the 13 species described (Papilio bianor and Papilio xuthus as the outgroup) to reconstruct a maximum-likelihood phylogenetic tree. The time-calibrated tree showed that the divergence time of H. assimilis was approximately ~51.83 Mya (Figure 2A).
We identified 14 positive selection genes specific to H. assimilis, including genes encoding bi-functional peptidase and arginyl-hydroxylase, delta-1-pyrroline-5-carboxylate dehydrogenase (P5CDh), B-cell receptor-associated protein, and the peroxisomal membrane protein (Table S4). These genes contribute to the energy supply and innate immunity to resist bacterial infection.

2.4. Gene Family Associated with Diet Metabolism Analysis

Regarding the gene families of 15 species to assign, H. assimilis had 777 expansion and 1725 contraction gene families (Figure 2A). In total, 117 significantly expanded (adjusted p-value < 0.01) gene families enriched biological process terms, including the macromolecule metabolic process (GO:0043170), organic cyclic compound metabolic process (GO:1901360), cellular nitrogen compound metabolic process (GO:0034641), and heterocycle metabolic process (GO:0046483) (Figure 2B, Table S5). KEGG pathways of the expanded gene families mainly included signaling and cellular processes, alcoholism, P450, and lipid metabolism (Figure 2B). Interestingly, the main metabolic signaling pathways, NOD-like receptor, AMPK, FoxO, and PI3K-Akt, were also expanded in the genome of H. assimilis (Table S6).
On the common nodes of the cluster leading to four saprophagous species (Vanessa tameamea, Vanessa atalanta, M. cinxia, and H. assimilis) (at the red star in Figure 2A)we predicted 87 expanded and 685 contracted gene families. Among them, 23 significantly expanded gene families enriched several GO categories, including the regulation of alcohol metabolism, nitrogen, heterocycle, and the aromatic compound catabolic process (Table S7).

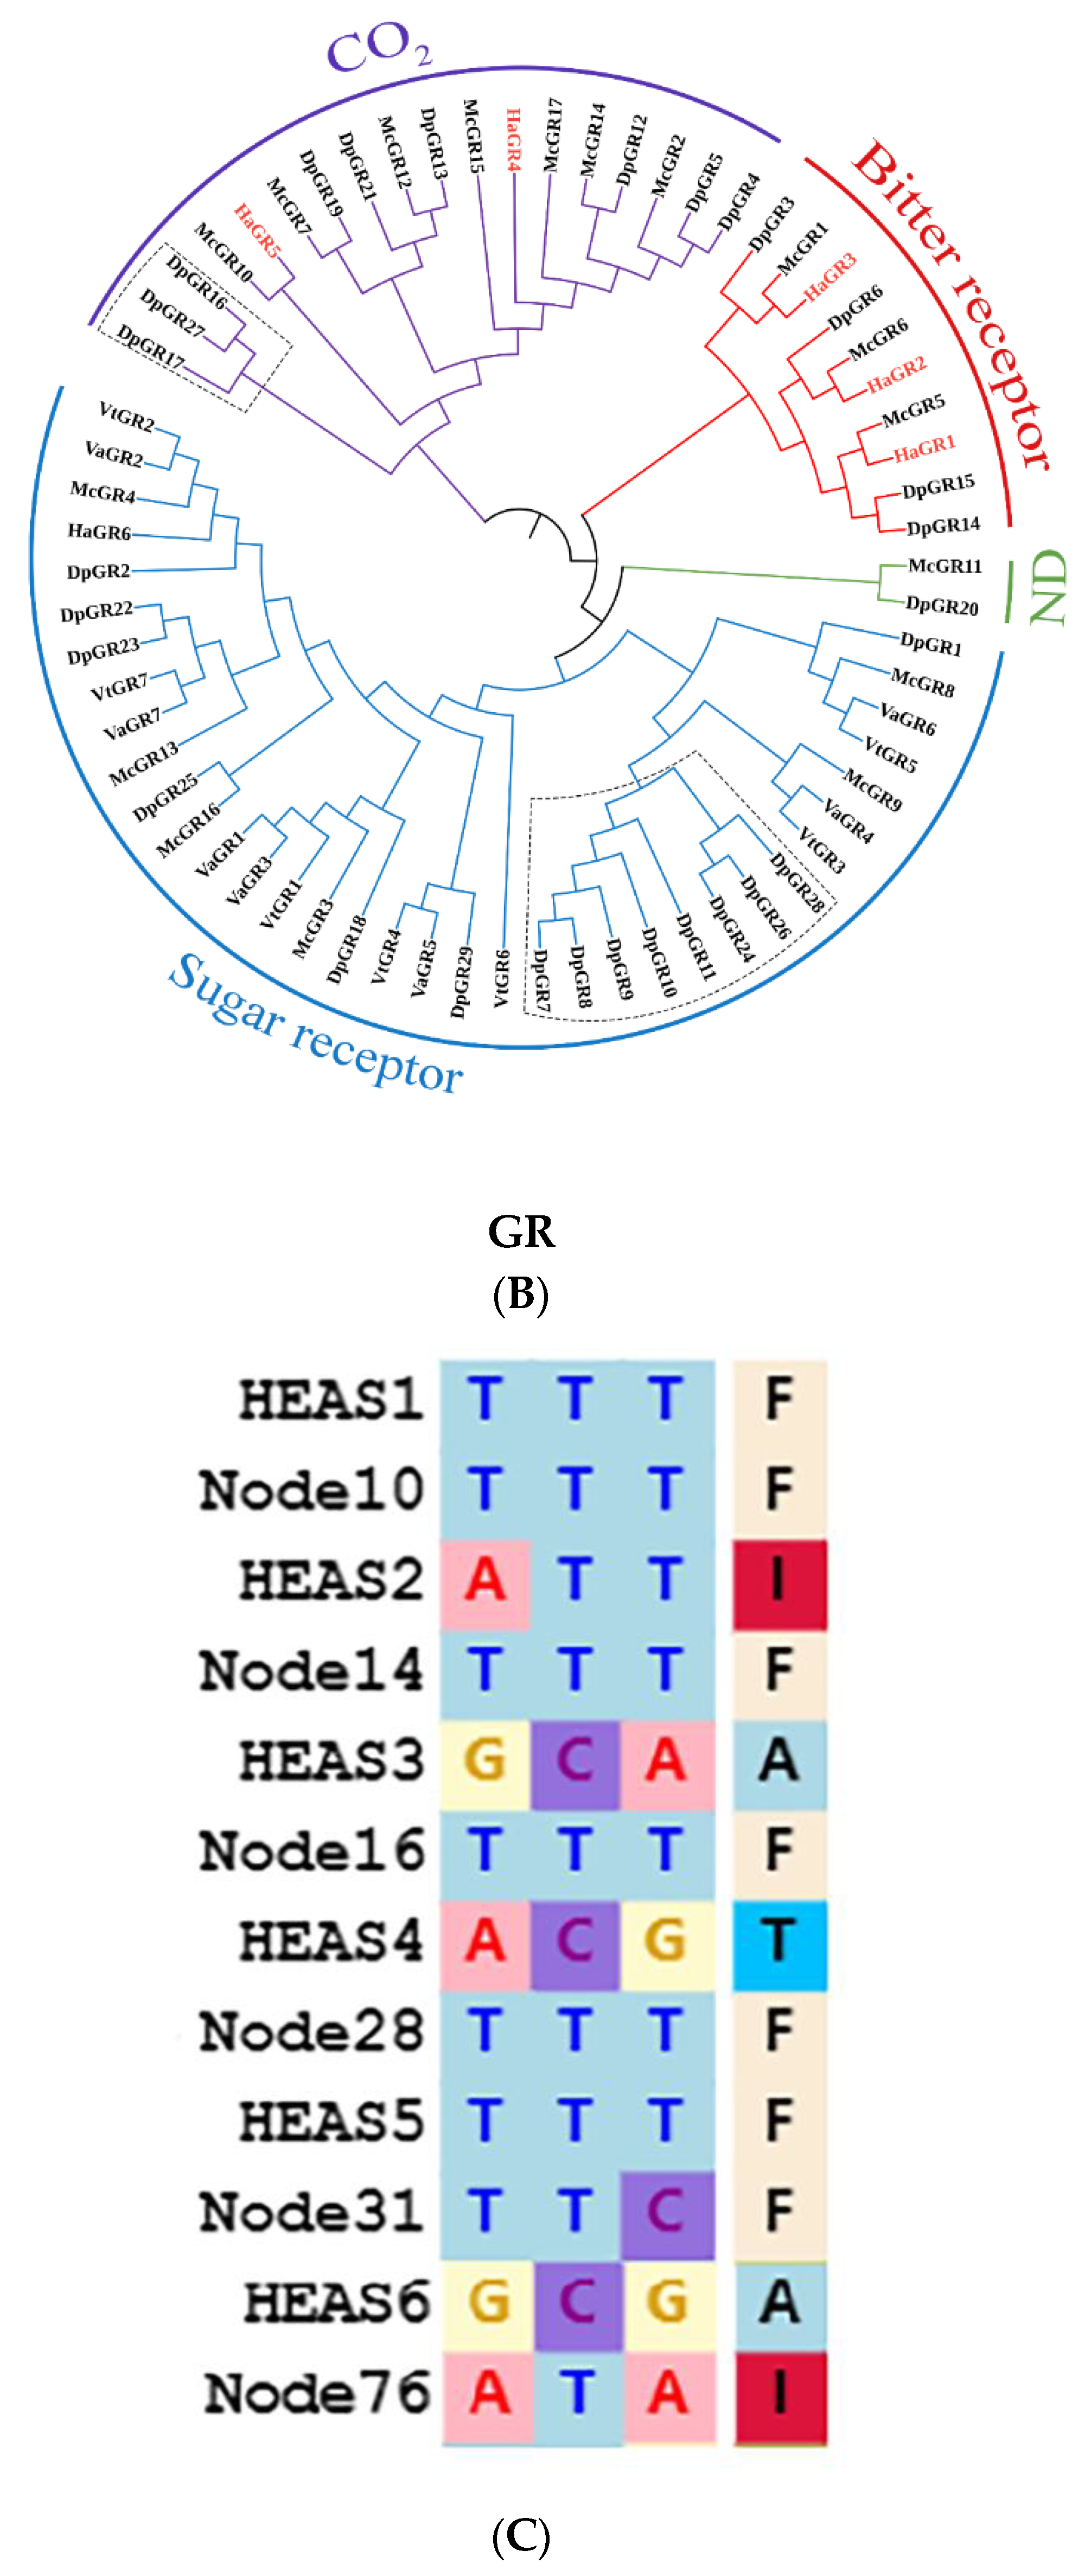
2.5. Evolution of P450, OBP, OR, and GR Gene Families Related to Saprophagy in H. assimilis

We predicted 80 cytochrome P450s, 17 glutathione S-transferase, and 26 ATP-binding cassette transporters in H. assimilis (Table S8). These associated families also showed a pattern of general expansion in H. assimilis. We focused on the P450s, since their expansion was greatest in H. assimilis. The 80 CYP genes were unevenly distributed on the 16 chromosomes, and concentrated in chromosomes 6–9 (Figure 3A). The phylogenetic analysis found the 80 CYP genes divided into 18 families (Figure 3B). The phylogenetic relationships and chromosomal locations of the CYP genes revealed that the CYPs had independent gene duplication events in different chromosomal regions in H. assimilis. Compared with the four genomes of the Nymphalidae species, saprophagous feeders (M. cinxia, V. tameamea, and V. atalanta), and nectar feeders (D. plexippus), the number of CYP genes identified in H. assimilis was comparable to the other species. The P450 genes clustered with the lineages of CYP4 (39/80 genes), CYP3 (23/80 genes), CYP2 (11/80 genes), and the mitochondrial P450 clade (7/80 genes) (Figure 3B, Table 1). The expansions of the CYP4 and CYP3 clans in H. assimilis indicated its higher probability of encountering xenobiotics in living environments.
We found that the chemoreception gene family was contracted in H. assimilis. Then, we manually annotated 33 ORs, 20 OBPs, and 6 GRs (Table S9). We visualized the chromosomal distribution of these gene families. The ORs were distributed in the 15 chromosomes, and most OR genes were located on chromosome 16, with five ORs. OBPs were distributed across the 12 chromosomes, while six GRs were independently distributed on 6 chromosomes (Figure 3A). The phylogenetic tree indicated many deletions of chemoreception genes, explaining why H. assimilis have very different feeding habits. The genes in each cluster shared a common ancestor, as seen in the saprophagous H. assimilis, M. cinxia, V. tameamea, and V. atalanta, where these genes were distributed almost as singletons. The ORs and OBPs were divided into six and seven clusters: groups 1–6 and groups 1–7 (Figure 3B). Compared to other species, H. assimilis possessed the fewest OR and OBP genes, especially significantly reducing the genes in group six and group four, respectively (Figure 3B).
In particular, we found that the abundance of GR, another chemosensory-related gene, in the saprophagous H. assimilis, M. cinxia, V. tameamea, and V. atalanta was significantly lower than in the nectarivorous D. plexippus (Table 1). GRs formed four conserved lineages in the phylogeny, and were annotated as potentially being sugar, bitter, CO2, and unknown function receptors. Despite a lower number of GRs identified, H. assimilis possessed more bitter receptors than sugar receptors, which was consistent with its saprophagous habit. Meanwhile, D. plexippus putative sugar GRs exhibited species-specific small expansions that could reflect its ecology as a flower nectar butterfly. A further analysis based on the branch-site model under PAML detected 1175 GR sites, one of which was under positive selection (in residue 996, p < 0.05) in H. assimilis (Figure 3B). The most frequent non-synonymous substitutions in this site were Phe to Ile, Phe to Ala, and Phe to Thr, which are generally conservative in most lineages, and can lead to the diversified selection of GRs in H. assimilis.

3. Discussion

Saprophagous habits have been observed in butterfly species, beetles, hornets, and flies [5]. However, little is currently known about the related genetic mechanisms. Our study provides unparalleled knowledge of butterflies’ genomic signatures behind saprophagy. We assembled a high-quality chromosome-level reference genome of the male H. assimilis, the representative of saprophagous butterflies in China. The final assembled genome was 412.82 Mb, and we anchored 98.11% of the scaffolds onto 30 chromosomes, consistent with the patterns of karyotype in D. plexippus [26,27]. Using a combination of synteny, Hi–C interaction, and sequencing coverage analysis to exclude an error in genome assembly, we documented a Z-autosome fusion event in a male H. assimilis. This discovery of Z-autosome fusion in H. assimilis creates novel opportunities to address the rates of molecular evolution, the evolution of dosage compensation, the pattern of allosome divergence, and many other essential questions in sex chromosome biology.
To clarify how saprophagous butterflies can avoid the adverse effects of diets, we found that gene families involved in alcohol metabolism, nitrogen, heterocycle, and the aromatic compound catabolic process significantly expanded in the saprophagous H. assimilis, M. cinxia, V. tameamea, and V. atalanta (Table S6). These were consistent with the characteristics of rotten food, that is, low sugar concentrations and the presence of fermentation products (ethanol and acetic acid) [5,9].
H. assimilis is particularly fond of rotting foods, which led to numerous opportunities to expose it to microbes and pathogens. Thus, we paid attention to the detoxification gene family. We annotated 80 P450 genes in H. assimilis, of which most CYP genes belong to the CYP4 clan, followed by the CYP3 clan. CYP4 played a crucial role in insect resistance to pathogen invasion and environmental stress, and CYP3 was generally involved in the detoxification and metabolism of exogenous substances [28,29,30]. The expansions of these two clans may benefit H. assimilis in exogenous substance resistance and survival in extreme conditions.
The chemosensory recognition system mediates feeding behaviors [22]. Niimura et al. found that the OR gene loss in primate evolution was possibly linked to anatomical changes in sensory systems and dietary transitions [31]. We identified the OR and OBP genes in the H. assimilis genome and compared them with those in other Nymphalidae species. We observed a reduction in the number of OR and OBP genes in H. assimilis, M. cinxia, V. tameamea, and V. atalanta compared to D. plexippus, because odor information is essential for nectar foraging, but less so for sap foraging. Notably, the number of candidate GRs identified in the H. assimilis, M. cinxia, V. tameamea, and V. atalanta genomes dramatically reduced compared to D. plexippus. GRs can be categorized into sugar, bitter, CO2, and unknown function receptors through differentiation in function [32]. Some studies found that sugar receptors can influence the host plant search and the oviposition behavior of female Cydia Pomonella. Moths usually use CO2 as cues to detect the floral food source, and CO2 receptors play an essential role in this process [33]. Bitter receptors mainly perceive the large variety of toxic substances that evoke aversive behaviors in caterpillars and moths [34]. H. assimilis bitter receptors were more numerous than sugar receptors, consistent with its saprophagous feeding behavior. Interestingly, we found a positive site of GR selected in H. assimilis. Whether the replacement to phenylalanine affects the combination of GRs and various taste substances in food needs further verification.

4. Materials and Methods

4.1. Sample Collection and Sequencing

Three male adult H. assimilis individuals (NCBI txid 378390) were collected from Hu county (34°09′00.00″ N, 108°32′00.00″ E), Shaanxi province, China, in June 2021. Two adult individuals were sequenced on an Illumina X-ten (Illumina HiSeq XTen, San Diego, CA, USA) and a Nanopore PromethION (Oxford Nanopore Technologies, Oxford, UK) platform [35]. All sequencing tasks were commissioned by the Novegene Technology Biological Company (Beijing Novegene Technology Co., Ltd., Beijing, China). For details of the specific operations and the use of kits, we referred to the company’s official website (https://www.novogene.cn/tech/service/, accessed on 28 August 2021). In brief, the short-read Illumina sequencing library was obtained using ~5 μg of DNA using the standard sequencing kit protocol (NEBNext Ultra DNA Library Prep Kit for Illumina, New England Biolabs, Ipswich, MA, USA). The nanopore long-read sequencing library was constructed using approximately 10 µg of DNA and the SQK-LSK109 Ligation Sequencing Kit. The retrieved library had a mean DNA fragment length of approximately 20 kb. The Hi-C DNA library preparation was constructed following a conventional protocol [36]. Before the Hi-C DNA library construction, formaldehyde initially processed the extracted cells by chemically fixing the cross-links of intracellular proteins with DNA and DNA to preserve the interaction relationships that maintained the structure inside the cells. Then, after treatment with MboI restriction endonuclease, the produced DNA fragments were used as inputs for the conventional DNA short-read library constructions, following the standard procedures. Using ~30 μg of DNA, the Hi-C DNA library was eventually constructed with the NEBNext Ultra II DNA Library Prep Kit (New England Biolabs, Ipswich, MA, USA) and then sequenced on the Illumina HiSeq X-ten platform.

4.2. Genome Assembly and Assessment

Before assembly, strict quality control was performed on the raw Illumina and Nanopore sequencing data using Trimmomatic v0.39 [37] and Nanofilt v2.3.0 [38], respectively. We removed the low-quality reads (Q30 < 90%) or those that contained more than 5% unknown bases. Environmental microbial contaminants were removed by deleting sequences with hits in the GenBank Env_nt database (ftp://ftp.ncbi.nlm.nih.gov/blast/db/, accessed on 14 September 2021). GenomeScope v2.0 and Smudgeplot [39] were performed to estimate ploidy and heterozygosity using Illumina short reads.
A de novo genome assembly was carried out using the Nextdenovo v2.5.0 software with the nanopore long read length cut-off and seed length cut-off values set to 12 Kb and 20 Kb, respectively [40]. The raw assembly was polished using Nexpolish v1.4.0 [41] with all Illumina reads for three rounds. Then, the haplotigs were removed using PurgeHaplotigs v1.1.3 [42] with default parameters. We mapped the Illumina reads to the above-polished assembly using Minimap2 v2.17 [43]. We used the ALLHiC pipeline [44] to conduct chromosome anchoring based on the Hi-C sequences with default parameters (-e AAGCTT -k 30). Finally, we applied RagTag v1.1.0 [45] to correct the contig orientation and move the suspicious fragments into unanchored groups by visually exploring Hi-C heatmaps. We conducted the synteny analysis with the reference genome of M. cinxia (GCA_905220565.1) and D. plexippus (GCA_009731565.1) using MCscanX [46]. The graphical view of the consensus map and other basic genome information, including the GC content and DNA variations, was displayed using CIRCOS v0.69–9 [47]. Whole genome completeness was assessed using BUSCO v5.2.3 (lepidoptera_odb10 database), which benchmarks universal single-copy orthologs [48].

4.3. Repetitive Elements, Gene Prediction, and Gene Functional Annotation

Repetitive elements were identified using RepeatMasker v4.0.7 [49]. Then RepeatModeler v1.0.11 [50] was used to construct a de novo repetitive element library, which was then used to predict repeats with RepeatMasker v4.0.7. Protein-coding genes were predicted with the masked genome assembly using a combination of ab initio, homology-based, and transcriptome-based prediction methods. The transcriptomic data were initially used in PASA v2.5.1 [51] to search for gene models, which were then applied in Augustus v3.3.1 [52] for the ab initio prediction. For the homology-based method, we downloaded gene sets for three related species in the same family: V. tameamea (GenBank accession: GCA_002938995), Heliconius erato (GenBank accession: GCA_018249695), and D. plexippus (GenBank accession: GCA_009731565). These homologous protein sequences were concatenated and imported into GeneWise v2.2.0 [53] to search for genes. Pseudogenes were filtered based on correct translation and the presence of mature stop codons. In addition, a concatenated ab initio and homology-based gene prediction pipeline identified genes using BRAKER v2.1.5 [54]. Finally, all gene prediction results were merged using the Evidence Modeler v1.1.1 [55]. The functional annotation of the gene set was conducted by querying the protein sequences against the InterProScan v5.41–78.0 [56] and NR protein databases (blastp v2.2.26 [57], with an E-value cutoff of 1 × 10⁻⁵).

4.4. Phylogenetic Reconstruction and Gene Family Analyses

The gene families were identified using the Orthofinder v2.3.8 [58]. The protein sequences of H. assimilis, along with the other 14 species, including Aricia agestis, D. plexippus, H. erato, Leptidea sinapis, V. tameamea, M. cinxia, Maniola jurtina, V. atalanta, Pararge aegeria, Brenthis ino, Pieris rapae, Zerene cesonia, P. xuthus, and P. bianor, were used to search for orthologous gene families. All single-copy orthologous genes shared across all genomes were selected and aligned in MAFFT v7.4 [59]. We used RaxML v8.2.12 [60] with default settings to build a maximum-likelihood (ML) phylogeny with the concatenated sequences. Based on the ML tree topology, the divergence times and nucleotide substitution rates were estimated using R8S v1.81 [61]. From the website www.time-tree.org, we selected three calibration points: the divergence between B. ino and H. erato (50.7Mya [62]), Z. cesonia and P. rapae (72.0 Mya [63]), and that between P. aegeria and M. jurtina (37.0 Mya [61]). According to the divergence times and phylogenetic relationships, café v4.2.1 [64] was used to determine the expansion and constriction of orthologous gene families. We used the significant expansion (p < 0.01) gene families for the GO enrichment analysis. The enrichment of GO terms was conducted using KOBAS v3.0 [65].

4.5. Positive Selection Analysis

Positively selected genes and sites were identified using the branch-site model in PAML v4.9e [66]. We used the M1A vs. M2A and the M7 vs. M8 models to explore sites that evolved under positive selection on specific branches. We used the likelihood ratio test to calculate the statistical significance of these models. Using the Bayes Empirical Bayes estimation [67], the branch-site model was also used to detect amino acid sites that were likely to evolve fast in the appointed branch.

4.6. The Evolution of P450, OBP, OR, and GR Gene Families Analysis

We performed a manual curation for each gene of the families that we addressed in this study. We identified detoxification genes in the genomes using TBLASTN v2.2.26 [68] searches with known Bombyx mori and P. rapae as queries. To eliminate potential pseudogenes, any sequence with predicted start and stop codons was discarded if it was shorter than its hypothetical product length by 25%. We selected only complete and nearly complete (>250 codons) P450 genes, where the conservative heme-binding motif Phe-X-X-Gly-X-Arg-X-Cys-X-Gly was present. For the OR, OBP, and GR genes, we identified this class of genes in the genomes using TBLASTN v2.2.26 [68] with known receptors of H. melpomene and D. plexippus as queries, followed by iteration. Gene structures within the genomic loci with significant hits (E < 10−5) were predicted using GeneWise v2.2.0 [53] with the pseudogene masked. We carefully checked the multiple alignments and removed poorly aligned regions before the phylogeny analysis. All phylogenetic trees were constructed in MEGA7 software [69] using the neighbor-joining method with 500-fold bootstrap resampling. Tree images were saved as PNG files and edited in ITOL (https://itol.embl.de/, accessed on 20 October 2022) [70]. All branches were manually collapsed to >50% bootstrap support.

5. Conclusions

In conclusion, we assembled a high-quality chromosomal-level genome for H. assimilis. We found that the expansion of the detoxification gene family and the contraction of chemosensory-related genes may be related to its saprophagous feeding characteristics. We raised the possible genetic specificity of H. assimilis in its saprophagous feeding characteristics. The high-quality assembly genome of H. assimilis also serves as a resource for further biological studies.

Supplementary Materials

The supporting information can be downloaded at: https://www.mdpi.com/article/10.3390/ijms24032087/s1.

Author Contributions

L.Z. and X.-D.L. conceived the study and designed the experiments. T.J., H.W. and Z.D. performed the sequencing experiments. L.Z. and D.-L.G. analyzed the data. L.Z. wrote the manuscript. L.Z. and X.-D.L. contributed equally to this work and should be considered co-first authors. D.-L.G. and S.-Q.X. revised the manuscript and should consider as the co-corresponding authors. All authors have read and agreed to the published version of the manuscript.

Funding

This research was supported by the Fundamental Research Funds for the Central Universities (GK201903063, GK202105003, and TD2020041Y), and the Starting Project of High-level Talents Scientific Research in Hechi University (2021GCC016). This work was partly supported by the National Natural Science Foundation of China (no. 31872273).

Institutional Review Board Statement

Not applicable.

Informed Consent Statement

Not applicable.

Data Availability Statement

All sequence data were deposited in GenBank under BioProject accession no. PRJNA793373.

Acknowledgments

Thanks to Yu-Fei Li from Xi’an Jiaotong University for providing the ecological photos of H. assimilis and Hua-Teng Huang from the Shaanxi Normal University for insightful discussions regarding this research.

Conflicts of Interest

The authors declare no conflict of interest.

Abbreviations

OR: olfactory receptor; OBP: odorant-binding protein; GR: gustatory receptor; GO: gene ontology; CYP: cytochrome P450; Ka: non-synonymous substitution rate; Ks: synonymous substitution rate.

References

  1. Hunter, J.P. Key innovations and the ecology of macroevolution. Trends Ecol. Evol. 1998, 13, 31–36. [Google Scholar] [CrossRef]
  2. Geister, T.L.; Lorenz, M.W.; Hoffmann, K.H.; Fischer, K. Adult nutrition and butterfly fitness: Effects of diet quality on reproductive output, egg composition, and egg hatching success. Front. Zool. 2008, 5, 10. [Google Scholar] [CrossRef] [Green Version]
  3. Gutiérrez-Guerrero, Y.T.; Ibarra-Laclette, E.; Martínez Del Río, C.; Barrera-Redondo, J.; Rebollar, E.A.; Ortega, J.; León-Paniagua, L.; Urrutia, A.; Aguirre-Planter, E.; Eguiarte, L.E. Genomic consequences of dietary diversification and parallel evolution due to nectarivory in leaf-nosed bats. GigaScience 2020, 9, giaa059. [Google Scholar] [CrossRef]
  4. Lane, K.A.; Lucas, K.M.; Yack, J.E. Hearing in a diurnal, mute butterfly, Morpho peleides (Papilionoidea, Nymphalidae). J. Comp. Neurol. 2008, 508, 677–686. [Google Scholar] [CrossRef]
  5. Omura, H.; Honda, K. Feeding responses of adult butterflies, Nymphalis xanthomelas, Kaniska canace and Vanessa indica, to components in tree sap and rotting fruits: Synergistic effects of ethanol and acetic acid on sugar responsiveness. J. Insect Physiol. 2003, 49, 1031–1038. [Google Scholar] [CrossRef]
  6. Omura, H. Identification of feeding attractants in oak sap for adults of two nymphalid butterflies, Kniska canace and Vanessa indica (vol 25, pg 281, 2000). Physiol. Entomol. 2001, 26, 283. [Google Scholar]
  7. Zhou, Y.N.; Xie, S.; Chen, J.N.; Wang, Z.H.; Yang, P.; Zhou, S.C.; Pang, L.; Li, F.; Shi, M.; Huang, J.H.; et al. Expression and functional characterization of odorant-binding protein genes in the endoparasitic wasp Cotesia vestalis. Insect Sci. 2021, 28, 1354–1368. [Google Scholar] [CrossRef]
  8. Hill, J.; Hamer, K.; Tangah, J.; Dawood, M. Ecology of tropical butterflies in rainforest gaps. Oecologia 2001, 128, 294–302. [Google Scholar] [CrossRef]
  9. Omura, H.; Honda, K.; Asaoka, K.; Inoue, T.A. Tolerance to fermentation products in sugar reception: Gustatory adaptation of adult butterfly proboscis for feeding on rotting foods. J. Comp. Physiol. A Neuroethol. Sens. Neural Behav. Physiol. 2008, 194, 545–555. [Google Scholar] [CrossRef] [Green Version]
  10. Kaliszewska, Z.A.; Lohman, D.J.; Sommer, K.; Adelson, G.; Rand, D.B.; Mathew, J.; Talavera, G.; Pierce, N.E. When caterpillars attack: Biogeography and life history evolution of the Miletinae (Lepidoptera: Lycaenidae). Evol. Int. J. Org. Evol. 2015, 69, 571–588. [Google Scholar] [CrossRef]
  11. Li, Z.H.; Hua, C.; Wei-Yan, Y.U.; Song, D.J.; Chen, H.; Shan-Jin, X.U.; Tang, F. Bionomics of the butterfly, Hestina assimilis. Chin. J. Entomol. 2008, 45, 754–757. [Google Scholar]
  12. Au, T.F.; Bonebrake, T.C. Increased Suitability of Poleward Climate for a Tropical Butterfly (Euripus nyctelius) (Lepidoptera: Nymphalidae) Accompanies its Successful Range Expansion. J. Insect Sci. 2019, 19, 2. [Google Scholar] [CrossRef]
  13. Tanio, T.; Kuramoto, N. Effects of temperature on the initiation of post-diapause development in larvae of Hestina assimilis assimilis (Lepidoptera, Nymphalidae) and Hestina persimilis japonica. Lepid. Sci. 2019, 70, 59–63. [Google Scholar]
  14. Zhang, S.; Zhang, Z.; Wang, H.; Kong, X. Antennal transcriptome analysis and comparison of olfactory genes in two sympatric defoliators, Dendrolimus houi and Dendrolimus kikuchii (Lepidoptera: Lasiocampidae). Insect Biochem. Mol. Biol. 2014, 52, 69–81. [Google Scholar] [CrossRef]
  15. Konorov, E.A.; Nikitin, M.A.; Mikhailov, K.V.; Lysenkov, S.N.; Belenky, M.; Chang, P.L.; Nuzhdin, S.V.; Scobeyeva, V.A. Genomic exaptation enables Lasius niger adaptation to urban environments. BMC Evol. Biol. 2017, 17, 39. [Google Scholar] [CrossRef] [Green Version]
  16. Indra, R.; Moserova, M.; Sulc, M.; Frei, E.; Stiborova, M. Oxidation of carcinogenic benzo[a]pyrene by human and rat cytochrome P450 1A1 and its influencing by cytochrome b5-a comparative study. Neuro Endocrinol. Lett. 2013, 34 (Suppl. 2), 55–63. [Google Scholar]
  17. Wen, Z.; Baudry, J.; Berenbaum, M.R.; Schuler, M.A. Ile115Leu mutation in the SRS1 region of an insect cytochrome P450 (CYP6B1) compromises substrate turnover via changes in a predicted product release channel. Protein Eng. Des. Sel. 2005, 18, 191–199. [Google Scholar] [CrossRef]
  18. Li, X.; Baudry, J.; Berenbaum, M.R.; Schuler, M.A. Structural and functional divergence of insect CYP6B proteins: From specialist to generalist cytochrome P450. Proc. Natl. Acad. Sci. USA 2004, 101, 2939–2944. [Google Scholar] [CrossRef] [Green Version]
  19. Sun, Z.; Shi, Q.; Li, Q.; Wang, R.; Xu, C.; Wang, H.; Ran, C.; Song, Y.; Zeng, R. Identification of a cytochrome P450 CYP6AB60 gene associated with tolerance to multi-plant allelochemicals from a polyphagous caterpillar tobacco cutworm (Spodoptera litura). Pestic. Biochem. Physiol. 2019, 154, 60–66. [Google Scholar] [CrossRef]
  20. Fu, N.; Li, J.; Ren, L.; Li, X.; Wang, M.; Li, F.; Zong, S.; Luo, Y. Chromosome-level genome assembly of Monochamus saltuarius reveals its adaptation and interaction mechanism with pine wood nematode. Int. J. Biol. Macromol. 2022, 222, 325–336. [Google Scholar] [CrossRef]
  21. Feyereisen, R. Evolution of insect P450. Biochem. Soc. Trans. 2006, 34, 1252–1255. [Google Scholar] [CrossRef] [PubMed] [Green Version]
  22. Li, S.; Zhu, S.; Jia, Q.; Yuan, D.; Ren, C.; Li, K.; Liu, S.; Cui, Y.; Zhao, H.; Cao, Y.; et al. The genomic and functional landscapes of developmental plasticity in the American cockroach. Nat. Commun. 2018, 9, 1008. [Google Scholar] [CrossRef] [PubMed] [Green Version]
  23. Wyatt, T.D. Proteins and peptides as pheromone signals and chemical signatures. Anim. Behav. 2014, 97, 273–280. [Google Scholar] [CrossRef]
  24. Himmel, N.J.; Benton, R. Sweet sensors support stressed cell survival. PLoS Biol. 2022, 20, e3001705. [Google Scholar] [CrossRef]
  25. Herness, M.S.; Gilbertson, T.A. Cellular mechanisms of taste transduction. Annu. Rev. Physiol. 1999, 61, 873–900. [Google Scholar] [CrossRef] [PubMed]
  26. Gu, L.; Reilly, P.F.; Lewis, J.J.; Reed, R.D.; Andolfatto, P.; Walters, J.R. Dichotomy of Dosage Compensation along the Neo Z Chromosome of the Monarch Butterfly. Curr. Biol. CB 2019, 29, 4071–4077.e4073. [Google Scholar] [CrossRef] [Green Version]
  27. Mongue, A.J.; Nguyen, P.; Voleníková, A.; Walters, J.R. Neo-sex Chromosomes in the Monarch Butterfly, Danaus plexippus. G3 Genes|Genomes|Genetics 2017, 7, 3281–3294. [Google Scholar] [CrossRef] [Green Version]
  28. Liu, S.; Zhang, Y.X.; Wang, W.L.; Cao, Y.; Li, S.; Zhang, B.X.; Li, S.G. Identification of putative cytochrome P450 monooxygenase genes from the small white butterfly, Pieris rapae (Lepidoptera: Pieridae), and their response to insecticides. Arch. Insect Biochem. Physiol. 2018, 98, e21455. [Google Scholar] [CrossRef]
  29. Zhao, P.; Xue, H.; Zhu, X.; Wang, L.; Zhang, K.; Li, D.; Ji, J.; Niu, L.; Gao, X.; Luo, J.; et al. Silencing of cytochrome P450 gene CYP321A1 effects tannin detoxification and metabolism in Spodoptera litura. Int. J. Biol. Macromol. 2022, 194, 895–902. [Google Scholar] [CrossRef]
  30. Feyereisen, R. Origin and evolution of the CYP4G subfamily in insects, cytochrome P450 enzymes involved in cuticular hydrocarbon synthesis. Mol. Phylogenetics Evol. 2020, 143, 106695. [Google Scholar] [CrossRef]
  31. Niimura, Y.; Matsui, A.; Touhara, K. Acceleration of Olfactory Receptor Gene Loss in Primate Evolution: Possible Link to Anatomical Change in Sensory Systems and Dietary Transition. Mol. Biol. Evol. 2018, 35, 1437–1450. [Google Scholar] [CrossRef] [PubMed] [Green Version]
  32. Hu, J.; Wang, X.Y.; Tan, L.S.; Lu, W.; Zheng, X.L. Identification of Chemosensory Genes, Including Candidate Pheromone Receptors, in Phauda flammans (Walker) (Lepidoptera: Phaudidae) Through Transcriptomic Analyses. Front. Physiol. 2022, 13, 907694. [Google Scholar] [CrossRef] [PubMed]
  33. Thom, C.; Guerenstein, P.G.; Mechaber, W.L.; Hildebrand, J.G. Floral CO2 reveals flower profitability to moths. J. Chem. Ecol. 2004, 30, 1285–1288. [Google Scholar] [CrossRef] [PubMed]
  34. Xu, W.; Papanicolaou, A.; Zhang, H.J.; Anderson, A. Expansion of a bitter taste receptor family in a polyphagous insect herbivore. Sci. Rep. 2016, 6, 23666. [Google Scholar] [CrossRef]
  35. De Coster, W.; De Rijk, P.; De Roeck, A.; De Pooter, T.; D’Hert, S.; Strazisar, M.; Sleegers, K.; Van Broeckhoven, C. Structural variants identified by Oxford Nanopore PromethION sequencing of the human genome. Genome Res. 2019, 29, 1178–1187. [Google Scholar] [CrossRef] [Green Version]
  36. Zhuang, W.; Chen, H.; Yang, M.; Wang, J.; Pandey, M.K.; Zhang, C.; Chang, W.C.; Zhang, L.; Zhang, X.; Tang, R.; et al. The genome of cultivated peanut provides insight into legume karyotypes, polyploid evolution and crop domestication. Nat. Genet. 2019, 51, 865–876. [Google Scholar] [CrossRef] [Green Version]
  37. Bolger, A.M.; Lohse, M.; Usadel, B. Trimmomatic: A flexible trimmer for Illumina sequence data. Bioinformatics 2014, 30, 2114–2120. [Google Scholar] [CrossRef] [Green Version]
  38. De Coster, W.; D’Hert, S.; Schultz, D.T.; Cruts, M.; Van Broeckhoven, C. NanoPack: Visualizing and processing long-read sequencing data. Bioinformatics 2018, 34, 2666–2669. [Google Scholar] [CrossRef] [Green Version]
  39. Ranallo-Benavidez, T.R.; Jaron, K.S.; Schatz, M.C. GenomeScope 2.0 and Smudgeplot for reference-free profiling of polyploid genomes. Nat. Commun. 2020, 11, 1432. [Google Scholar] [CrossRef] [Green Version]
  40. Guiglielmoni, N.; Houtain, A.; Derzelle, A.; Van Doninck, K.; Flot, J.F. Overcoming uncollapsed haplotypes in long-read assemblies of non-model organisms. BMC Bioinform. 2021, 22, 303. [Google Scholar] [CrossRef]
  41. Hu, J.; Fan, J.; Sun, Z.; Liu, S. NextPolish: A fast and efficient genome polishing tool for long-read assembly. Bioinformatics 2020, 36, 2253–2255. [Google Scholar] [CrossRef] [PubMed]
  42. Roach, M.J.; Schmidt, S.A.; Borneman, A.R. Purge Haplotigs: Allelic contig reassignment for third-gen diploid genome assemblies. BMC Bioinform. 2018, 19, 460. [Google Scholar] [CrossRef] [PubMed]
  43. Li, H. Minimap2: Pairwise alignment for nucleotide sequences. Bioinformatics 2018, 34, 3094–3100. [Google Scholar] [CrossRef] [Green Version]
  44. Zhang, X.; Zhang, S.; Zhao, Q.; Ming, R.; Tang, H. Assembly of allele-aware, chromosomal-scale autopolyploid genomes based on Hi-C data. Nat. Plants 2019, 5, 833–845. [Google Scholar] [CrossRef] [PubMed]
  45. Alonge, M.; Soyk, S.; Ramakrishnan, S.; Wang, X.; Goodwin, S.; Sedlazeck, F.J.; Lippman, Z.B.; Schatz, M.C. RaGOO: Fast and accurate reference-guided scaffolding of draft genomes. Genome Biol. 2019, 20, 224. [Google Scholar] [CrossRef] [Green Version]
  46. Wang, Y.; Tang, H.; Debarry, J.D.; Tan, X.; Li, J.; Wang, X.; Lee, T.H.; Jin, H.; Marler, B.; Guo, H.; et al. MCScanX: A toolkit for detection and evolutionary analysis of gene synteny and collinearity. Nucleic Acids Res. 2012, 40, e49. [Google Scholar] [CrossRef] [PubMed] [Green Version]
  47. Krzywinski, M.; Schein, J.; Birol, I.; Connors, J.; Gascoyne, R.; Horsman, D.; Jones, S.J.; Marra, M.A. Circos: An information aesthetic for comparative genomics. Genome Res. 2009, 19, 1639–1645. [Google Scholar] [CrossRef] [Green Version]
  48. Waterhouse, R.M.; Seppey, M.; Simão, F.A.; Zdobnov, E.M. Using BUSCO to Assess Insect Genomic Resources. Methods Mol. Biol. 2019, 1858, 59–74. [Google Scholar] [CrossRef] [Green Version]
  49. Tarailo-Graovac, M.; Chen, N. Using RepeatMasker to identify repetitive elements in genomic sequences. Curr. Protoc. Bioinform. 2009, 25, 4.10.1–4.10.14. [Google Scholar] [CrossRef]
  50. Flynn, J.M.; Hubley, R.; Goubert, C.; Rosen, J.; Clark, A.G.; Feschotte, C.; Smit, A.F. RepeatModeler2 for automated genomic discovery of transposable element families. Proc. Natl. Acad. Sci. USA 2020, 117, 9451–9457. [Google Scholar] [CrossRef]
  51. Haas, B.J.; Delcher, A.L.; Mount, S.M.; Wortman, J.R.; Smith, R.K., Jr.; Hannick, L.I.; Maiti, R.; Ronning, C.M.; Rusch, D.B.; Town, C.D.; et al. Improving the Arabidopsis genome annotation using maximal transcript alignment assemblies. Nucleic Acids Res. 2003, 31, 5654–5666. [Google Scholar] [CrossRef] [PubMed] [Green Version]
  52. Stanke, M.; Keller, O.; Gunduz, I.; Hayes, A.; Waack, S.; Morgenstern, B. AUGUSTUS: Ab initio prediction of alternative transcripts. Nucleic Acids Res. 2006, 34, W435–W439. [Google Scholar] [CrossRef] [PubMed] [Green Version]
  53. Trapnell, C.; Roberts, A.; Goff, L.; Pertea, G.; Kim, D.; Kelley, D.R.; Pimentel, H.; Salzberg, S.L.; Rinn, J.L.; Pachter, L. Differential gene and transcript expression analysis of RNA-seq experiments with TopHat and Cufflinks. Nat. Protoc. 2012, 7, 562–578. [Google Scholar] [CrossRef] [PubMed] [Green Version]
  54. Hoff, K.J.; Lomsadze, A.; Borodovsky, M.; Stanke, M. Whole-Genome Annotation with BRAKER. Methods Mol. Biol. 2019, 1962, 65–95. [Google Scholar] [CrossRef] [PubMed]
  55. Haas, B.J.; Salzberg, S.L.; Zhu, W.; Pertea, M.; Allen, J.E.; Orvis, J.; White, O.; Buell, C.R.; Wortman, J.R. Automated eukaryotic gene structure annotation using EVidenceModeler and the Program to Assemble Spliced Alignments. Genome Biol. 2008, 9, R7. [Google Scholar] [CrossRef] [Green Version]
  56. Mulder, N.; Apweiler, R. InterPro and InterProScan: Tools for protein sequence classification and comparison. Methods Mol. Biol. (Clifton N.J.) 2007, 396, 59–70. [Google Scholar] [CrossRef]
  57. Mount, D.W. Using the Basic Local Alignment Search Tool (BLAST). CSH Protoc. 2007, 2007, pdb.top17. [Google Scholar] [CrossRef]
  58. Emms, D.M.; Kelly, S. OrthoFinder: Phylogenetic orthology inference for comparative genomics. Genome Biol. 2019, 20, 238. [Google Scholar] [CrossRef] [Green Version]
  59. Katoh, K.; Standley, D.M. MAFFT multiple sequence alignment software version 7: Improvements in performance and usability. Mol. Biol. Evol. 2013, 30, 772–780. [Google Scholar] [CrossRef] [Green Version]
  60. Stamatakis, A. RAxML version 8: A tool for phylogenetic analysis and post-analysis of large phylogenies. Bioinformatics 2014, 30, 1312–1313. [Google Scholar] [CrossRef] [Green Version]
  61. Sanderson, M.J. r8s: Inferring absolute rates of molecular evolution and divergence times in the absence of a molecular clock. Bioinformatics 2003, 19, 301–302. [Google Scholar] [CrossRef] [PubMed] [Green Version]
  62. Chazot, N.; Wahlberg, N.; Freitas, A.V.L.; Mitter, C.; Labandeira, C.; Sohn, J.C.; Sahoo, R.K.; Seraphim, N.; de Jong, R.; Heikkilä, M. Priors and Posteriors in Bayesian Timing of Divergence Analyses: The Age of Butterflies Revisited. Syst. Biol. 2019, 68, 797–813. [Google Scholar] [CrossRef] [PubMed] [Green Version]
  63. Kawahara, A.Y.; Plotkin, D.; Espeland, M.; Meusemann, K.; Toussaint, E.F.A.; Donath, A.; Gimnich, F.; Frandsen, P.B.; Zwick, A.; Dos Reis, M.; et al. Phylogenomics reveals the evolutionary timing and pattern of butterflies and moths. Proc. Natl. Acad. Sci. USA 2019, 116, 22657–22663. [Google Scholar] [CrossRef] [PubMed] [Green Version]
  64. De Bie, T.; Cristianini, N.; Demuth, J.P.; Hahn, M.W. CAFE: A computational tool for the study of gene family evolution. Bioinformatics 2006, 22, 1269–1271. [Google Scholar] [CrossRef]
  65. Bu, D.; Luo, H.; Huo, P.; Wang, Z.; Zhang, S.; He, Z.; Wu, Y.; Zhao, L.; Liu, J.; Guo, J.; et al. KOBAS-i: Intelligent prioritization and exploratory visualization of biological functions for gene enrichment analysis. Nucleic Acids Res. 2021, 49, W317–W325. [Google Scholar] [CrossRef] [PubMed]
  66. Yang, Z. PAML: A program package for phylogenetic analysis by maximum likelihood. Comput. Appl. Biosci. CABIOS 1997, 13, 555–556. [Google Scholar] [CrossRef]
  67. Cui, Y.; Ren, Y.D.; Lyu, M.; Zheng, S.C.; Feng, Q.L.; Xiang, H. Genomic divergences between the two polyphagous Spodoptera relatives provide cues for successful invasion of the fall armyworm. Insect Sci. 2020, 27, 1257–1265. [Google Scholar] [CrossRef]
  68. Altschul, S.F.; Madden, T.L.; Schäffer, A.A.; Zhang, J.; Zhang, Z.; Miller, W.; Lipman, D.J. Gapped BLAST and PSI-BLAST: A new generation of protein database search programs. Nucleic Acids Res. 1997, 25, 3389–3402. [Google Scholar] [CrossRef] [Green Version]
  69. Kumar, S.; Stecher, G.; Tamura, K. MEGA7: Molecular Evolutionary Genetics Analysis Version 7.0 for Bigger Datasets. Mol. Biol. Evol. 2016, 33, 1870–1874. [Google Scholar] [CrossRef] [Green Version]
  70. Letunic, I.; Bork, P. Interactive Tree Of Life (iTOL) v4: Recent updates and new developments. Nucleic Acids Res. 2019, 47, W256–W259. [Google Scholar] [CrossRef]
Figure 1. Synteny alignment of the genome of H. assimilis (male), M. cinxia (male), and D. plexippus (male). The tagged HA01 to HA30 refer to the chromosomes of the sequenced H. assimilis, the green columns refer to the chromosomes of M. cinxia, and the blue columns refer to the chromosomes of D. plexippus. HA represents the H. assimilis chromosome; MC represents the M. cinxia chromosome; DP represents the D. plexippus chromosome. The HA01 is syntenic to the MCZ chromosome and autosomes MC26 of M. cinxia and the DPZ chromosome and autosomes DP30 of D. plexippus. The densities of GC contents (34% to 36%) and DNA variations (0% to 0.3%) in H. assimilis are shown in the outer rims in order.
Ijms 24 02087 g001
Figure 2. Phylogenetic and gene family analysis of H. assimilis. (A) Time-calibrated phylogeny of the fifteen butterfly species based on single-copy orthologous genes. Numbers on the bar charts indicate the numbers of gene families that experienced expansion (red) or contraction (blue); the number beside each node denotes the estimated divergence time (millions of years ago). Numbers in parentheses are SH-aLRT support (%)/ultrafast bootstrap support (%). The red star represents the common nodes of the cluster leading to four saprophagous species (V. tameamea, V. atalanta, M. cinxia, and H. assimilis). (B) GO and KEGG enrichment analysis of expanded gene families was visualized as a scatter plot. The vertical axis represents the path name, and the horizontal axis represents the gene ratio. The bubble size indicates the gene number, and the color corresponds to different q-value ranges.
Ijms 24 02087 g002aIjms 24 02087 g002b
Figure 3. Chromosomal location and phylogenetic relationship of the detoxification and chemoreception gene families in H. assimilis. (A) Chromosome distribution of cytochromes P450 (CYP, blue), olfactory receptor (OR, red), odorant binding protein (OBP, green), and gustatory receptor (GR, yellow) genes. Chr2–27 represent chromosome numbers 02–27. (B) CYP, OR, OBP, and GR gene families in the genomes of H. assimilis (red), M. cinxia, V. tameamea, V. atalanta, and D. plexippus. (C) Non-synonymous substitution (996) in the CDS region of GR was significantly subject to positive selection.
Ijms 24 02087 g003aIjms 24 02087 g003bIjms 24 02087 g003c
Table 1. Comparison of detoxification and chemosensory gene families between the saprophagous butterfly H. assimilis, M. cinxia, V. tameamea, and V. atalanta, and the nectarivorous D. plexippus.
FamilyClanH. assimilisM. cinxiaV. tameameaV. atalantaD. plexippus
P450Clan 32336283033
Clan 43923203223
Clan 21198713
Mitochondrial7101118 9
OR 3343435257
OBP 2025252932
GR 6177729
Note: P450: cytochrome P450; OR: odorant receptor; OBP: odorant binding protein; GR: gustatory receptor.
Disclaimer/Publisher’s Note: The statements, opinions and data contained in all publications are solely those of the individual author(s) and contributor(s) and not of MDPI and/or the editor(s). MDPI and/or the editor(s) disclaim responsibility for any injury to people or property resulting from any ideas, methods, instructions or products referred to in the content.

