Article

Genome-Wide Identification and Expression Analysis of the SWEET Gene Family in Capsicum annuum L.

1
Institute of Cash Crops, Hubei Academy of Agricultural Sciences, Wuhan 430064, China
2
Engineering Research Center of Ecology and Agricultural Use of Wetland, Ministry of Education, Yangtze University, Jingzhou 434025, China
*
Author to whom correspondence should be addressed.
Int. J. Mol. Sci. 2023, 24(24), 17408; https://doi.org/10.3390/ijms242417408
Submission received: 29 October 2023 / Revised: 4 December 2023 / Accepted: 5 December 2023 / Published: 12 December 2023
(This article belongs to the Special Issue Vegetable Genetics and Genomics 2.0)

Abstract

:
Sugars will eventually be exported transporters (SWEETs) are a novel class of sugar transport proteins that play a crucial role in plant growth, development, and response to stress. However, there is a lack of systematic research on SWEETs in Capsicum annuum L. In this study, 33 CaSWEET genes were identified through bioinformatics analysis. The Ka/Ks analysis indicated that SWEET genes are highly conserved not only among peppers but also among Solanaceae species and have experienced strong purifying selection during evolution. The Cis-elements analysis showed that the light-responsive element, abscisic-acid-responsive element, jasmonic-acid-responsive element, and anaerobic-induction-responsive element are widely distributed in the promoter regions of CaSWEETs. The expression pattern analysis revealed that CaSWEETs exhibit tissue specificity and are widely involved in pepper growth, development, and stress responses. The post-transcription regulation analysis revealed that 20 pepper miRNAs target and regulate 16 CaSWEETs through cleavage and translation inhibition mechanisms. The pathogen inoculation assay showed that CaSWEET16 and CaSWEET22 function as susceptibility genes, as the overexpression of these genes promotes the colonization of pathogens, whereas CaSWEET31 functions as a resistance gene. In conclusion, through systematic identification and characteristic analysis, a comprehensive understanding of CaSWEET was obtained, which lays the foundation for further studies on the biological functions of SWEET genes.

1. Introduction

Pepper (Capsicum annuum L.), belonging to Solanaceae, is an important vegetable crop in China [1]. In 2016, the planting area and total yield of Chinese peppers accounted for 21.39% and 46.24% of global production, respectively [2]. However, peppers are susceptible to biotic and abiotic stressors during cultivation and storage, such as exposure to salt, drought, bacteria, fungi, viruses, and so on, leading to a decrease in pepper yield and quality [3]. Therefore, exploring the resistance genes at the gene level holds significant importance for germplasm utilization and improving the variety of pepper crops [4].
The sugars will eventually be exported transporter (SWEET) gene family is a glycoprotein gene family that is widely distributed across various plants (Arabidopsis, bamboo, and maize) and animals (nematodes, mice, and humans) [5]. SWEET proteins are low-affinity glucose transporters that operate independently of environmental pH values [6]. In plants, all SWEET proteins contain the conserved MtN3/saliva domain (PF03083), with the N-terminus and C-terminus located on the outer and inner sides of the cell cytoplasm, and generally contain seven ɑ-helical transmembranes (TMs). The fourth TM has low conservation and mainly plays a linking role. The protein is divided into two MtN3/saliva domains each containing three TMs, forming a structure of 3-1-3 [7]. The three TMs forming the MtN3/saliva domains are arranged in the form of TM1-TM3-TM2, forming triple helix bundles (THBs) [8,9].
Previous research has demonstrated that SWEET proteins, as sugar efflux transporters, participate in plant growth, development, and various physiological responses [10]. For example, AtSWEET11/12 proteins can transport sucrose from mesophyll cells to the apoplast, and the atsweet11/12 double mutant exhibits slow growth, decreased sucrose content in roots, and increased starch content in leaves [11]. The OsSWEET11 protein is involved in rice pollen development. Silencing the OsSWEET11 gene results in smaller anthers, pollen sterility, and reduced pollen viability in the silenced plants [12].
In addition, SWEETs play an important role in responding to biotic/abiotic stress and host–pathogen interactions [13]. For instance, in Arabidopsis thaliana (L.) Heynh, the overexpression of AtSWEET16 enhances plant resistance to low temperatures [14]. In Citrullus lanatus L., the expression of ClaSWEETs is induced by drought, low temperature, and salt stress [15]. In Oryza sativa L., OsSWEET11/Os8N3/xa13 was the first SWEET family gene found to play a role in host–bacterial interaction [16], and OsSWEET11 gene-silenced rice plants exhibited resistance to Xanthomonas oryzae (Uyeda et Ishiyama) Dowson (Xoo) [12]. In Triticum aestivum L., Puccinia graminis f.sp. tritici, Pgt induced the expression of five TaSWEETs, including TaSWEET2b/5a/14a/14g/14i [17]. In Maninot esculenta Crantz, after Xanthomonas axonopodis pv.manihotis infection, TAL20Xam668 specifically induced the expression of MeSWEET10a to promote pathogen virulence [18]. In recent years, with the rapid development of bioinformatics, members of the SWEET gene family have been identified in various species. For instance, 29 SlSWEETs have been identified in tomato [7], 59 TaSWEETs in wheat [17], 17 CsSWEETs in cucumber [19], and 55 GhSWEETs in upland cotton [20].
In this study, we systematically identified 33 CaSWEET family members using bioinformatics methods. Subsequently, systematic analyses were conducted, with a focus on exploring their evolutionary relationships, physicochemical properties, and gene structures. These results provide a theoretical basis for the further study of SWEET gene functions in pepper and for preparing gene resources for resistance breeding.

2. Results

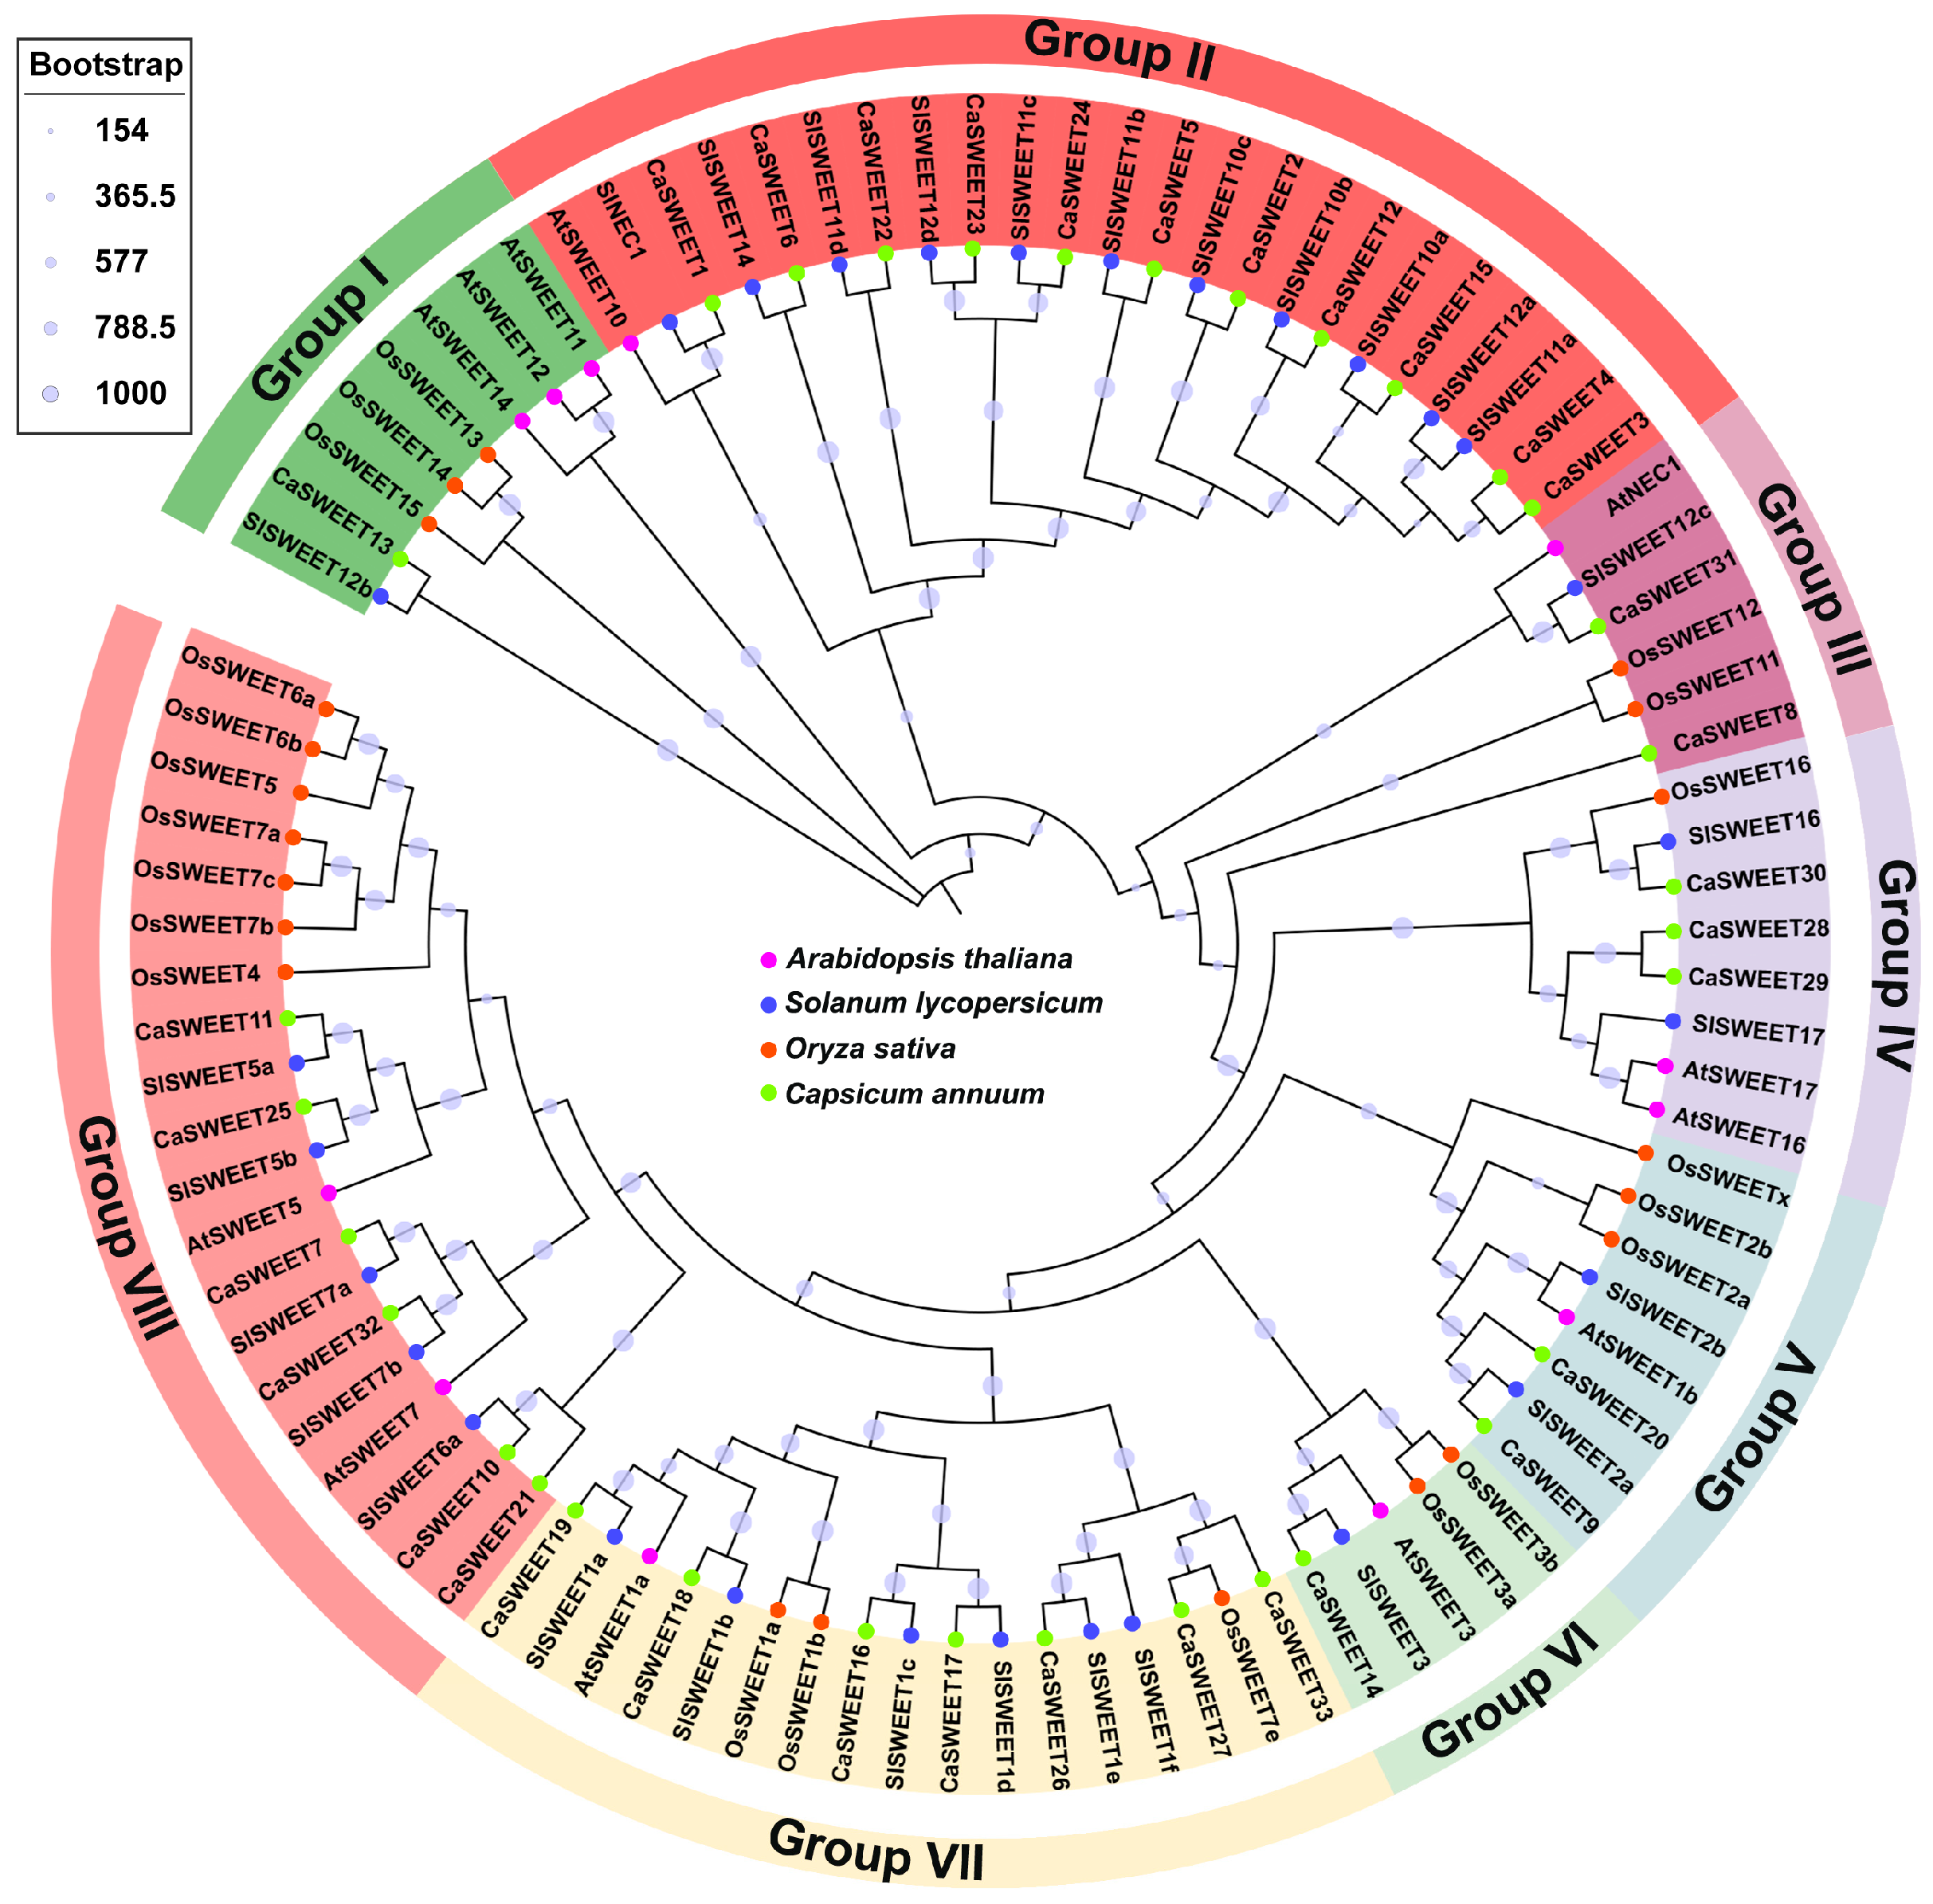
2.1. Identification and Phylogenetic Analysis of CaSWEETs

In order to identify SWEET family members within the pepper reference genome (Zunla-1_genes_sequence_v2.0), the SWEET (PF03083) seed sequence was used as a reference sequence by local BLASTp. The Pfam website was used to further verify whether the candidate sequence contained the SWEET domain. Finally, a total of 33 CaSWEET family members were identified in the pepper. As shown in Figure 1, the evolutionary relationships displayed in the phylogenetic tree resulted in the naming of these members as CaSWEET1 through to CaSWEET33, which were divided into eight subgroups (Group I–VIII). Among these, CaSWEETs and SlSWEETs exhibited the closest evolutionary relationship and were located on the same branch.

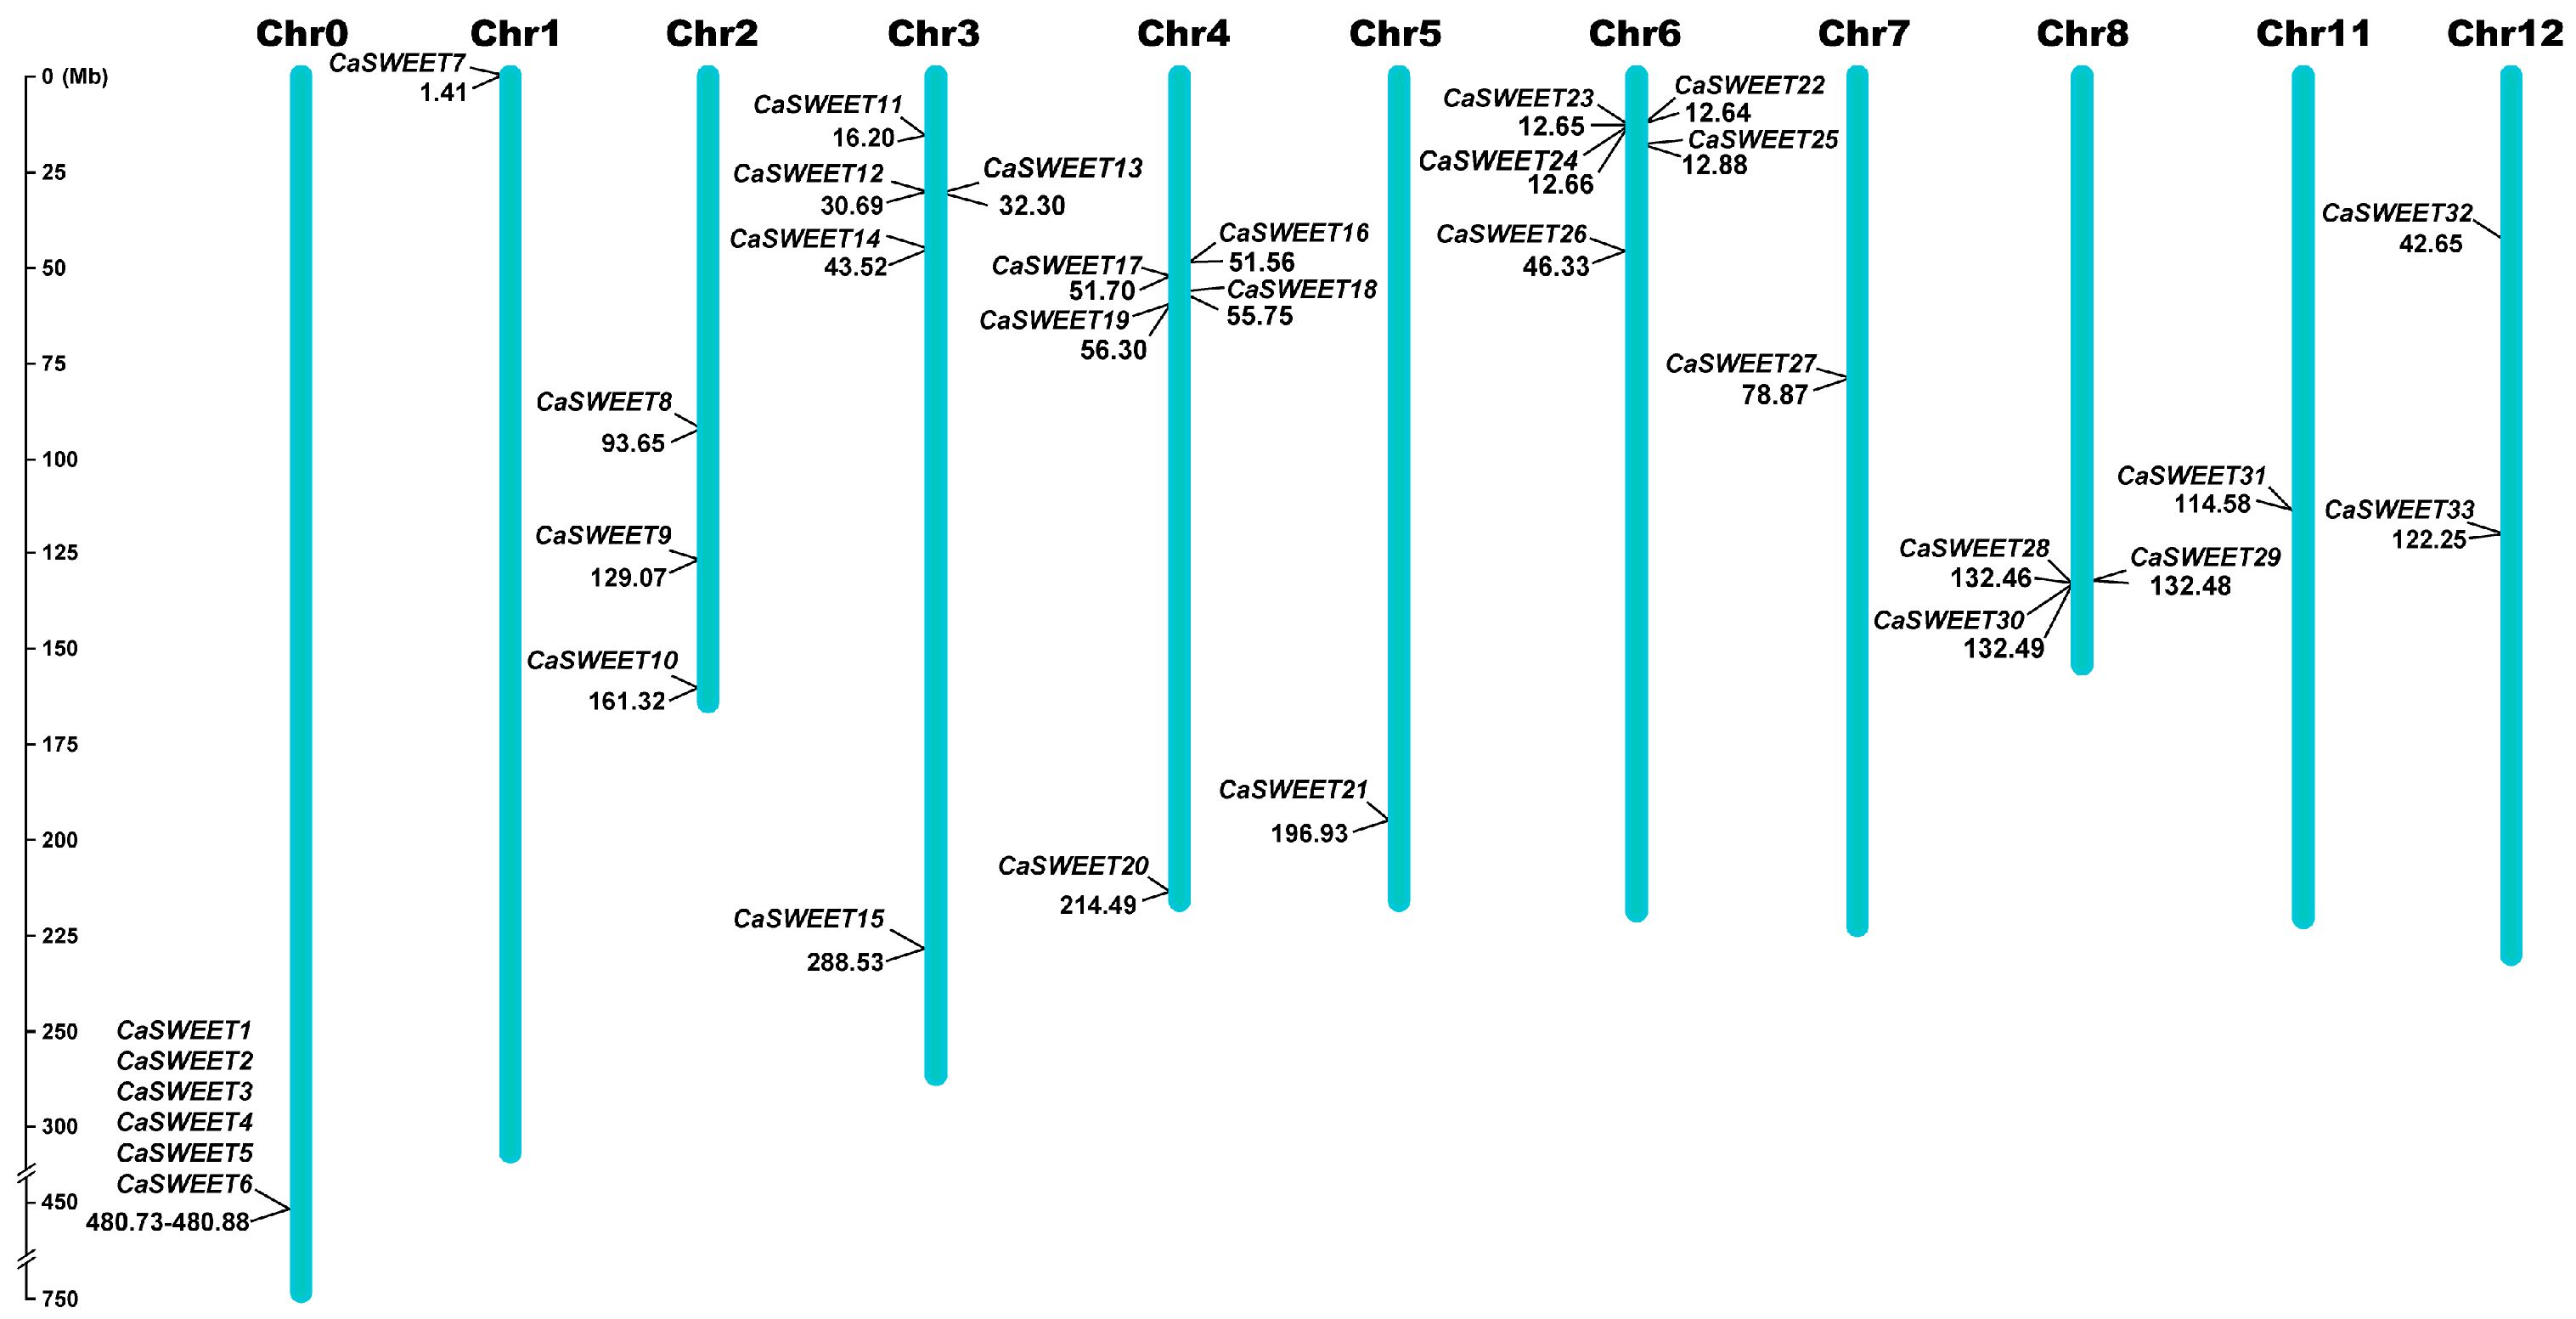
2.2. CaSWEETs Chromosomal Distribution

According to the gene structure annotation information of CaSWEETs, a chromosome distribution map was generated using Mapinspect. As shown in Figure 2, the 27 CaSWEETs are unevenly distributed on 12 chromosomes, with no CaSWEET identified on chromosomes 9 and 10. Due to the incomplete nature of the pepper genome data, the localization information for CaSWEET1-6 remains unclear. In this study, these unlocalized genes are temporarily represented as Chr0.

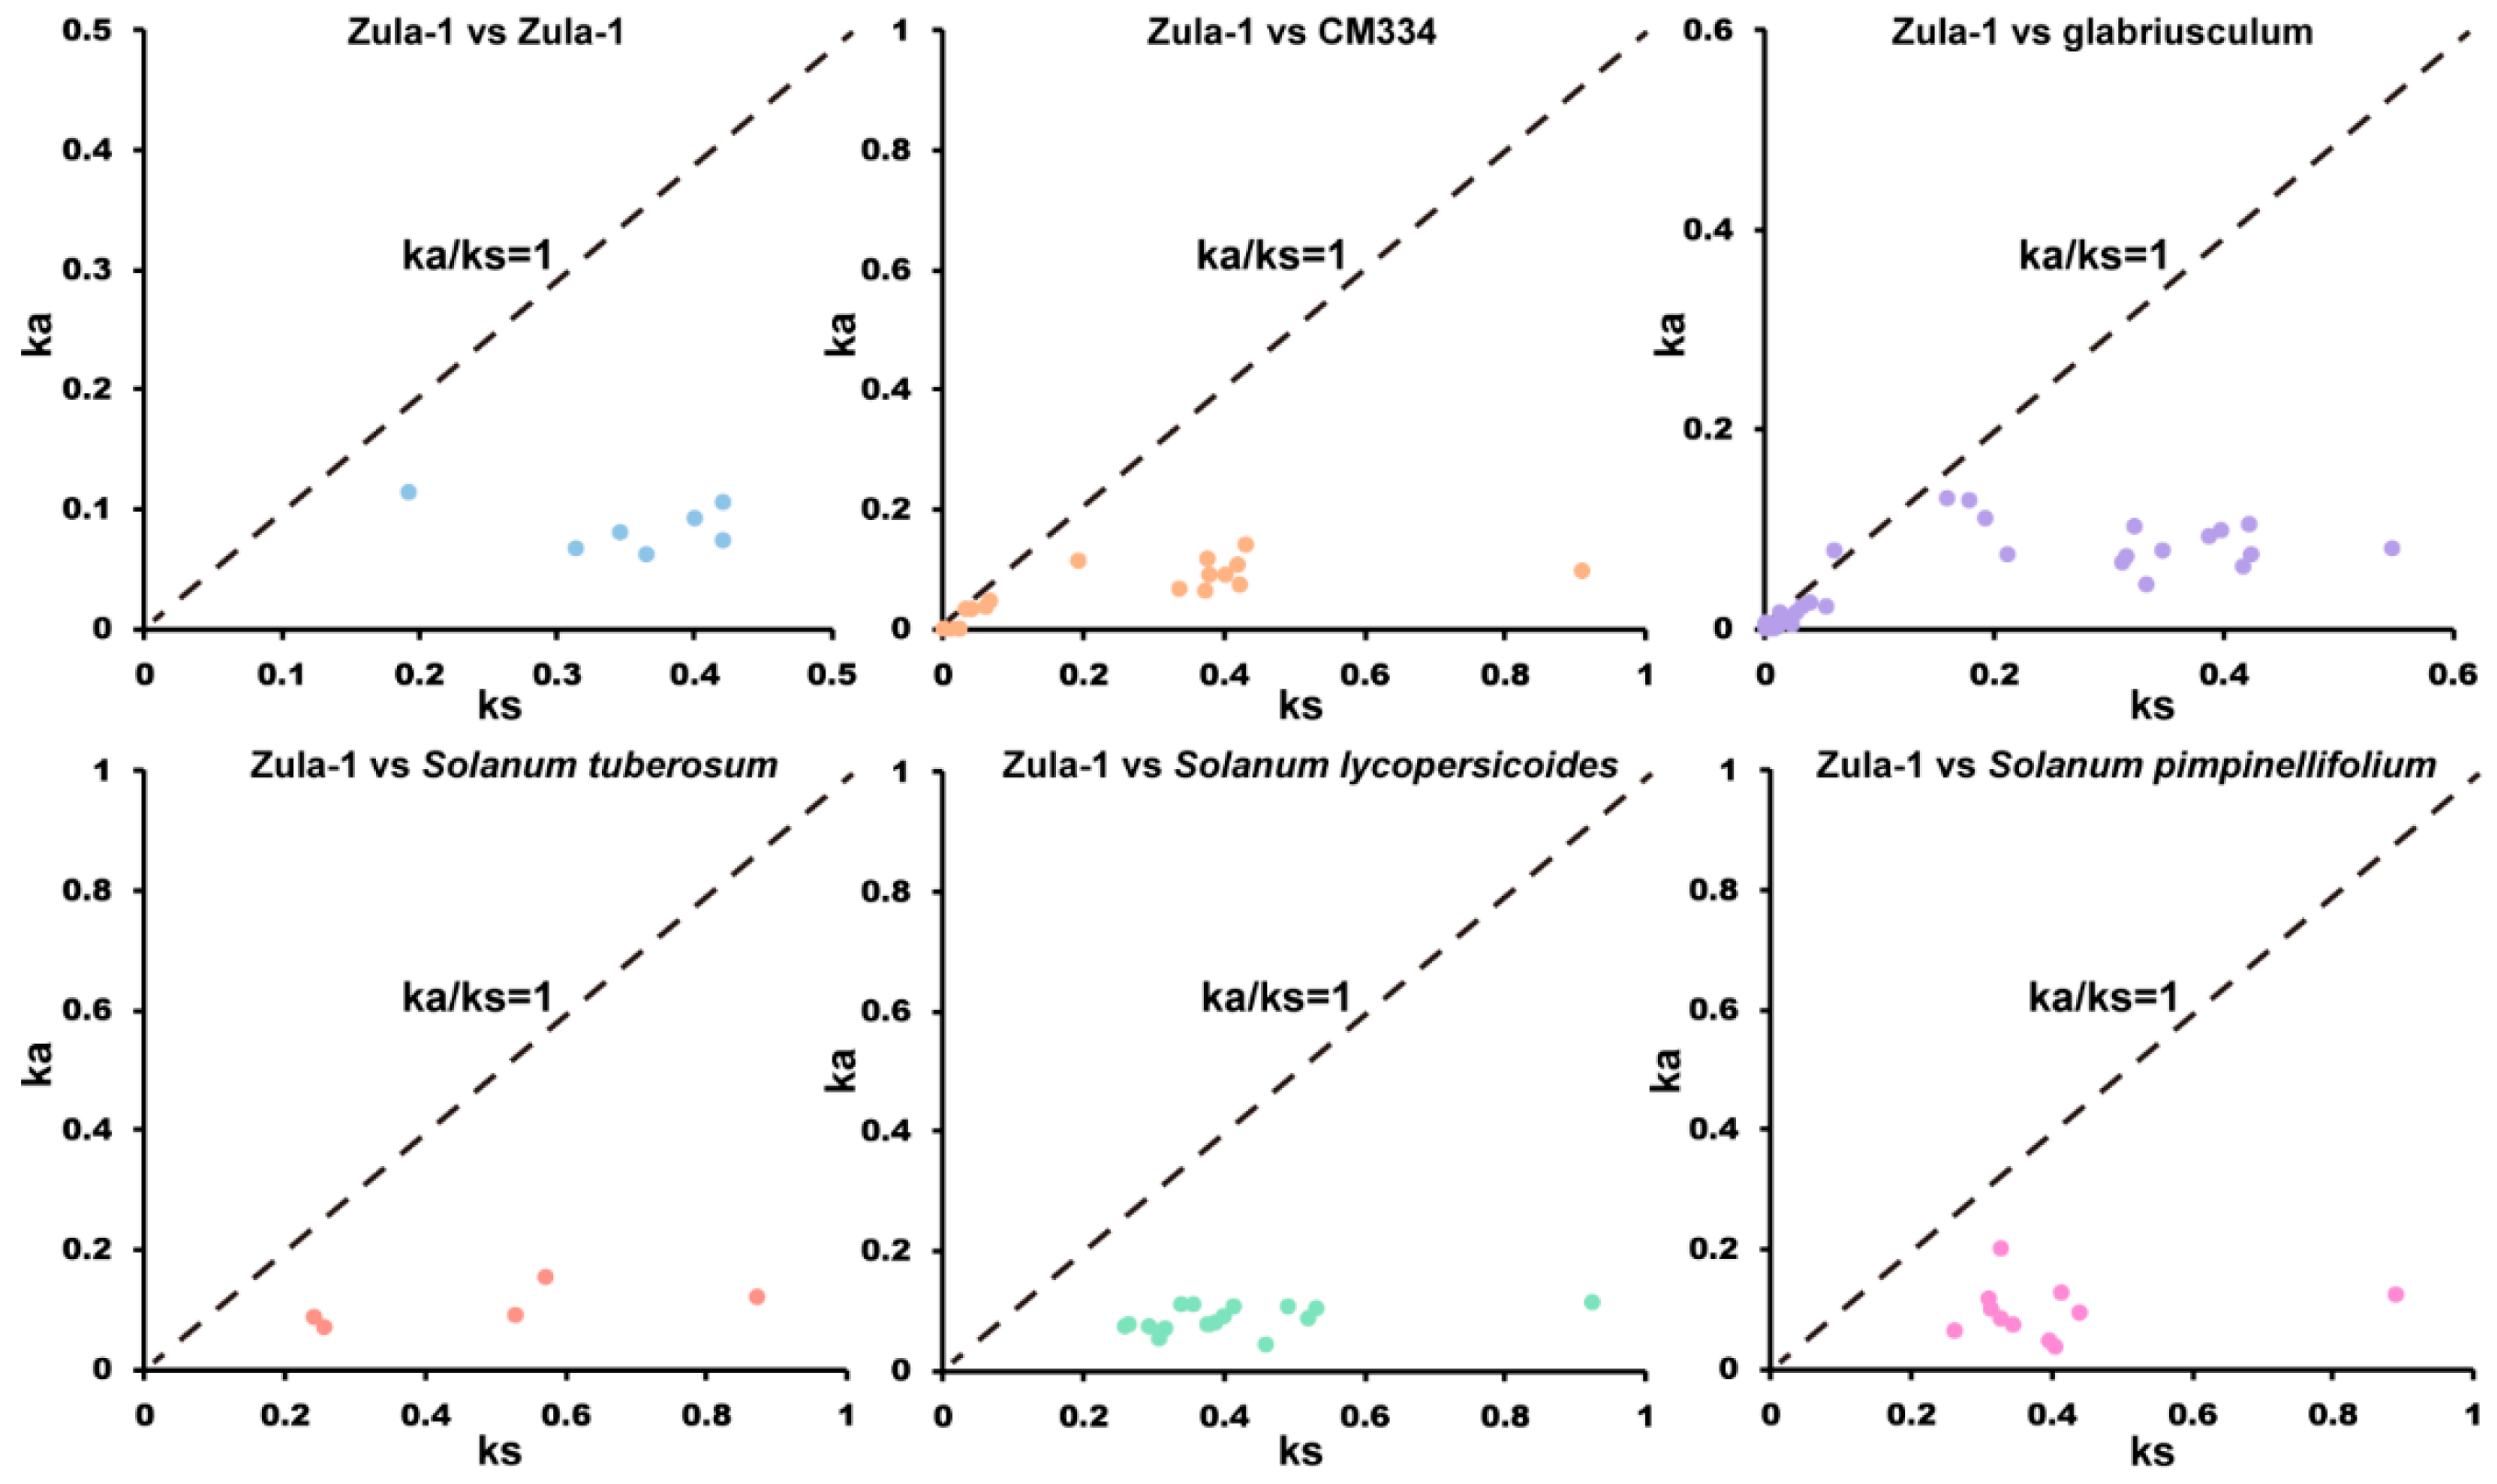
2.3. SWEET Family Members Exhibit Evolutionary Conservation

In order to further reveal the evolutionary relationships of homology SWEET genes between C. annuum and other Solanaceae species, 7, 30, 42, 5, 12, and 11 homologous SWEET genes were identified from the reference genomes of C. annuum Zunla-1, C. annuum cv.CM334, C. annuum glabriusculum, Solanum tuberosum L., Solanum lycopersicum var. cerasiforme, and Solanum pimpinellifolium (Jusl) Mill, respectively. Among the 108 homologous gene pairs, the (non-synonymous replacement rate/synonymous replacement rate) Ka/Ks ratios for 107 pairs were <1, with an average of 0.26. This indicates a strong purifying selection pressure on the SWEET genes within chili peppers and among Solanaceae species (Figure 3).

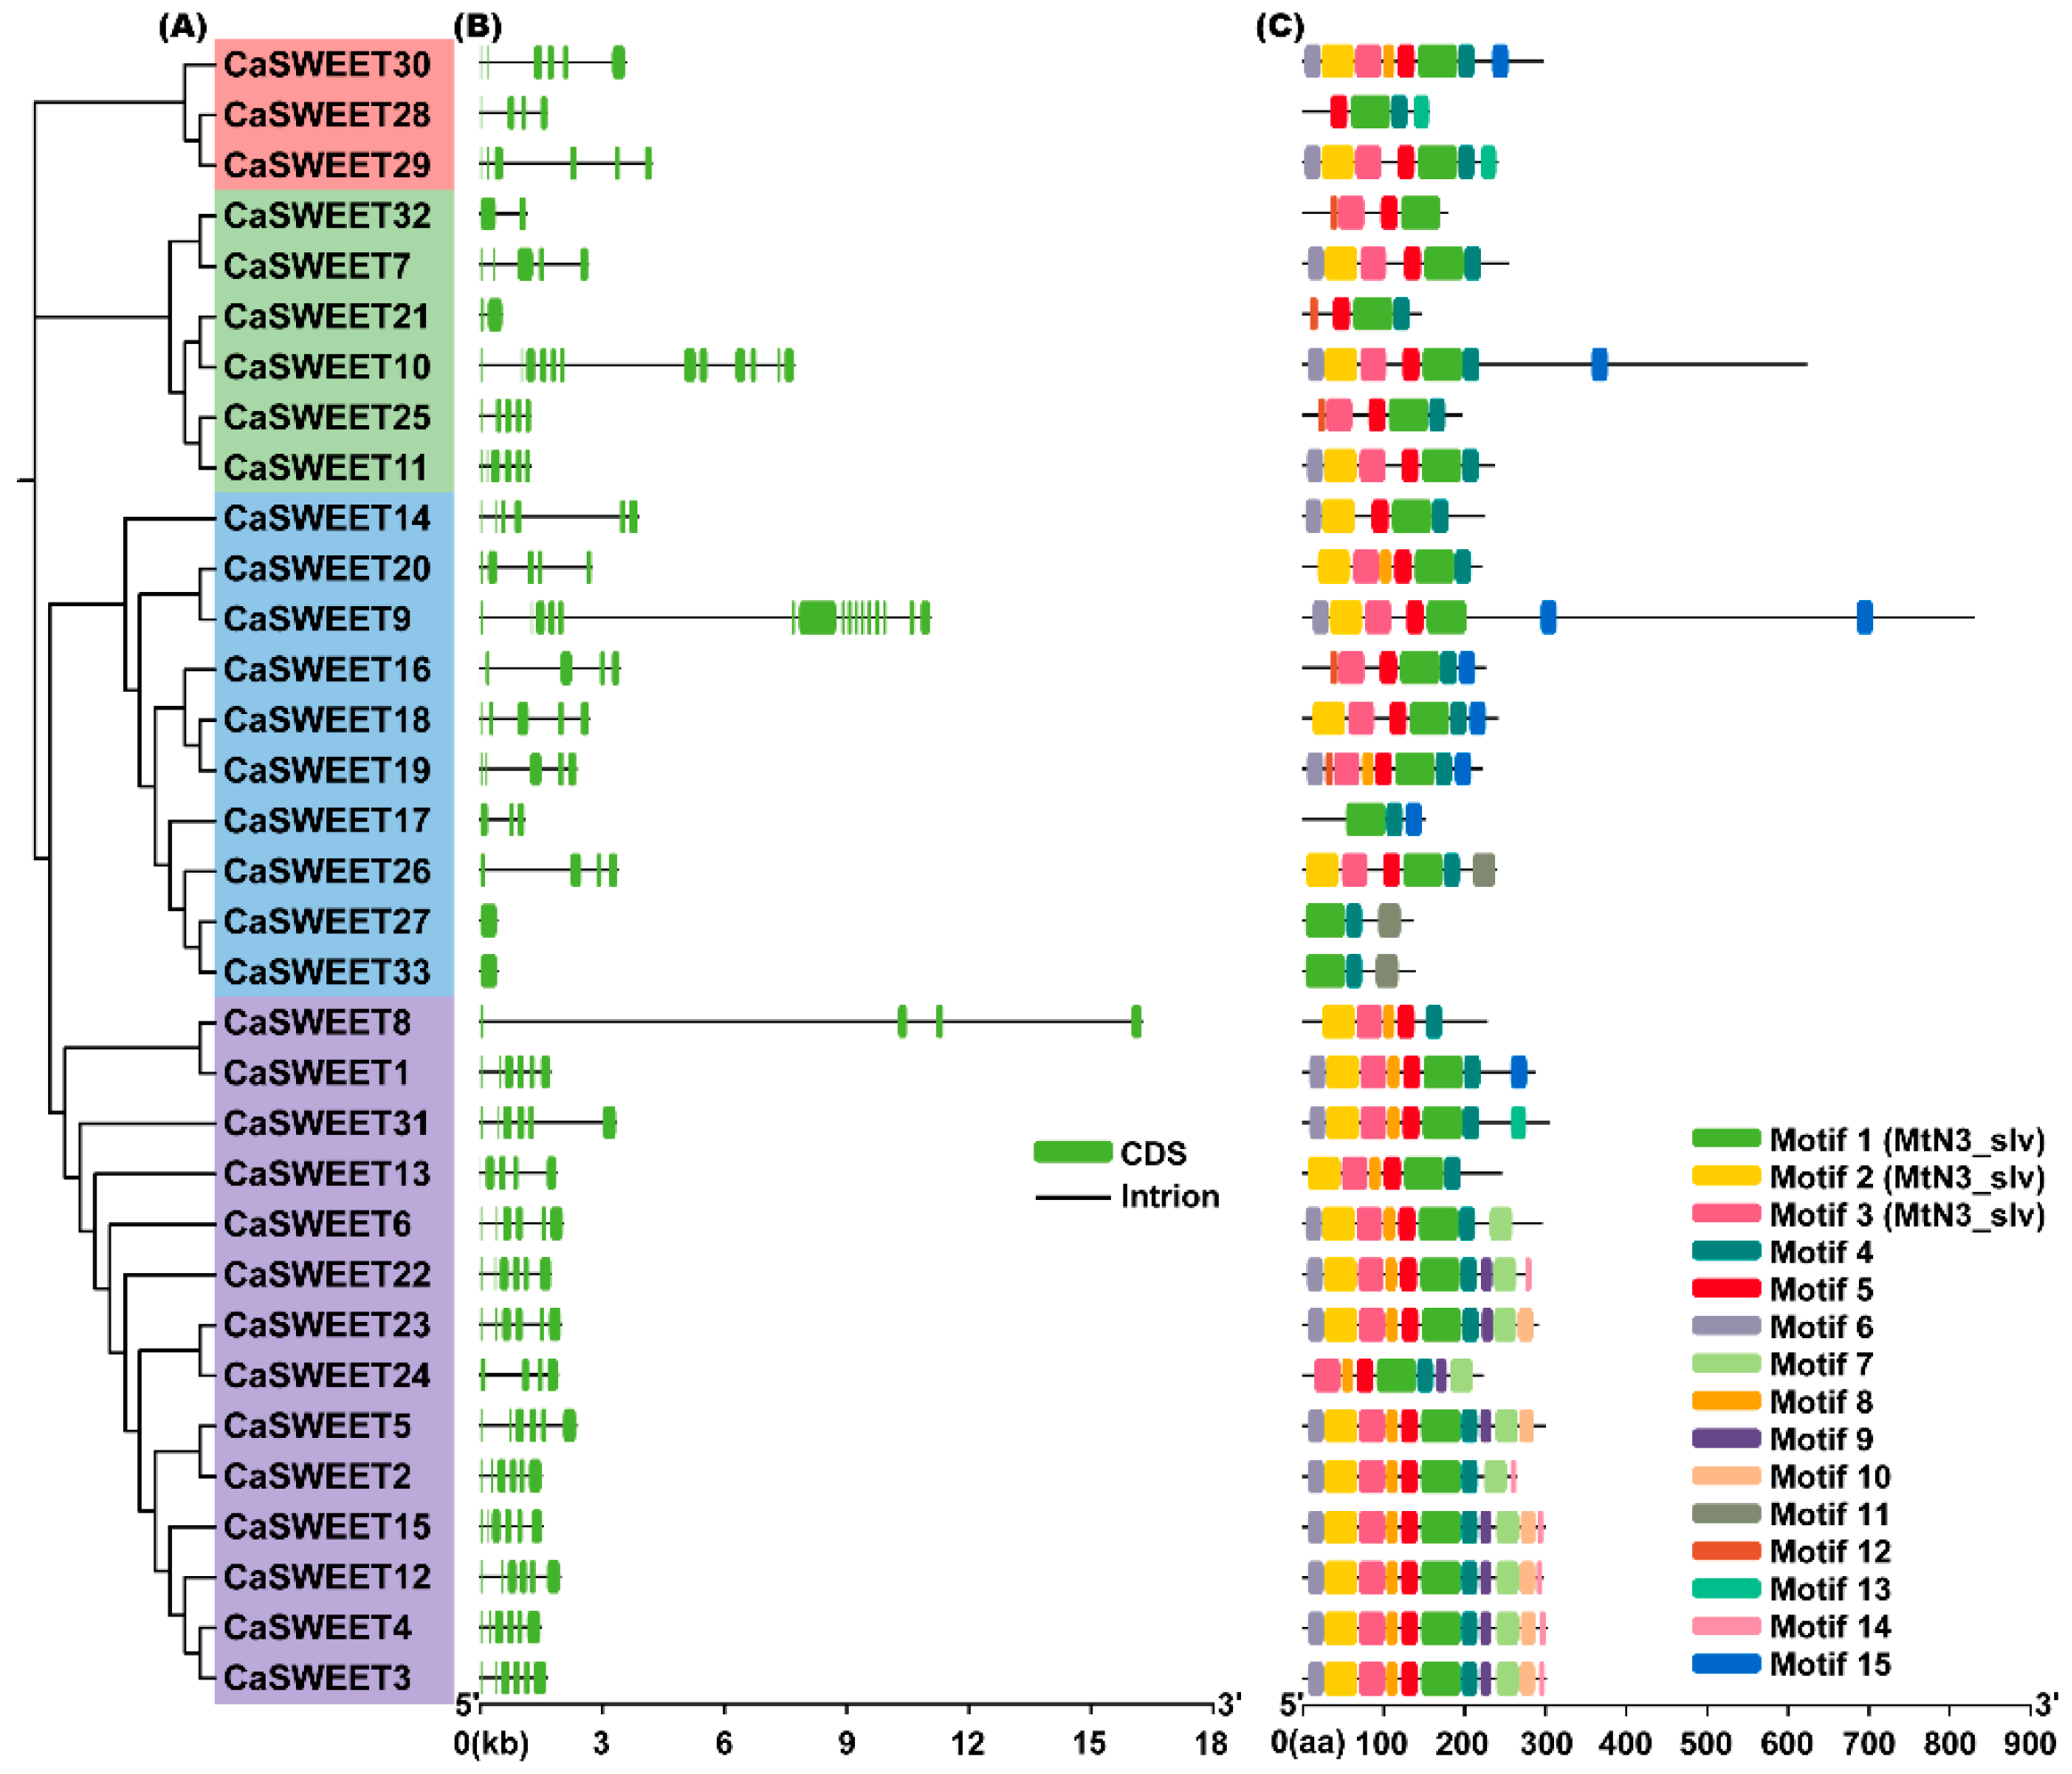
2.4. Gene Structure and Conserved Motif Analysis of CaSWEETs

Based on the GFF3 gene structure annotation information, the exon/intron structure diagram of CaSWEET was generated using TBtools. As shown in Figure 4B, except for CaSWEET27 and CaSWEET33, all CaSWEETs contain introns, with numbers ranging from 1–15. Additionally, the non-coding regions at both ends of all CaSWEETs are missing. Conservative motif analysis revealed that 15 motifs were identified from CaSWEETs. Among them, CaSWEET17, CaSWEET27, and CaSWEET33 contain the fewest motifs, with 3 each; CaSWEET3, CaSWEET4, CaSWEET12, and CaSWEET15 contain the most motifs, with 11 each. Using phylogenetic analysis, it was found that the more closely related CaSWEETs contained more similar motifs. In addition, structural domain analysis found that Motif1, Motif2, and Motif3 constitute the key SWEET functional domains (MtN3_slv), and other motifs did not match the known critical functional structural domains.

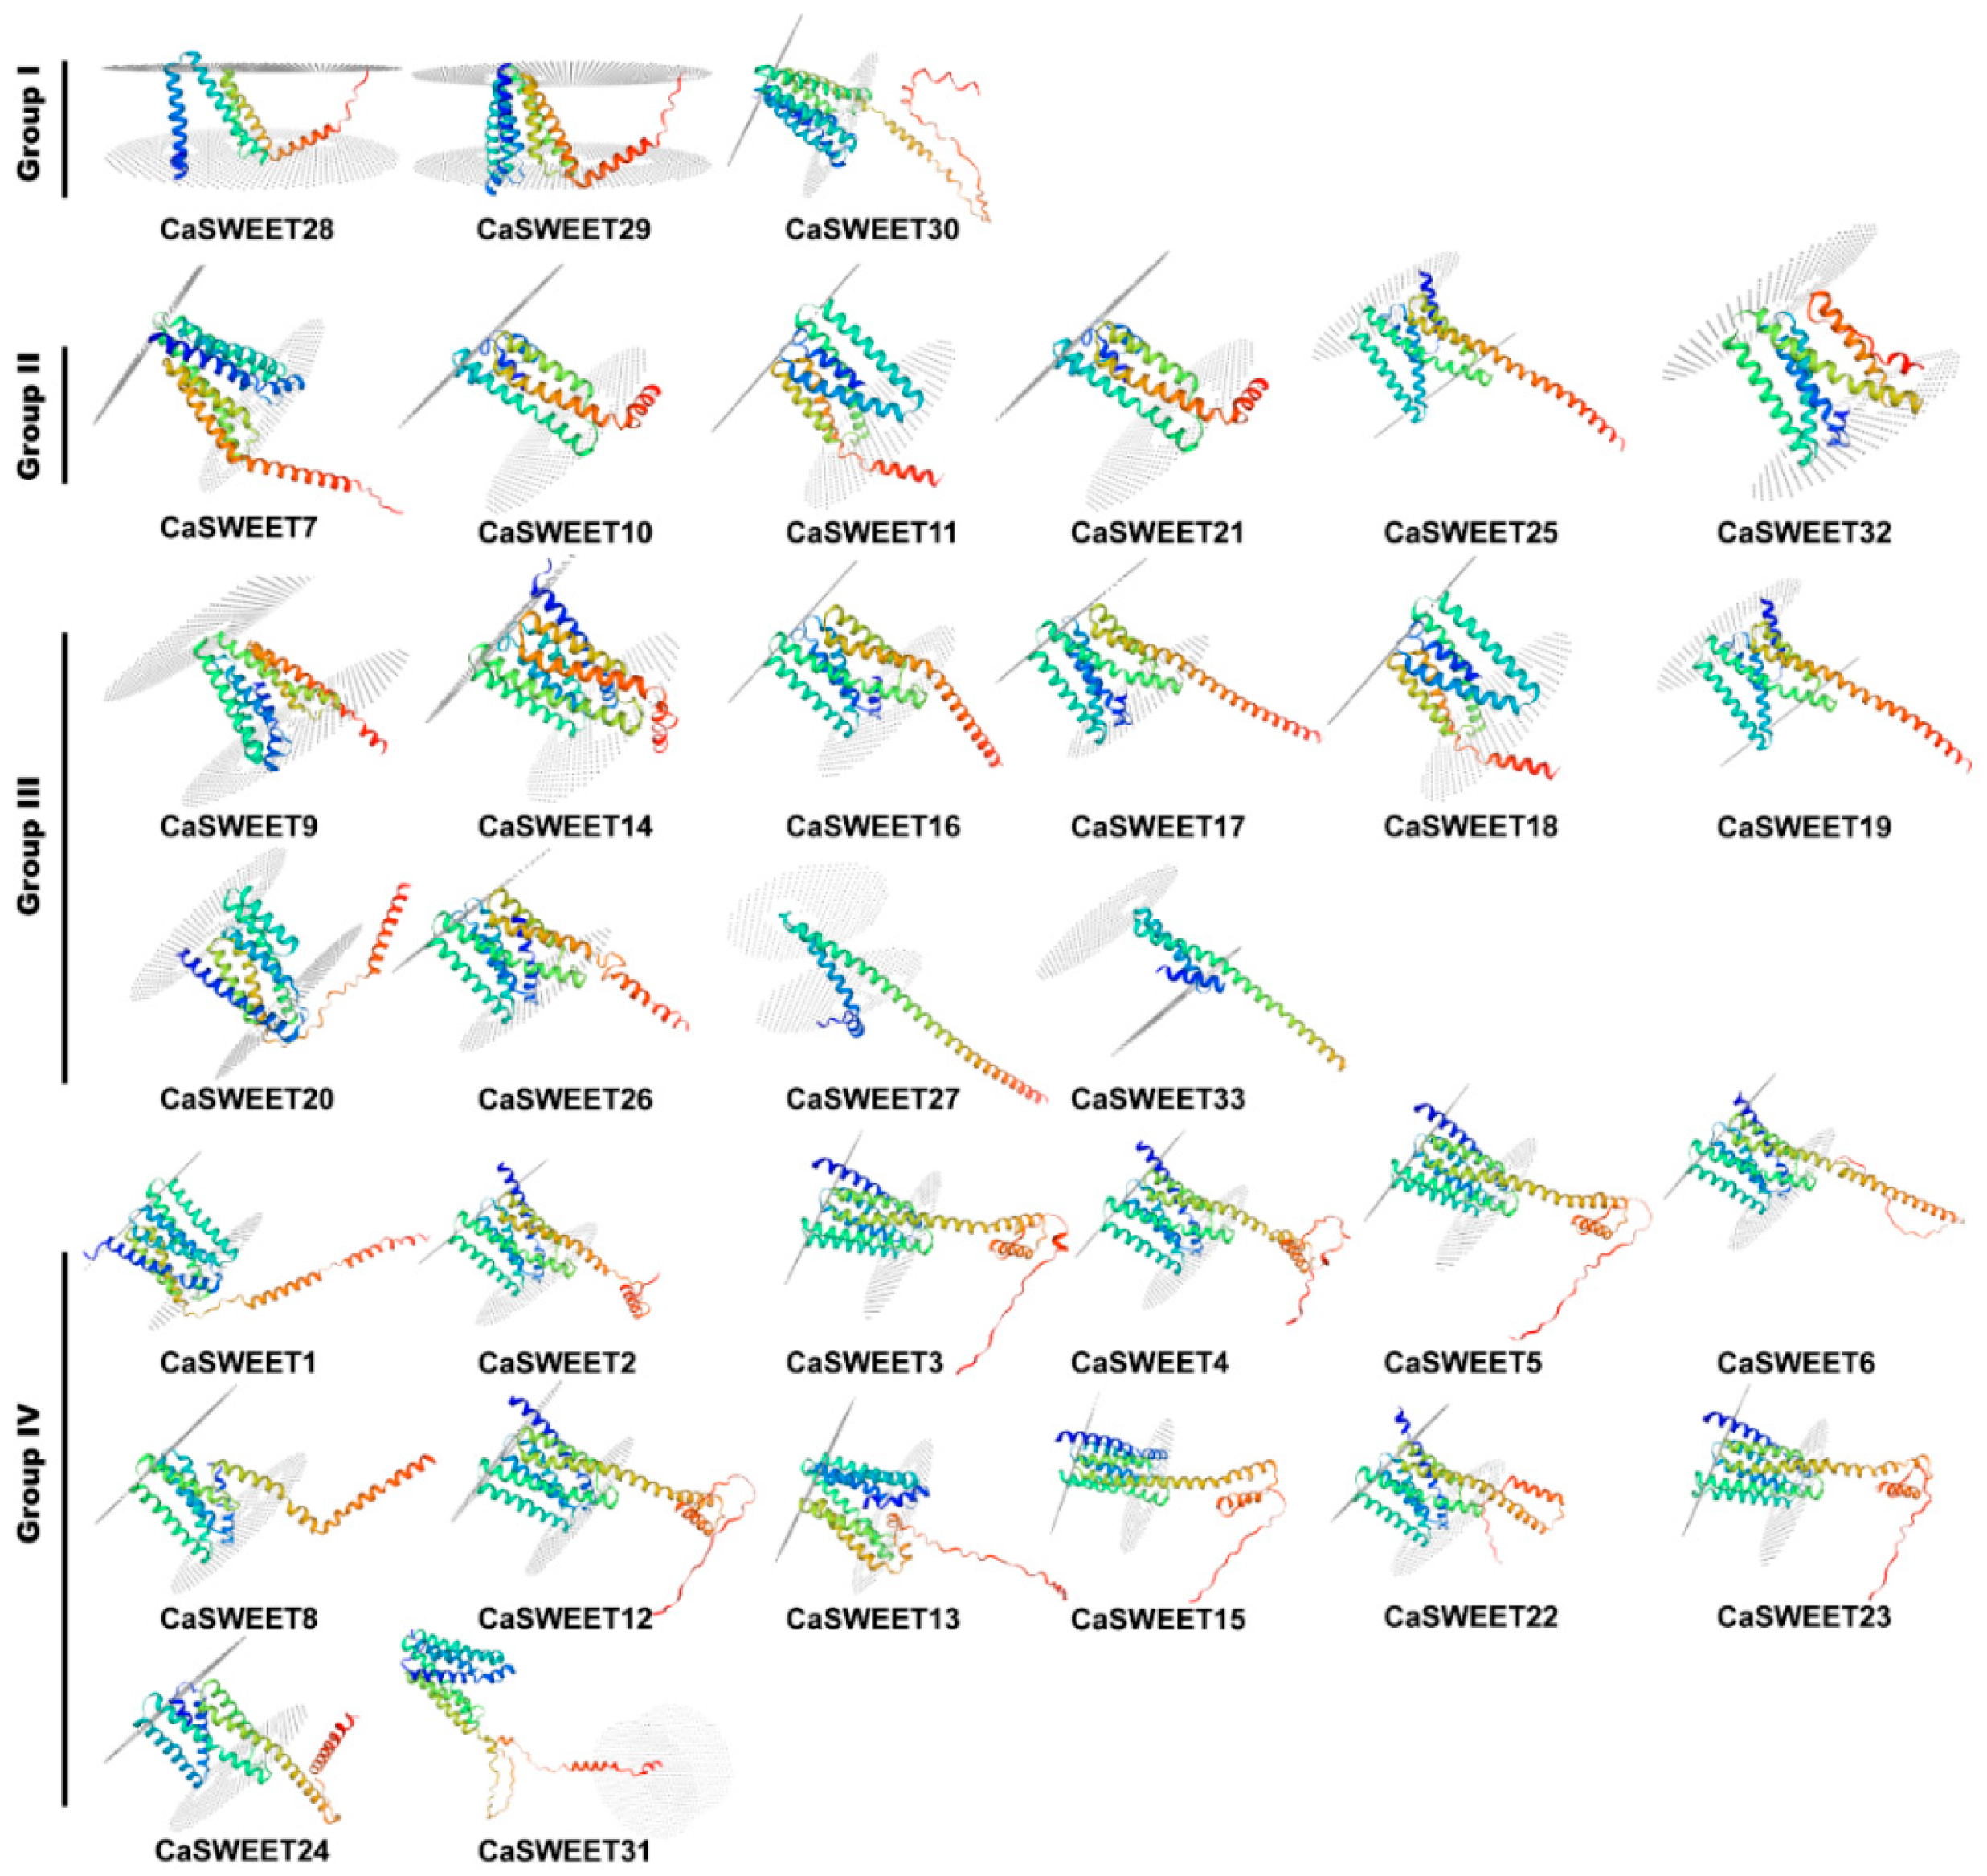
2.5. CaSWEET Protein Characterization and Three-Dimensional Structure Analysis

Protein feature analysis showed that the CaSWEET average number of amino acids is 268 aa (range = 135–829 aa) (Table 1). Other features of CaSWEETs were as follows: average molecular weight = 30.06 kDa (range = 15.59–93.21 kDa); average isoelectric point = 8.86 (range = 5.41–9.87); average instability index = 37.86 (range = 27.53–53.11); average grand average of hydropathicity = 0.57. The above results show that the majority of CaSWEETs are alkaline, hydrophobic, and stable proteins. The subcellular localization prediction analysis revealed that CaSWEET9 is localized exclusively in the nucleus; CaSWEET10 and CaSWEET17 are localized in the chloroplast; the rest of the CaSWEETs are localized in the cell membrane. In addition, some CaSWEETs may also be localized in peroxisomes and the Golgi apparatus.
The three-dimension homology modeling results show that CaSWEETs are similar in structure and mainly consist of an alpha helix (25–65%), extended strand (15–35%), random coil (15–37%), and beta turn (4–11%) (Figure 5). In addition, all CaSWEETs are transmembrane proteins and have multiple transmembrane regions.

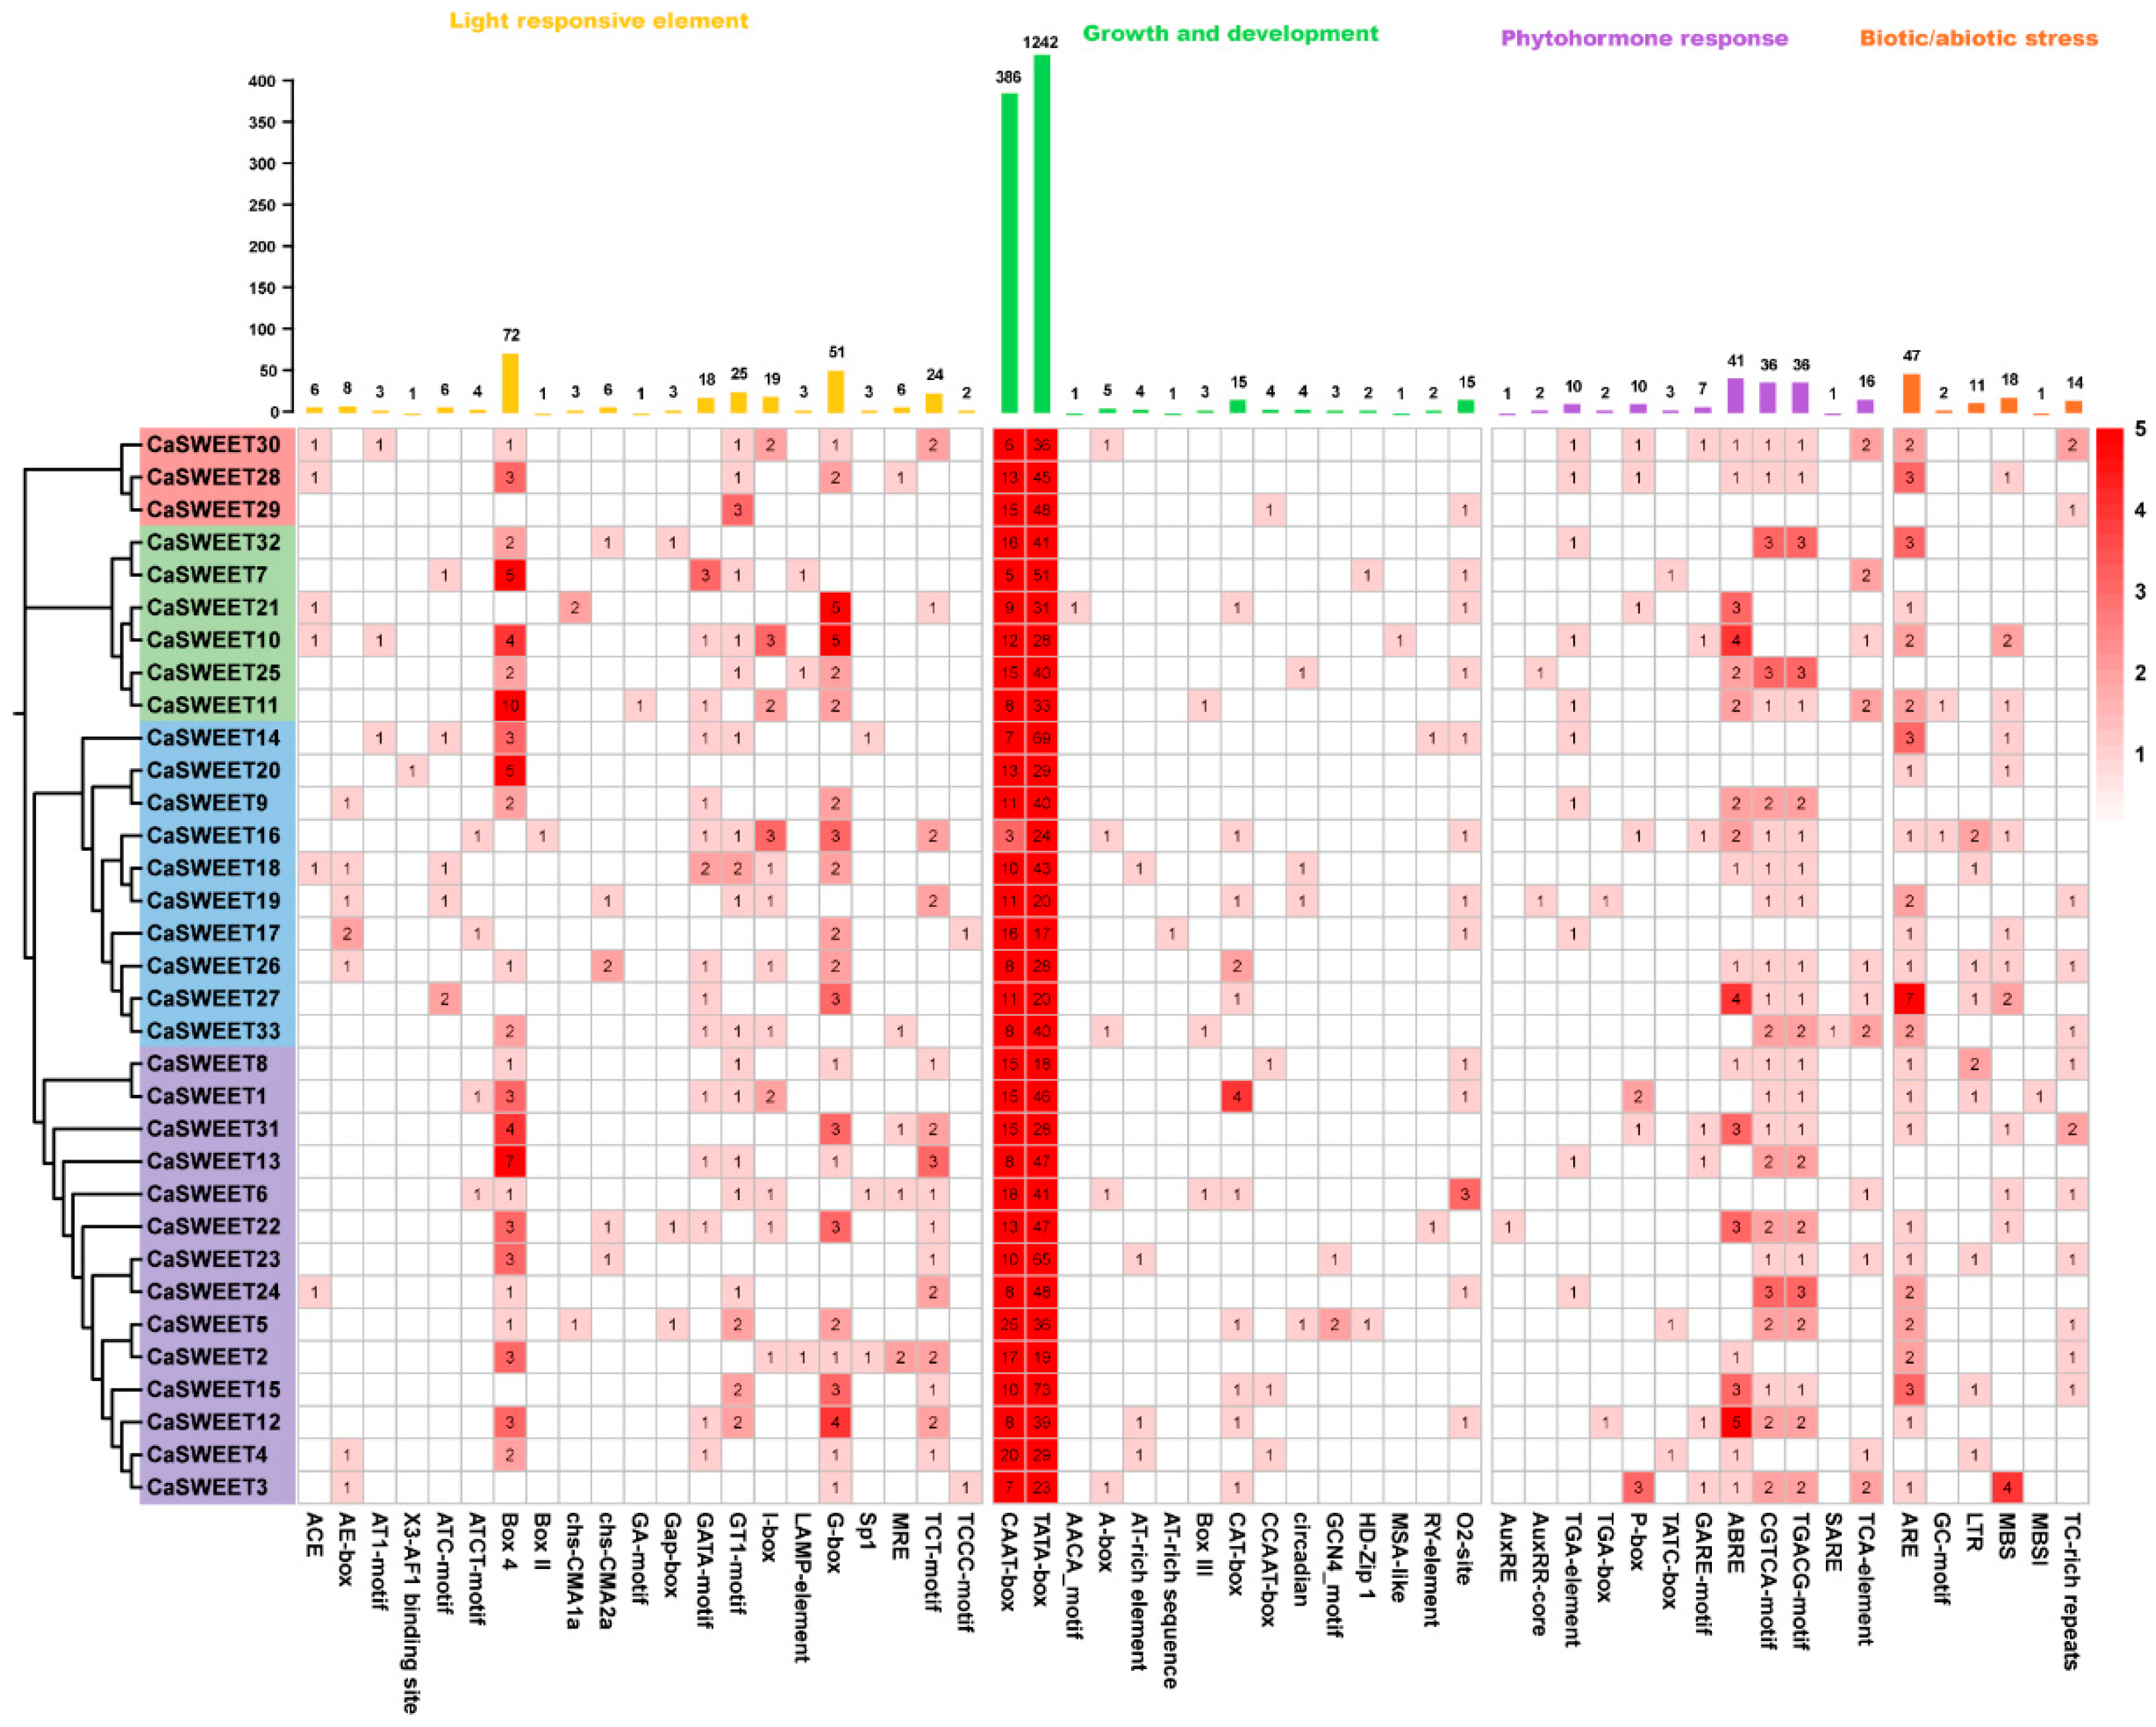
2.6. CaSWEETs Contain Versatility Cis-Regulatory Elements

Cis-regulatory elements are a class of DNA sequences located in the transcriptional initiation region of genes, playing a critical role in regulating gene transcription. They function by binding to transcription factors and modulating the transcriptional process of genes [21]. In this study, the kind of 54 cis-elements were identified in the 1.5 kb upstream promoter region of the 33 CaSWEETs (Figure 6). These cis-elements can be categorized into four groups: 21 elements associated with light response, 15 elements related to “growth and development”, 12 elements associated with “plant hormone response”, and 6 elements related to “biotic/abiotic stress”. Apart from the core promoters, TATA-box and CAAT-box, the light-responsive elements are the most diverse and abundant, especially Box4, with a total of 72 occurrences, implying that the expression of CaSWEETs may be influenced by light conditions. Meanwhile, hormone response elements, including those for auxin (AuxRE, AuxRR-core, TGA-element, TGA-box), gibberellin (P-box, TATC-box, GARE-motif), abscisic acid (ABRE), jasmonic acid (CGTCA-motif, TGACG-motif), and salicylic acid (SARE, TCA-element) have been detected in the CaSWEETs promoter, and abscisic acid and jasmonic acid responsive elements are the majority. In addition, biotic/abiotic stress response elements were also found, such as anaerobic induction elements (ARE, GC-motifs), low-temperature response elements (LTR), and drought response elements (MBS), suggesting that the expression of CaSWEETs is induced by environmental stress.

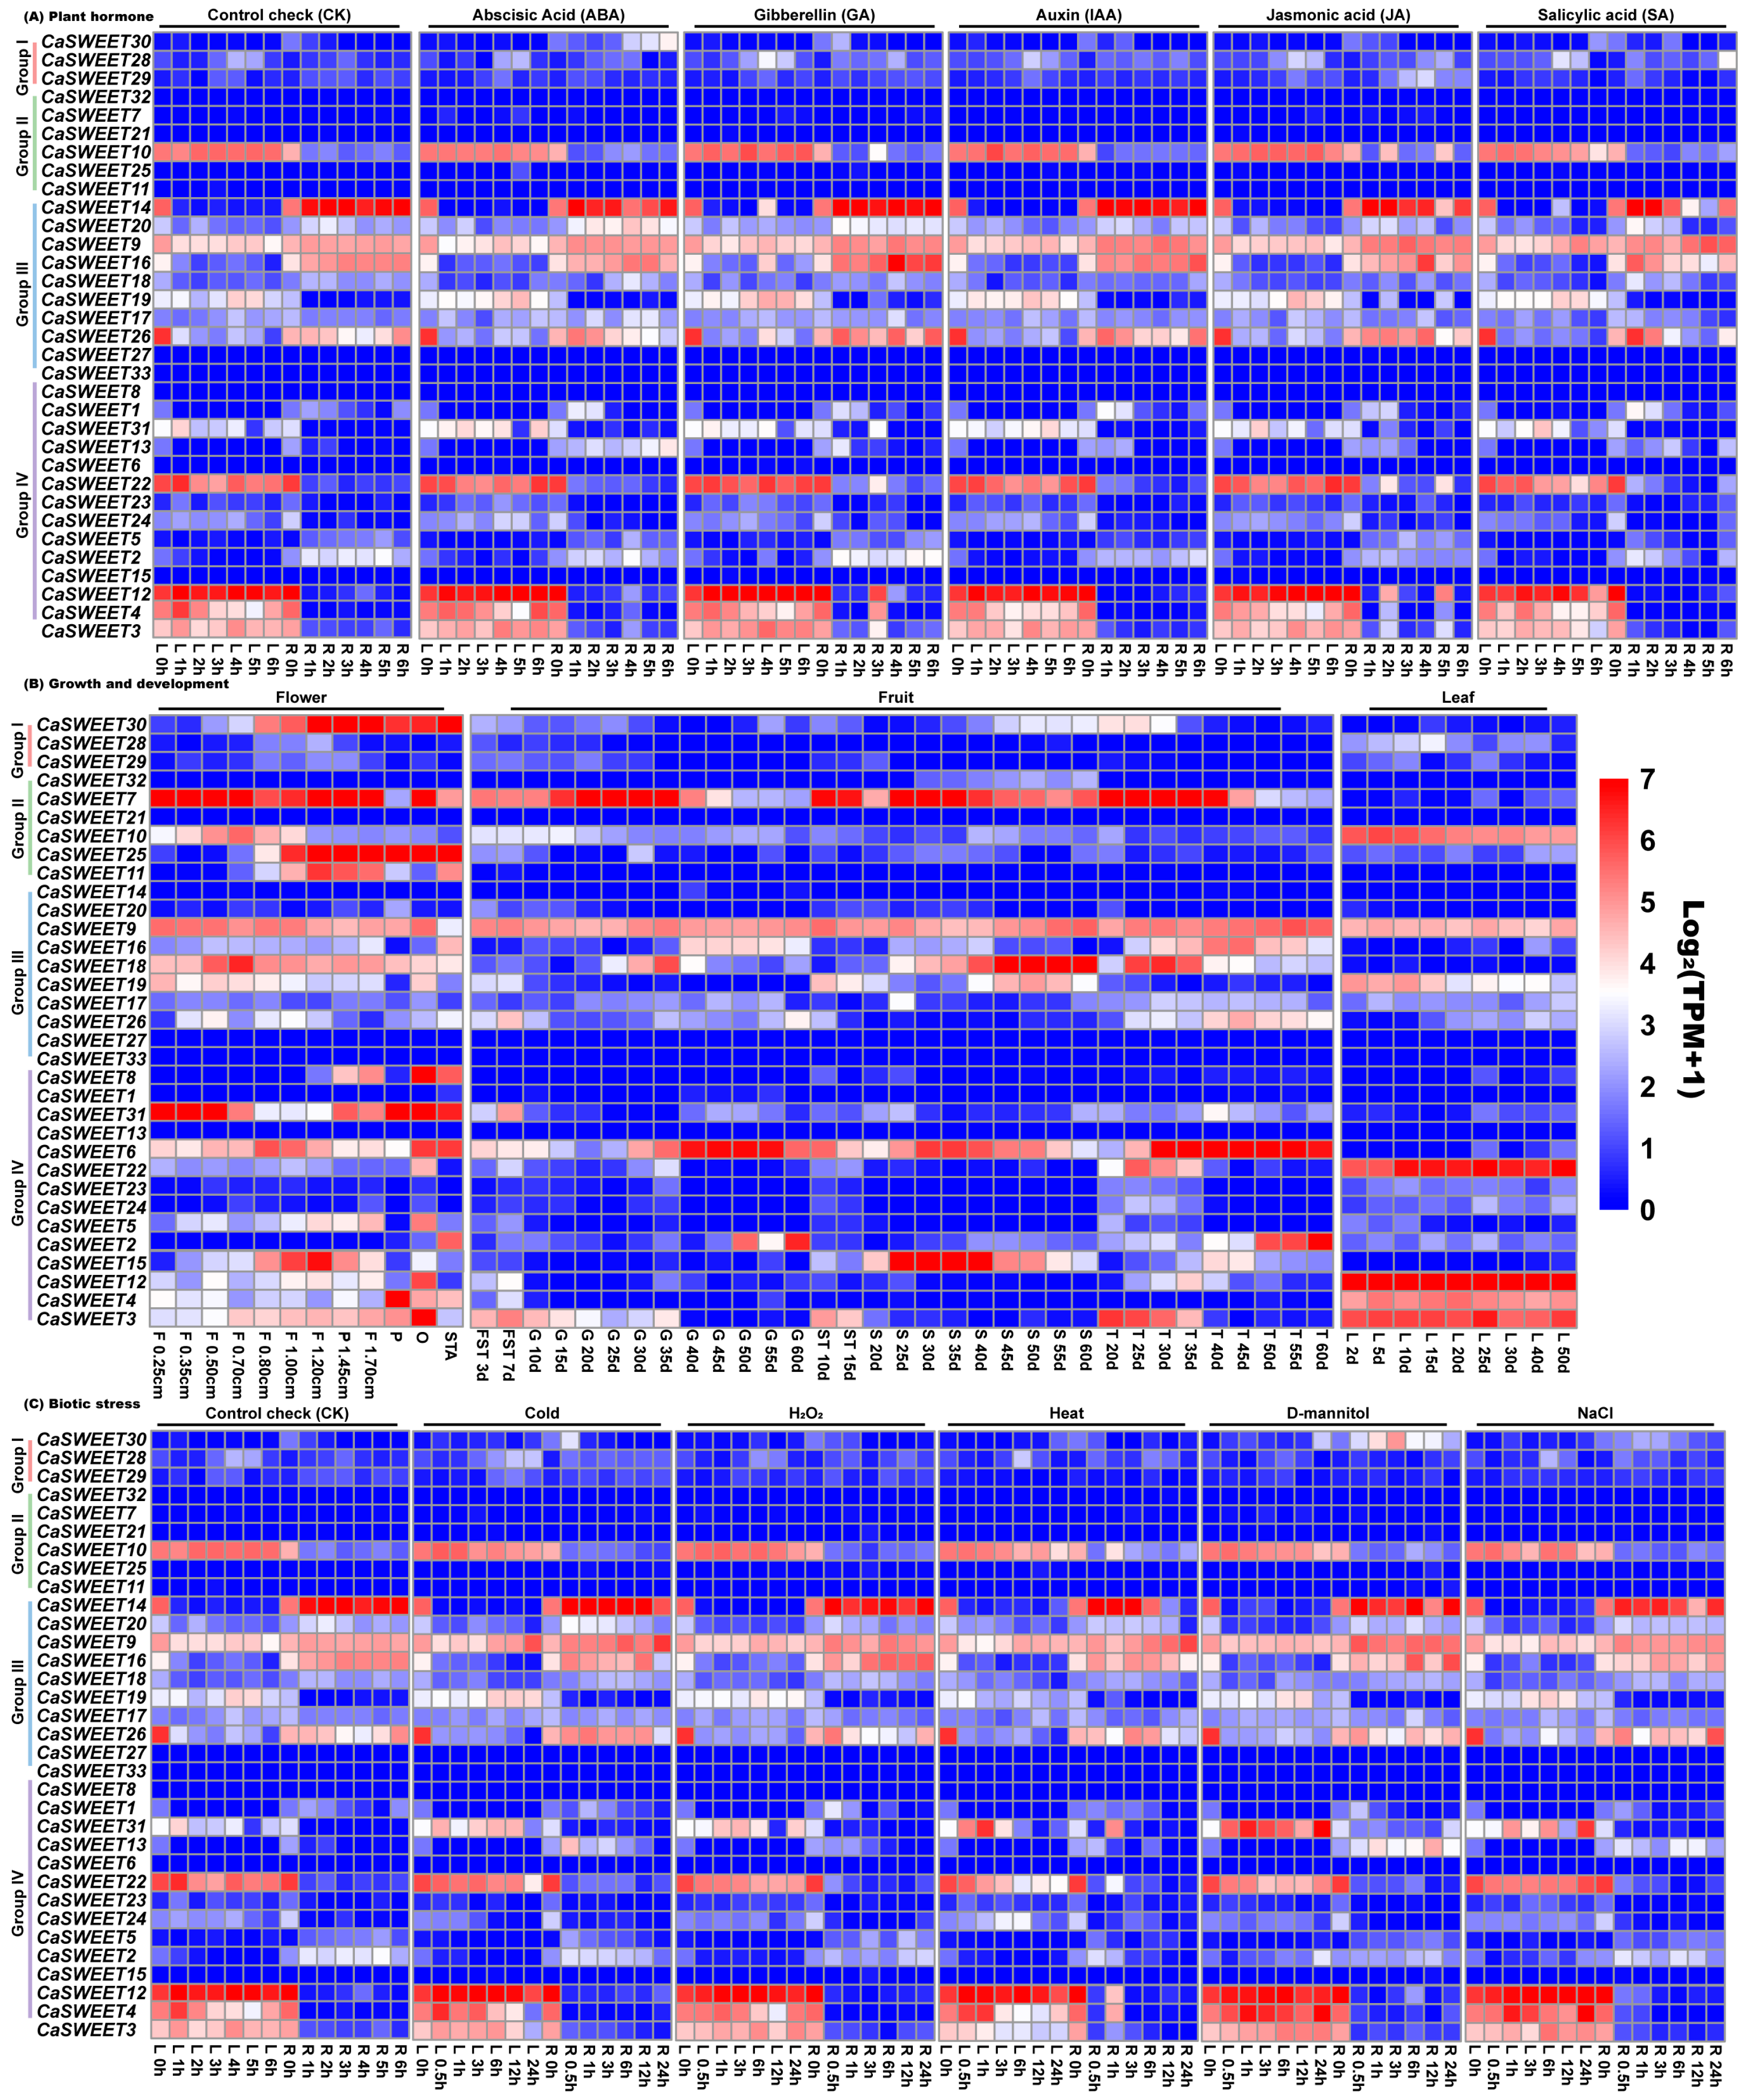
2.7. Transcriptomic Analysis Revealed Multiple CaSWEET Expression Patterns

In order to investigate the CaSWEET expression characteristics, we analyzed the expression patterns of these genes using RNA-seq transcriptomic data. As illustrated in Figure 7A, in leaf tissues, the expression levels of CaSWEETs are relatively less influenced by plant hormones. However, it is worth noting that under the GA treatment, CaSWEET14/16/26/28 showed a significant increase in expression levels compared to the CK after 4 h of treatment. In root tissues, the expression levels of CaSWEET20/31 significantly increased within 6 h under the ABA treatment. Under the GA treatment, the expression levels of CaSWEET3/4/10/12/13/22 significantly increased at 3 h. Under the JA treatment, the expression levels of CaSWEET3/4/10/12/22 significantly increased at 2 and 5 h. The expression of CaSWEETs is also modulated to varying degrees under IAA and SA treatments. These results demonstrate that the expression of CaSWEETs is induced by plant hormones.
As shown in Figure 7B, CaSWEETs are expressed at different stages of flower development. Among them, the CaSWEET6/7/9/10/15/18/19/31 expression levels are relatively high in flower buds, and CaSWEET4/6/9/18/25/30/31 are higher in fully open perianths, ovaries, and anthers. In fruits and seeds, CaSWEET6/7/9 are expressed throughout all stages, while the remaining CaSWEETs are expressed only at specific time points. In addition, CaSWEET3/4/9/10/12/19/22 are all expressed during leaf growth process. These results indicate that CaSWEETs play a positive regulatory role during the growth and development.
As exhibited in Figure 7C, CaSWEET13/30/31 are the most affected by abiotic stress. In root tissues, the expression level of CaSWEET13 significantly increased under five stress conditions, while CaSWEET30 showed a significant upregulation specifically under D-mannitol stress. In leaf tissues, the expression level of CaSWEET31 fluctuated greatly under different treatments but overall showed an increasing trend. It is noteworthy that multiple CaSWEETs (CaSWEET3/4/10/12/22/31) in root tissues showed significant induction and upregulation after 1 h of high-temperature stress. In conclusion, CaSWEETs play an important role in plant stress response processes.

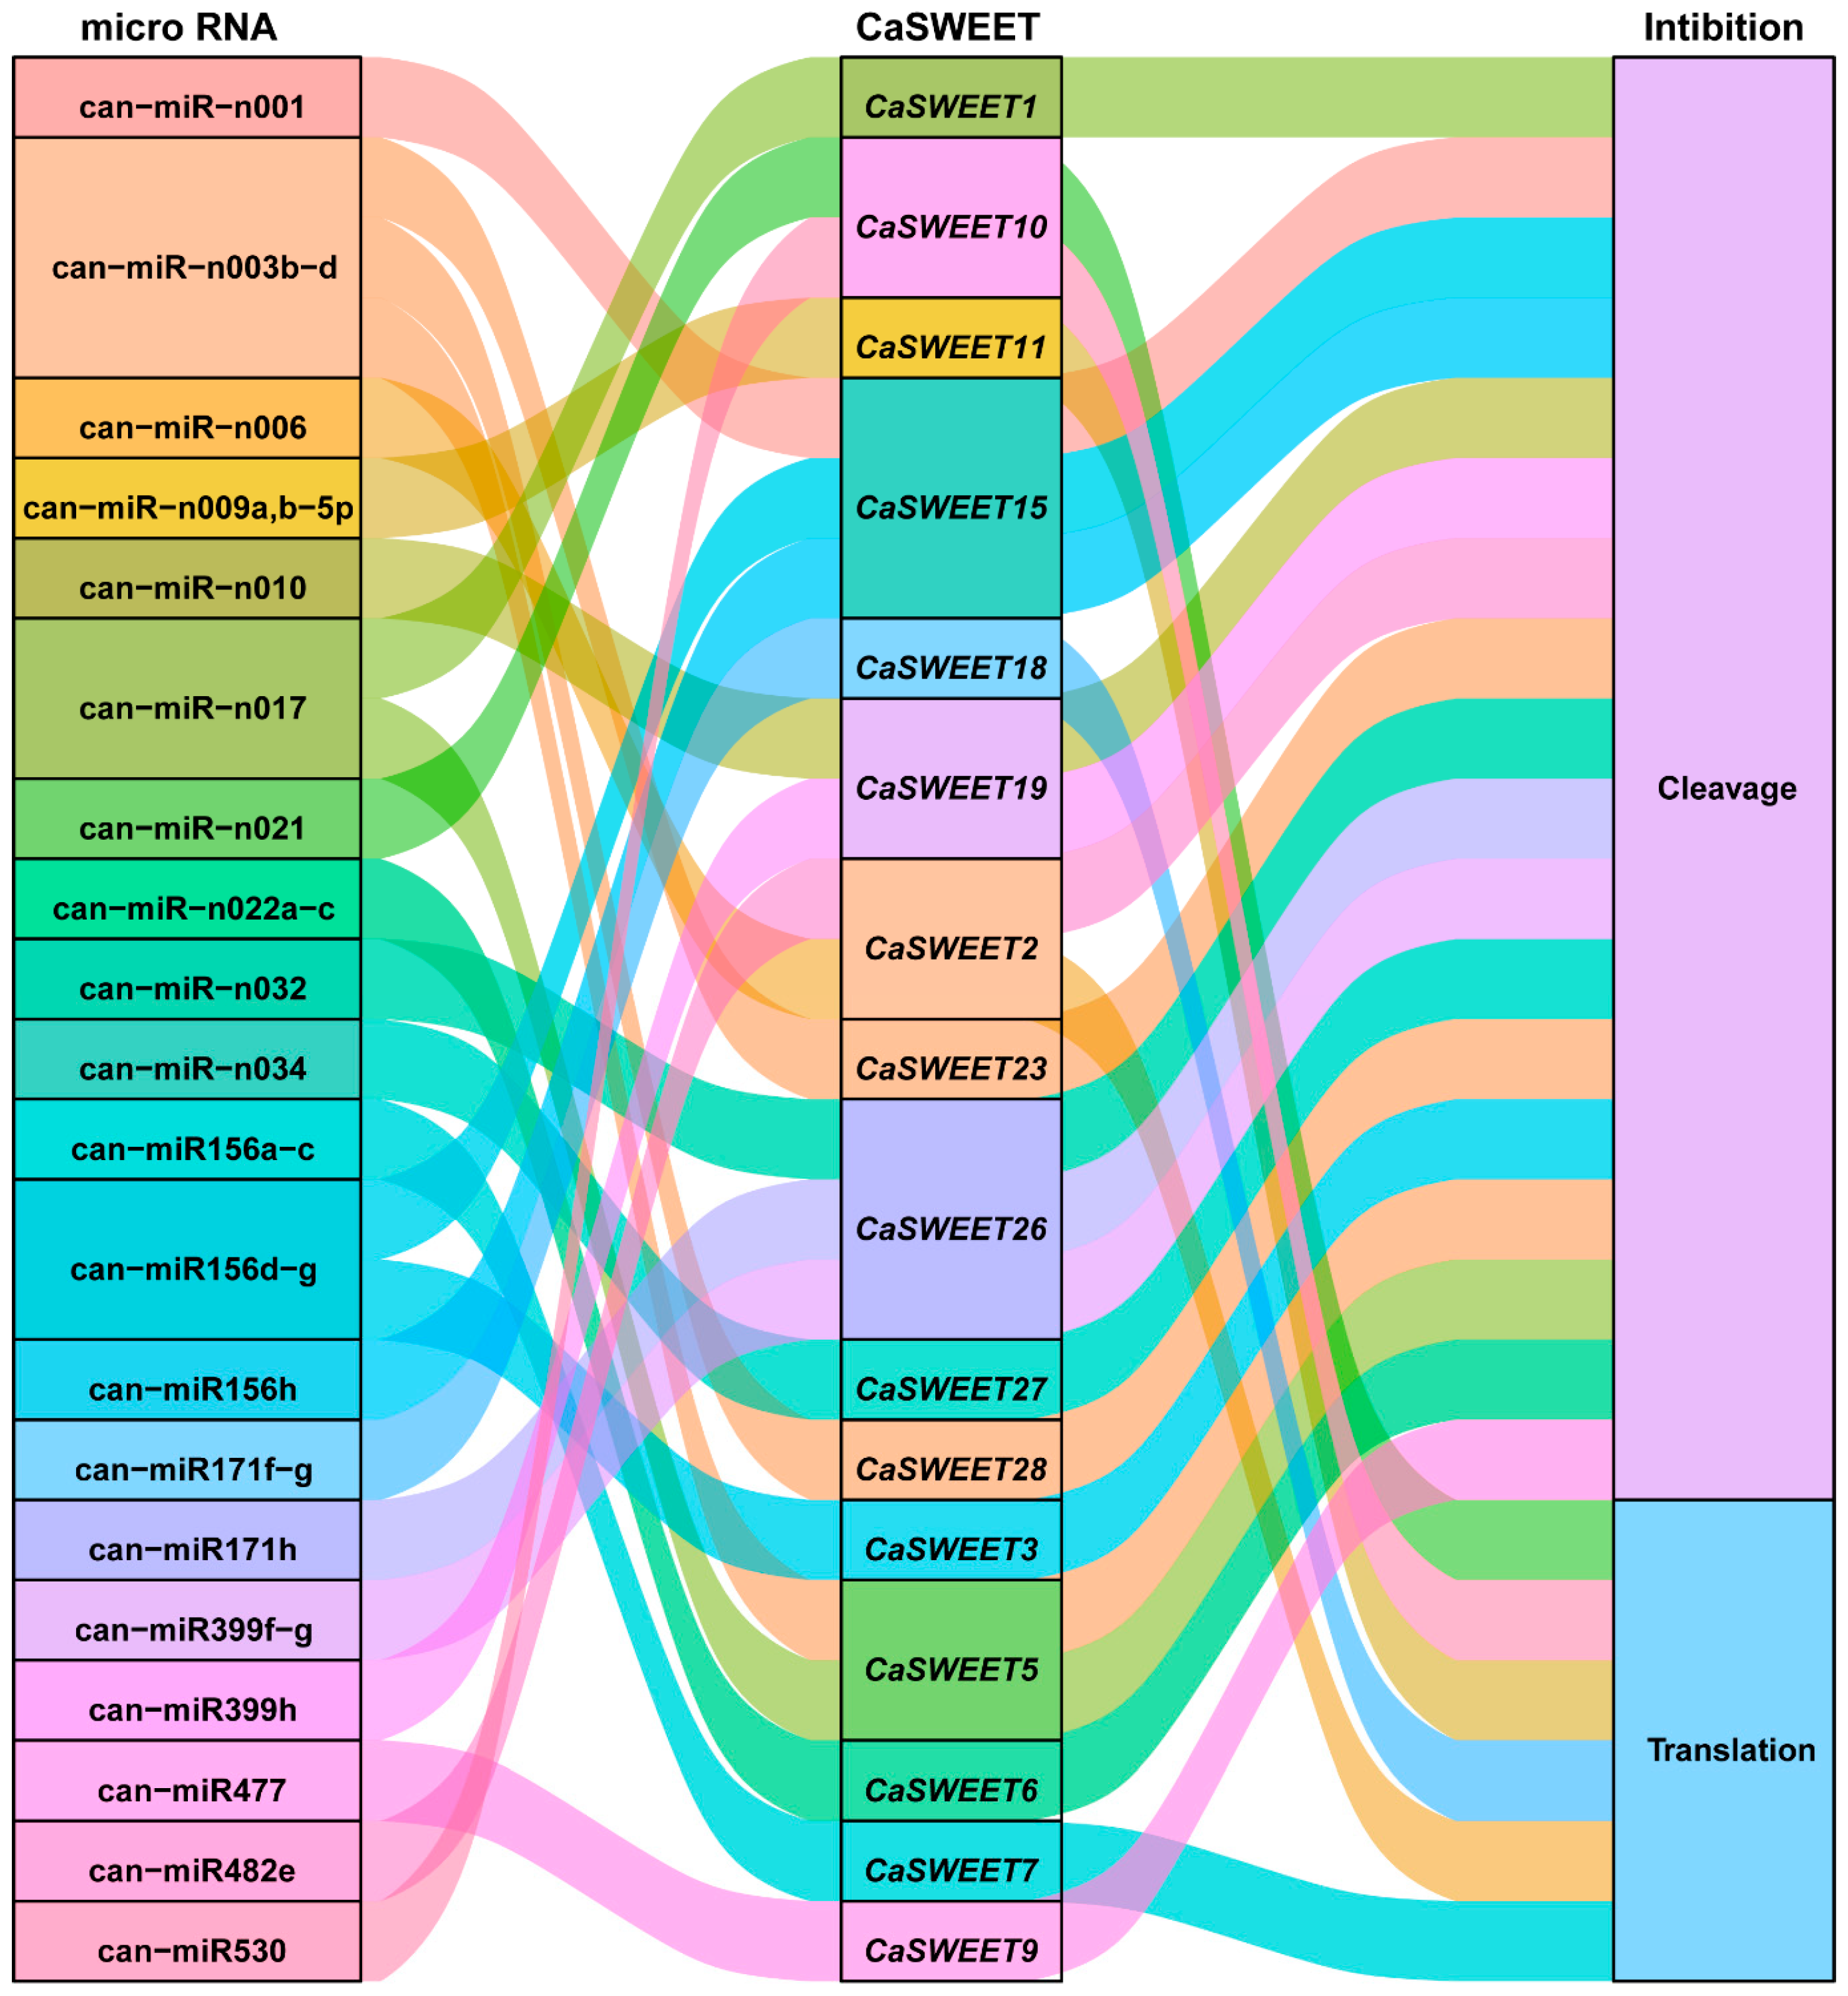
2.8. MicroRNA (miRNA) Regulates The Post-Transcriptional Expression of CaSWEETs

Through miRNA target prediction, it was found that 20 pepper miRNAs target and regulate 16 CaSWEETs through cleavage and translation inhibition mechanisms (Figure 8). Among them, can-miR-n003-d targets three CaSWEETs (CaSWEET2/5/23), can-miR-n017 targets two CaSWEETs (CaSWEET1/5), and can-miR156d-g targets two CaSWEETs (CaSWEET7/15). In addition, except for can-miR-n009a,b-5p, can-miR530, can-miR-n006, can-miR-n021, can-miR156a-c, and can-miR171f-g, the remaining miRNAs regulate the expression of CaSWEETs through cleavage mechanisms. The above findings indicate that multiple miRNAs target CaSWEETs and form a miRNA–mRNA regulatory network, participating in the post-transcriptional expression regulation of CaSWEETs.

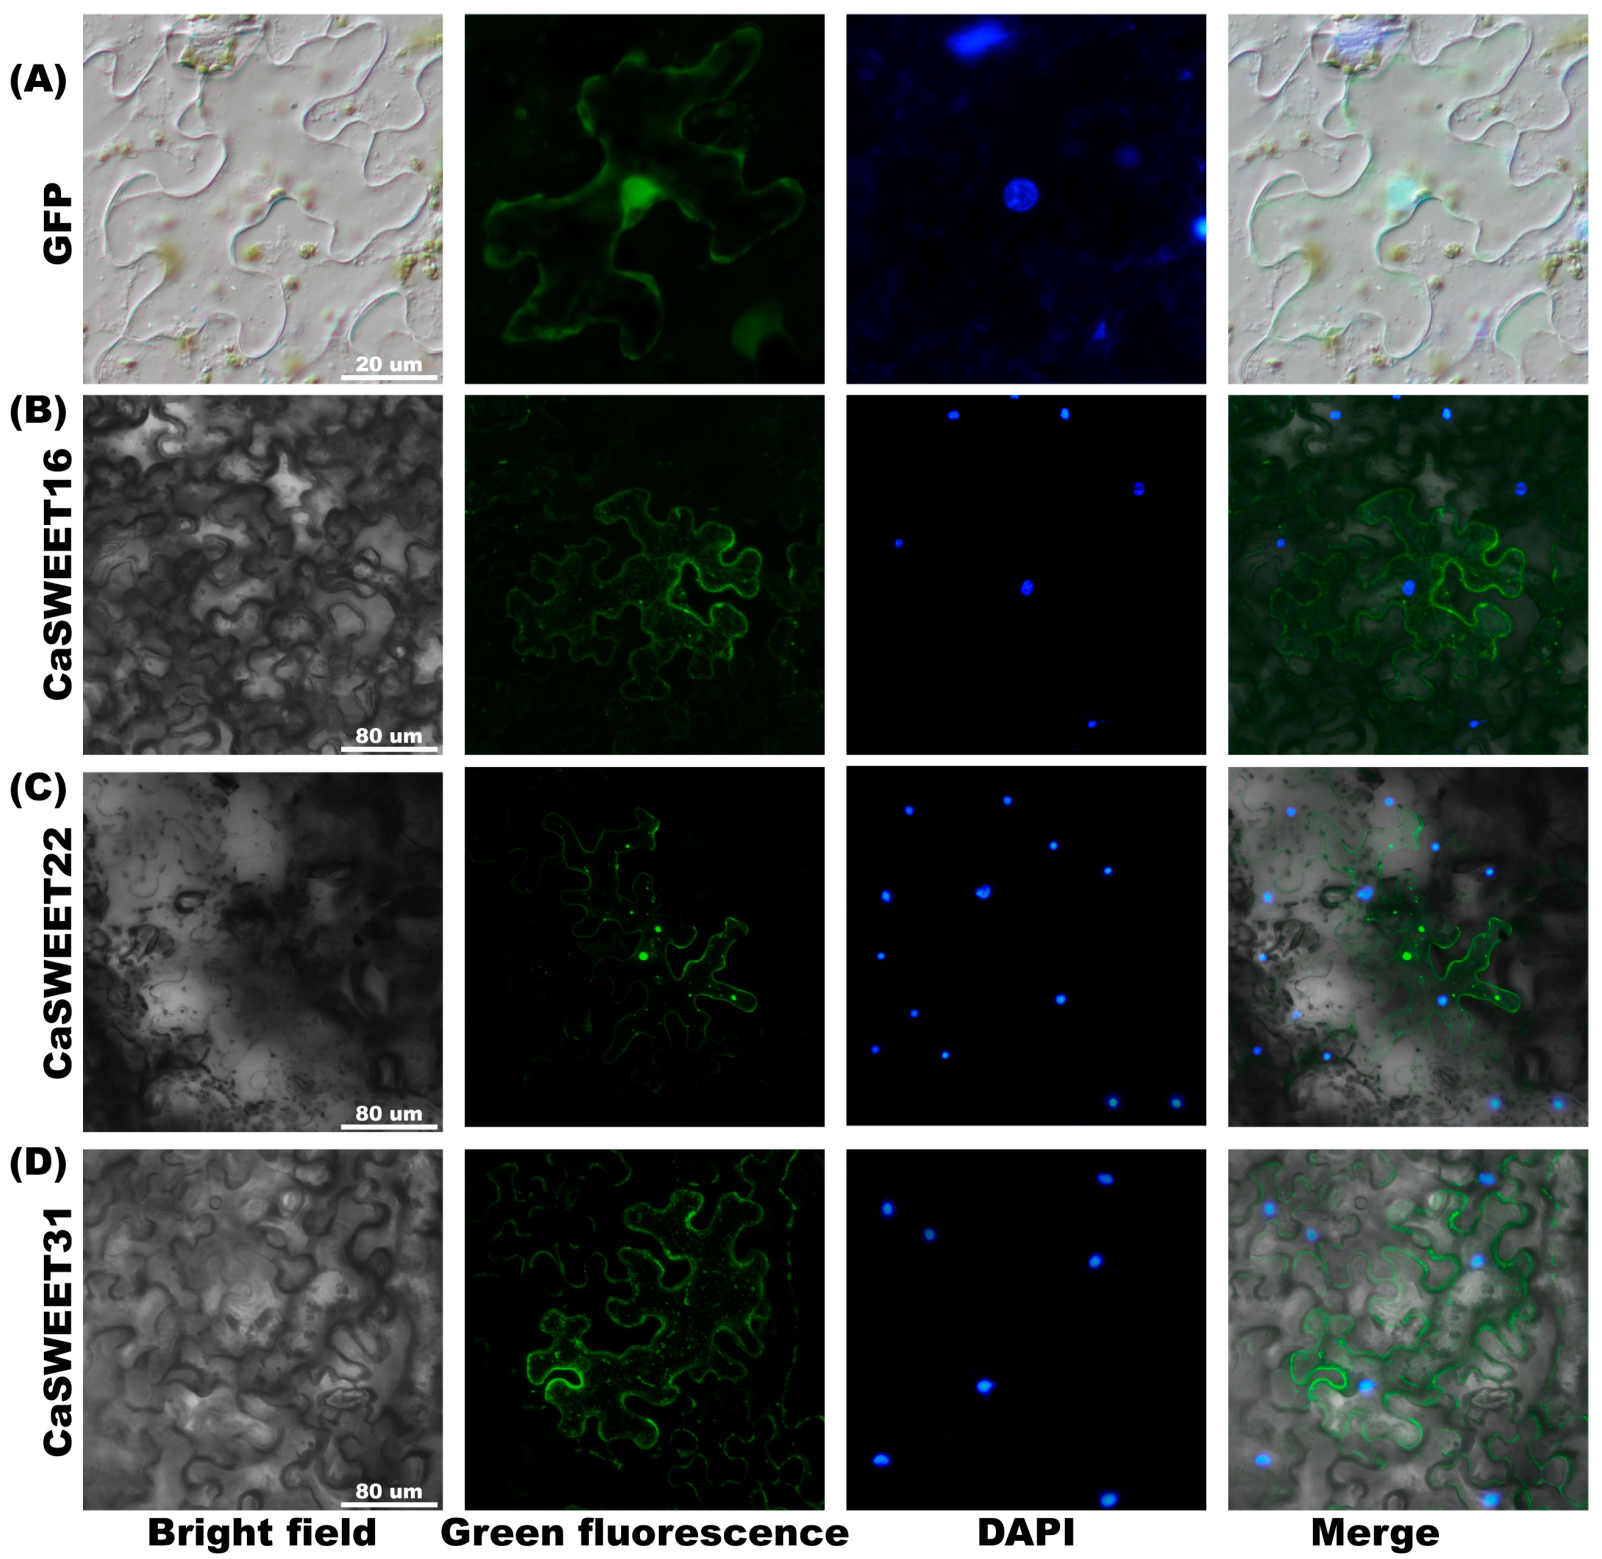
2.9. Subcellular Localization Analysis of CaSWEET16/22/31

In this study, we selected one highly expressed gene (CaSWEET22), one differentially expressed gene (CaSWEET31), and one low-expressed gene (CaSWEET16) for further validation the subcellular localization. The prediction results indicate that CaSWEET16 is localized in the cell membrane, chloroplast, and peroxisome, while CaSWEET22/31 is predicted to be localized in the cell membrane. To verify these results and reveal CaSWEET16/22/31 function patterns, three CaSWEETs were tagged with GFP at the C-terminus and expressed in vivo in N. benthamiana leaves. As illustrated in Figure 9, inconsistent to the predicted results, CaSWEET16 was found to be localized in the cell membrane and peroxisomes, rather than in chloroplasts. Additionally, CaSWEET22/31 was observed to localize not only in the cell membrane but also in peroxisomes.

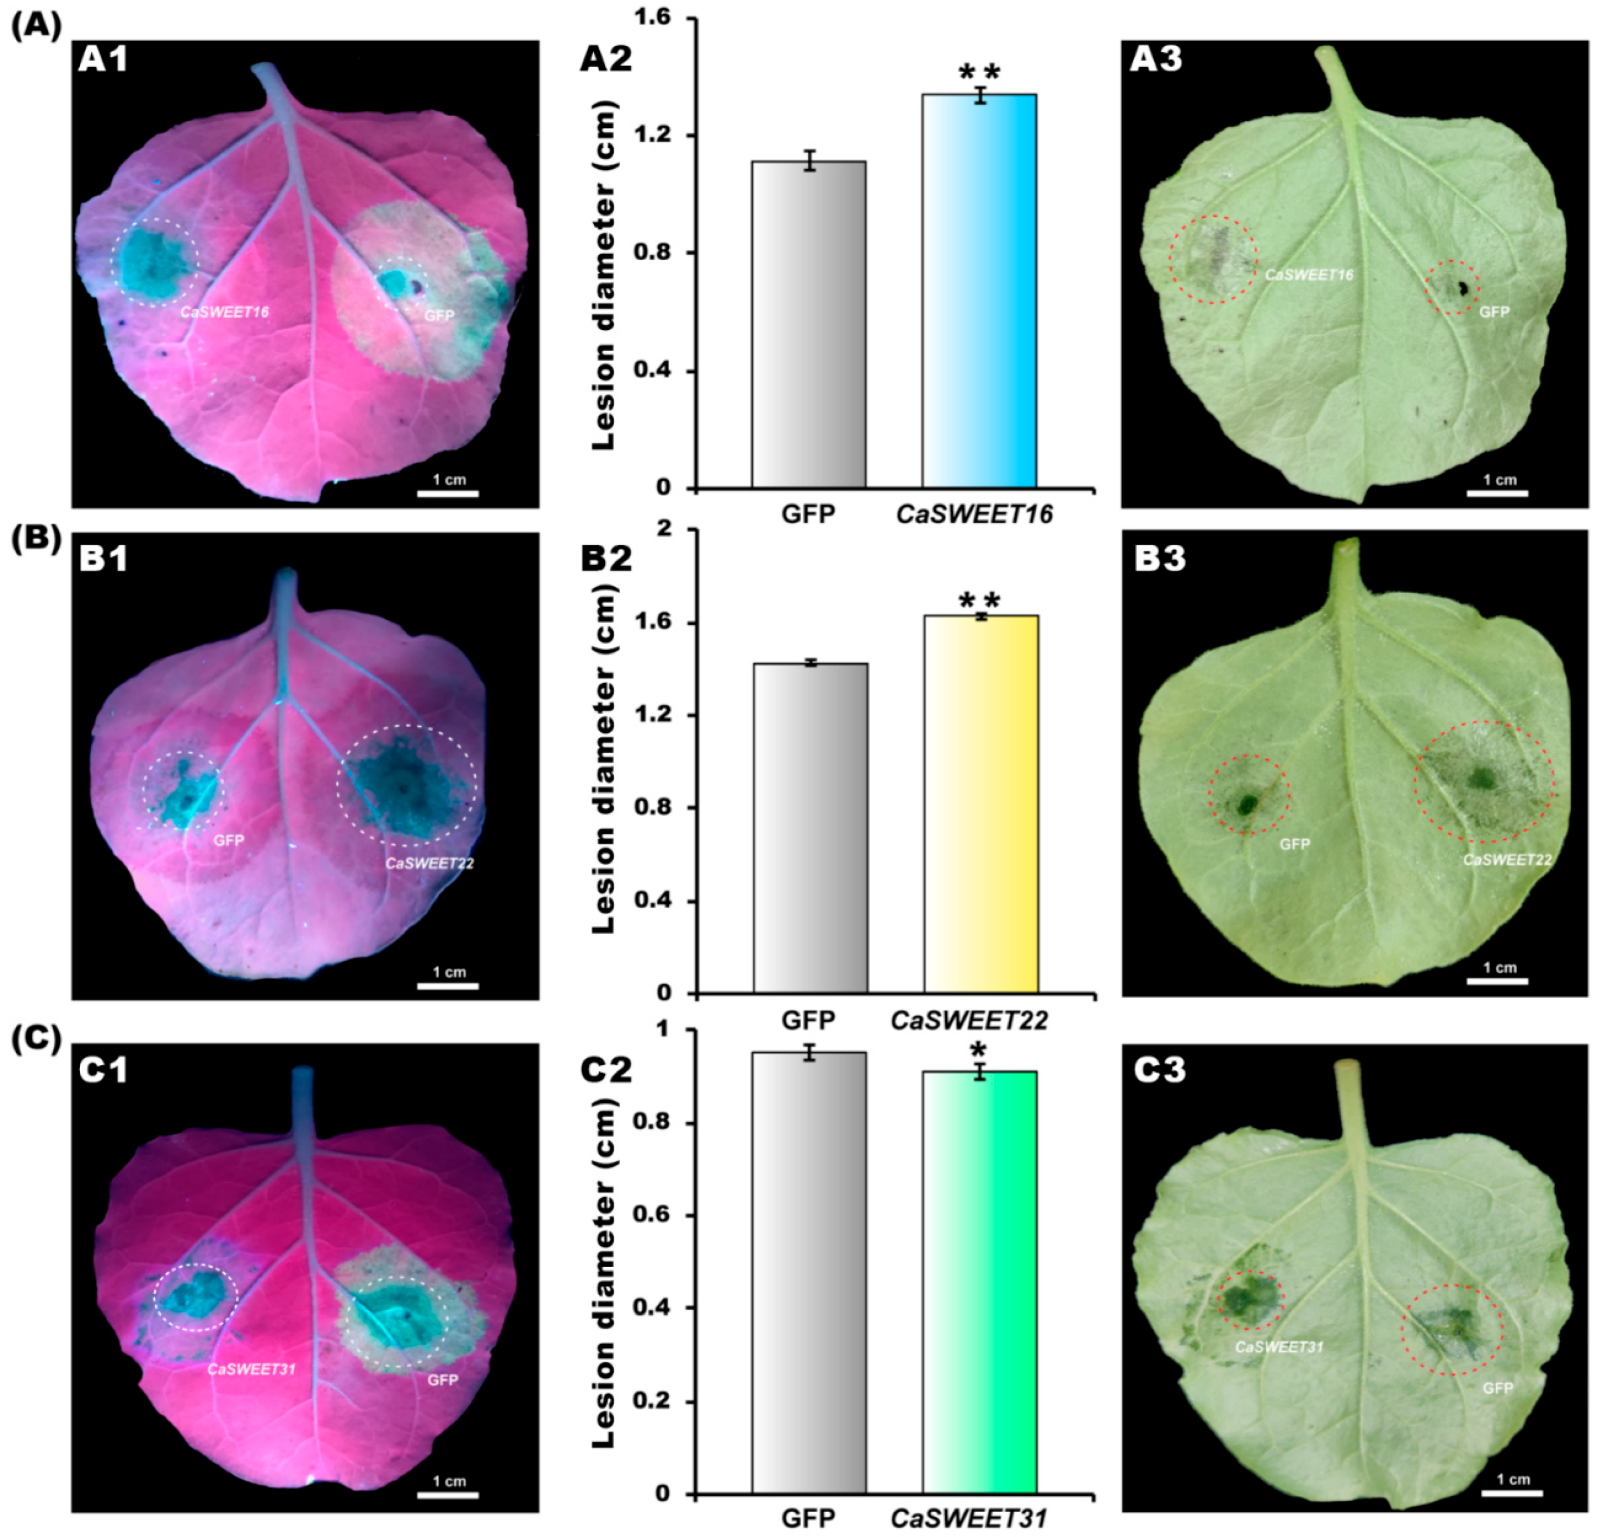
2.10. CaSWEET16/22 Promote and CaSWEET31 Represses Pathogen Colonization

In order to preliminarily elucidate the biological function of CaSWEET16/22/31 and investigate whether these genes are involved in plant pathogenesis, we employed an Agrobacterium-mediated strategy to transiently express these genes in N. benthamiana, followed by a hemi-biotrophic pathogen P. infestans infection. As indicated in Figure 10, compared to the GFP control, the overexpression of CaSWEET16/22 significantly enhanced pathogen colonization in N. benthamiana, resulting in 27.3% and 12.8% increases in lesion diameter, respectively; conversely, the overexpression of CaSWEET31 suppressed pathogen colonization, leading to a 2.1% reduction in lesion diameter.

3. Discussion

Peppers are a vegetable crop widely cultivated worldwide, and they have important economic value. The annual planting area accounts for 8% to 10% of the total planting area of all vegetables in China, with an output value of approximately CNY 250 billion [22]. In the production process, peppers are highly susceptible to various abiotic and biotic stresses, such as cold damage, drought, inadequate light, pests, and diseases [4]. The SWEET family members play a crucial role in plant growth and development, as well as in response to biotic and abiotic stresses [23]. Therefore, the comprehensive identification and analysis of pepper SWEET gene and revealing its expression characteristic can lay the foundation for studying the stress response function of CaSWEETs.
In this study, 33 CaSWEET family members were identified from the C. annuum Zunla-1 genome. These proteins’ encoded protein lengths vary widely from 135 to 829 aa, and they are relatively long compared to those of other species. For example, in S. lycopersicum (SlSWEETs), the length ranges from 233 aa (SlSWEET6a) to 308 aa (SlSWEET1d) [7]; in Glycine max (L.) Merr (GmSWEETs), the length ranges from 155 aa (GmSWEET3) to 308 aa (GmSWEET2) [24]; in Cucumis sativus L. (CsSWEETs), the length ranges from 228 aa (CsSWEET17b) to 295 aa (CsSWEET12b/17a) [19]. The Ka/Ks ratio is widely used to represent the selection pressure and evolutionary rate of genes. A Ka/Ks ratio of 1 signifies neutral selection, a Ka/Ks ratio greater than 1 indicates accelerated positive selection, and a Ka/Ks ratio less than 1 represents purifying selection under functional constraints [25]. The Ka/Ks ratios of SWEET homologous gene pairs were calculated among different cultivated varieties of C. annuum Zunla-1, C. annuum cv.CM334, C. annuum glabriusculum, S. tuberosum, S. lycopersicum, and S. pimpinellifolium. The results reveal that out of the 115 homologous gene pairs, 114 pairs exhibited Ka/Ks ratios of less than 1, suggesting that SWEET genes are not only highly conserved in peppers but also in Solanaceae plants, and they have experienced strong purifying selection pressure during evolution. Experiencing strong purifying selection pressure during evolution means that the SWEET gene family possesses stable biological functions with a lower likelihood of undergoing mutations during evolution, which is crucial for the adaptability, survival ability, and genetic stability of organisms.
SWEETs play a crucial role in the growth and development of plant floral organs. For example, in Petunia axillaris subsp., the transcript levels of PaSUT1/3, PaSWEET1d/5a/9a/13c/14a increase with the maturity of the flower, reaching their maximum levels in fully opened flowers [26]; in A. thaliana, AtSWEET8/RPG1 is expressed in microsporocyte and tapetum, and the atsweet8 mutant exhibits pollen abortion and sterility [27]. Similarly, 23 CaSWEETs were expressed during the growth and development of the floral organs, which was much higher than in the leaves (14) and roots (10), implying that CaSWEETs may play a role in the growth and development of pepper floral organs.
Under stress conditions, plants maintain cellular osmotic balance and sustain normal growth by regulating the redistribution of soluble sugars within the plant [28]. Sugar transport proteins play a crucial role in regulating the redistribution of soluble sugars and are closely associated with the plant’s response to various stress conditions. For example, under drought stress, AtSWEET11/12, and AtSUC2 are significantly induced in leaves, while AtSUC2 and AtSWEET11-15 are upregulated in roots [29]. BnSWEET9-2/10-3/12/13-2/14 were upregulated in response to heat stress [30]. Under salt stress, the expression of MtSWEET1a/2b/7/9b/13 was upregulated, while the expression of MtSWEET2a/3c was downregulated [31]. In this study, the expressions of some CaSWEETs were induced to different degrees under five kinds of stresses, which indicates that CaSWEETs have vital function in the stress response.
MicroRNAs (miRNAs) are critical post-transcriptional regulators that play important roles in plant growth, development, and stress responses by cleaving mRNAs or inhibiting mRNA translation [32,33]. Li et al.’s study demonstrates that exogenous sugars can reduce the abundance of miR156, and photosynthesis can also lower the expression levels of miR156, which change can induce transitions in plant nutritional stages in A. thaliana [34]. In this study, the gene CaSWEET3/7/15 targeted by the miR156 family showed significant tissue specificity; among them, CaSWEET3 was only expressed in the leaf tissues, and CaSWEET7/15 were only expressed in the flowers and fruits. Therefore, we speculate that the miR156 family could also participate in the growth and development and regulate the transition of the nutritional stage by regulating the expression of CaSWEETs.
Pathogenic microorganisms primarily rely on infecting plant cells to obtain nutrients, particularly sugars, which support their growth and reproduction. However, this often comes at the expense of normal plant development [35]. Bacteria use the type III secretion system to secrete a series of effector proteins, including transcription activator-like effectors (TALEs), which enter the host cells and directly regulate the expressions of specific SWEETs [36]. In rice, infection by the fungus Rhizoctonia solani significantly enhances the expressions of OsSWEET11; ossweet11 mutant variants exhibit reduced susceptibility to R. solani, while the overexpression of OsSWEET11 leads to increased susceptibility of R. solani [37]. In cotton, the silencing of GhSWEET42 results in a decrease in the glucose content and enhances resistance to V Verticillium dahliae [38]. Interestingly, the overexpression of IbSWEET10 in cassava significantly reduces the sugar content and enhances resistance to Fusarium oxysporum, while silencing IbSWEET10 leads to increased susceptibility [39]. In this study, we found that CaSWEET16 and CaSWEET22 are susceptibility genes, and the overexpression of these genes promotes the colonization of pathogens. We speculate that during pathogen attack, various sugar signaling cascades are disrupted, and the overexpression of the CaSWEET16/22 genes produces many sugars that cannot be transported properly, thus providing a more favorable environment for pathogen growth [35]. Furthermore, we speculate that the overexpression of CaSWEET31 may decrease the sugar content in plants, thereby inhibiting the colonization of pathogenic microorganisms.

4. Materials and Methods

4.1. Identification of the SWEET Gene Family Members in Pepper

The C. annuum Zunla-1 reference genome file was download from the pepper genome database (http://www.hnivr.org/pepperhub/, accessed on 9 September 2023). The Hidden Markov Model (HMM) seed sequences of SWEET (PF03083) were downloaded from Pfam (http://pfam.xfam.org/, accessed on 9 September 2023). The local BLASTp was performed using HMM seed sequences of SWEET, protein sequences of 17 AtSWEET from A. thaliana (https://www.arabidopsis.org, accessed on 9 September 2023), 21 OsSWEET from O. sativa [40], and 29 SiSWEET from S. lycopersicum [7] to the database of pepper protein sequences (e-value < 1 × 10⁻¹⁰). The resulting candidate proteins were then validated using Pfam v35.0 (http://Pfam.xfam.org, accessed on 9 September 2023) and InterProScan v95.0 (http://www.ebi.ac.uk/InterProScan, accessed on 9 September 2023), with sequences lacking the SWEET domain (MtN3_slv) being excluded.

4.2. Phylogenetic Analysis of SWEET

The ClustalW2 neighbor-joining method (with replicated bootstraps set to 1000) was used to perform multiple sequence alignment (MSA) on the identified SWEET protein sequence. The Interactive Tree of Life (iTOL) tool (http://ITOL.embl.de, accessed on 9 September 2023) was used to map the phylogenetic evolutionary tree among SWEET family members in C. annuum, A. thaliana, O. sativa, and S. lycopersicum, and we analyzed their phylogenetic relationships [41].

4.3. Chromosomal Localization of CaSWEETs

The gene structure annotations of CaSWEET gene family members were extracted from genomic GFF3 files. The start and end location information about CaSWEET in correspondence chromosomes were used to draw the chromosome distribution map using MapInspect software (version 1.0) [42].

4.4. Interspecific Evolutionary Analysis of SWEETs

The SWEET homologous genes among the reference genomes of C. annuum Zunla-1, C. annuum cv. CM334, C. annuum glabriusculum, Solanum tuberosum, S. lycopersicoides, and Solanum pimpinellifolium were identified through BLASTp (e-value < 10−10, similarity > 80%) [43]. TBtools (version 2.011) software was used to calculate the non-synonymous substitution rate (Ka), synonymous substitution rate (Ks), and Ka/Ks ratio between pairs of SWEET genes.

4.5. CaSWEETS Gene Structure and Conserved Motif Analysis

According to the GFF3 gene structure annotation information, we depicted the exon and intron structures of CaSWEETs using TBtools. Furthermore, conserved CaSWEET motifs were identified using MEME 5.5.3 (http://meme-suite.org/tools/meme, accessed on 10 September 2023) with the following parameters: each sequence can contain any number of non-overlapping motifs, up to 20 different motifs were allowed, and motif widths ranged from 6 to 50 amino acids [44]. TBtools was used to analyze the output results and generate a protein motif structure diagram.

4.6. Protein Characterization and Three-Dimensional Homology Modeling of CaSWEETs

The basic physicochemical properties of the CaSWEET proteins, including the number of amino acids (aa), molecular weight (MW), isoelectric point (pI), and grand average of hydropathy (GRAVY), were analyzed using the ExPASy Server10 (https://prosite.expasy.org/PS50011, accessed on 11 September 2023) [45]. The subcellular localization of the CaSWEET proteins was predicted using Plant-mPLoc (http://www.csbio.sjtu.edu.cn/bioinf/plant-multi, accessed on 11 September 2023) [46].

4.7. CaSWEET Promoter Cis-Acting Elements Analysis

To analyze the cis-acting elements in the promoter region of CaSWEETs, the upstream promoter sequences (1–1500 bp) were extracted from the genomic sequence and submitted to the PlantCARE website (http://bioinformatics.psb.ugent.be/webtools/plantcare/html/, accessed on 11 September 2023) for the identification of cis-elements in the promoter region [47]. The analysis results were organized and displayed using R software (version 4.3.1), with the “pheatmap” package.

4.8. CaSWEET Expression Pattern Analysis

The transcriptome data of pepper were download from the transcriptome module in the Pepper Informatics Hub (http://www.hnivr.org/pepperhub/, accessed on 12 September 2023) [48]. The expression levels of CaSWEETs were calculated using Cufflinks and normalized as transcripts per kilobase of exon model per million mapped reads (TPM) value [49]. The log2(TPM + 1) value was used to draw a heatmap using the R package “pheatmap” to show the expression patterns of CaSWEETs under different conditions [50].

4.9. Prediction of miRNA Targeting Relationships with CaSWEETs

To identify miRNAs targeting the transcripts of CaSWEET family members, mature miRNA sequences reported in the literature were collected for pepper [51]. The miRNA sequences and CaSWEET coding sequences (CDS) were then submitted to psRNA Target (https://www.zhaolab.org/psRNATarget/, accessed on 12 September 2023) for analysis of the miRNA–CaSWEET targeting relationships. Finally, the ggalluvia package in R was used to visualize the targeting relationship network [52].

4.10. Subcellular Localization Analysis of CaSWEET16/22/31

In order to determine the sub-cellular localization of CaSWEET16/22/31, the full-length gene was amplified using a 2 × Phanta Max Master Mix (Vazyme, Nanjing, China). The full-length primers for CaSWEET16/22/31 were designed by Primer Premier 5 (Supplementary Table S1). Subsequently, the amplified fragment was inserted into the XhoI pART-27 vector utilizing the ClonExpress II One Step Cloning Kit (Vazyme, Nanjing, China). The resulting fusion construct was then transformed into Agrobacterium tumefaciens (GV3101). After expanding the Agrobacterium cells, they were resuspended in MES buffer containing 200 μm acetosyringone and adjusted to an OD600 of 0.4. The mixture was left at room temperature for 1 h before being injected into N. benthamiana leaves, and the free GFP suspension was used as a negative control. [53]. After three days, the fluorescence of the leaves was visualized using confocal microscopy (TCS SP8, Heidelberg, Germany) with an excitation wavelength of 488 nm [33].

4.11. Pathogen Inoculation Assay

After a 2-day period of overexpression, the detached leaves were inoculated with zoospores of Phytophthora. infestans (88069), following the protocols described by Yin et al. study [54]. Subsequently, after 5 days of inoculation, the maximum and minimum diameters of the lesions were measured by a caliper, and the average values were calculated. Then, they were visualized using a handheld long-wavelength UV light (UVP BLAK-RAYB-100AP LAMP, Analytic Jena, Jena, Germany). Each treatment contained at least 50 leaves.

5. Conclusions

In summary, a total of 33 CaSWEET genes were identified in this study, which are unevenly distributed on 10 chromosomes. The CaSWEET genes exhibit high conservation among pepper varieties and Solanaceae species, undergoing strong purifying selection pressure throughout the course of evolution. Meanwhile, the overexpression of CaSWEET16/22 genes in N. benthamiana could promote the colonization of pathogens, and the overexpression of CaSWEET31 enhances its resistance. This study lays the foundation for a comprehensive understanding of the CaSWEET gene family and provides a basis for further elucidating the functions of pepper CaSWEET genes under stress conditions.

Supplementary Materials

The following supporting information can be downloaded at: https://www.mdpi.com/article/10.3390/ijms242417408/s1.

Author Contributions

Conceptualization, J.Y., F.W. and M.Y.; data curation, S.H., Y.L. and S.G.; formal analysis, X.H., S.H. and Y.Z.; funding acquisition, J.Y., F.W. and M.Y.; investigation, Y.Z. and Y.L.; methodology, J.Y., F.W. and M.Y.; project administration, J.Y., F.W. and M.Y.; resources, S.G.; software, X.H., S.H., Y.Z. and Y.L.; supervision, J.Y.; validation, X.H. and S.G.; visualization, F.W. and M.Y.; writing—original draft, X.H. and S.H.; writing—review and editing, X.H., S.H., Y.Z., Y.L. and S.G. All authors have read and agreed to the published version of the manuscript.

Funding

This research was funded by the National High-Technology Research and Development Program of China (2021YFD1600300-4-2), the Key Research and Development Program of Hubei Province (2022BBA0066, 2022BBA0060), the Key Research and Development Program of Hubei Province (2023BBB044), the Major Project of Hubei Hongshan Laboratory (2022hszd009), the Postdoctoral Innovation Practice Positions of Hubei Province, and the High-Quality Seed Industry Development Program of Hubei Province and China Agriculture Research System (CARS-23-G28).

Data Availability Statement

All datasets supporting the conclusions of this article are included within the article. The genome data and sequences of CaSWEET genes used in the current study are available in the Solanaceae Genomics Network (https://solgenomics.net/ftp/genomes/Capsicum_annuum/C.annuum_zunla/assemblies/, accessed on 8 October 2023). The datasets generated and analyzed during the current study are available from the corresponding author upon reasonable request.

Conflicts of Interest

The authors declare no conflict of interest. The funders had no role in the design of the study; in the collection, analyses, or interpretation of data; in the writing of the manuscript, or in the decision to publish the results.

References

  1. Arora, H.; Sharma, A.; Sharma, S.; Haron, F.F.; Gafur, A.; Sayyed, R.Z.; Datta, R. Pythium damping-off and root rot of Capsicum annuum L.: Impacts, diagnosis, and management. Microorganisms 2021, 9, 823. [Google Scholar] [CrossRef] [PubMed]
  2. Meng, Q. Analysis of Production Cost and Income of Pepper in Main Production Areas in China—Based on the Investigation of Five Provinces Such as Guizhou and Hunan; Agricultural University of Hebei: Baoding, China, 2018. [Google Scholar]
  3. Guo, M.; Liu, J.H.; Lu, J.P.; Zhai, Y.F.; Wang, H.; Gong, Z.H.; Wang, S.B.; Lu, M.H. Genome-wide analysis of the CaHsp20 gene family in pepper: Comprehensive sequence and expression profile analysis under heat stress. Front. Plant Sci. 2015, 6, 806. [Google Scholar] [CrossRef] [PubMed]
  4. Han, X.W.; Han, S.; Zhu, Y.X.; Wang, F.; Gao, S.H.; Liu, Y.Q.; Yin, J.L. Genome-wide identification and expression analysis of pepper DUF966 gene family. J. South. Agric. 2023, 54, 1341–1351. [Google Scholar]
  5. Huang, C.; Li, X.; Nan, N.; Li, S.Y.; Wang, J.D. Research progress of plant SWEET gene family. Chin. Agric. Sci. Bull. 2022, 38, 17–26. [Google Scholar]
  6. Yuan, M.; Wang, S.P. Rice MtN3/saliva/SWEET family genes and their homologs in cellular organisms. Mol. Plant 2013, 6, 665–674. [Google Scholar] [CrossRef] [PubMed]
  7. Feng, C.Y.; Han, J.X.; Han, X.X.; Jiang, J. Genome-wide identification; phylogeny, and expression analysis of the SWEET gene family in tomato. Gene 2015, 573, 261–272. [Google Scholar] [CrossRef]
  8. Feng, L.; Frommer, W.B. Structure and function of SemiSWEET and SWEET sugar transporters. Trends Biochem. Sci. 2015, 40, 480–486. [Google Scholar] [CrossRef]
  9. Feng, L.; Frommer, W.B. Evolution of transporters: The relationship of SWEETs, PQ-loop, and PnuC transporters. Trends Biochem. Sci. 2016, 41, 118–119. [Google Scholar] [CrossRef]
  10. Hu, L.P.; Zhang, F.; Xu, H.; Liu, G.M.; Wang, Y.Q.; He, H.J. Research advances in the structure, function and regulation of SWEET gene family in plants. Biotechnol. Bull. 2017, 33, 27–37. [Google Scholar]
  11. Chen, L.Q.; Qu, X.Q.; Hou, B.H.; Sosso, D.; Osorio, S.; Fernie, A.R.; Frommer, W.B. Sucrose efflux mediated by SWEET proteins as a key step for phloem transport. Science 2012, 335, 207–211. [Google Scholar] [CrossRef]
  12. Chu, Z.H.; Yuan, M.; Yao, J.L.; Ge, X.J.; Yuan, B.; Xu, C.G.; Li, X.H.; Fu, B.Y.; Li, Z.K.; Bennetzen, J.L.; et al. Promoter mutations of an essential gene for pollen development result in disease resistance in rice. Genes Dev. 2006, 20, 1250–1255. [Google Scholar] [CrossRef] [PubMed]
  13. Kang, X.R.; Huang, S.; Feng, Y.M.; Fu, R.M.; Tang, F.J.; Zheng, L.Y.; Li, P.J.; Chao, N.; Liu, L. SWEET transporters and their potential roles in response to abiotic and biotic stresses in mulberry. Beverage Plant Res. 2023, 3, 6. [Google Scholar] [CrossRef]
  14. Klemens, P.A.W.; Patzke, K.; Deitmer, J.; Spinner, L.; Le Hir, R.; Bellini, C.; Bedu, M.; Chardon, F.; Krapp, A.; Neuhaus, H.E. Overexpression of the vacuolar sugar carrier AtSWEET16 modifies germination, growth, and stress tolerance in Arabidopsis. Plant Physiol. 2013, 163, 1338–1352. [Google Scholar] [CrossRef] [PubMed]
  15. Xuan, C.Q.; Lan, G.P.; Si, F.F.; Zeng, Z.L.; Wang, C.X.; Yadav, V.; Wei, C.H.; Zhang, X. Systematic genome-wide study and expression analysis of SWEET gene family: Sugar transporter family contributes to biotic and abiotic stimuli in watermelon. Int. J. Mol. Sci. 2021, 22, 8407. [Google Scholar] [CrossRef] [PubMed]
  16. Yang, B.; Sugio, A.; White, F.F. Os8N3 is a host disease-susceptibility gene for bacterial blight of rice. Proc. Natl. Acad. Sci. USA 2006, 103, 10503–10508. [Google Scholar] [CrossRef] [PubMed]
  17. Gao, Y.; Wang, Z.Y.; Kumar, V.; Xu, X.F.; Yuan, D.P.; Zhu, X.F.; Li, T.Y.; Jia, B.L.; Xuan, Y.H. Genome-wide identification of the SWEET gene family in wheat. Gene 2018, 642, 284–292. [Google Scholar] [CrossRef] [PubMed]
  18. Cohn, M.; Bart, R.S.; Shybut, M.; Dahlbeck, D.; Gomez, M.; Morbitzer, R.; Hou, B.-H.; Frommer, W.B.; Lahaye, T.; Staskawicz, B.J. Xanthomonas axonopodis virulence is promoted by a transcription activator-like effector-mediated induction of a SWEET sugar transporter in cassava. Mol. Plant-Microbe Interact. MPMI 2014, 27, 1186–1198. [Google Scholar] [CrossRef]
  19. Hu, L.P.; Zhang, F.; Song, S.H.; Tang, X.W.; Xu, H.; Liu, G.M.; Wang, Y.Q.; He, H.J. Genome-wide identification; characterization, and expression analysis of the SWEET gene family in cucumber. J. Integr. Agric. 2017, 16, 1486–1501. [Google Scholar] [CrossRef]
  20. Zhao, L.J.; Yao, J.B.; Chen, W.; Li, Y.; Lü, Y.J.; Guo, Y.; Wang, J.Y.; Yuan, L.; Liu, Z.Y.; Zhang, Y.S. A genome-wide analysis of SWEET gene family in cotton and their expressions under different stresses. J. Cotton Res. 2018, 1, 7. [Google Scholar] [CrossRef]
  21. Liu, J.H.; Peng, T.; Dai, W.S. Critical cis-Acting Elements and Interacting Transcription Factors: Key Players Associated with Abiotic Stress Responses in Plants. Plant Mol. Biol. Report. 2014, 32, 303–317. [Google Scholar] [CrossRef]
  22. Zou, X.X.; Hu, B.W.; Xiong, C.; Dai, X.Z.; Liu, F.; Ou, L.J.; Yang, B.Z.; Liu, Z.B.; Suo, H.; Xu, H.; et al. Review and prospects of pepper breeding for the past 60 years in China. Acta Hortic. Sin. 2022, 49, 2099–2118. [Google Scholar]
  23. Du, Y.L.; Li, W.J.; Geng, J.; Li, S.Q.; Zhang, W.J.; Liu, X.X.; Hu, M.H.; Zhang, Z.N.; Fan, Y.R.; Yuan, X.K.; et al. Genome-wide identification of the SWEET gene family in Phaseolus vulgaris L. and their patterns of expression under abiotic stress. J. Plant Interact. 2022, 17, 390–403. [Google Scholar] [CrossRef]
  24. Patil, G.; Valliyodan, B.; Deshmukh, R.; Prince, S.; Nicander, B.; Zhao, M.; Sonah, H.; Song, L.; Lin, L.; Chaudhary, J.; et al. Soybean (Glycine max) SWEET gene family: Insights through comparative genomics, transcriptome profiling and whole genome re-sequence analysis. BMC Genom. 2015, 16, 520. [Google Scholar] [CrossRef]
  25. Li, J.; Zhang, Z.; Vang, S.; Yu, J.; Wong, G.K.-S.; Wang, J. Correlation between Ka/Ks and Ks is related to substitution model and evolutionary lineage. J. Mol. Evol. 2009, 68, 414–423. [Google Scholar] [CrossRef] [PubMed]
  26. Iftikhar, J.; Lyu, M.; Liu, Z.; Mehmood, N.; Munir, N.; Ahmed, M.A.A.; Batool, W.; Aslam, M.M.; Yuan, Y.; Wu, B. Sugar and hormone dynamics and the expression profiles of SUT/SUC and SWEET dugar transporters during flower development in Petunia axillaris. Plants 2020, 9, 1770. [Google Scholar] [CrossRef] [PubMed]
  27. Guan, Y.F.; Huang, X.Y.; Zhu, J.; Gao, J.F.; Zhang, H.X.; Yang, Z.N. RUPTURED POLLEN GRAIN1, a member of the MtN3/saliva gene family, is crucial for exine pattern formation and cell integrity of microspores in Arabidopsis. Plant Physiol. 2008, 147, 852–863. [Google Scholar] [CrossRef] [PubMed]
  28. Yamada, K.; Osakabe, Y.; Mizoi, J.; Nakashima, K.; Fujita, Y.; Shinozaki, K.; Yamaguchi-Shinozaki, K. Functional analysis of an Arabidopsis thaliana abiotic stress-inducible facilitated diffusion transporter for monosaccharides. J. Biol. Chem. 2010, 285, 1138–1146. [Google Scholar] [CrossRef] [PubMed]
  29. Durand, M.; Porcheron, B.; Hennion, N.; Maurousset, L.; Lemoine, R.; Pourtau, N. Water Deficit Enhances C Export to the Roots in Arabidopsis thaliana Plants with Contribution of Sucrose Transporters in Both Shoot and Roots. Plant Physiol. 2016, 170, 1460–1479. [Google Scholar] [CrossRef]
  30. Jian, H.J.; Lu, K.; Yang, B.; Wang, T.Y.; Zhang, L.; Zhang, A.X.; Wang, J.; Liu, L.Z.; Qu, C.M.; Li, J.N. Genome-wide analysis and expression profiling of the SUC and SWEET gene families of sucrose transporters in oilseed rape (Brassica napus L.). Front. Plant Sci. 2016, 7, 1464. [Google Scholar] [CrossRef]
  31. Hu, B.; Wu, H.; Huang, W.F.; Song, J.B.; Zhou, Y.; Lin, Y.J. SWEET gene family in medicago truncatula: Genome-wide identification, expression and substrate specificity analysis. Plants 2019, 8, 338. [Google Scholar] [CrossRef]
  32. Yin, J.L.; Liu, M.Y.; Ma, D.F.; Wu, J.W.; Li, S.L.; Zhu, Y.X.; Han, B. Identification of circular RNAs and their targets during tomato fruit ripening. Postharvest Biol. Technol. 2018, 136, 90–98. [Google Scholar] [CrossRef]
  33. Köhler, R.H. GFP for in vivo imaging of subcellular structures in plant cells. Trends Plant Sci. 1998, 3, 317–320. [Google Scholar] [CrossRef]
  34. Yang, L.; Xu, M.; Koo, Y.; He, J.; Poethig, R.S. Sugar promotes vegetative phase change in Arabidopsis thaliana by repressing the expression of MIR156A and MIR156C. eLife 2013, 2, e00260. [Google Scholar] [CrossRef] [PubMed]
  35. Shen, C.; Li, X. Advances in the study of plant SWEET gene family for disease development. Jiangsu J. Agric. Sci. 2022, 38, 1411–1420. [Google Scholar]
  36. Chong, J.; Piron, M.-C.; Meyer, S.; Merdinoglu, D.; Bertsch, C.; Mestre, P. The SWEET family of sugar transporters in grapevine: VvSWEET4 is involved in the interaction with Botrytis cinerea. J. Exp. Bot. 2014, 65, 6589–6601. [Google Scholar] [CrossRef]
  37. Gao, Y.; Zhang, C.; Han, X.; Wang, Z.Y.; Ma, L.; Yuan, D.P.; Wu, J.N.; Zhu, X.F.; Liu, J.M.; Li, D.P.; et al. Inhibition of OsSWEET11 function in mesophyll cells improves resistance of rice to sheath blight disease. Mol. Plant Pathol. 2018, 19, 2149–2161. [Google Scholar] [CrossRef] [PubMed]
  38. Sun, M.X.; Zhang, Z.Q.; Ren, Z.Y.; Wang, X.X.; Sun, W.J.; Feng, H.J.; Zhao, J.J.; Zhang, F.; Li, W.; Ma, X.F.; et al. The GhSWEET42 glucose transporter participates in Verticillium dahliae infection in cotton. Front. Plant Sci. 2021, 12, 690754. [Google Scholar] [CrossRef]
  39. Li, Y.; Wang, Y.N.; Zhang, H.; Zhang, Q.; Zhai, H.; Liu, Q.C.; He, S.Z. The plasma membrane-localized sucrose tansporter IbSWEET10 contributes to the resistance of Sweet potato to Fusarium oxysporum. Front. Plant Sci. 2017, 8, 197. [Google Scholar]
  40. Yuan, M.; Zhao, J.W.; Huang, R.Y.; Li, X.H.; Xiao, J.H.; Wang, S.P. Rice MtN3/saliva/SWEET gene family: Evolution, expression profiling, and sugar transport. J. Integr. Plant Biol. 2014, 56, 559–570. [Google Scholar] [CrossRef]
  41. Li, Y.T.; Liu, X.; Xiao, Y.X.; Wen, Y.; Li, K.K.; Ma, Z.L.; Yang, L.J.; Zhu, Y.X.; Yin, J.L. Genome-wide characterization and function analysis uncovered roles of wheat LIMs in responding to adverse stresses and TaLIM8-4D function as a susceptible gene. Plant Genome 2022, 15, e20246. [Google Scholar] [CrossRef]
  42. Chem, Y.K.; Li, C.H.; Zhang, B.; Yi, J.; Kong, C.Y.; Lei, C.X.; Gong, M. The Role of the Late Embryogenesis-Abundant (LEA) Protein Family in Development and the Abiotic Stress Response: A Comprehensive Expression Analysis of Potato (Solanum tuberosum). Genes 2019, 10, 148. [Google Scholar] [CrossRef] [PubMed]
  43. Gish, W.; States, D.J. Identification of protein coding regions by database similarity search. Nat. Genet. 1993, 3, 266–272. [Google Scholar] [CrossRef]
  44. Bailey, T.L.; Williams, N.; Misleh, C.; Li, W.W. MEME: Discovering and analyzing DNA and protein sequence motifs. Nucleic Acids Res. 2006, 34, W369–W373. [Google Scholar] [CrossRef] [PubMed]
  45. Gasteiger, E.; Hoogland, C.; Gattiker, A.; Duvaud, S.E.; Wilkins, M.R.; Appel, R.D.; Bairoch, A. Protein identification and analysis tools on the ExPASy server. In The Proteomics Protocols Handbook; Humana Press: Totowa, NJ, USA, 2005; pp. 571–607. [Google Scholar]
  46. Chou, K.-C.; Shen, H.-B. Cell-PLoc: A package of Web servers for predicting subcellular localization of proteins in various organisms. Nat. Protoc. 2008, 3, 153–162. [Google Scholar] [CrossRef] [PubMed]
  47. Lescot, M.; Déhais, P.; Thijs, G.; Marchal, K.; Moreau, Y.; Van de Peer, Y.; Rouzé, P.; Rombauts, S. PlantCARE, a database of plant cis-acting regulatory elements and a portal to tools for in silico analysis of promoter sequences. Nucleic Acids Res. 2002, 30, 325–327. [Google Scholar] [CrossRef] [PubMed]
  48. Liu, F.; Yu, H.Y.; Deng, Y.G.; Zheng, J.Y.; Liu, M.L.; Ou, L.J.; Yang, B.Z. PepperHub, a Pepper Informatics Hub for the chili pepper research community. Mol. Plant 2017, 10, 1129–1132. [Google Scholar] [CrossRef] [PubMed]
  49. Ghosh, S.; Chan, C.-K.K. Analysis of RNA-Seq Data Using TopHat and Cufflinks. In Methods in Molecular Biology; Humana Press: Clifton, NJ, USA, 2016; Volume 1374, pp. 339–361. [Google Scholar]
  50. Yuan, Y.; Yin, X.H.; Han, X.W.; Han, S.; Li, Y.T.; Ma, D.F.; Fang, Z.W.; Yin, J.L.; Gong, S.J. Genome-wide identification, characterization and expression analysis of the TaDUF724 gene family in wheat (Triticum aestivum). Int. J. Mol. Sci. 2023, 24, 14248. [Google Scholar] [CrossRef] [PubMed]
  51. Yin, J.L.; Yan, J.H.; Hou, L.; Jiang, L.L.; Xian, W.R.; Guo, Q.Y. Identification and functional deciphering suggested the regulatory roles of long intergenic ncRNAs (lincRNAs) in increasing grafting pepper resistance to Phytophthora capsici. BMC Genom. 2021, 22, 868. [Google Scholar] [CrossRef]
  52. Yin, X.H.; Yuan, Y.; Han, X.W.; Han, S.; Li, Y.T.; Ma, D.F.; Fang, Z.W.; Gong, S.J.; Yin, J.L. Genome-wide identification; characterization, and expression profiling of TaDUF668 gene family in Triticum aestivum. Agronomy 2023, 13, 2178. [Google Scholar] [CrossRef]
  53. Dang, F.F.; Wang, Y.; She, J.J.; Lei, Y.F.; Liu, Z.Q.; Eulgem, T.; Lai, Y.; Lin, J.; Yu, L.; Lei, D.; et al. Overexpression of CaWRKY27, a subgroup IIe WRKY transcription factor of Capsicum annuum, positively regulates tobacco resistance to Ralstonia solanacearum infection. Physiol. Plantarum. 2014, 150, 397–411. [Google Scholar] [CrossRef]
  54. Yin, J.L.; Gu, B.; Huang, G.Y.; Tian, Y.E.; Quan, J.L.; Lindqvist-Kreuze, H.; Shan, W.X. Conserved RXLR effector genes of Phytophthora infestans expressed at the early stage of potato infection are suppressive to host defense. Front. Plant Sci. 2017, 8, 2155. [Google Scholar] [CrossRef]
Figure 1. Phylogenetic tree of C. annuum, A. thaliana, S. lycopersicoides, O. sativa SWEETs. Different colored circles represent different species.
Ijms 24 17408 g001
Figure 2. Chromosome distribution of CaSWEETs. Chr stands for chromosome. The scale indicates the chromosome length (Mb).
Ijms 24 17408 g002
Figure 3. Ka and Ks scatter diagram of homolog SWEET gene pairs among pepper and other Solanaceae species. The x-axis represents Ks, and the y-axis represents Ka.
Ijms 24 17408 g003
Figure 4. Gene structure and conserved motif analysis. (A) Phylogenetic relationships. (B) Exon–intron structures. The green boxes represent the coding sequences (CDS), and the black lines represent the introns. (C) Conserved motif analysis. Different colors represent different motifs.
Ijms 24 17408 g004
Figure 5. CaSWEET protein-predicted 3D models.
Ijms 24 17408 g005
Figure 6. Analysis of cis-acting elements in CaSWEET promoters. Red squares indicate a high number of cis-elements, and white squares indicate a low number of cis-elements.
Ijms 24 17408 g006
Figure 7. CaSWEET expression patterns under plant hormones, growth, and development, as well as abiotic stress treatments. Different colors in the legend represent different log2(TPM + 1) values, red represents the largest log2(TPM + 1) value, and blue represents the smallest value. CK: control (no further treatment); L: leaf; R: root; F: flower bud (cm is the length of the flower bud); P: perianth when flowers are fully open; O: ovary when the flower is fully open; STA: anther when the flower is fully open; FST: fruit; S: seed; T: placentation; ST: young seeds and placentation.
Ijms 24 17408 g007
Figure 8. Sankey diagram for the relationships of miRNA targeting CaSWEETs transcripts. The three columns represent miRNA, mRNA, and the inhibition effect.
Ijms 24 17408 g008
Figure 9. Subcellular location analysis of (B) CaSWEET16, (C) CaSWEET22, (D) CaSWEET31 was performed in N. benthamiana leaf. The free GFP was the control (A).
Ijms 24 17408 g009
Figure 10. Influence of (A1,A3) CaSWEET16, (B1,B3) CaSWEET22, and (C1,C2) CaSWEET31 on disease resistance of N. benthamianaleaves. (A2,B2,C2) Statistical analysis of lesion diameter. Error bar represents standard deviation (SD). * Represents the significant level at p < 0.05, and ** represents the significant level at p < 0.05.
Ijms 24 17408 g010
Table 1. Protein characterization of CaSWEETs.
NameGene IDLen.MW.Pi.Ins.GRAVYSub.
Capana00g002536CaSWEET126429.759.4436.890.872Cell membrane
Capana00g002537CaSWEET229633.359.3729.380.604Cell membrane
Capana00g002538CaSWEET330033.499.2831.030.691Cell membrane
Capana00g002539CaSWEET430133.489.1831.450.704Cell membrane
Capana00g002540CaSWEET529833.558.9941.640.635Cell membrane
Chloroplast
Capana00g002541CaSWEET629533.398.9135.610.744Cell membrane
Capana01g000092CaSWEET725428.309.6637.250.714Cell membrane
Capana02g000800CaSWEET822725.489.4132.430.47Cell membrane
Capana02g001619CaSWEET982993.218.7246.16−0.227Nucleus
Capana02g003486CaSWEET1062268.215.4134.450.239Chloroplast
Capana03g000977CaSWEET1123626.769.4735.850.765Cell membrane
Capana03g001611CaSWEET1229833.259.4339.320.7Cell membrane
Capana03g001663CaSWEET1324527.418.8831.380.558Cell membrane
Capana03g002056CaSWEET1422425.328.4234.050.36Cell membrane
Capana03g003556CaSWEET1528632.917.6537.240.416Cell membrane
Chloroplast
Capana04g001408CaSWEET1622525.149.3836.980.643Cell membrane
Chloroplast
Peroxisome
Capana04g001409CaSWEET1715016.928.4737.620.515Chloroplast
Capana04g001457CaSWEET1824026.419.5639.850.411Cell membrane
Chloroplast
Golgi apparatus
Peroxisome
Capana04g001460CaSWEET1922124.059.7127.530.654Cell membrane
Capana04g002805CaSWEET2022024.819.4853.110.841Cell membrane
Capana05g002066CaSWEET2114615.978.9638.110.838Cell membrane
Chloroplast
Golgi apparatus
Peroxisome
Capana06g000792CaSWEET2228231.919.2539.170.662Cell membrane
Capana06g000793CaSWEET2329032.918.0845.410.685Cell membrane
Chloroplast
Capana06g000794CaSWEET2422225.388.7734.710.69Cell membrane
Chloroplast
Capana06g000962CaSWEET2519521.957.7833.690.835Cell membrane
Chloroplast
Capana06g001685CaSWEET2623926.759.2641.520.535Cell membrane
Capana07g000747CaSWEET2713515.599.344.940.015Chloroplast
Capana08g001545CaSWEET2815617.229.4238.590.585Cell membrane
Capana08g001547CaSWEET2924026.626.7238.430.604Cell membrane
Capana08g001548CaSWEET3029632.569.6732.290.319Cell membrane
Chloroplast
Capana11g001074CaSWEET3130433.967.6440.670.649Cell membrane
Capana12g001058CaSWEET3217820.169.8746.670.942Cell membrane
Capana12g001557CaSWEET3313815.668.8336.890.162Cell membrane
Len: length of amino acid (aa); MW: molecular weight (kDa); pI: isoelectric point; Ins: instability index; GRAVY: grand average of hydropathicity; Sub: subcellular localization.
Disclaimer/Publisher’s Note: The statements, opinions and data contained in all publications are solely those of the individual author(s) and contributor(s) and not of MDPI and/or the editor(s). MDPI and/or the editor(s) disclaim responsibility for any injury to people or property resulting from any ideas, methods, instructions or products referred to in the content.

