Article

A Comprehensive Genome-Wide Association Study of Carotenoid and Capsaicinoid Contents in Capsicum chinense Germplasm

National Agrobiodiversity Center, National Institute of Agricultural Sciences, Rural Development Administration, Jeonju 54874, Republic of Korea
*
Author to whom correspondence should be addressed.
These authors contributed equally to this work.
Int. J. Mol. Sci. 2023, 24(18), 13885; https://doi.org/10.3390/ijms241813885
Submission received: 31 July 2023 / Revised: 4 September 2023 / Accepted: 7 September 2023 / Published: 9 September 2023
(This article belongs to the Special Issue Vegetable Genetics and Genomics 2.0)

Abstract

:
Pepper is a highly important vegetable globally, both economically and nutritionally. However, to efficiently select and identify genetic resources for pepper breeding programs, it is crucial to understand the association between important traits and genetic factors. In this study, we investigated the genetic basis of carotenoid and capsaicinoid content in 160 Capsicum chinense germplasms. The study observed significant variability in carotenoid and capsaicinoid content among the germplasms. Correlation analysis revealed a strong positive correlation between violaxanthin and antheraxanthin. In contrast, capsaicin and dihydrocapsaicin displayed negative correlations with individual carotenoids but exhibited a strong positive correlation between the two compounds (r = 0.90 ***). Genotyping-by-sequencing (GBS) was performed on 160 genotypes of pepper germplasm, which identified 47,810 high-quality SNPs. A comprehensive genome-wide association analysis was performed using these SNPs to identify SNPs associated with carotenoids and capsaicinoids, revealing 193 SNPs that exhibited significant associations. Specifically, 4 SNPs were associated with violaxanthin, 2 with antheraxanthin, 86 with capsorubin, 5 with capsanthin, 63 with zeaxanthin, 3 with β-cryptoxanthin, and 2 with α-carotene. With further studies, the significantly associated SNPs identified in this study have the potential to be utilized for selecting pepper accessions with high carotenoid and capsaicinoid contents. Additionally, the genes associated with these significant SNPs will be used to understand their roles and involvement in the biosynthesis pathway of carotenoids and capsaicinoids. Understanding the function of these genes can provide insights into the molecular mechanisms underlying the production of these bioactive compounds in pepper. The findings of this study hold valuable implications for selecting pepper varieties with desirable traits and developing breeding programs aimed at enhancing the nutritional and medicinal properties of pepper.

1. Introduction

Pepper is a member of the nightshade (Solanaceae) family and the genus Capsicum. The genus Capsicum has approximately 35 species [1], five of which are domesticated and economically important: Capsicum annum L., Capsicum chinese Jacq., Capsicum frutescens L., Capsicum baccatum L., and Capsicum pubescens Ruiz and Pav. [2]. According to FAOSTAT [3] data from 2010 to 2021, the total production of pepper has shown a notable growth of approximately 20.28%. Within this period, green pepper production increased by 18.12%, while dry pepper production showed a significant growth of 36.43%. In the year 2021, global pepper production reached 41.13 million tons, with 36.89 million tons of fresh pepper and 4.84 million tons of dry pepper. Among the top producers in 2021, China led the world in fresh pepper production with 16.72 million tons, followed by Türkiye with 3.09 million tons and Indonesia with 2.75 million tons. In terms of dry pepper production, India emerged as the leading producer, contributing 2.05 million tons to the global market [3].
The pepper species are rich in bioactive compounds that possess a wide range of beneficial properties. These compounds are known for their potential analgesic, anti-obesity, cardioprotective, pharmacological, neurological, and dietary effects [4]. Furthermore, they exhibit significant antibiotic activity and have been found to lower serum cholesterol levels when consumed in moderate amounts as part of a regular diet [5,6,7]. Moreover, these compounds demonstrate anticarcinogenic, antifungal, antibacterial, antiviral, lipid degradation, antithrombotic, and anti-inflammatory activities [8]. Several studies, conducted both in vitro and in vivo, have demonstrated that C. chinense exhibits protective effects, including antioxidant and anticancer activity [9,10,11,12]. These effects suggest its potential for reducing or preventing chronic diseases [13]. The diverse array of bioactive compounds found in pepper highlights its value as an ingredient with various health benefits. Major bioactive compounds present in Capsicum species include carotenoids and capsaicinoids.
Carotenoids are bioactive compounds that contribute to the vibrant and diverse colors observed in pepper fruits [14,15]. Capsicum is known to have a high concentration of carotenoids, and the different colors of the peppers are due to their different carotenoid profiles [16]. The different colors can also affect the flavor of the peppers, with yellow, orange, and red peppers being sweeter than green peppers, and they may also be related to higher glucose content as they ripen [17]. The carotenoid composition of pepper predominantly includes capsorubin, capsanthin, β-carotene, lutein, β-cryptoxanthin, zeaxanthin, violaxanthin, and antheraxanthin [18]. The concentration of the bioactive compounds can be influenced by factors such as the amount of sunlight, soil, season, crop region, temperature changes, fruit variety, and maturity level [19,20,21]. Another important bioactive compound in pepper is capsaicinoids, which are alkaloid compounds responsible for the spiciness of chilies [22]. The two major capsaicinoids are capsaicin and dihydrocapsaicin, which comprise more than 90% of the total capsaicinoid content found in the fruit [23]. Capsaicin is a flavorless, odorless, and colorless compound present in varying amounts in different pepper varieties [24]. Capsaicinoids have significant biological activity and are relevant to various fields, including medicine, food science [25,26,27], and the defense industry [28] because of their ability to cause intense irritation and burning sensations in the eyes, nose, throat, and skin upon contact.
Molecular genetics plays a crucial role in crop improvement by utilizing molecular tools to identify DNA changes in individual plants. Among the genetic markers, single nucleotide polymorphisms (SNPs) have become the preferred choice and are extensively utilized in agricultural breeding programs [19]. To identify SNPs associated with traits of interest, genome-wide association studies (GWAS) offer a powerful approach. GWAS scans the entire genome of a population, testing for allele frequency differences in genetic variants between individuals who share common ancestry but exhibit phenotypic differences [29,30]. In major crops such as maize, rice, barley, tomato, wheat, sorghum, soybean, and watermelon species, GWAS using SNPs derived from genotyping-by-sequencing (GBS) has been widely employed [31,32,33,34,35]. This methodology has proved valuable in unraveling the genetic basis of various traits and aiding crop breeding efforts.
This study aimed to identify SNPs associated with carotenoid and capsaicinoid contents in the pepper germplasm of Capsicum chinense, a highly genetically diverse pepper species. The results of this study have the potential to significantly contribute to the breeding of improved pepper varieties with enhanced nutritional and medicinal properties. The use of SNP markers can accelerate the breeding process and facilitate the selection of plants with desirable traits, while the underlying genes can provide insights into the biochemical pathways involved in the biosynthesis of bioactive compounds in pepper. Further research can be conducted to explore the potential applications of these findings in pepper genomics and breeding.

2. Results

2.1. Carotenoids and Capsaicinoids Contents

The results of the descriptive analysis for ten bioactive traits (violaxanthin, antheraxanthin, capsorubin, capsanthin, zeaxanthin, β-cryptoxanthin, α-carotene, β-carotene, capsaicin, and dihydrocapsaicin) in a sample of 160 germplasms are summarized in Table 1. The table presents the mean, standard error, standard deviation, range, and count for each variable. The mean values for each variable are reported in mg/100 g units. Among the variables, capsaicin had the highest mean value of 1836.97 mg/100 g, indicating a relatively high concentration of capsaicin on average in the germplasms. On the other hand, β-cryptoxanthin had the lowest mean value of 8.37 mg/100 g. The range values indicate the difference between the highest and lowest values observed for each variable in the sample, also presented in mg/100 g units. Capsaicin exhibited the widest range of values, ranging from 0 to 11,632.93 mg/100 g, indicating significant variability among the germplasms in terms of capsaicin content. In contrast, β-cryptoxanthin had the narrowest range, spanning from 0 to 81.81 mg/100 g. The substantial range values observed for carotenoids and capsaicinoids further indicate considerable variability among the germplasms for these particular traits. This variation could have implications for breeding programs and genetic studies aiming to develop pepper varieties with the desired levels of carotenoids and capsaicinoids.

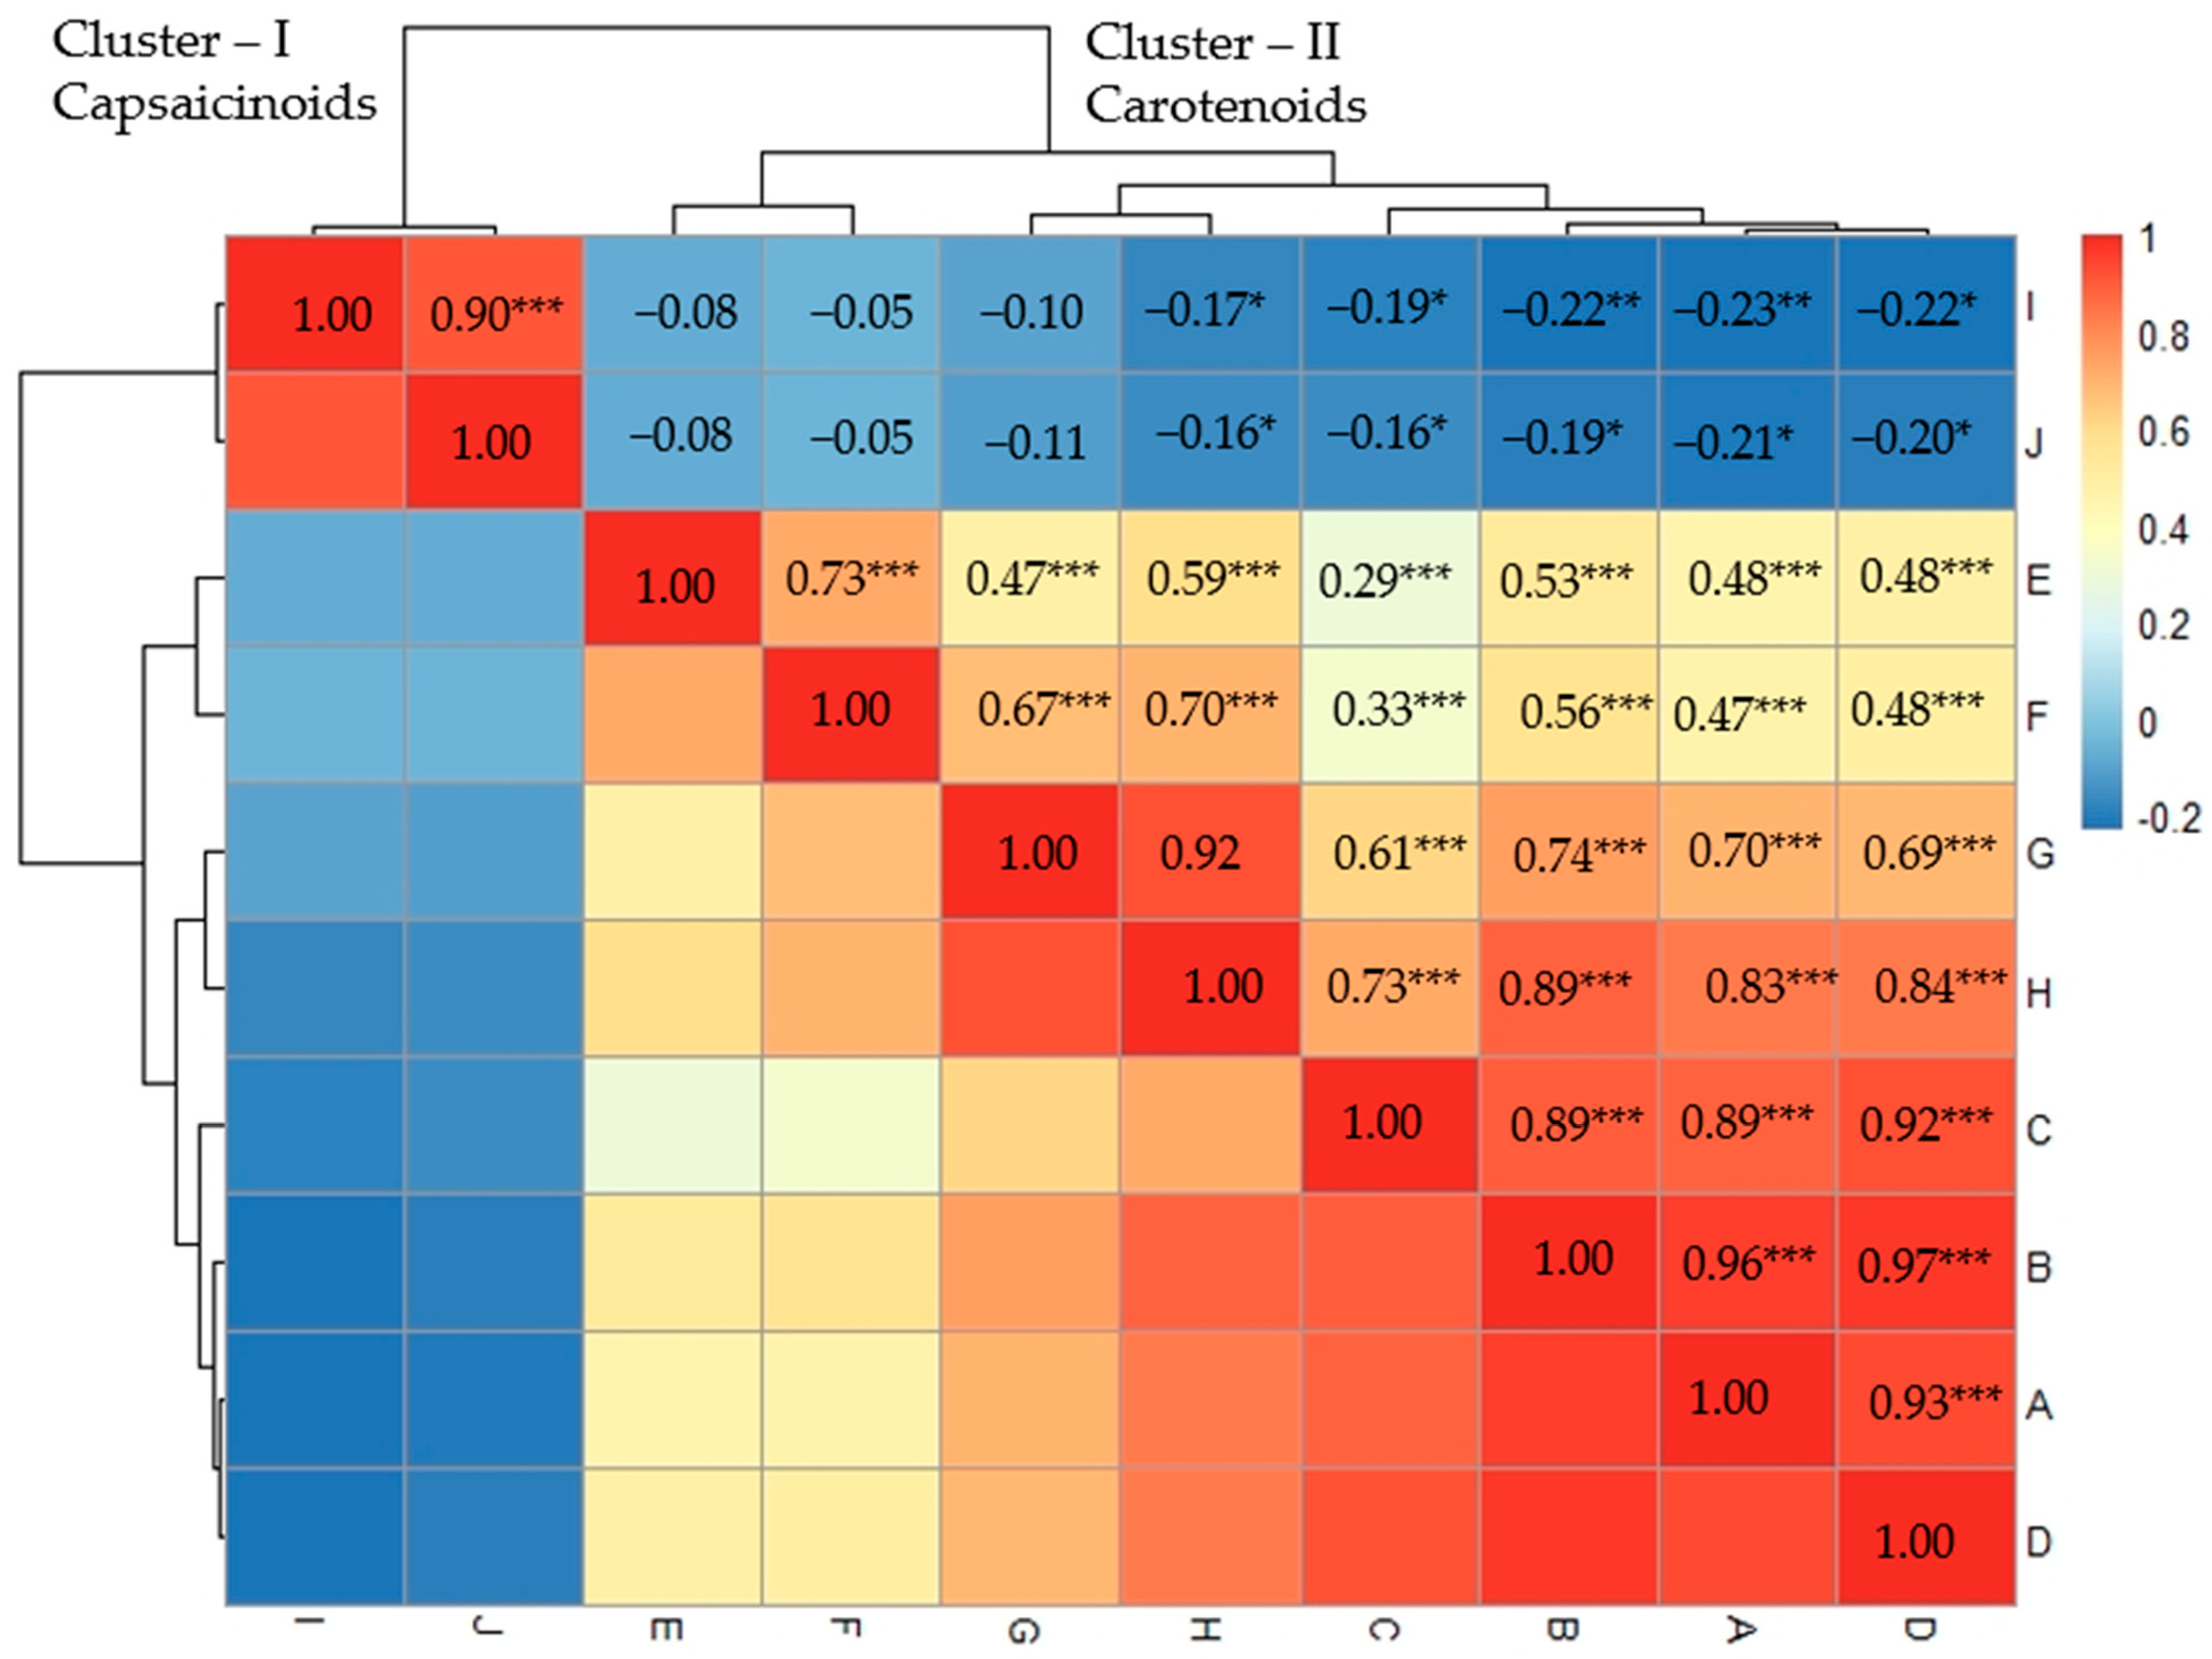
2.2. Correlation Analysis

The present study used correlation analysis to investigate the pairwise associations among 10 variables labeled “A” through “J” (Figure 1). The correlation matrix showed that antheraxanthin and capsanthin had a strong positive correlation (r = 0.97 ***), and violaxanthin and antheraxanthin had a strong positive correlation as well (r = 0.96 ***). This suggests that changes in one variable may correspond with changes in the other variable in a predictable manner. Capsorubin and capsanthin had a strong positive correlation (r = 0.92 ***). On the other hand, Zeaxanthin and β-cryptoxanthin showed a moderate positive correlation (r = 0.73 ***). In relation to carotenoids, the weakest correlations were observed between capsorubin and zeaxanthin (r = 0.29 ***), and subsequently with β-cryptoxanthin (r = 0.33 ***). α-Carotene and β-carotene had a strong positive correlation (r = 0.92), indicating a potentially meaningful relationship between these variables. There was a strong positive correlation between capsaicin and dihydrocapsaicin (r = 0.90). Contrarily, capsaicin and dihydrocapsaicin showed negative correlations with individual carotenoids. Figure 1 visually depicts the clear clustering of capsaicinoids (cluster-I) and carotenoids (cluster-II), indicating a distinct relationship between these variables. Additionally, the negative correlations within the dataset ranged from 0.05 to 0.23.

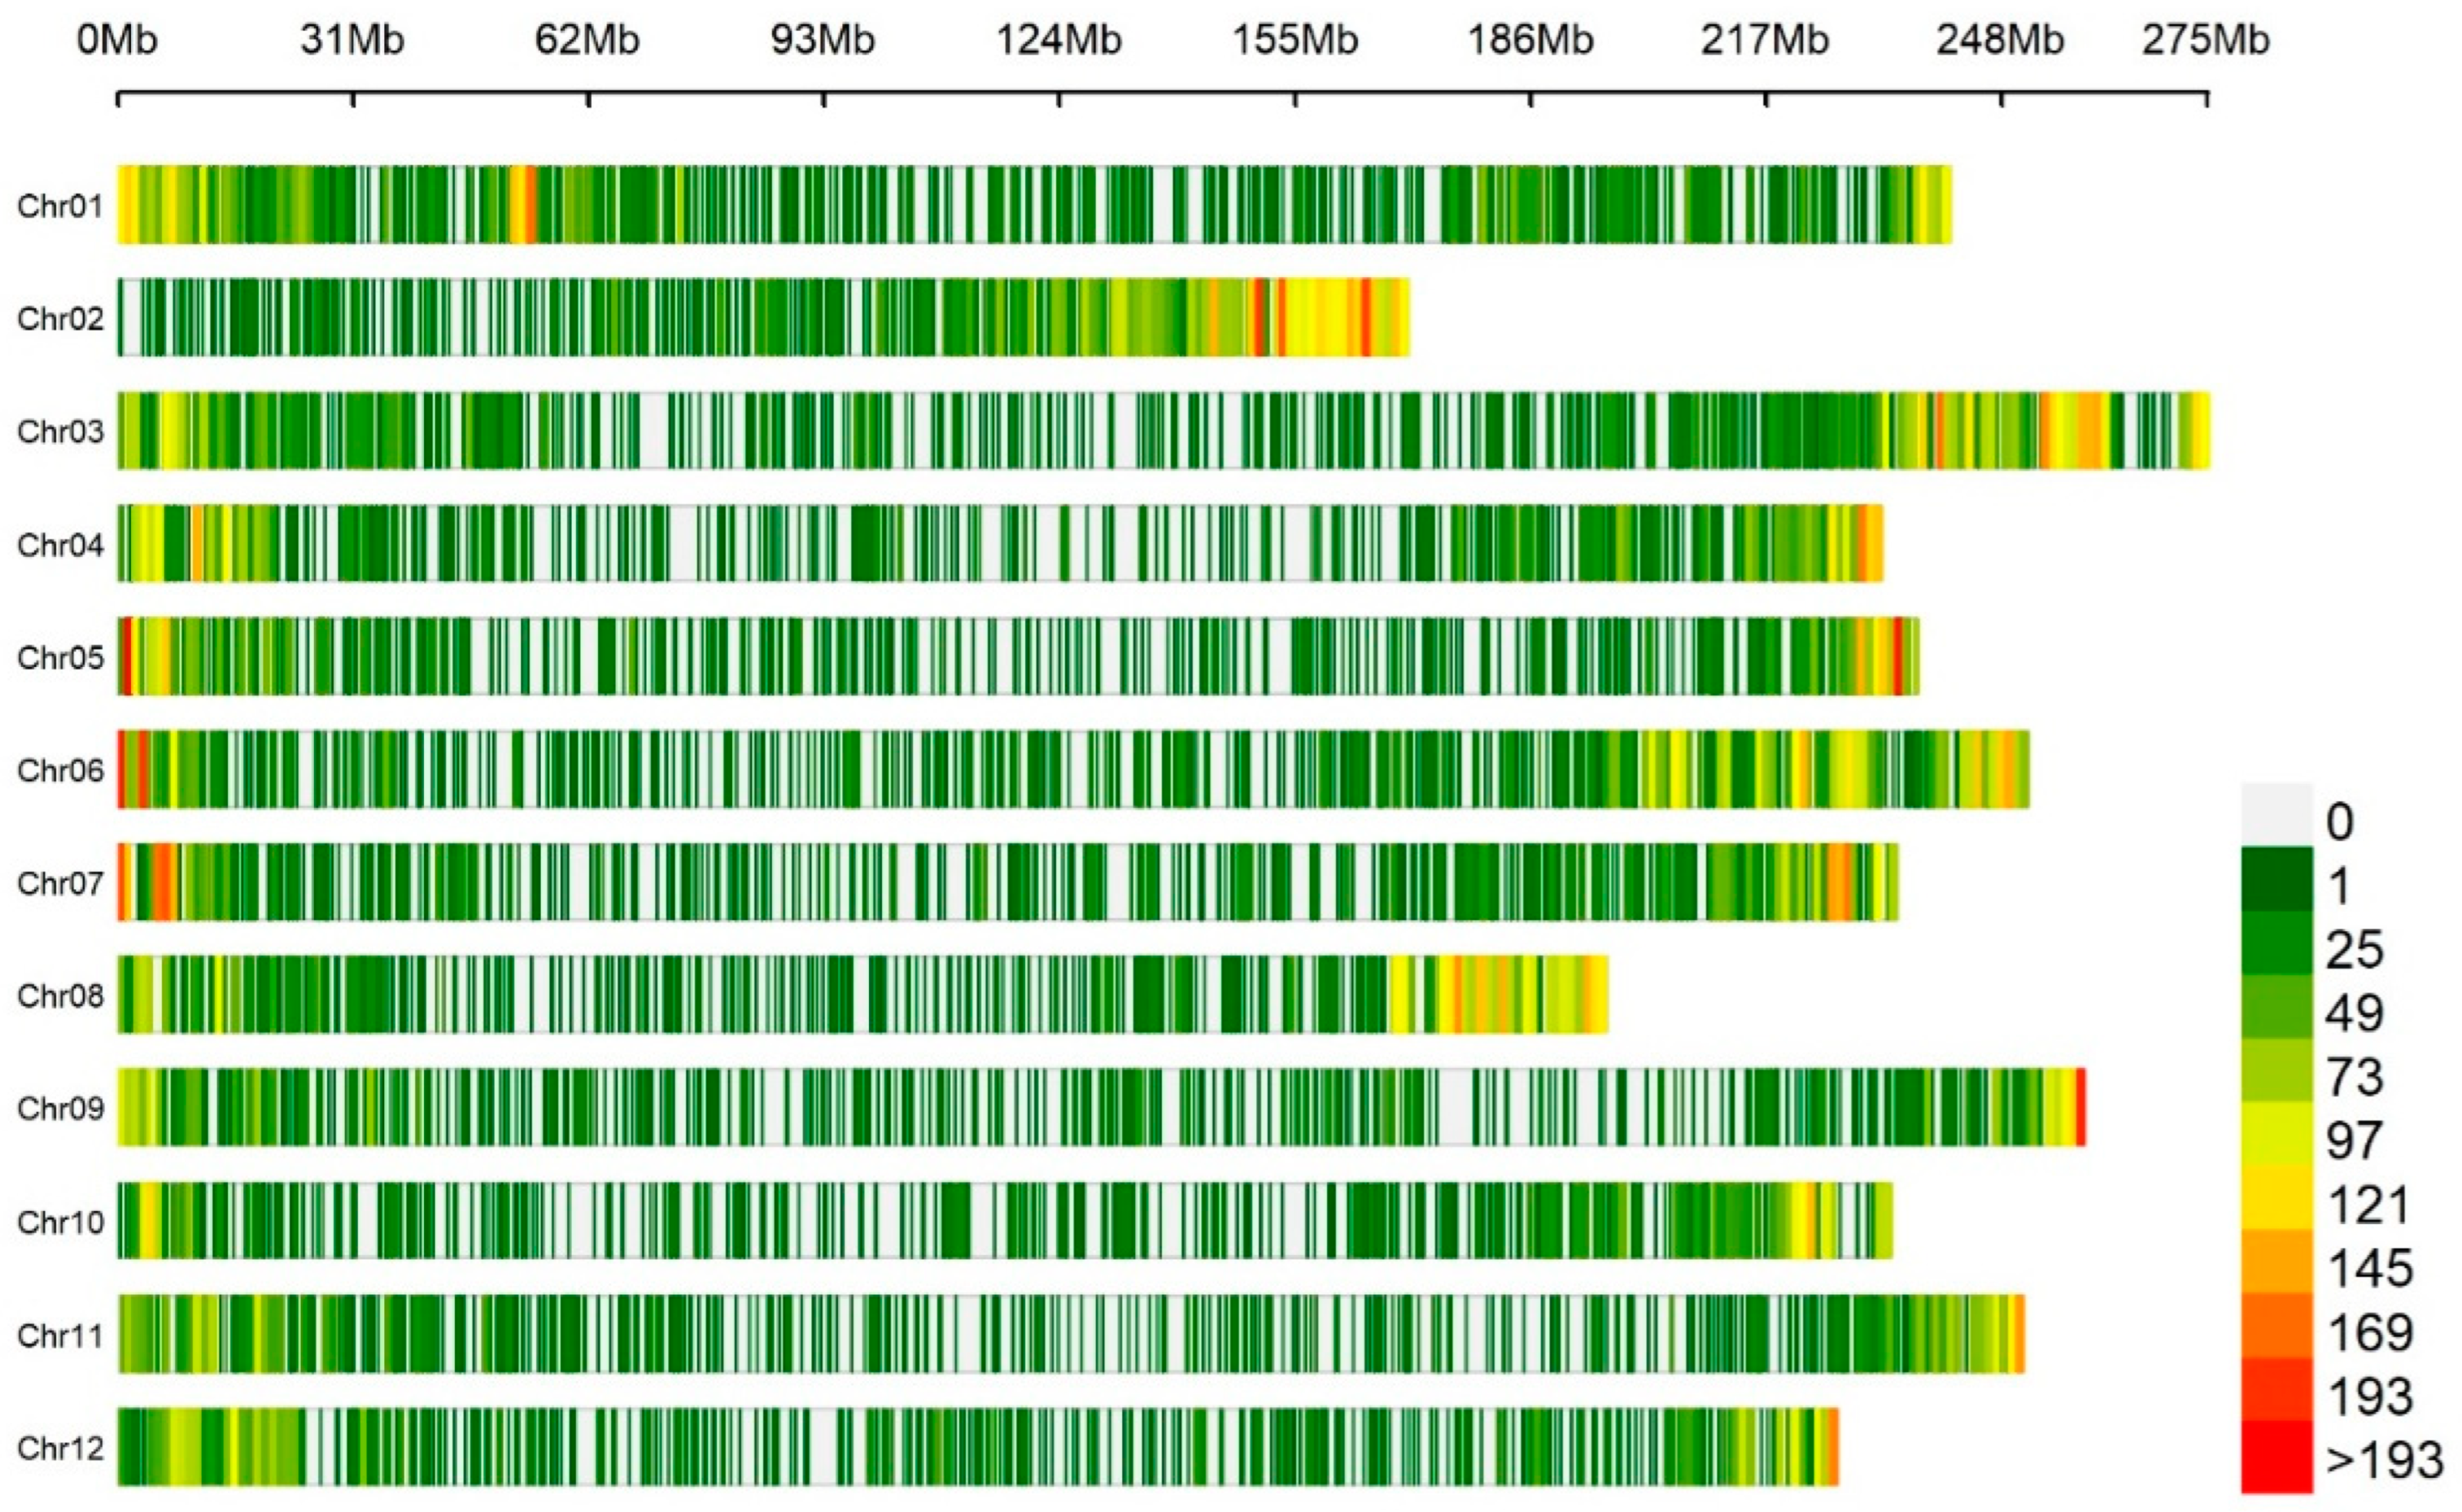
2.3. Genotyping-by-Sequencing

GBS was performed on 160 pepper germplasms using the Illumina HiSeq X Ten platform, resulting in a substantial dataset comprising approximately 1.2 billion total trimmed reads. The average mapping depth for a single accession was determined to be 17.61×, indicating a robust and thorough coverage of the pepper genome. After the variant calling process, a comprehensive set of 1,859,683 single nucleotide polymorphisms (SNPs) was identified, encompassing all 12 pepper chromosomes. The sequencing statistics for 160 C. chinense accessions are provided in Supplementary Table S1. To ensure the integrity and reliability of the data, a stringent filtering approach was applied. SNPs with a minor allele frequency below 5% and those exhibiting missing data exceeding 30% were excluded and obtained 47,810 high-quality SNPs for further analysis. Figure 2 illustrates the distribution patterns of SNPs across the 12 chromosomes of 160 C. chinense accessions. A window size of 1 Mb was used for this analysis. The heatmap colors in the figure depict the density of SNPs, providing a visual representation of their distribution patterns. These SNPs were used for genetic association studies to explore the genetic basis of important pepper bioactive compounds (carotenoids and capsaicinoids).

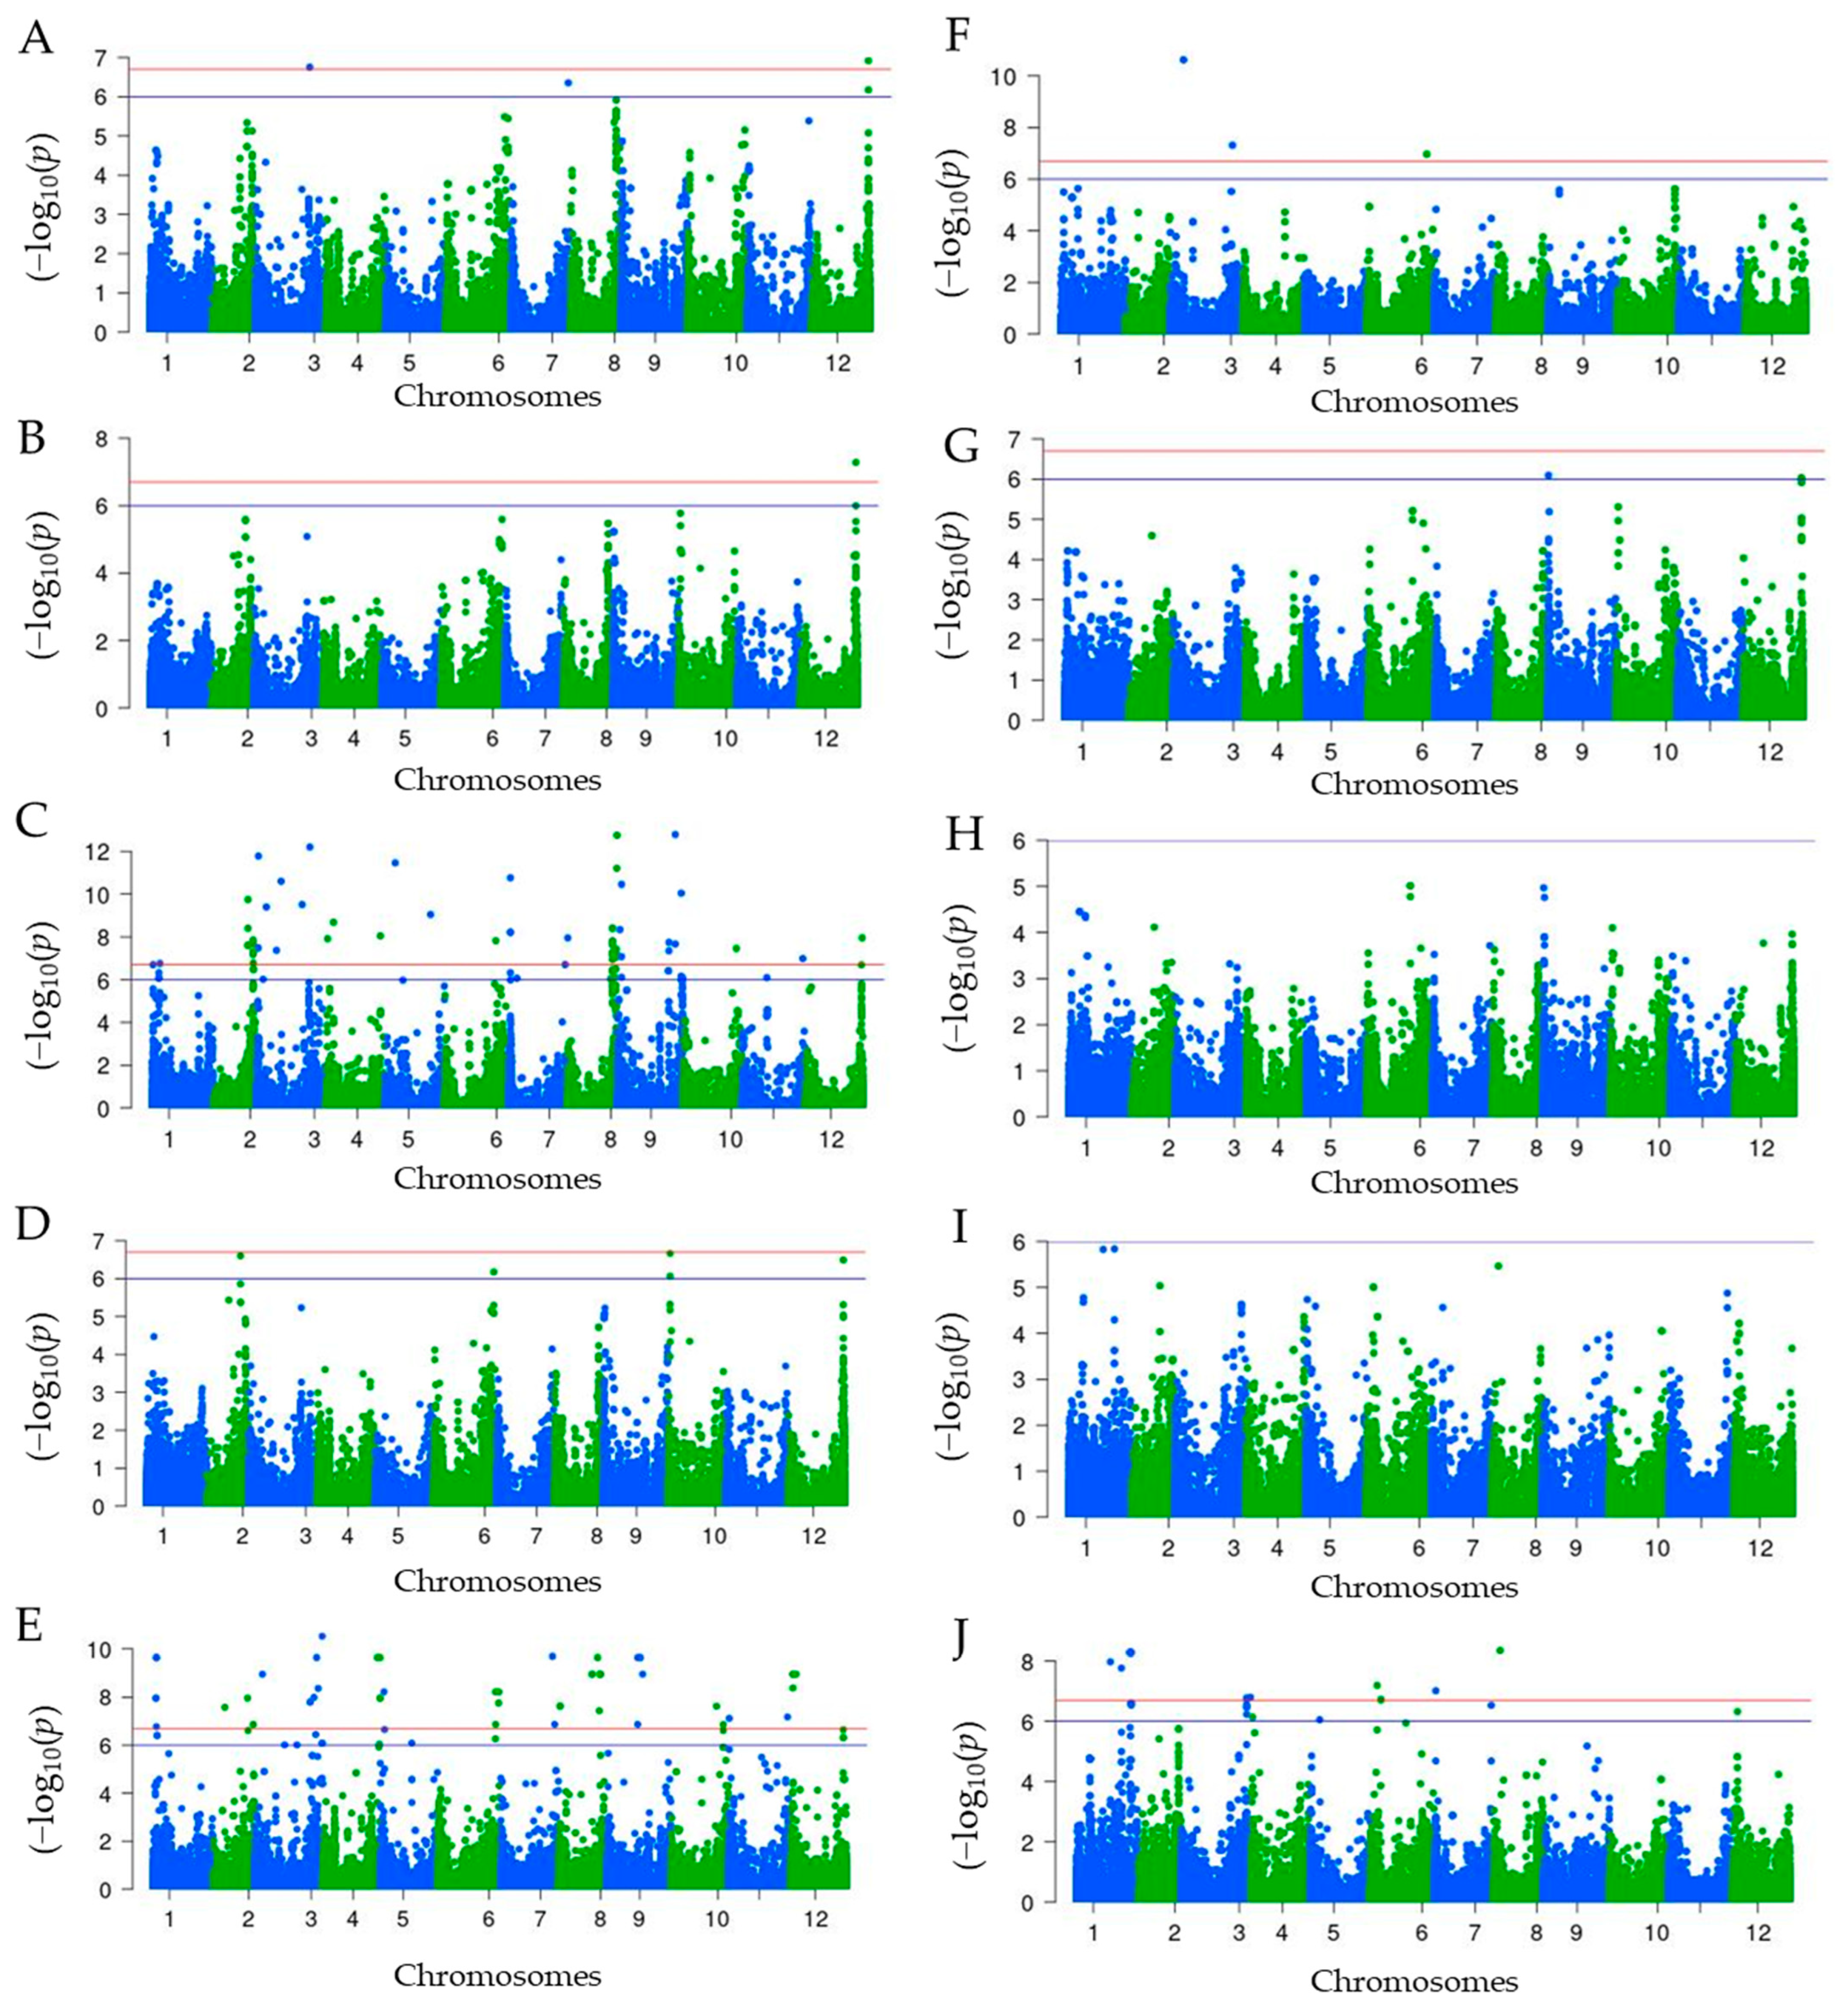
2.4. Genome-Wide Association Analysis

The genome-wide association analysis conducted using 47,810 SNPs aimed to identify SNPs associated with carotenoids and capsaicinoids. The results of the analysis were visualized in Manhattan plots (Figure 3) and quantile-quantile (Q-Q) plots (Supplementary Figure S1). In total, 193 SNPs exhibited significant associations with carotenoids and capsaicinoids. Among these, 165 SNPs were found to be associated with individual carotenoids (β-carotene), while 28 SNPs were associated with capsaicinoids, specifically dihydrocapsaicin. Regarding carotenoids, the analysis revealed a diverse set of SNPs that were significantly associated. Violaxanthin showed an association with 4 SNPs, antheraxanthin with 2 SNPs, capsorubin with 86 SNPs, capsanthin with 5 SNPs, zeaxanthin with 63 SNPs, β-cryptoxanthin with 3 SNPs, and α-carotene with 2 SNPs. In Figure 4, the box plots display the allelic frequency of selected SNP markers that exhibit significant associations with specific chemical traits. The depicted chemical traits include violaxanthin (A, B), capsorubin (C, D), capsanthin (E), zeaxanthin (F, G), α-carotene (H, I), and dihydrocapsaicin (J, K, L).
Of the SNPs associated with violaxanthin, two were identified on chromosome 12. The first SNP (T/C allele, 221,105,042 bp) was found in an intergenic region, while the second SNP (A/G allele, 221,085,307 bp) was located within the gene encoding 6,7-dimethyl-8-ribityllumazine synthase. Another significant association was observed with a SNP on chromosome 3 (A/T allele, 211,135,220 bp), which resides within the gene encoding 4-hydroxycinnamoyl-CoA ligase 2. Additionally, one SNP on chromosome 07 (223,699,776 bp) was also found to be significantly associated with violaxanthin. Furthermore, two SNPs located on chromosome 12 demonstrated significant associations with both violaxanthin and antheraxanthin in relation to capsorubin, a total of 86 SNPs showed significant association, surpassing a Benferroni-corrected threshold of −log10(p-value) = 6.0. Out of these, 57 SNPs also exceeded a higher threshold of −log10(p-value) = 6.7. The SNPs that exhibited significant association with capsorubin were distributed across various chromosomes. Notably, the highest number of associations was observed on chromosomes 8, 9, and 2, with 24, 16, and 14 SNPs, respectively.
Table 2 presents a list of 24 highly significant SNPs associated with capsorubin in C. chinense. The characteristics of the gene (name, function) in which significant SNPs were identified can be found in Supplementary Table S2. Out of these, 14 SNPs were located within genic regions, while the remaining 10 were found in intergenic regions. These genic SNPs were found in several genes, including NADP-malic enzyme 3, vacuolar protein sorting protein, and GTP-binding protein. Additionally, several SNPs were linked to proteins with unknown functions that were detected in the study.
In relation to capsanthin, β-cryptoxanthin, and α-carotene, a total of 10 SNPs were identified, with eight SNPs located in genic regions and three SNPs located in intergenic regions. Among these SNPs, five were associated with capsanthin, with three situated within genic regions and two found in intergenic regions. The genic SNP was specifically located within the CA12g19380 gene, which encodes for 6,7-dimethyl-8-ribityllumazine synthase. For β-cryptoxanthin, three SNPs were identified, with one SNP located in an intergenic region. In the case of α-carotene, two SNPs were found, both residing within genic regions. One genic SNP was located within the CA00g41080 gene, which encodes for RAB1X, a protein involved in intracellular transport. The other genic SNP was located within the CA12g19190 gene, which encodes for ubiquitin carboxyl-terminal hydrolase 19-like. A significant association with zeaxanthin was observed for a total of 63 SNPs. Among these, the major SNPs were distributed across chromosomes 3, 8, 12, and 1, with 12, 9, 7, and 7 SNPs, respectively. Among the identified SNPs associated with zeaxanthin, a total of 21 were selected and presented in Table 2. Out of these 21 SNPs, 12 were located within genic regions, and 9 were found in intergenic regions. The genic SNPs were found to be associated with various gene functions, including histone deacetylase, DNA binding protein, coatomer alpha subunit, STY-L protein, transcription factor BIM1, photosystem II processing protein, chaperone regulator, mitogen-activated protein kinase, and sinapyl alcohol dehydrogenase-like 3.
For capsaicinoids, a total of 28 significant SNPs were found to be associated with dihydrocapsaicin, while no SNP reached the significant threshold of −log10(p-value) = 6.0 for capsaicin. Out of the significant SNPs linked to dihydrocapsaicin, 15 SNPs exceeded the highly significant threshold of −log10(p-value) = 6.7. These SNPs associated with dihydrocapsaicin were distributed across different chromosomes, including Chr08 (T/C, 25,161,329 bp), Chr01 (A/G, 208,666,749 bp), Chr01 (A/T, 209,615,478 bp), Chr01 (A/G, 214,441,815 bp), Chr01 (A/G, 214,441,917 bp), Chr01 (C/T, 214,442,584 bp), Chr01 (C/T, 132,753,120 bp), Chr01 (A/C, 176,184,702 bp), Chr06 (G/T, 27,230,404 bp), and Chr07 (A/C, 6,571,083 bp). Several of these SNPs were located within genes encoding various proteins, such as ATP binding protein, late embryogenesis abundant protein (LEA) family protein, steroleosin-B, and small MutS-related (Smr). Additionally, SNPs were also identified in intergenic regions, which are regions that do not correspond to known genes.

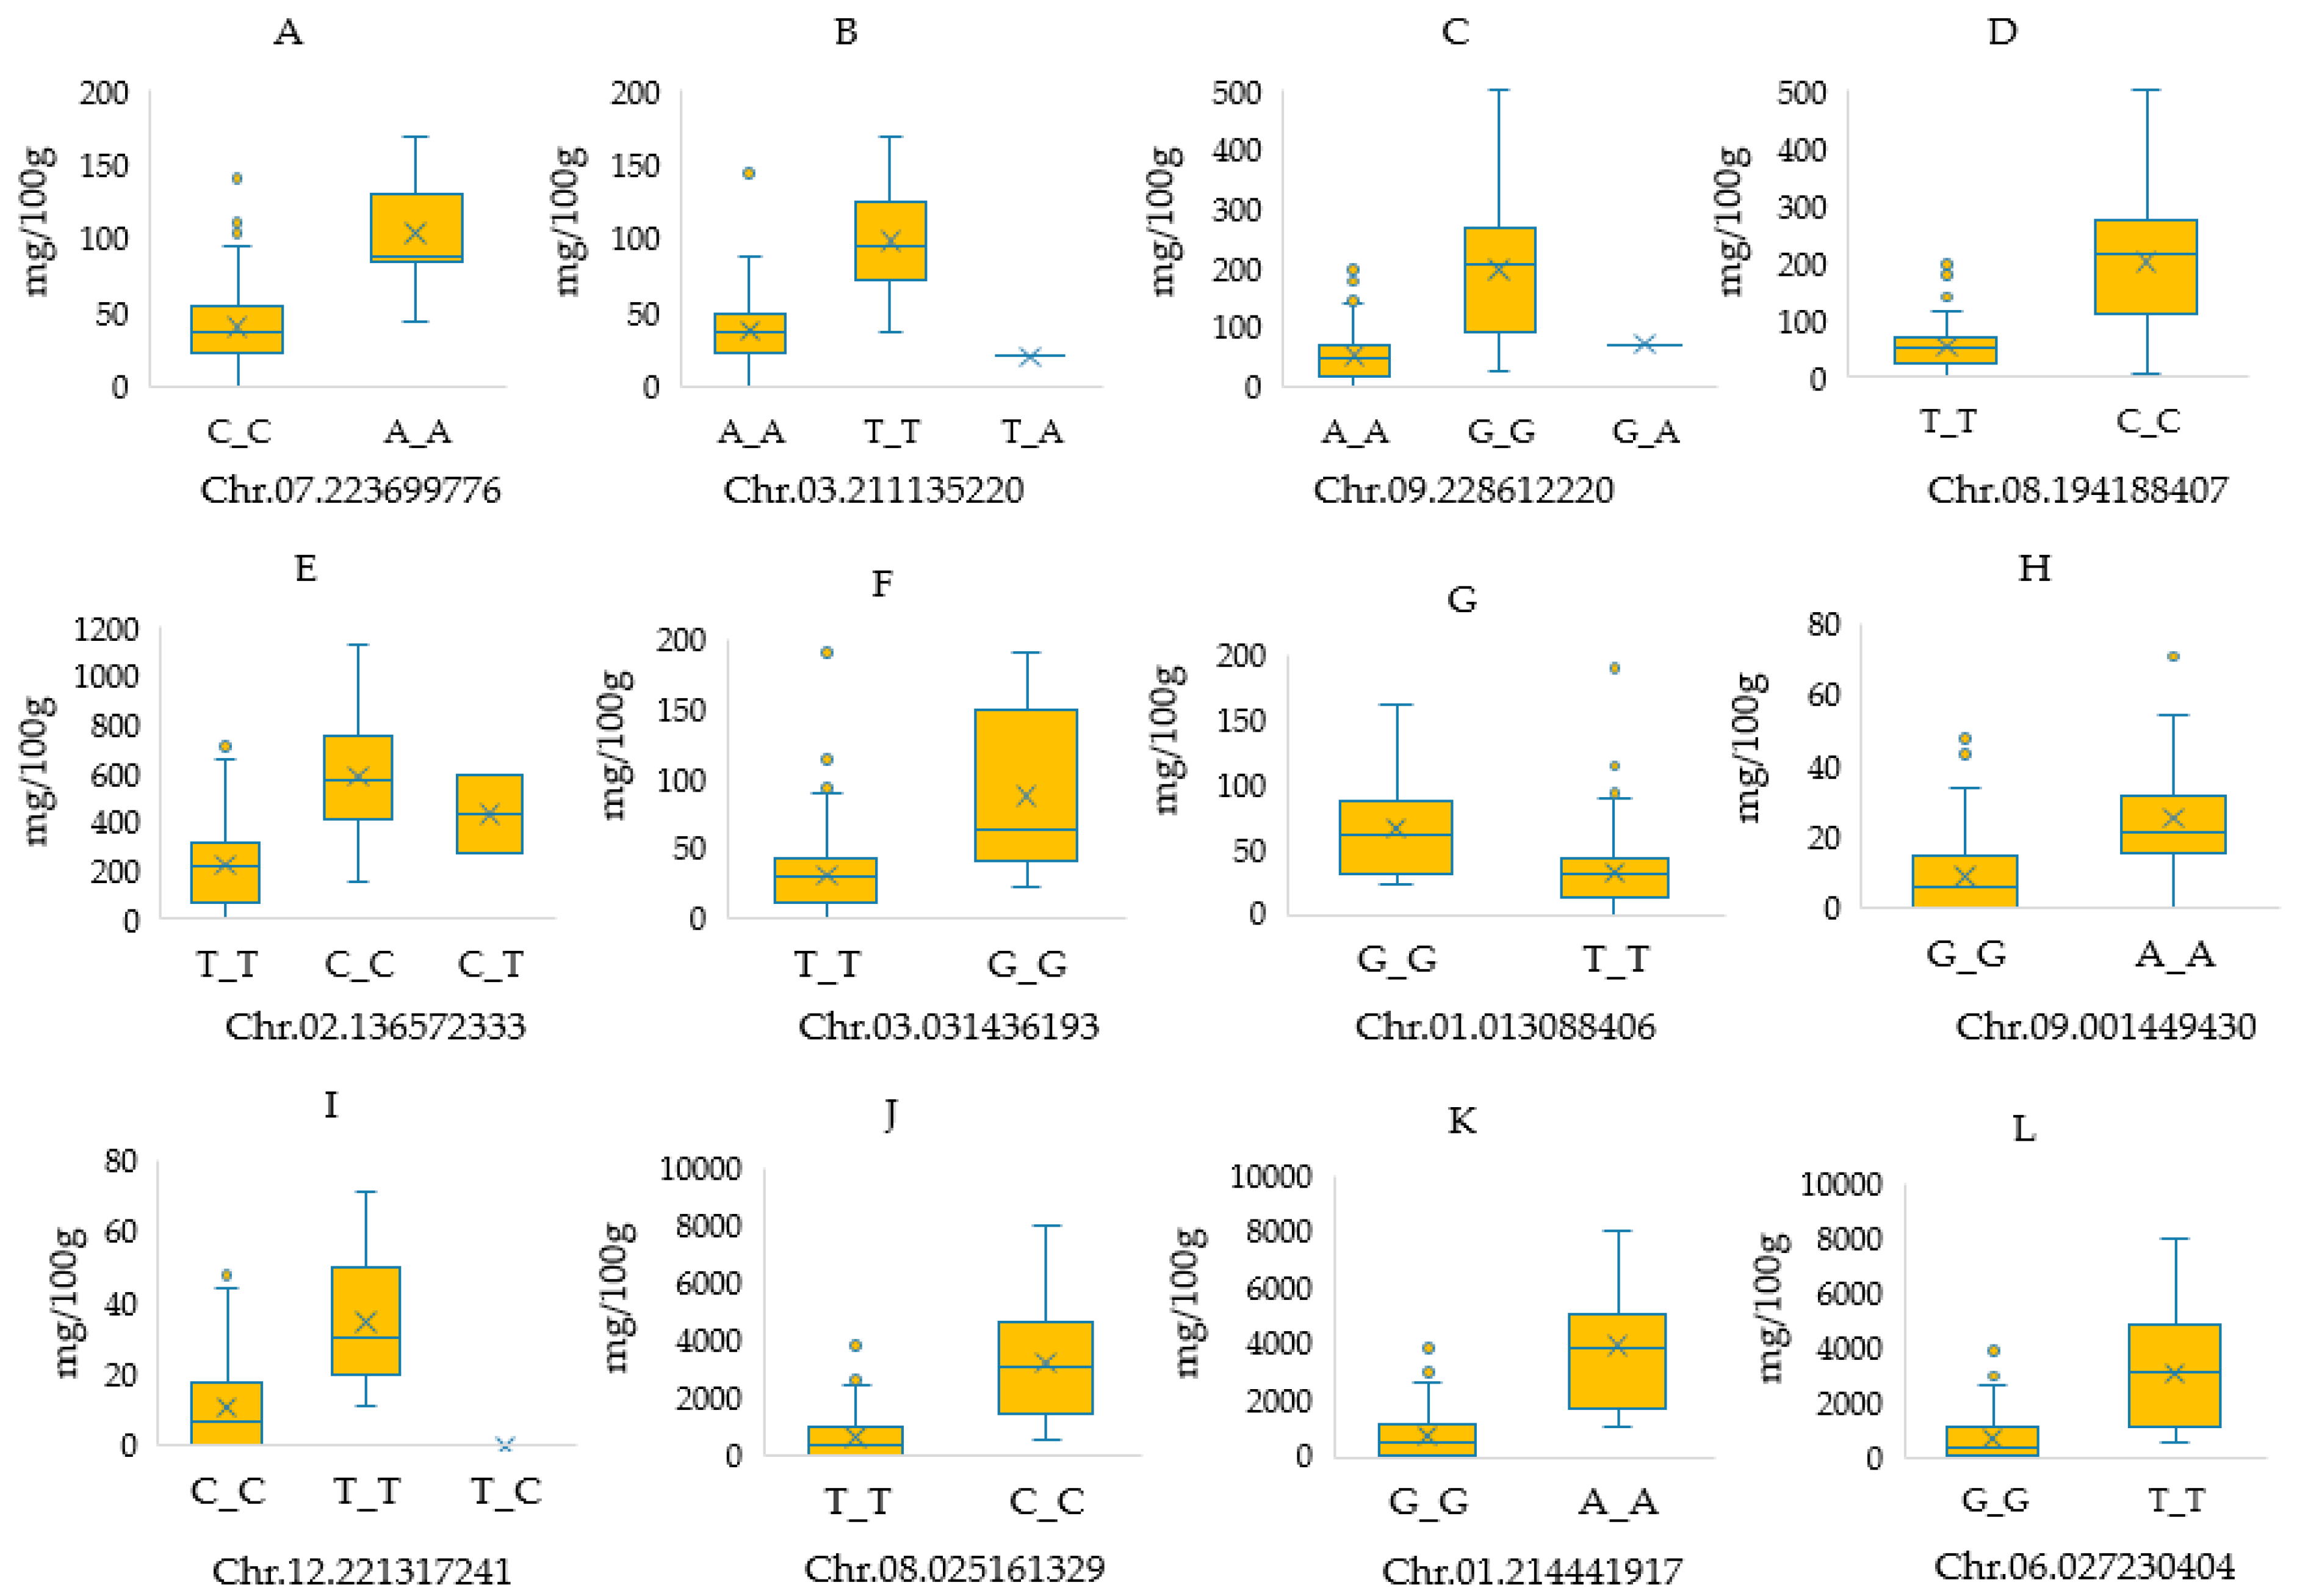
2.5. SNP Markers Showing Pleiotropic Effects

The common SNPs associated with multiple traits are presented in Table 3. These SNPs were identified across different chromosomes, residing either within genic or intergenic regions. Among the traits examined, violaxanthin, antheraxanthin, capsorubin, and capsanthin were found to have common SNPs. Chromosomes 2, 3, 7, and 12 contained the SNPs linked to these traits. Notably, some of these SNPs were located within genes responsible for encoding specific proteins, such as 6,7-dimethyl-8-ribityllumazine synthase and 4-hydroxycinnamoyl-CoA ligase 2. However, in other instances, the SNPs were detected in intergenic regions.

3. Discussion

3.1. Carotenoids and Capsaicinoids Contents

Peppers’ widespread popularity stems from their visually appealing colors, diverse flavors, culinary versatility, and nutritional benefits. Peppers contain a variety of nutrients and bioactive compounds, including vitamins, carotenoids, capsaicinoids, anthocyanins, phenolic acids, and flavonoids [36,37]. Carotenoids in peppers are of particular interest among these components because they contain provitamin A carotenoid (β-carotene, α-carotene, and β-cryptoxanthin) as well as other carotenoids that are crucial for maintaining human eye health (lutein, and zeaxanthin) [37]. Carotenoids have nutritional value, but they also function as antioxidants by quenching reactive oxygen species and neutralizing free radicals because they contain conjugated double bonds. These carotenoids have been linked to a lower risk of developing some chronic medical conditions [38]. In this experiment, eight carotenoids were quantified using 160 pepper accessions. The highest total carotenoid content was 2426.49 mg/100 g DW. Capsanthin was the highest individual carotenoid and contributed more to the total carotenoid content. A similar report indicated that among the nine carotenoids from the sweet red pepper variety that were quantified, capsanthin was the one with the highest concentration [37]. The pepper accessions showed a wider variation in carotenoid content, ranging from 4.36 to 2426.49 mg/100 (Table 1). These variations in genotypes determine that specific carotenoid biosynthetic enzymes have been linked to a significant variation in carotenoid profiles among Capsicum species and cultivars [39].
Capsaicinoids, a category of alkaloids responsible for the hot or spicy flavor, are synthesized and accumulated by the plant and are found largely in placental tissue near the seeds [40]. Their concentration is determined by genotype, fruit maturity, and growing circumstances [41]. The word “capsaicinoids” refers to a class of pungent chemical mimics found only in chili peppers [42]. Capsaicinoids have anticarcinogenic effects that inhibit the androgen-dependent growth of breast cancer, colon cancer, prostate cancer, and stomach adenocarcinomas [43,44,45]. We measured the content of capsaicinoids (capsaicin, dihydrocapsaicin, capsiate, and dihydrocapsiate) in pepper accessions and found that capsaicin and dihydrocapsaicin were the two major capsaicinoids with the highest amounts (Table 1). Due to the limited presence of capsiate and dihydrocapsiate in only a few accessions, we excluded the data for these two compounds from the analysis. This finding is in agreement with a report that states the most abundant and potent capsaicinoids in peppers (and consequently pepper extracts) are capsaicin and dihydrocapsaicin [44,46]. Capsaicinoid content varied greatly among pepper accessions, with total capsaicinoid content ranging from 0 to 19,671.1 mg/100 g DW (Table 1).

3.2. SNPs Associated to Carotenoids and Capsaicinoids

The impact of genetic variation on the biochemical components of plant species has been explored using a number of molecular biology approaches. GWAS analysis plays a critical role in identifying genetic markers associated with traits of interest. A marker-trait association study was carried out utilizing 47,810 high-quality SNPs derived from 160 pepper accessions. A total of 193 SNPs were identified as significantly associated with individual carotenoids (165 SNPs) and capsaicinoids (28 SNPs). The SNPs discovered in this study were located in both genic and intergenic regions. SNPs can occur at different frequencies in different regions of chromosomes, including coding sequences of genes, non-coding regions of genes, and intergenic regions between genes [47,48]. The presence of pleiotropy suggests that there could be shared genetic factors among related traits [49]. SNPs that exhibited associations with multiple traits, specifically the individual carotenoids, are presented in Table 3. Similarly, in another study conducted on Cucurbita maxima Duchesne, SNP markers showing pleiotropic effects among the different analyzed carotenoids were reported [50].
The present study identified a SNP on chromosome 09 associated with the carotenoid capsorubin within a gene encoding an auxin response factor (ARF). This finding aligns with the existing literature that emphasizes the involvement of ARFs in plant growth and development, as well as their potential roles in carotenoid biosynthesis and responses to abiotic stresses [51]. Research on the role of auxin in the growth, development, and stress response of the model plant Arabidopsis thaliana and major field crops like wheat, maize, and rice, among others, has been comprehensive and extensive [52,53,54,55,56]. ARFs are a family of transcription factors that regulate the expression of genes in response to auxin and have been implicated in various physiological processes in plants [39]. Previous studies have demonstrated their importance in regulating plant growth, development, and hormone signaling pathways, particularly in response to auxin [57,58,59,60,61,62,63]. However, their specific roles in carotenoid biosynthesis and abiotic stress responses have been less explored until recently. The findings of the previous study [51] contributed to our understanding of the functional relevance of ARFs in carotenoid metabolism and stress tolerance. By analyzing the sweet potato IbARF5 gene, the researchers observed and confirmed an increase in carotenoid contents and enhanced tolerance to salt and drought in transgenic Arabidopsis plants [51]. This study reports for the first time that the IbARF5 gene plays a vital role in regulating carotenoid biosynthesis and influencing the plant’s response to abiotic stresses. Similarly, our finding of SNPs associated with carotenoids can strengthen the previous findings and emphasize the need for further study for better understanding.
Another SNP was found on chromosome 04, which showed a significant association with zeaxanthin, one of the individual carotenoids. This SNP is located within a gene that encodes a member of the helix–loop–helix (bHLH) transcription factor (TFs) family. The bHLH is one of the largest TFs and plays a crucial role in regulating plant growth and development by interacting with other TFs in various biological processes [64,65]. Existing literature provides support for the involvement of bHLH transcription factors in the regulation of both carotenoid and capsaicinoid biosynthesis. Existing literature provides support for the involvement of bHLH transcription factors in the regulation of both carotenoid and capsaicinoid biosynthesis. A GWAS was conducted in Capsicum and the expression profiles of specific bHLH transcription factors, such as CabHLH009, CabHLH032, CabHLH048, CabHLH095, and CabHLH100 from clusters C1, C2, C3, and C4, showed a correlation with the accumulation of carotenoids, including zeaxanthin, in the pericarp [66]. Additionally, the expression profiles of CabHLHs in clusters L5, L6, L8, and L9 were found to be consistent with capsaicinoid biosynthesis [66]. In another study, it was also noted that the regulation of broccoli carotenoid biosynthesis primarily involved the NAC, bHLH, bZip, MYB, and ERF families of transcription factors [67]. Moreover, the results obtained from the analysis of TFs gene ontology (GO) categories revealed that genes such as bHLH66, PIF4, LOB13, NAC92, and APL were found to be enriched in multiple categories related to chlorophyll biosynthesis, regulation of chlorophyll biosynthesis, and carotenoid biosynthetic process [67]. These findings suggest that the identified bHLH transcription factors may play crucial roles in the biosynthesis of both carotenoids and capsaicinoids. Therefore, the association of the SNP on chromosome 04 with zeaxanthin likely involves the regulation of carotenoid biosynthesis through the modulation of the corresponding bHLH transcription factor. Further investigations are important to elucidate the precise mechanisms by which these candidate bHLH transcription factors regulate carotenoid and capsaicinoid biosynthesis and to validate the functional impact of the identified SNP on zeaxanthin levels.
The present study identified 28 SNPs associated with dihydrocapsaicin, among which one SNP was found in the gene encoding an ATP-binding protein. ATP-binding proteins are recognized for their critical roles in various cellular processes in plants, encompassing energy metabolism, signaling pathways, transport processes, and enzymatic activities [68]. Additionally, the presence of SNPs in genes encoding other proteins, including histidyl-tRNA synthetase, putative LEA family protein, steroleosin-B, small MutS-related domain-containing protein, ubiquitin-activating enzyme E1c, putative serine-threonine protein kinase, putative catalytic, and putative translation elongation factor EF1A protein, emphasizes the significance of further investigation and understanding to explore their potential involvement in relevant biological processes. In addition, significant associations were observed between SNPs and carotenoid and capsaicinoid content in peppers within genes encoding proteins of unknown function. These findings emphasize the need for further investigation to uncover the roles of these genes in carotenoid and capsaicinoid metabolism, potentially involving novel enzymatic activities or regulatory functions. Functional characterization experiments, such as gene expression analysis and targeted assays, are warranted to elucidate the roles of these proteins. Comparative genomics and integrative omics approaches hold promise for gaining insights into the conservation and potential functional domains of these unknown proteins.
In conclusion, the development of improved plant varieties with enhanced bioactive compounds and nutritional values is a crucial goal in plant breeding. Marker-assisted plant breeding approaches offer a valuable tool by enabling the study of genetic variants and their association with important traits of interest. In this study, we have identified a large number of significantly associated SNPs with carotenoids and capsaicinoids. These findings can assist future studies aiming to identify potential markers for the selection of pepper germplasm with high carotenoid and capsaicinoid content. Furthermore, the genes associated with the identified SNPs will provide valuable insights into their functions and their involvement in the biosynthesis pathways of these bioactive compounds for future studies.

4. Materials and Methods

4.1. Chemicals and Plant Material

In this study, analytical grade reagents, extraction solvents, and carotenoid and capsaicinoid standards were used. The chemicals used were sourced from Sigma-Aldrich (Saint Louis, MI, USA) and included carotenoid standards such as capsanthin, capsorubin, antheraxanthin, violaxanthin, zeaxanthin, beta-cryptoxanthin, alpha-carotene, and beta-carotene, as well as capsaicinoid standards including capsaicin and dihydrocapsaicin. Additional chemicals used in the study were potassium hydroxide, dichloromethane, methanol, sodium chloride, ascorbic acid, ammonium acetate, and methyl tert-butyl ether.
The Capsicum chinense genetic materials used in the study consisted of 160 accessions sourced from the National Agrobiodiversity Center’s (NAC) gene bank under the Rural Development Administration (RDA) in Jeonju, Republic of Korea. Each accession was represented by ten to twelve pepper plants, with three replications, which were cultivated in NAC greenhouses following the RDA’s pepper growing methods. Fully matured pepper fruits were collected, freeze-dried, powdered, and stored in a deep freezer at −70 °C for further analysis. Detailed information about the IT (introduction) numbers and origins of the 160 C. chinense pepper materials can be found in Supplementary Table S3.

4.2. Analysis of Carotenoids

The pepper samples used in this study were all freeze-dried and powdered. The extraction, separation, and measurement of carotenoids by High-Performance Liquid Chromatography (HPLC) were conducted with minor modifications, following the procedure outlined by Kim et al. [69]. To extract carotenoids, 0.05 g of pepper powder that had been sieved through a 0.7 mm sieve was mixed with 3 mL of ethanol containing 0.1% ascorbic acid (w/v). The mixture was vortexed for 20 s and then placed in an 85 °C water bath for 5 min. Subsequently, saponification of the extract was carried out for 10 min in an 85 °C water bath using potassium hydroxide (120 L, 80% w/v). After saponification, the samples were immediately cooled on ice, and 1.5 mL of cold deionized water was added. The extraction process was repeated twice using 1.5 mL of hexane. The resulting extracts were then centrifuged at 12,009× g, and the supernatant was filtered through a 0.2 µm syringe filter to obtain the final carotenoid extract for analysis.
The separation of carotenoids was carried out using HPLC on an Agilent 1260/90 Infinity II system (Santa Clara, CA, USA) equipped with a C30 YMC column (250 × 4.6 mm, 3 µm; Waters Corporation, Milford, MA, USA). The detection of carotenoids was performed at a wavelength of 450 nm. The mobile phase consisted of two solvents: Solvent A, a mixture of methanol and water (92:8 v/v) containing 10 mM ammonium acetate, and Solvent B, which was 100% methyl tert-butyl ether. The carotenoids were separated using HPLC (Agilent 1260/90 Infinity II, Santa Clara, CA, USA) on a C30 YMC column (250 × 4.6 mm, 3 µm; Waters Corporation, Milford, MA, USA) and detected at 450 nm. Solvent A was a mixture of methanol and water (92:8 v/v), containing 10 mM ammonium acetate. Solvent B was made of 100% methyl tert-butyl ether. The following gradient elution conditions were employed: 0 min (83% A and 17% B), 23 min (70% A and 30% B), 29 min (59% A and 41% B), 35 min (30% A and 70% B), 40 min (30% A and 70% B), 44 min (83% A and 17% B), and 55 min (83% A and 17% B) at a 1 mL/min flow rate. Calibration curves were created for quantification purposes by graphing four distinct concentrations of carotenoid standards based on the peak area ratios of the standards. The analysis was executed in triplicate.

4.3. Analysis of Capsaicinoids

To prepare the sample for analysis, the freeze-dried pepper powder sample was combined with acetonitrile in a ratio of 1:10. The mixture was sonicated for 1 h to facilitate the extraction of the desired compounds. Following sonication, the sample was heated in a water bath at 80 °C for 4 h to further promote extraction. After the heating step, the mixture was subjected to centrifugation at 4 °C and 15,000 rpm for 15 min using a centrifuge. The resulting supernatant, which contains the extracted compounds, was then filtered using a Polyvinylidene fluoride (PVDF) 0.2 μm syringe filter to remove any remaining particulate matter and prepared for analysis.
The capsaicinoid analysis was conducted using Ultra-Performance Liquid Chromatography (UPLC) with an AQUITY UPLC H-Class instrument (Waters; Milford, MA, USA) and an ACQUITY UPLC HSS T3 1.8 µm 2.1 × 50 mm column. The column temperature was maintained at 30 °C, and a flow rate of 0.4 mL/min was used for the mobile phase. The sample temperature was set at 20 °C. The total run time for the analysis was 7 min, with a delay time of 5 min. An injection volume of 2 µL was used. The mobile phase consisted of a 45% acetonitrile isocratic condition. The seal solvent, purge solvent, and needle solvent were all 45% acetonitrile. The Photo Diode Array (PDA) detector was set to measure the absorbance at a wavelength of 280 nm, which is suitable for detecting capsaicinoids. To prepare the capsaicin and dihydrocapsaicin standards for analysis, precise measurements were taken. Initially, 5 mg of each standard was accurately weighed and dissolved in 5 mL of acetonitrile, resulting in a working solution with a concentration of 1000 mg/L. Working solutions for capsaicin and dihydrocapsaicin were prepared in a concentration range from 1.95 mg/L to 1000 mg/L and 1.95 mg/L to 250 mg/L, respectively. These prepared standards were then utilized in the subsequent analysis to determine the concentration of capsaicinoids present in the sample. The analysis was executed in triplicate.

4.4. DNA Extraction and Genotype-by-Sequencing

For the extraction of genomic DNA from the young leaves of each accession, we followed the cetyltrimethylammonium bromide (CTAB) protocol [70]. The DNA quantity was measured using the Quant-iT PicoGreen dsDNA Assay Kit from Molecular Probes (Eugene, OR, USA), and the measurement was conducted using the Synergy HTX Multi-Mode Reader from Biotek (Winooski, TV, USA). The DNA concentration was then adjusted to 12.5 ng/μL. Following that, the DNA underwent digestion using the ApeKI enzyme from New England Biolab, with a digestion time of 3 h at a temperature of 75 °C. GBS libraries were constructed following the methods previously described [71,72], with minor modifications. The GBS libraries were sequenced on the Illumina HiSeq X Ten (Illumina, Inc., San Diego, CA, USA) using paired-end reads of 151 base pairs (bp).
Demultiplexing was performed using barcode sequences, followed by removal of adapter sequences and sequence quality trimming. Adapter and barcode sequences were removed using the software Cutadapt (version 1.8.3) [73]. Low-quality sequences were eliminated using the DynamicTrim and LengthSort programs from the SolexaQA package (v.1.13) [74]. For DynamicTrim, a minimum Phred score of 20 was used as the threshold. In the case of LengthSort, short reads with a minimum length of 25 bp were retained. The BWA (Burrows-Wheeler Aligner, ver. 0.6.1-r104) [66] software was utilized to generate clean reads, which underwent preprocessing and were subsequently mapped to the C. chinense reference genome v1.2 (http://peppergenome.snu.ac.kr/, accessed on 9 June 2020).

4.5. SNP Calling and Filtering

During the mapping process, a SAM file was generated with default parameter values, except for specific options set as follows: a seed length (−l) of 30, maximum differences allowed in the seed (−k) of 1, number of threads (−t) used for processing of 16, mismatch penalty (−M) of 6, gap opening penalty (−O) of 15, and gap extension penalty (−E) of 8. The resulting SAM files were used for raw SNP discovery using SAMtools (version 0.1.16) [75]. From the obtained data, consensus sequences were extracted to determine the consensus sequences and identify any genetic variations present.
Prior to SNP detection, SNP validation was carried out using the SEEDERS [76] in-house script. Raw SNP detection was then performed, utilizing default parameter values, except for specific options set as follows: a minimum mapping quality for SNPs (−Q) of 30, a minimum mapping quality for gaps (−q) of 15, a minimum read depth (−d) of 3, a minimum InDel score for nearby SNP filtering (−G) of 30, SNPs within a certain distance (INT bp) around a gap to be filtered (−w) of 15, a window size for filtering dense SNPs (−W) of 30, and a maximum read depth (−D) of 165. The resulting SNP matrix was categorized into three groups based on the read depth: homozygous SNPs (SNP read depth ≥ 90%), heterozygous SNPs (40% ≤ SNP read depth ≤ 60%), and other SNPs. Following the filtering process, a total of 47,810 high-quality SNPs were obtained, meeting the criteria of having missing data of less than 30% and a minor allele frequency greater than 5%. These high-quality SNPs were selected for further association analysis.

4.6. Genome-Wide Association Analysis

The association analysis was conducted using the 47,810 SNPs obtained from 160 pepper individuals. Imputation of missing genotypes was performed using the BEAGLE algorithm [77]. For the association analysis, QTLmax 3.0 (Katy, TX, USA) [78] was utilized, employing a Linear Mixed Model (LMM) to account for population structure and relatedness among individuals. The significance threshold after Bonferroni correction was determined to be greater than 6.0, calculated as −log(0.05/47,810). Additionally, a more stringent threshold of greater than 6.7 was used, calculated as −log(0.01/47,810). These thresholds were applied to determine the level of significance for the association analysis results.
A Basic Local Alignment Search Tool (BLAST) was employed to search for candidate genes adjacent to the SNP of interest. The Capsicum genome database (http://peppergenome.snu.ac.kr, Capsicum annuum CM334 (v1.6) CDS), tomato and potato genomes at https://solgenomics.net/ and the NCBI (National Center for Biotechnology Information) database were utilized in this analysis. The search focused on a 200-kb region surrounding the SNP, including 100 kb on each side. The flanking sequences of the SNP were obtained from the C. chinense genome database. These sequences were then compared against the Capsicum genome database and the NCBI database to identify genes or gene regions that exhibited similarity or alignment.

4.7. Statistical Analysis

The Microsoft Excel program was utilized for data summary and descriptive statistics of the carotenoids and capsaicinoids. Furthermore, the R software (version 4.2.1) was employed to perform correlation analysis (“pheatmap” package).

Supplementary Materials

The following supporting information can be downloaded at: https://www.mdpi.com/article/10.3390/ijms241813885/s1.

Author Contributions

Conceptualization, N.R. and H.-C.K.; methodology, G.-A.L. and H.O.; software, M.H.; data curation, H.-C.K., G.-A.L., H.O., N.R. and M.H.; data analysis, M.H.; writing—original draft preparation, M.H. and N.R.; writing—review and editing, M.H.; project administration, N.R.; funding acquisition, N.R. All authors have read and agreed to the published version of the manuscript.

Funding

This work was financially supported by Functional components character assessment of sorghum, barley, pumpkin and hot pepper germplasms (PJ015827) and Evaluating useful component, disease resistance and finding excellent resources in pepper and paprika germplasm (PJ014183), National Institute of Agricultural Sciences, RDA, Republic of Korea.

Institutional Review Board Statement

Not applicable.

Informed Consent Statement

Not applicable.

Data Availability Statement

The data used in this study are available in the manuscript and Supplementary File. For additional inquiries, please contact the corresponding author directly via email.

Acknowledgments

We gratefully acknowledge the financial support provided by the National Institute of Agricultural Science (NIAS), Rural Development Administration.

Conflicts of Interest

The authors declare no conflict of interest.

References

  1. Carrizo García, C.; Barfuss, M.H.J.; Sehr, E.M.; Barboza, G.E.; Samuel, R.; Moscone, E.A.; Ehrendorfer, F. Phylogenetic Relationships, Diversification and Expansion of Chili Peppers (Capsicum, Solanaceae). Ann. Bot. 2016, 118, 35–51. [Google Scholar] [CrossRef] [PubMed]
  2. Pickersgill, B. Genetic Resources and Breeding of Capsicum Spp. Euphytica 1997, 96, 129–133. [Google Scholar] [CrossRef]
  3. FAO. Food and Agriculture Organization of the United Nations Statistics Division. 2021. Available online: https://www.fao.org/faostat/en/#data/QCL/visualize (accessed on 20 February 2023).
  4. de Sá Mendes, N.; de Andrade Gonçalves, É.C.B. The Role of Bioactive Components Found in Peppers. Trends Food Sci. Technol. 2020, 99, 229–243. [Google Scholar] [CrossRef]
  5. Conforti, F.; Statti, G.A.; Menichini, F. Chemical and Biological Variability of Hot Pepper Fruits (Capsicum annuum var. acuminatum L.) in Relation to Maturity Stage. Food Chem. 2007, 102, 1096–1104. [Google Scholar] [CrossRef]
  6. Gurnani, N.; Gupta, M.; Mehta, D.; Mehta, B.K. Chemical Composition, Total Phenolic and Flavonoid Contents, and in Vitro Antimicrobial and Antioxidant Activities of Crude Extracts from Red Chilli Seeds (Capsicum frutescens L.). J. Taibah Univ. Sci. 2016, 10, 462–470. [Google Scholar] [CrossRef]
  7. Lu, M.; Ho, C.-T.; Huang, Q. Extraction, Bioavailability, and Bioefficacy of Capsaicinoids. J. Food Drug Anal. 2017, 25, 27–36. [Google Scholar] [CrossRef]
  8. Van Duyn, M.A.S.; Pivonka, E. Overview of the Health Benefits of Fruit and Vegetable Consumption for the Dietetics Professional. J. Am. Diet. Assoc. 2000, 100, 1511–1521. [Google Scholar] [CrossRef]
  9. Cruz, J.G.; Silveira, T.; Richter, V.; Wagner, J.G.; Neitzke, R.S.; Barbieri, R.L.; Vizzotto, M. Genetic Variability of Bioactive Compounds in Capsicum chinense. Food Sci. Technol. 2022, 42, e123721. [Google Scholar] [CrossRef]
  10. Sarpras, M.; Chhapekar, S.S.; Ahmad, I.; Abraham, S.K.; Ramchiary, N. Analysis of Bioactive Components in Ghost Chili (Capsicum chinense) for Antioxidant, Genotoxic, and Apoptotic Effects in Mice. Drug Chem. Toxicol. 2020, 43, 182–191. [Google Scholar] [CrossRef]
  11. Sharma, J.; Sharma, P.; Sharma, B.; Chaudhary, P. In-Vitro Estimation of Antioxidant Activity in Green Chilli (Capsicum annuum) and Yellow Lantern Chilli (Capsicum chinense). Int. J. Res. Rev. 2017, 4, 54–61. [Google Scholar]
  12. Sherova, G.; Pavlov, A.; Georgiev, V. Polyphenols Profiles and Antioxidant Activities of Extracts from Capsicum chinense in Vitro Plants and Callus Cultures. FSAB 2019, 2, 30. [Google Scholar] [CrossRef]
  13. Salehi, B.; Hernández-Álvarez, A.J.; Del Mar Contreras, M.; Martorell, M.; Ramírez-Alarcón, K.; Melgar-Lalanne, G.; Matthews, K.R.; Sharifi-Rad, M.; Setzer, W.N.; Nadeem, M.; et al. Potential Phytopharmacy and Food Applications of Capsicum Spp.: A Comprehensive Review. Nat. Prod. Commun. 2018, 13, 1934578X1801301. [Google Scholar] [CrossRef]
  14. da Silveira Agostini-Costa, T.; da Silva Gomes, I.; de Melo, L.A.M.P.; Reifschneider, F.J.B.; da Costa Ribeiro, C.S. Carotenoid and Total Vitamin C Content of Peppers from Selected Brazilian Cultivars. J. Food Compos. Anal. 2017, 57, 73–79. [Google Scholar] [CrossRef]
  15. Rodríguez-Burruezo, A.; González-Mas, M.D.C.; Nuez, F. Carotenoid Composition and Vitamin A Value in Ají (Capsicum Baccatum L.) and Rocoto (C. pubescens R. & P.), 2 Pepper Species from the Andean Region. J. Food Sci. 2010, 75, S446–S453. [Google Scholar] [CrossRef]
  16. Carvalho, A.V.; de Andrade Mattietto, R.; de Oliveira Rios, A.; de Almeida Maciel, R.; Moresco, K.S.; de Souza Oliveira, T.C. Bioactive Compounds and Antioxidant Activity of Pepper (Capsicum sp.) Genotypes. J. Food Sci. Technol. 2015, 52, 7457–7464. [Google Scholar] [CrossRef]
  17. Thuphairo, K.; Sornchan, P.; Suttisansanee, U. Bioactive Compounds, Antioxidant Activity and Inhibition of Key Enzymes Relevant to Alzheimer’s Disease from Sweet Pepper (Capsicum annuum) Extracts. Prev. Nutr. Food Sci. 2019, 24, 327–337. [Google Scholar] [CrossRef]
  18. Mohd Hassan, N.; Yusof, N.A.; Yahaya, A.F.; Mohd Rozali, N.N.; Othman, R. Carotenoids of Capsicum Fruits: Pigment Profile and Health-Promoting Functional Attributes. Antioxidants 2019, 8, 469. [Google Scholar] [CrossRef]
  19. Bae, H.; Jayaprakasha, G.K.; Crosby, K.; Yoo, K.S.; Leskovar, D.I.; Jifon, J.; Patil, B.S. Ascorbic Acid, Capsaicinoid, and Flavonoid Aglycone Concentrations as a Function of Fruit Maturity Stage in Greenhouse-Grown Peppers. J. Food Compos. Anal. 2014, 33, 195–202. [Google Scholar] [CrossRef]
  20. Dias, A.L.B.; Arroio Sergio, C.S.; Santos, P.; Barbero, G.F.; Rezende, C.A.; Martínez, J. Effect of Ultrasound on the Supercritical CO2 Extraction of Bioactive Compounds from Dedo de Moça Pepper (Capsicum baccatum L. var. pendulum). Ultrason. Sonochem. 2016, 31, 284–294. [Google Scholar] [CrossRef]
  21. Menichini, F.; Tundis, R.; Bonesi, M.; Loizzo, M.; Conforti, F.; Statti, G.; Decindio, B.; Houghton, P.; Menichini, F. The Influence of Fruit Ripening on the Phytochemical Content and Biological Activity of Capsicum chinense Jacq. cv Habanero. Food Chem. 2009, 114, 553–560. [Google Scholar] [CrossRef]
  22. Collins, M.D.; Wasmund, L.M.; Bosland, P.W. Improved Method for Quantifying Capsaicinoids in Capsicum Using High-Performance Liquid Chromatography. HortScience 1995, 30, 137–139. [Google Scholar] [CrossRef]
  23. Peña-Alvarez, A.; Ramírez-Maya, E.; Alvarado-Suárez, L.Á. Analysis of Capsaicin and Dihydrocapsaicin in Peppers and Pepper Sauces by Solid Phase Microextraction–Gas Chromatography–Mass Spectrometry. J. Chromatogr. A 2009, 1216, 2843–2847. [Google Scholar] [CrossRef]
  24. Usman, M.; Rafii, M.; Ismail, M.; Malek, M.; Latif, M. Capsaicin and Dihydrocapsaicin Determination in Chili Pepper Genotypes Using Ultra-Fast Liquid Chromatography. Molecules 2014, 19, 6474–6488. [Google Scholar] [CrossRef]
  25. Caterina, M.J.; Leffler, A.; Malmberg, A.B.; Martin, W.J.; Trafton, J.; Petersen-Zeitz, K.R.; Koltzenburg, M.; Basbaum, A.I.; Julius, D. Impaired Nociception and Pain Sensation in Mice Lacking the Capsaicin Receptor. Science 2000, 288, 306–313. [Google Scholar] [CrossRef]
  26. Caterina, M.J.; Schumacher, M.A.; Tominaga, M.; Rosen, T.A.; Levine, J.D.; Julius, D. The Capsaicin Receptor: A Heat-Activated Ion Channel in the Pain Pathway. Nature 1997, 389, 816–824. [Google Scholar] [CrossRef] [PubMed]
  27. Chu, C.J.; Huang, S.M.; De Petrocellis, L.; Bisogno, T.; Ewing, S.A.; Miller, J.D.; Zipkin, R.E.; Daddario, N.; Appendino, G.; Di Marzo, V.; et al. N-Oleoyldopamine, a Novel Endogenous Capsaicin-like Lipid That Produces Hyperalgesia. J. Biol. Chem. 2003, 278, 13633–13639. [Google Scholar] [CrossRef] [PubMed]
  28. Lee, R.J.; Yolton, R.L.; Yolton, D.P.; Schnider, C.; Janin, M.L. Personal Defense Sprays: Effects and Management of Exposure. J. Am. Optom. Assoc. 1996, 67, 548–560. [Google Scholar]
  29. Korte, A.; Farlow, A. The Advantages and Limitations of Trait Analysis with GWAS: A Review. Plant Methods 2013, 9, 29. [Google Scholar] [CrossRef] [PubMed]
  30. Uffelmann, E.; Huang, Q.Q.; Munung, N.S.; de Vries, J.; Okada, Y.; Martin, A.R.; Martin, H.C.; Lappalainen, T.; Posthuma, D. Genome-Wide Association Studies. Nat. Rev. Methods Primers 2021, 1, 59. [Google Scholar] [CrossRef]
  31. Iquira, E.; Humira, S.; François, B. Association Mapping of QTLs for Sclerotinia Stem Rot Resistance in a Collection of Soybean Plant Introductions Using a Genotyping by Sequencing (GBS) Approach. BMC Plant Biol. 2015, 15, 5. [Google Scholar] [CrossRef]
  32. Lin, M.; Cai, S.; Wang, S.; Liu, S.; Zhang, G.; Bai, G. Genotyping-by-Sequencing (GBS) Identified SNP Tightly Linked to QTL for Pre-Harvest Sprouting Resistance. Theor. Appl. Genet. 2015, 128, 1385–1395. [Google Scholar] [CrossRef] [PubMed]
  33. Owens, B.F.; Lipka, A.E.; Magallanes-Lundback, M.; Tiede, T.; Diepenbrock, C.H.; Kandianis, C.B.; Kim, E.; Cepela, J.; Mateos-Hernandez, M.; Buell, C.R.; et al. A Foundation for Provitamin A Biofortification of Maize: Genome-Wide Association and Genomic Prediction Models of Carotenoid Levels. Genetics 2014, 198, 1699–1716. [Google Scholar] [CrossRef] [PubMed]
  34. Poland, J.A.; Brown, P.J.; Sorrells, M.E.; Jannink, J.-L. Development of High-Density Genetic Maps for Barley and Wheat Using a Novel Two-Enzyme Genotyping-by-Sequencing Approach. PLoS ONE 2012, 7, e32253. [Google Scholar] [CrossRef] [PubMed]
  35. Zhang, D.; Kong, W.; Robertson, J.; Goff, V.H.; Epps, E.; Kerr, A.; Mills, G.; Cromwell, J.; Lugin, Y.; Phillips, C.; et al. Genetic Analysis of Inflorescence and Plant Height Components in Sorghum (Panicoidae) and Comparative Genetics with Rice (Oryzoidae). BMC Plant Biol. 2015, 15, 107. [Google Scholar] [CrossRef] [PubMed]
  36. Hamed, M.; Kalita, D.; Bartolo, M.E.; Jayanty, S.S. Capsaicinoids, Polyphenols and Antioxidant Activities of Capsicum annuum: Comparative Study of the Effect of Ripening Stage and Cooking Methods. Antioxidants 2019, 8, 364. [Google Scholar] [CrossRef]
  37. Rodríguez-Rodríguez, E.; Sánchez-Prieto, M.; Olmedilla-Alonso, B. Assessment of Carotenoid Concentrations in Red Peppers (Capsicum annuum) under Domestic Refrigeration for Three Weeks as Determined by HPLC-DAD. Food Chem. X 2020, 6, 100092. [Google Scholar] [CrossRef]
  38. Elvira-Torales, L.I.; García-Alonso, J.; Periago-Castón, M.J. Nutritional Importance of Carotenoids and Their Effect on Liver Health: A Review. Antioxidants 2019, 8, 229. [Google Scholar] [CrossRef]
  39. Giuffrida, D.; Dugo, P.; Torre, G.; Bignardi, C.; Cavazza, A.; Corradini, C.; Dugo, G. Characterization of 12 Capsicum Varieties by Evaluation of Their Carotenoid Profile and Pungency Determination. Food Chem. 2013, 140, 794–802. [Google Scholar] [CrossRef]
  40. Ben-Chaim, A.; Borovsky, Y.; Falise, M.; Mazourek, M.; Kang, B.-C.; Paran, I.; Jahn, M. QTL Analysis for Capsaicinoid Content in Capsicum. Theor. Appl. Genet. 2006, 113, 1481–1490. [Google Scholar] [CrossRef]
  41. Zewdie, Y.; Bosland, P.W. Evaluation of Genotype, Environment, and Genotype-by-Environment Interaction for Capsaicinoids in Capsicum annuum L. Euphytica 2000, 111, 185–190. [Google Scholar] [CrossRef]
  42. Kosuge, S.; Furuta, M. Studies on the Pungent Principle of Capsicum. Agric. Biol. Chem. 1970, 34, 248–256. [Google Scholar] [CrossRef]
  43. Antonious, G.F.; Kochhar, T.S.; Jarret, R.L.; Snyder, J.C. Antioxidants in Hot Pepper: Variation Among Accessions. J. Environ. Sci. Health Part B 2006, 41, 1237–1243. [Google Scholar] [CrossRef] [PubMed]
  44. González-Zamora, A.; Sierra-Campos, E.; Luna-Ortega, J.; Pérez-Morales, R.; Ortiz, J.; García-Hernández, J. Characterization of Different Capsicum Varieties by Evaluation of Their Capsaicinoids Content by High Performance Liquid Chromatography, Determination of Pungency and Effect of High Temperature. Molecules 2013, 18, 13471–13486. [Google Scholar] [CrossRef]
  45. Mori, A.; Lehmann, S.; O’Kelly, J.; Kumagai, T.; Desmond, J.C.; Pervan, M.; McBride, W.H.; Kizaki, M.; Koeffler, H.P. Capsaicin, a Component of Red Peppers, Inhibits the Growth of Androgen-Independent, P53 Mutant Prostate Cancer Cells. Cancer Res. 2006, 66, 3222–3229. [Google Scholar] [CrossRef] [PubMed]
  46. Laskaridou-Monnerville, A. Determination of Capsaicin and Dihydrocapsaicin by Micellar Electrokinetic Capillary Chromatography and Its Application to Various Species of Capsicum, Solanaceae. J. Chromatogr. A 1999, 838, 293–302. [Google Scholar] [CrossRef] [PubMed]
  47. Ro, N.; Haile, M.; Ko, H.-C.; Cho, G.-T.; Lee, J.; Kim, B.; Lee, S.; Kim, S.-H. Genome-Wide Association Study of Phenolic Content and Antioxidant Properties in Eggplant Germplasm. Genes 2023, 14, 1315. [Google Scholar] [CrossRef]
  48. Sukhumsirichart, W. Polymorphisms. In Genetic Diversity and Disease Susceptibility; Liu, Y., Ed.; InTech: London, UK, 2018; ISBN 978-1-78984-201-2. [Google Scholar]
  49. Greenbaum, J.; Wu, K.; Zhang, L.; Shen, H.; Zhang, J.; Deng, H.-W. Increased Detection of Genetic Loci Associated with Risk Predictors of Osteoporotic Fracture Using a Pleiotropic CFDR Method. Bone 2017, 99, 62–68. [Google Scholar] [CrossRef]
  50. Reddy, U.K.; Lopez-Ortiz, C.; Talavera-Caro, A.G.; Natarajan, P.; Tomason, Y.; Alaparthi, S.; Levi, A.; Nimmakayala, P. GWAS Resolves Molecular Mechanisms Underlying Natural Variation for Carotenoids in Cucurbita Maxima Duchesne. Sci. Hortic. 2023, 312, 111881. [Google Scholar] [CrossRef]
  51. Kang, C.; He, S.; Zhai, H.; Li, R.; Zhao, N.; Liu, Q. A Sweetpotato Auxin Response Factor Gene (IbARF5) Is Involved in Carotenoid Biosynthesis and Salt and Drought Tolerance in Transgenic Arabidopsis. Front. Plant Sci. 2018, 9, 1307. [Google Scholar] [CrossRef]
  52. Zhang, Q.; Gong, M.; Xu, X.; Li, H.; Deng, W. Roles of Auxin in the Growth, Development, and Stress Tolerance of Horticultural Plants. Cells 2022, 11, 2761. [Google Scholar] [CrossRef]
  53. Wang, P.; Shen, L.; Guo, J.; Jing, W.; Qu, Y.; Li, W.; Bi, R.; Xuan, W.; Zhang, Q.; Zhang, W. Phosphatidic Acid Directly Regulates PINOID-Dependent Phosphorylation and Activation of the PIN-FORMED2 Auxin Efflux Transporter in Response to Salt Stress. Plant Cell 2019, 31, 250–271. [Google Scholar] [CrossRef] [PubMed]
  54. Wang, Y.; Zhang, T.; Wang, R.; Zhao, Y. Recent Advances in Auxin Research in Rice and Their Implications for Crop Improvement. J. Exp. Bot. 2018, 69, 255–263. [Google Scholar] [CrossRef] [PubMed]
  55. Matthes, M.S.; Best, N.B.; Robil, J.M.; Malcomber, S.; Gallavotti, A.; McSteen, P. Auxin EvoDevo: Conservation and Diversification of Genes Regulating Auxin Biosynthesis, Transport, and Signaling. Mol. Plant 2019, 12, 298–320. [Google Scholar] [CrossRef] [PubMed]
  56. Gill, R.A.; Ahmar, S.; Ali, B.; Saleem, M.H.; Khan, M.U.; Zhou, W.; Liu, S. The Role of Membrane Transporters in Plant Growth and Development, and Abiotic Stress Tolerance. Int. J. Mol. Sci. 2021, 22, 12792. [Google Scholar] [CrossRef]
  57. Harper, R.M.; Stowe-Evans, E.L.; Luesse, D.R.; Muto, H.; Tatematsu, K.; Watahiki, M.K.; Yamamoto, K.; Liscum, E. The NPH4 Locus Encodes the Auxin Response Factor ARF7, a Conditional Regulator of Differential Growth in Aerial Arabidopsis Tissue. Plant Cell 2000, 12, 757–770. [Google Scholar] [CrossRef]
  58. Waller, F.; Furuya, M.; Nick, P. OsARF1, an Auxin Response Factor from Rice, Is Auxin-Regulated and Classifies as a Primary Auxin Responsive Gene. Plant Mol. Biol. 2002, 50, 415–425. [Google Scholar] [CrossRef]
  59. Ellis, C.M.; Nagpal, P.; Young, J.C.; Hagen, G.; Guilfoyle, T.J.; Reed, J.W. AUXIN RESPONSE FACTOR1 and AUXIN RESPONSE FACTOR2 Regulate Senescence and Floral Organ Abscission in Arabidopsis thaliana. Development 2005, 132, 4563–4574. [Google Scholar] [CrossRef]
  60. Okushima, Y.; Overvoorde, P.J.; Arima, K.; Alonso, J.M.; Chan, A.; Chang, C.; Ecker, J.R.; Hughes, B.; Lui, A.; Nguyen, D.; et al. Functional Genomic Analysis of the AUXIN RESPONSE FACTOR Gene Family Members in Arabidopsis thaliana: Unique and Overlapping Functions of ARF7 and ARF19. Plant Cell 2005, 17, 444–463. [Google Scholar] [CrossRef]
  61. Wilmoth, J.C.; Wang, S.; Tiwari, S.B.; Joshi, A.D.; Hagen, G.; Guilfoyle, T.J.; Alonso, J.M.; Ecker, J.R.; Reed, J.W. NPH4/ARF7 and ARF19 Promote Leaf Expansion and Auxin-Induced Lateral Root Formation: ARF Proteins Regulate Auxin-Induced Root Formation. Plant J. 2005, 43, 118–130. [Google Scholar] [CrossRef]
  62. Wang, L.; Hua, D.; He, J.; Duan, Y.; Chen, Z.; Hong, X.; Gong, Z. Auxin Response Factor2 (ARF2) and Its Regulated Homeodomain Gene HB33 Mediate Abscisic Acid Response in Arabidopsis. PLoS Genet. 2011, 7, e1002172. [Google Scholar] [CrossRef]
  63. Ren, Z.; Liu, R.; Gu, W.; Dong, X. The Solanum Lycopersicum Auxin Response Factor SlARF2 Participates in Regulating Lateral Root Formation and Flower Organ Senescence. Plant Sci. 2017, 256, 103–111. [Google Scholar] [CrossRef] [PubMed]
  64. Ledent, V.; Vervoort, M. The Basic Helix-Loop-Helix Protein Family: Comparative Genomics and Phylogenetic Analysis. Genome Res. 2001, 11, 754–770. [Google Scholar] [CrossRef]
  65. Toledo-Ortiz, G.; Huq, E.; Quail, P.H. The Arabidopsis Basic/Helix-Loop-Helix Transcription Factor Family. Plant Cell 2003, 15, 1749–1770. [Google Scholar] [CrossRef]
  66. Liu, R.; Song, J.; Liu, S.; Chen, C.; Zhang, S.; Wang, J.; Xiao, Y.; Cao, B.; Lei, J.; Zhu, Z. Genome-Wide Identification of the Capsicum BHLH Transcription Factor Family: Discovery of a Candidate Regulator Involved in the Regulation of Species-Specific Bioactive Metabolites. BMC Plant Biol. 2021, 21, 262. [Google Scholar] [CrossRef]
  67. Luo, F.; Cai, J.-H.; Kong, X.-M.; Zhou, Q.; Zhou, X.; Zhao, Y.-B.; Ji, S.-J. Transcriptome Profiling Reveals the Roles of Pigment Mechanisms in Postharvest Broccoli Yellowing. Hortic. Res. 2019, 6, 74. [Google Scholar] [CrossRef]
  68. Bouige, P.; Laurent, D.; Piloyan, L.; Dassa, E. Phylogenetic and Functional Classification of ATP-Binding Cassette (ABC) Systems. Curr. Protein Pept. Sci. 2002, 3, 541–559. [Google Scholar] [CrossRef] [PubMed]
  69. Kim, J.K.; Lee, S.Y.; Chu, S.M.; Lim, S.H.; Suh, S.-C.; Lee, Y.-T.; Cho, H.S.; Ha, S.-H. Variation and Correlation Analysis of Flavonoids and Carotenoids in Korean Pigmented Rice (Oryza sativa L.) Cultivars. J. Agric. Food Chem. 2010, 58, 12804–12809. [Google Scholar] [CrossRef]
  70. Lee, H.-Y.; Ro, N.-Y.; Jeong, H.-J.; Kwon, J.-K.; Jo, J.; Ha, Y.; Jung, A.; Han, J.-W.; Venkatesh, J.; Kang, B.-C. Genetic Diversity and Population Structure Analysis to Construct a Core Collection from a Large Capsicum Germplasm. BMC Genet. 2016, 17, 142. [Google Scholar] [CrossRef]
  71. De Donato, M.; Peters, S.O.; Mitchell, S.E.; Hussain, T.; Imumorin, I.G. Genotyping-by-Sequencing (GBS): A Novel, Efficient and Cost-Effective Genotyping Method for Cattle Using Next-Generation Sequencing. PLoS ONE 2013, 8, e62137. [Google Scholar] [CrossRef]
  72. Elshire, R.J.; Glaubitz, J.C.; Sun, Q.; Poland, J.A.; Kawamoto, K.; Buckler, E.S.; Mitchell, S.E. A Robust, Simple Genotyping-by-Sequencing (GBS) Approach for High Diversity Species. PLoS ONE 2011, 6, e19379. [Google Scholar] [CrossRef]
  73. Martin, M. Cutadapt Removes Adapter Sequences from High-Throughput Sequencing Reads. EMBnet J. 2011, 17, 10. [Google Scholar] [CrossRef]
  74. Cox, M.P.; Peterson, D.A.; Biggs, P.J. SolexaQA: At-a-Glance Quality Assessment of Illumina Second-Generation Sequencing Data. BMC Bioinform. 2010, 11, 485. [Google Scholar] [CrossRef] [PubMed]
  75. Li, H.; Handsaker, B.; Wysoker, A.; Fennell, T.; Ruan, J.; Homer, N.; Marth, G.; Abecasis, G.; Durbin, R. 1000 Genome Project Data Processing Subgroup The Sequence Alignment/Map Format and SAMtools. Bioinformatics 2009, 25, 2078–2079. [Google Scholar] [CrossRef] [PubMed]
  76. Kim, J.-E.; Oh, S.-K.; Lee, J.-H.; Lee, B.-M.; Jo, S.-H. Genome-Wide SNP Calling Using Next Generation Sequencing Data in Tomato. Mol. Cells 2014, 37, 36–42. [Google Scholar] [CrossRef] [PubMed]
  77. Browning, S.R.; Browning, B.L. Rapid and Accurate Haplotype Phasing and Missing-Data Inference for Whole-Genome Association Studies By Use of Localized Haplotype Clustering. Am. J. Hum. Genet. 2007, 81, 1084–1097. [Google Scholar] [CrossRef] [PubMed]
  78. QTLmax Global. QTLmax 3.0: A Genetic Analysis Toolset for Enterprises. 2022. Katy, TX, USA. Available online: https://www.qtlmax.com (accessed on 20 February 2023).
Figure 1. The heatmap correlation of carotenoids and capsaicinoids in 160 C. chinense germplasms. The heatmap displays Pearson’s correlation values, with colors indicating the strength and direction of the correlations, located on the right side of the picture. The carotenoids and capsaicinoids are labeled as follows: A: violaxanthin, B: antheraxanthin, C: capsorubin, D: capsanthin, E: zeaxanthin, F: β-cryptoxanthin, G: α-carotene, and H: β-carotene. The capsaicinoids are represented by I: capsaicin and J: dihydrocapsaicin. Significance levels are indicated with *, **, and *** for p < 0.05, p < 0.01, and p < 0.001, respectively.
Ijms 24 13885 g001
Figure 2. The distribution patterns of SNPs across all 12 chromosomes from 160 C. chinense accessions are illustrated using a 1 Mb window size. The heatmap colors in the figure visually represent the density of the SNPs, offering insights into their distribution patterns.
Ijms 24 13885 g002
Figure 3. Manhattan plots illustrating the association between carotenoids ((A): violaxanthin, (B): antheraxanthin, (C): capsorubin, (D): capsanthin, (E): zeaxanthin, (F): β-cryptoxanthin, (G): α-carotene and (H): β-carotene) and capsaicinoids ((I): capsaicin and (J): dihydrocapsaicin) using 160 C. chinense accessions. Each dot in the plot represents a single SNP, where the x-axis denotes the genomic location, with chromosomes colored and labeled accordingly. The y-axis represents the association level, measured as −log10(p). The blue line (−log10(p) = 6) corresponds to a significance threshold of p < 0.05, while the red line (−log10(p) = 6.7) represents a more stringent significance threshold of p < 0.01. The horizontal blue and red lines indicate the Benferroni-corrected significance thresholds for the association of SNPs with traits.
Ijms 24 13885 g003
Figure 4. Box plots illustrating the allelic effect of selected SNP markers significantly associated with various chemical traits. The chemical traits depicted include violaxanthin (A,B), capsorubin (C,D), capsanthin (E), zeaxanthin (F,G), α-carotene (H,I), and dihydrocapsaicin (JL). The x-axis represents the alleles found at specific chromosomes and positions, while the y-axis represents the average values of the chemical traits.
Ijms 24 13885 g004
Table 1. The descriptive statistical summary of carotenoids and capsaicinoid content in 160 C. chinense genetic resources.
TraitsRange (mg/100 g)Mean (mg/100 g)SESDCount
Violaxanthin0–168.8943.912.6133.01160
Antheraxanthin0–445.35127.537.6496.61160
Capsorubin0–501.476.536.5082.24160
Capsanthin0–1120.95299.9218.31231.59160
Zeaxanthin0–190.3634.452.4731.24160
β-Cryptoxanthin0–81.818.370.8510.71160
α-Carotene0–70.8712.401.0613.45160
β-Carotene0–184.3354.092.9637.42160
Capsaicin0–11,632.931836.97158.682007.22160
Dihydrocapsaicin0–8038.17892.5891.011151.15160
Note: Values in the table are provided in mg/100 g units. SE: standard error, SD: Standard deviation.
Table 2. List of selected significantly associated SNPs with carotenoids and capsaicinoids in pepper (C. chinense) genetic resources.
TraitsChr.Reference AlleleAlternate AllelePosition
(bp.)
p.Value−Log10 (p.Value)FeatureMinor AlleleMajor Allele
Violaxanthin12GA221,085,3071.21 × 10−76.92GenicAG
03TA211,135,2201.77 × 10−76.75GenicTA
07AC223,699,7764.43 × 10−76.35IntergenicAC
12CT221,105,0426.71 × 10−76.17IntergenicTC
Antheraxanthin12GA221,085,3075.24 × 10−87.28GenicAG
12CT221,105,0421.02 × 10−66.00IntergenicTC
Capsorubin09GA228,612,2201.65 × 10−1312.78IntergenicGA
08CT194,188,4071.77 × 10−1312.75GenicCT
03TA211,135,2206.32 × 10−1312.20GenicTA
03CT7,882,1231.67 × 10−1211.78GenicCT
05GG41,033,9493.47 × 10−1211.46GenicGC
08CA193,486,3476.22 × 10−1211.21IntergenicCA
07CA7,431,9331.73 × 10−1110.76GenicAC
03AG97,513,2862.51 × 10−1110.60IntergenicAG
09CT16,302,6493.53 × 10−1110.45IntergenicCT
09GC252,016,6489.07 × 10−1110.04GenicGC
02CT136,572,3331.79 × 10−109.75GenicCT
03AG180,540,6843.08 × 10−109.51IntergenicAG
03TA39,034,8264.04 × 10−109.39GenicTA
05TC180,424,7899.00 × 10−109.05GenicTC
04AG29,271,6962.06 × 10−98.69GenicAG
08AG176,546,5013.91 × 10−98.41GenicAG
08AG176,546,6593.91 × 10−98.41GenicAG
02AG136,573,7883.94 × 10−98.40IntergenicAG
09TC10,001,2014.58 × 10−98.34GenicTC
07CT7,389,0256.12 × 10−98.21IntergenicTC
07TC7,389,1336.12 × 10−98.21IntergenicCT
04AC214,280,1508.99 × 10−98.05IntergenicAC
12AG223,949,8351.11 × 10−87.95IntergenicAG
07CA233,954,6701.12 × 10−87.95GenicCA
Capsanthin10TC8,626,6082.17 × 10−76.66IntergenicCT
02CT136,572,3332.49 × 10−76.60GenicCT
12GA221,085,3073.24 × 10−76.49GenicAG
06GA240,758,5276.70 × 10−76.17GenicAG
10AG8,625,8788.68 × 10−76.06IntergenicGA
Zeaxanthin03TC273,399,1192.99 × 10−1110.52GenicCT
07CT209,703,8122.03 × 10−109.69IntergenicTC
01CC13,088,3522.29 × 10−109.64IntergenicTC
01TT13,088,4062.29 × 10−109.64IntergenicGT
03TC250,691,6562.29 × 10−109.64GenicCT
04AC221,648,1092.29 × 10−109.64GenicCA
04GA232,075,1902.29 × 10−109.64GenicAG
08AG158,075,4132.29 × 10−109.64IntergenicGA
09AC124,336,6522.29 × 10−109.64IntergenicCA
09AG135,166,4492.29 × 10−109.64GenicGA
03TG31,436,1931.10 × 10−98.96GenicGT
08TC135,871,1141.10 × 10−98.96GenicCT
08GA135,910,5831.10 × 10−98.96GenicAG
08GA167,703,2211.10 × 10−98.96GenicAG
08TA167,703,3651.10 × 10−98.96GenicAT
08CT170,330,8541.10 × 10−98.96GenicTC
09AC144,268,0101.10 × 10−98.96IntergenicCA
12GC9,887,8701.10 × 10−98.96GenicCG
12TC10,065,7871.10 × 10−98.96IntergenicCT
12TC23,244,2951.10 × 10−98.96IntergenicCT
12TA10,062,8994.11 × 10−98.39IntergenicAT
β-Cryptoxanthin03AG50,199,8342.41 × 10−1110.62GenicGA
03CT234,486,9914.89 × 10−87.31IntergenicTC
06CT222,803,4631.08 × 10−76.97GenicTC
α-Carotene09AG1,449,4308.02 × 10−76.10GenicAG
12CT221,317,2419.17 × 10−76.04genicTC
Dihydrocapsaicin08TC25,161,3294.61 × 10−98.34IntergenicCT
01AG208,666,7495.36 × 10−98.27GenicGA
01AT209,615,4785.36 × 10−98.27GenicTA
01GA214,441,8155.36 × 10−98.27IntergenicAG
01GA214,441,9175.36 × 10−98.27IntergenicAG
01CT214,442,5845.36 × 10−98.27IntergenicTC
01TC132,753,1201.07 × 10−87.97IntergenicCT
01CA176,184,7021.72 × 10−87.77GenicAC
06GT27,230,4046.43 × 10−87.19GenicTG
07AC6,571,0839.69 × 10−87.01IntergenicCA
Table 3. SNP markers showing pleiotropic effects among the different carotenoids.
TraitsChr.AllelePositions (bp.)−Log10
(p-Value)
FeatureGeneDescriptions
Violaxanthin, antheraxanthin, capsorubin and capsanthinChr12A/G221,085,3076.92GenicCA12g193806,7-dimethyl-8-ribityllumazine synthase
Violaxanthin and antheraxanthinChr12T/C221,105,0426.01Intergenic--
Violaxanthin and capsorubinChr07A/C223,699,7766.35Intergenic--
Chr03A/T211,135,2206.75GenicCA03g181604-hydroxycinnamoyl-CoA ligase 2
Capsorubin and capsanthinChr02T/C136,572,3339.75GenicCA02g25010Detected protein of unknown function
Disclaimer/Publisher’s Note: The statements, opinions and data contained in all publications are solely those of the individual author(s) and contributor(s) and not of MDPI and/or the editor(s). MDPI and/or the editor(s) disclaim responsibility for any injury to people or property resulting from any ideas, methods, instructions or products referred to in the content.

