Article

Distinct Roles for COMPASS Core Subunits Set1, Trx, and Trr in the Epigenetic Regulation of Drosophila Heart Development

1
Center for Precision Disease Modeling, Department of Medicine, University of Maryland School of Medicine, Baltimore, MD 21201, USA
2
Division of Endocrinology, Diabetes and Nutrition, Department of Medicine, University of Maryland School of Medicine, Baltimore, MD 21201, USA
*
Authors to whom correspondence should be addressed.
Current address: Onco4 Inc., Rockville, MD 20850, USA.
Int. J. Mol. Sci. 2023, 24(24), 17314; https://doi.org/10.3390/ijms242417314
Submission received: 15 November 2023 / Revised: 5 December 2023 / Accepted: 5 December 2023 / Published: 9 December 2023

Abstract

:
Highly evolutionarily conserved multiprotein complexes termed Complex of Proteins Associated with Set1 (COMPASS) are required for histone 3 lysine 4 (H3K4) methylation. Drosophila Set1, Trx, and Trr form the core subunits of these complexes. We show that flies deficient in any of these three subunits demonstrated high lethality at eclosion (emergence of adult flies from their pupal cases) and significantly shortened lifespans for the adults that did emerge. Silencing Set1, trx, or trr in the heart led to a reduction in H3K4 monomethylation (H3K4me1) and dimethylation (H3K4me2), reflecting their distinct roles in H3K4 methylation. Furthermore, we studied the gene expression patterns regulated by Set1, Trx, and Trr. Each of the COMPASS core subunits controls the methylation of different sets of genes, with many metabolic pathways active early in development and throughout, while muscle and heart differentiation processes were methylated during later stages of development. Taken together, our findings demonstrate the roles of COMPASS series complex core subunits Set1, Trx, and Trr in regulating histone methylation during heart development and, given their implication in congenital heart diseases, inform research on heart disease.

1. Introduction

Histone modifications strongly influence gene expression levels in fetal and adult hearts [1,2,3,4]. In particular, the methylation status of histone H3 lysine 4 (H3K4) is strongly associated with gene expression activity through regulating transcription factor access to chromatin, transcriptional fidelity, and splicing outcomes [5]. These features are highly conserved in heart development from insects to mammals. In addition, mutations in histone-modifying genes are enriched, i.e., present more than expected by chance, among genes with de novo variants in patients with congenital heart disease [6].
A series of multiprotein complexes termed Complex of Proteins Associated with Set1 (COMPASS) are involved in H3K4 methylation [7]. Their components are greatly conserved from flies to mammals [7,8,9,10]. In mammals, the Lysine methyltransferase (KMT/Mixed Lineage Leukemia, MLL) family genes KMT2A, KMT2B, KMT2C, KMT2D, SETD1A, and SETD1B encode core subunits of COMPASS series complexes. All these core subunits share a Su(var)3–9, Enhancer-of-zeste, and Trithorax (SET) domain, which plays a fundamental role in the epigenetic regulation of gene expression [11,12]. Previous studies have implicated KMT family genes in many diverse cancer types [13,14]. More recently, de novo mutations in KMT2A in patients with congenital heart disease have been reported [15,16]. In addition, 18 mutations in KMT2C have been identified in patients with congenital heart disease [17]. In line with the patient data, a mouse model in which the KMT2C SET domain was deleted, showed abnormal heart development and ventricular septal defects [17]. Finally, KMT2D has been shown to regulate cardiac gene expression during heart development primarily via H3K4 dimethylation [18]. Indeed, loss of KMT2D led to significant heart defects in both mice and zebrafish [18,19,20,21]. In addition, mutations in KMT2D have been associated with Kabuki syndrome, a congenital disorder marked by multiple malformations, the most prominent of which are distinctive craniofacial features [22]. Of the patients with mutations in KMT2D, 70% presented with congenital heart disease [23]. These studies demonstrate the importance of KMT family members in heart development and their association with congenital heart disease. However, the exact roles of these COMPASS core subunits in heart development remain unclear, as does whether the other KMT family members (KMT2B, SETD1A, and SETD1B) play equally important roles during heart development.
To gain further insight into the role of KMT family members in cardiac development, we used Drosophila, an established model system to study heart development and disease [24]. In fact, we previously used a Drosophila high-throughput in vivo functional screen to validate candidate genes identified from congenital heart disease patient genomic sequencing [25]. We found that heart-specific silencing of histone-modifying genes, including H3K4 methylases, led to heart morphological and functional defects [25]. Three COMPASS series complexes are known for Drosophila: Set1/COMPASS, Trithorax COMPASS-like, and Trithorax-related COMPASS-like. Each of their core subunits—Set1, Trx, and Trr—conveys H3K4 methyltransferase activity [7,8]. Recently, we showed that fly Lpt and Trr function together, equivalent to mammalian KMT2C and KMT2D, in H3K4 methylation that regulates transcription during heart development [10]. Here, we looked even earlier in development and show that cardiac-specific silencing of the core subunits of the Drosophila COMPASS series complex disrupted methylation patterns in cardiomyocytes and led to structural and functional cardiac defects. We studied fly SET domain containing 1 (Set1), the homolog of human SET1DA and SETD1B; fly trithorax (trx), the homolog of human KMT2A and KMT2B; and fly trithorax-related (trr), the homolog of human KMT2C and KMT2D. We combined the structural and functional heart outcomes with transcriptomics following Set1, trx, or trr silencing in the fly heart. The data indicate distinct roles for Set1, Trx, and Trr in the regulation of histone methylation at specific times (early vs. late) during fly heart development.

2. Results

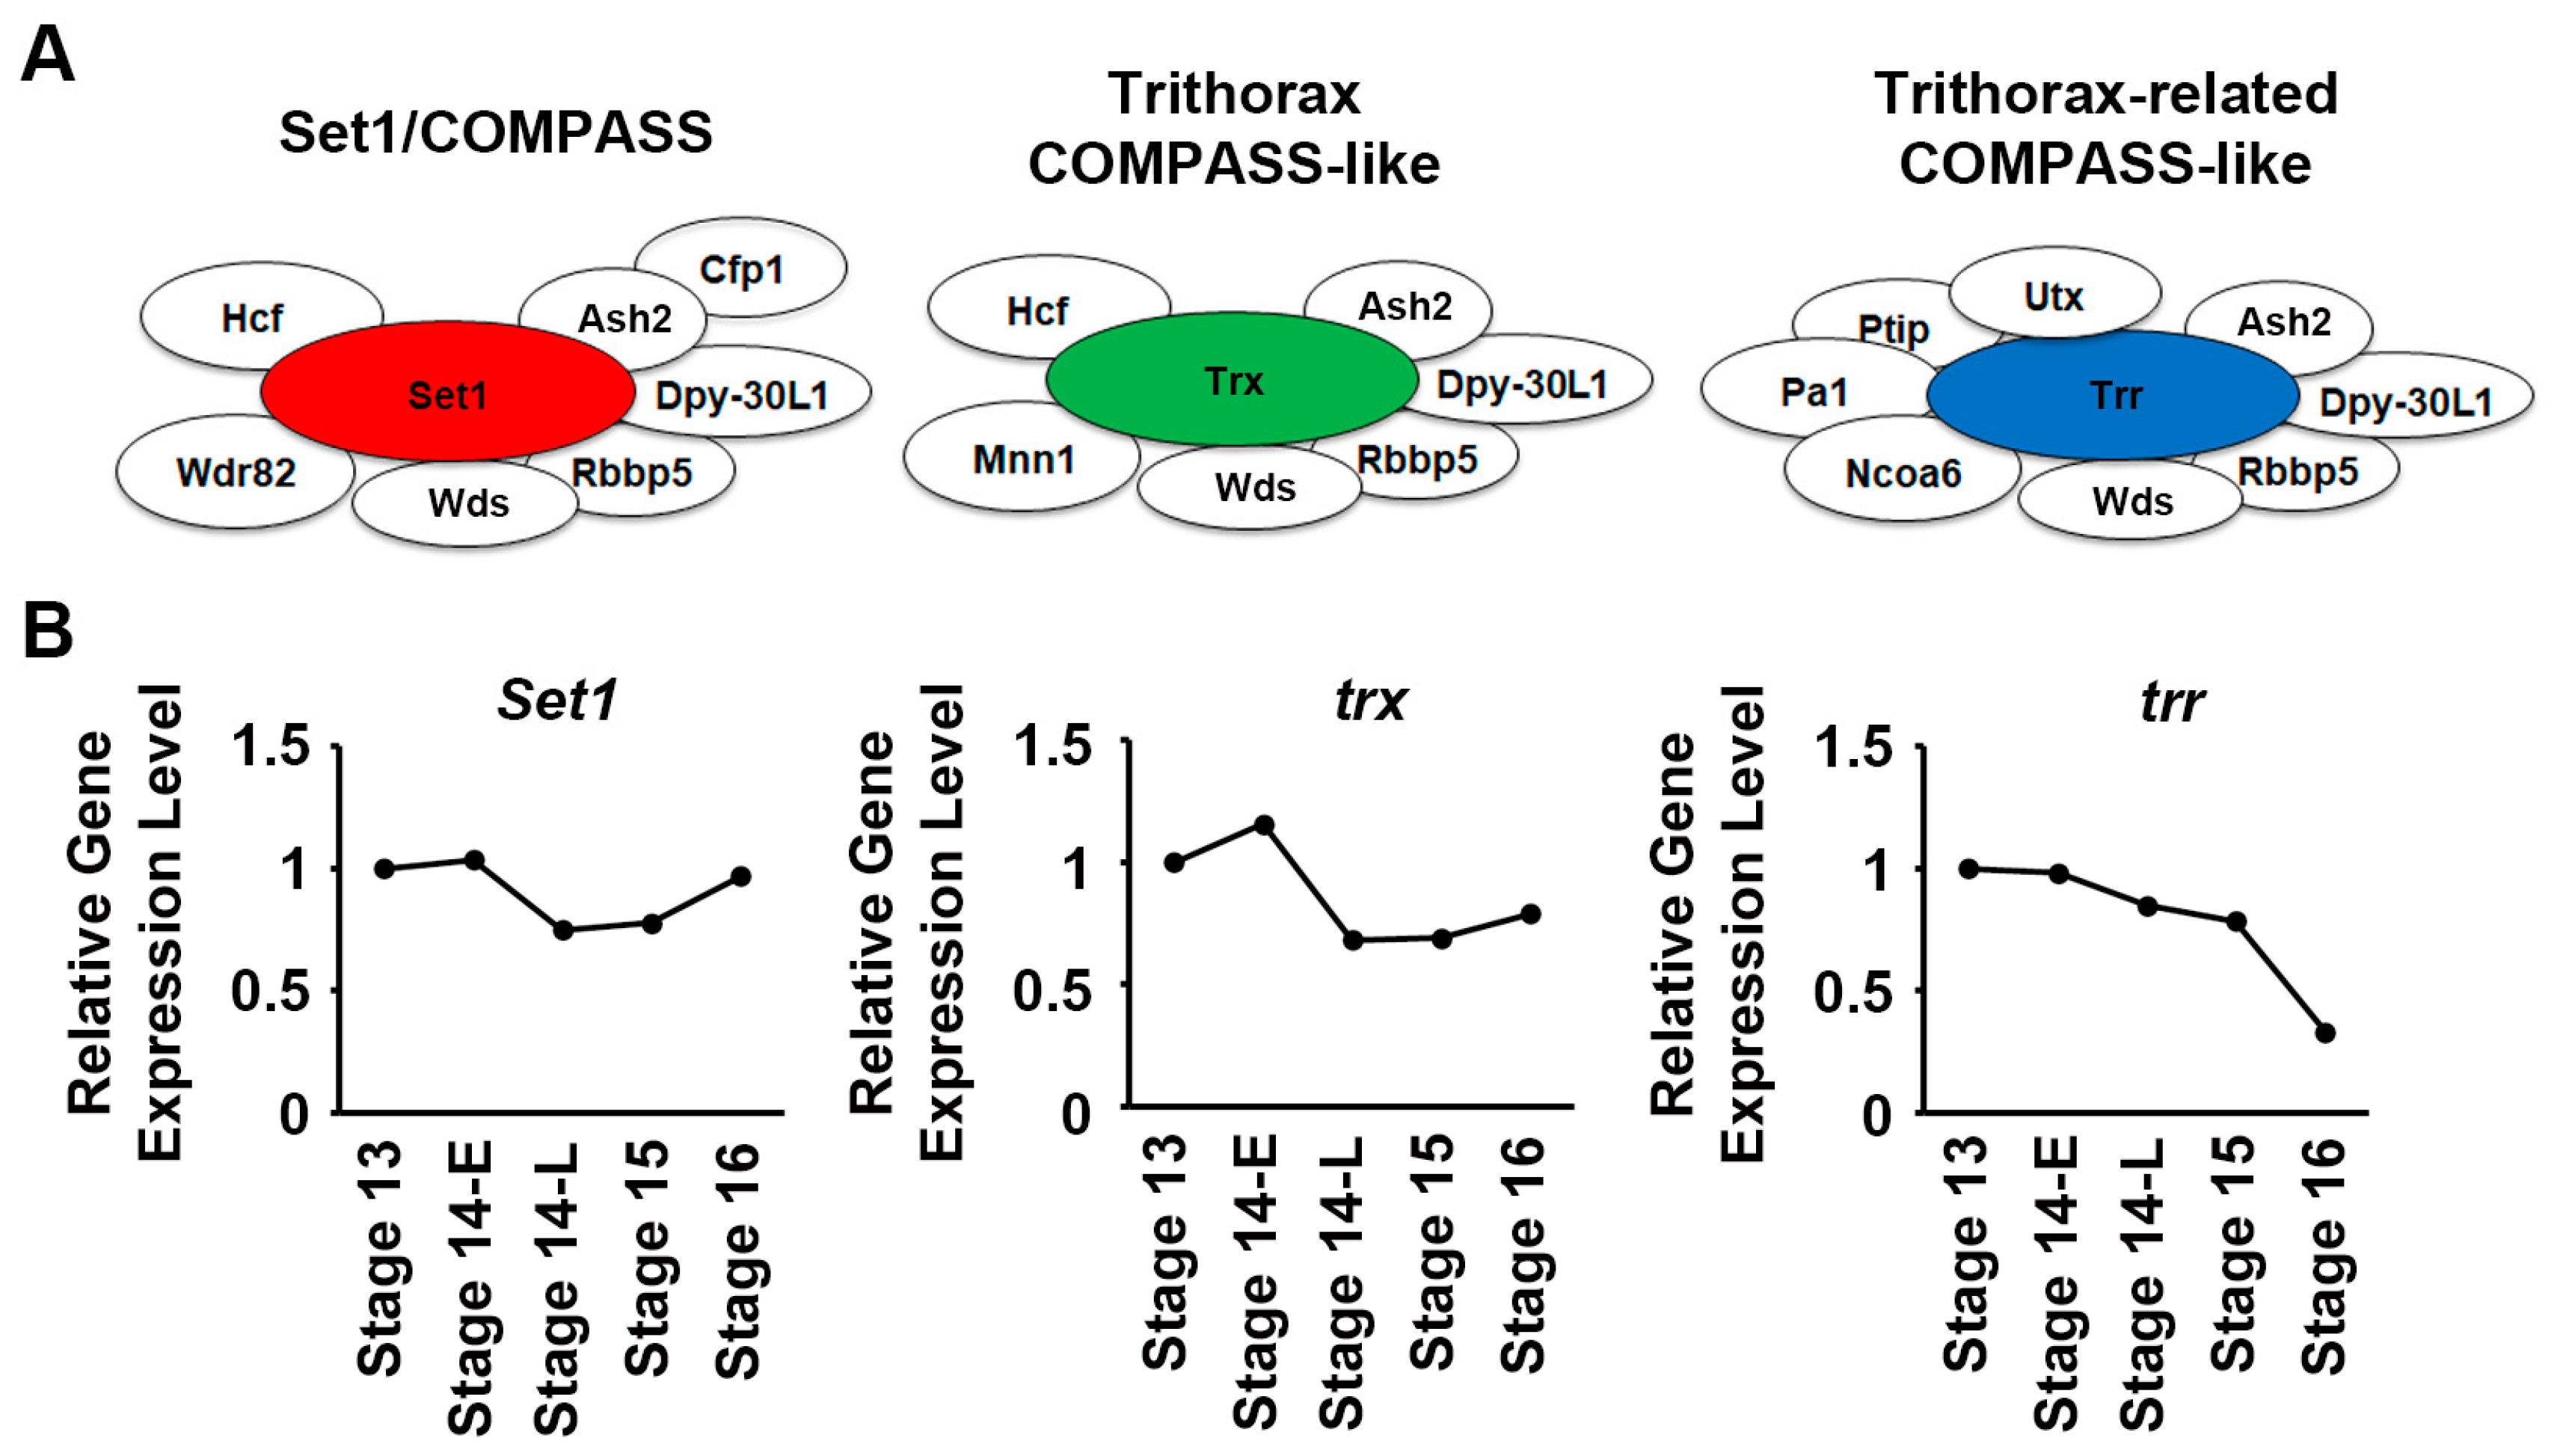
2.1. Temporal Expression Patterns of Set1, Trx, and Trr across Embryonic Heart Developmental Stages in Flies

The COMPASS series complexes share many components, and at their core, each has a histone H3K4 methyltransferase subunit that marks the complex. In Drosophila, these are Set1/COMPASS, Trithorax COMPASS-like, and Trithorax-related COMPASS-like (Figure 1A). To gain knowledge about the role of these COMPASS complexes, we first looked at the expression levels of the genes encoding these core H3K4 methyltransferases in cardiac progenitor cells from our single-cell RNAseq data [26]. Cells were collected during critical developmental stages of Drosophila heart development; from the migration of bilateral rows of cardiac progenitors (stage 13 onward) to the formation of a closed heart tube (stage 16). Set1 and trx showed steady expression levels throughout development; however, while not quite reaching significance, trr showed a 30–40% drop in expression by stage 16 (Figure 1B). This raises the question of whether this minor shift in trr expression signifies any functional changes at the cellular level.

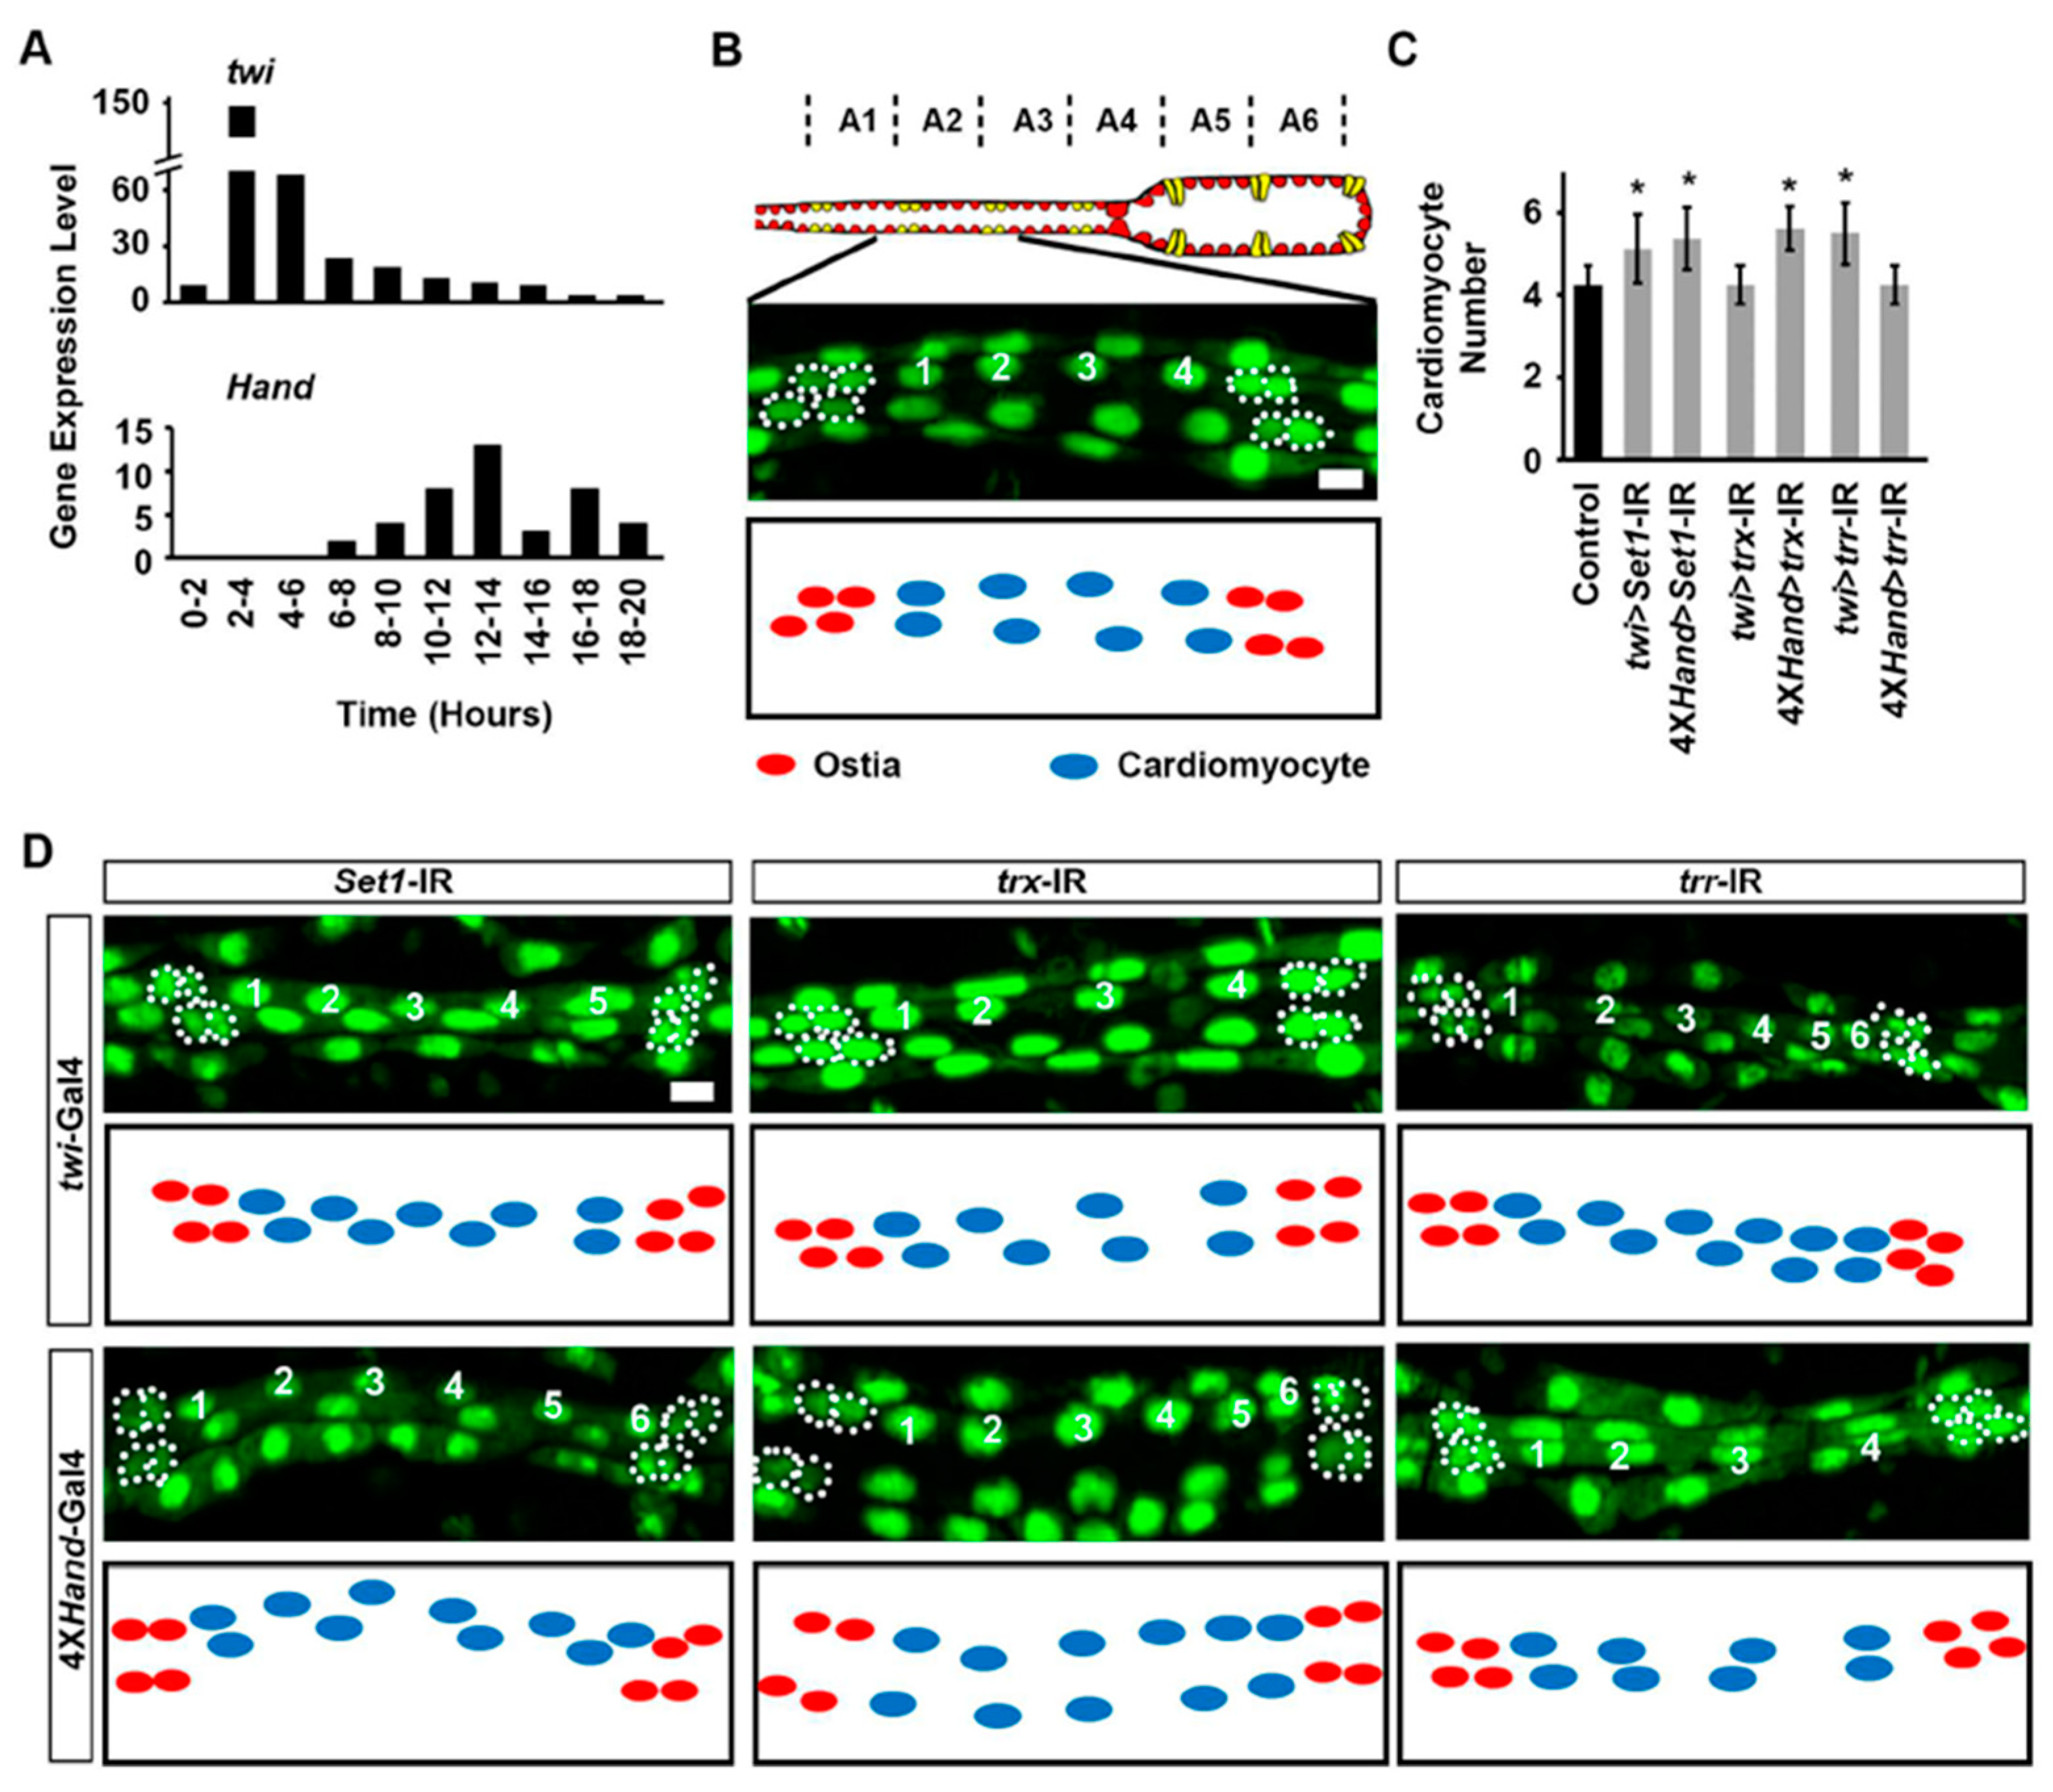
2.2. Set1, Trx, and Trr Silencing Impacted Larval Heart Development at Different Larval Stages

To test whether there are functional or preferential changes in Set1, trx, and trr during fly heart development, we employed the Drosophila UAS-Gal4 system combined with RNAi knockdown. We combined either twist (twi)-Gal4 or 4XHand-Gal4 (four tandem repeats of Hand [25]) with UAS-Set1-RNAi, UAS-trx-RNAi, or UAS-trr-RNAi. Data from the modENCODE_mRNA-Seq_development project available through FlyBase (accessions: NCBI BioProject, PRJNA75285; NCBI Sequence Read Archive, SRP001065; modENCODE_574) [27,28] showed that twi is expressed in the heart during early larval stages, 1st instar, whereas Hand is expressed in the heart during late larval stage; heart-specific (Figure 2A). Thus, this creates fly progenies with targeted RNAi-based silencing of Set1, trx, or trr, driven by Gal4 at different heart developmental stages. Two independent RNAi lines were tested for each gene and showed similar results; therefore, representative data for one line have been displayed in the figures (in Figure 2, Figure 3, Figure 4, Figure 5 and Figure 6, data have been shown for Set1-IR ID 40931, trx-IR ID 33703, and trr-IR ID 36916).
We observed that silencing Set1 and trr, but not trx, early (twi-Gal4) led to increased cardiomyocyte numbers compared to the control; while silencing them late (4XHand-Gal4) resulted in increased cardiomyocytes in Set1 and trx, but not trr, compared to control in 4-day-old adult flies (Figure 2B–D). These results suggest that Set1 is required to maintain cardiomyocyte numbers both early and later during larval development, whereas trx (late) and trr (early) are necessary during specific larval developmental stages only.
Figure 2. Heart development at early and late fly larval developmental stages following heart-specific silencing of Set1, trx, or trr. (A) Gene expression levels for twist (twi) and Hand (Hand) at different times (hours) after egg laying, in whole larva. Data from the modENCODE_mRNA-Seq_development project. (B) Representative live image of 1st instar Drosophila larva heart (Hand-GFP;twi-Gal4+/−). Hand-GFP expression (green; nuclear) labels the cardiomyocytes (numbered 1–4), ostia (outlined by dashed line), and pericardial cells. Typically, each hemisegment contains four cardiomyocytes and two ostia. Graphic depiction below. Scale bar = 20 µm. (C) Quantitation of larval heart cardiomyocyte number in one hemisegment (see representative images in (D)). Control, Hand-GFP;twi-Gal4+/−; all RNAi (-IR) lines also expressed Hand-GFP. n = 6 larvae per genotype. Values are presented as mean along with the standard deviation (s.d). Statistical significance (*) was defined as p < 0.05 using Kruskal–Wallis H-test followed by Dunn’s test. (D) Live images of heart for larvae expressing twi-Gal4 and 4XHand-Gal4 of UAS-RNAi transgenes targeting Set1, trx or trr, Set1-IR, trx-IR or trr-IR (IR, Interference of RNA). Ostia are outlined by dashed lines and cardiomyocytes are indicated by a number. All RNAi (-IR) lines also expressed Hand-GFP, which labels heart cell nuclei (green). Scale bar = 20 µm.
Ijms 24 17314 g002

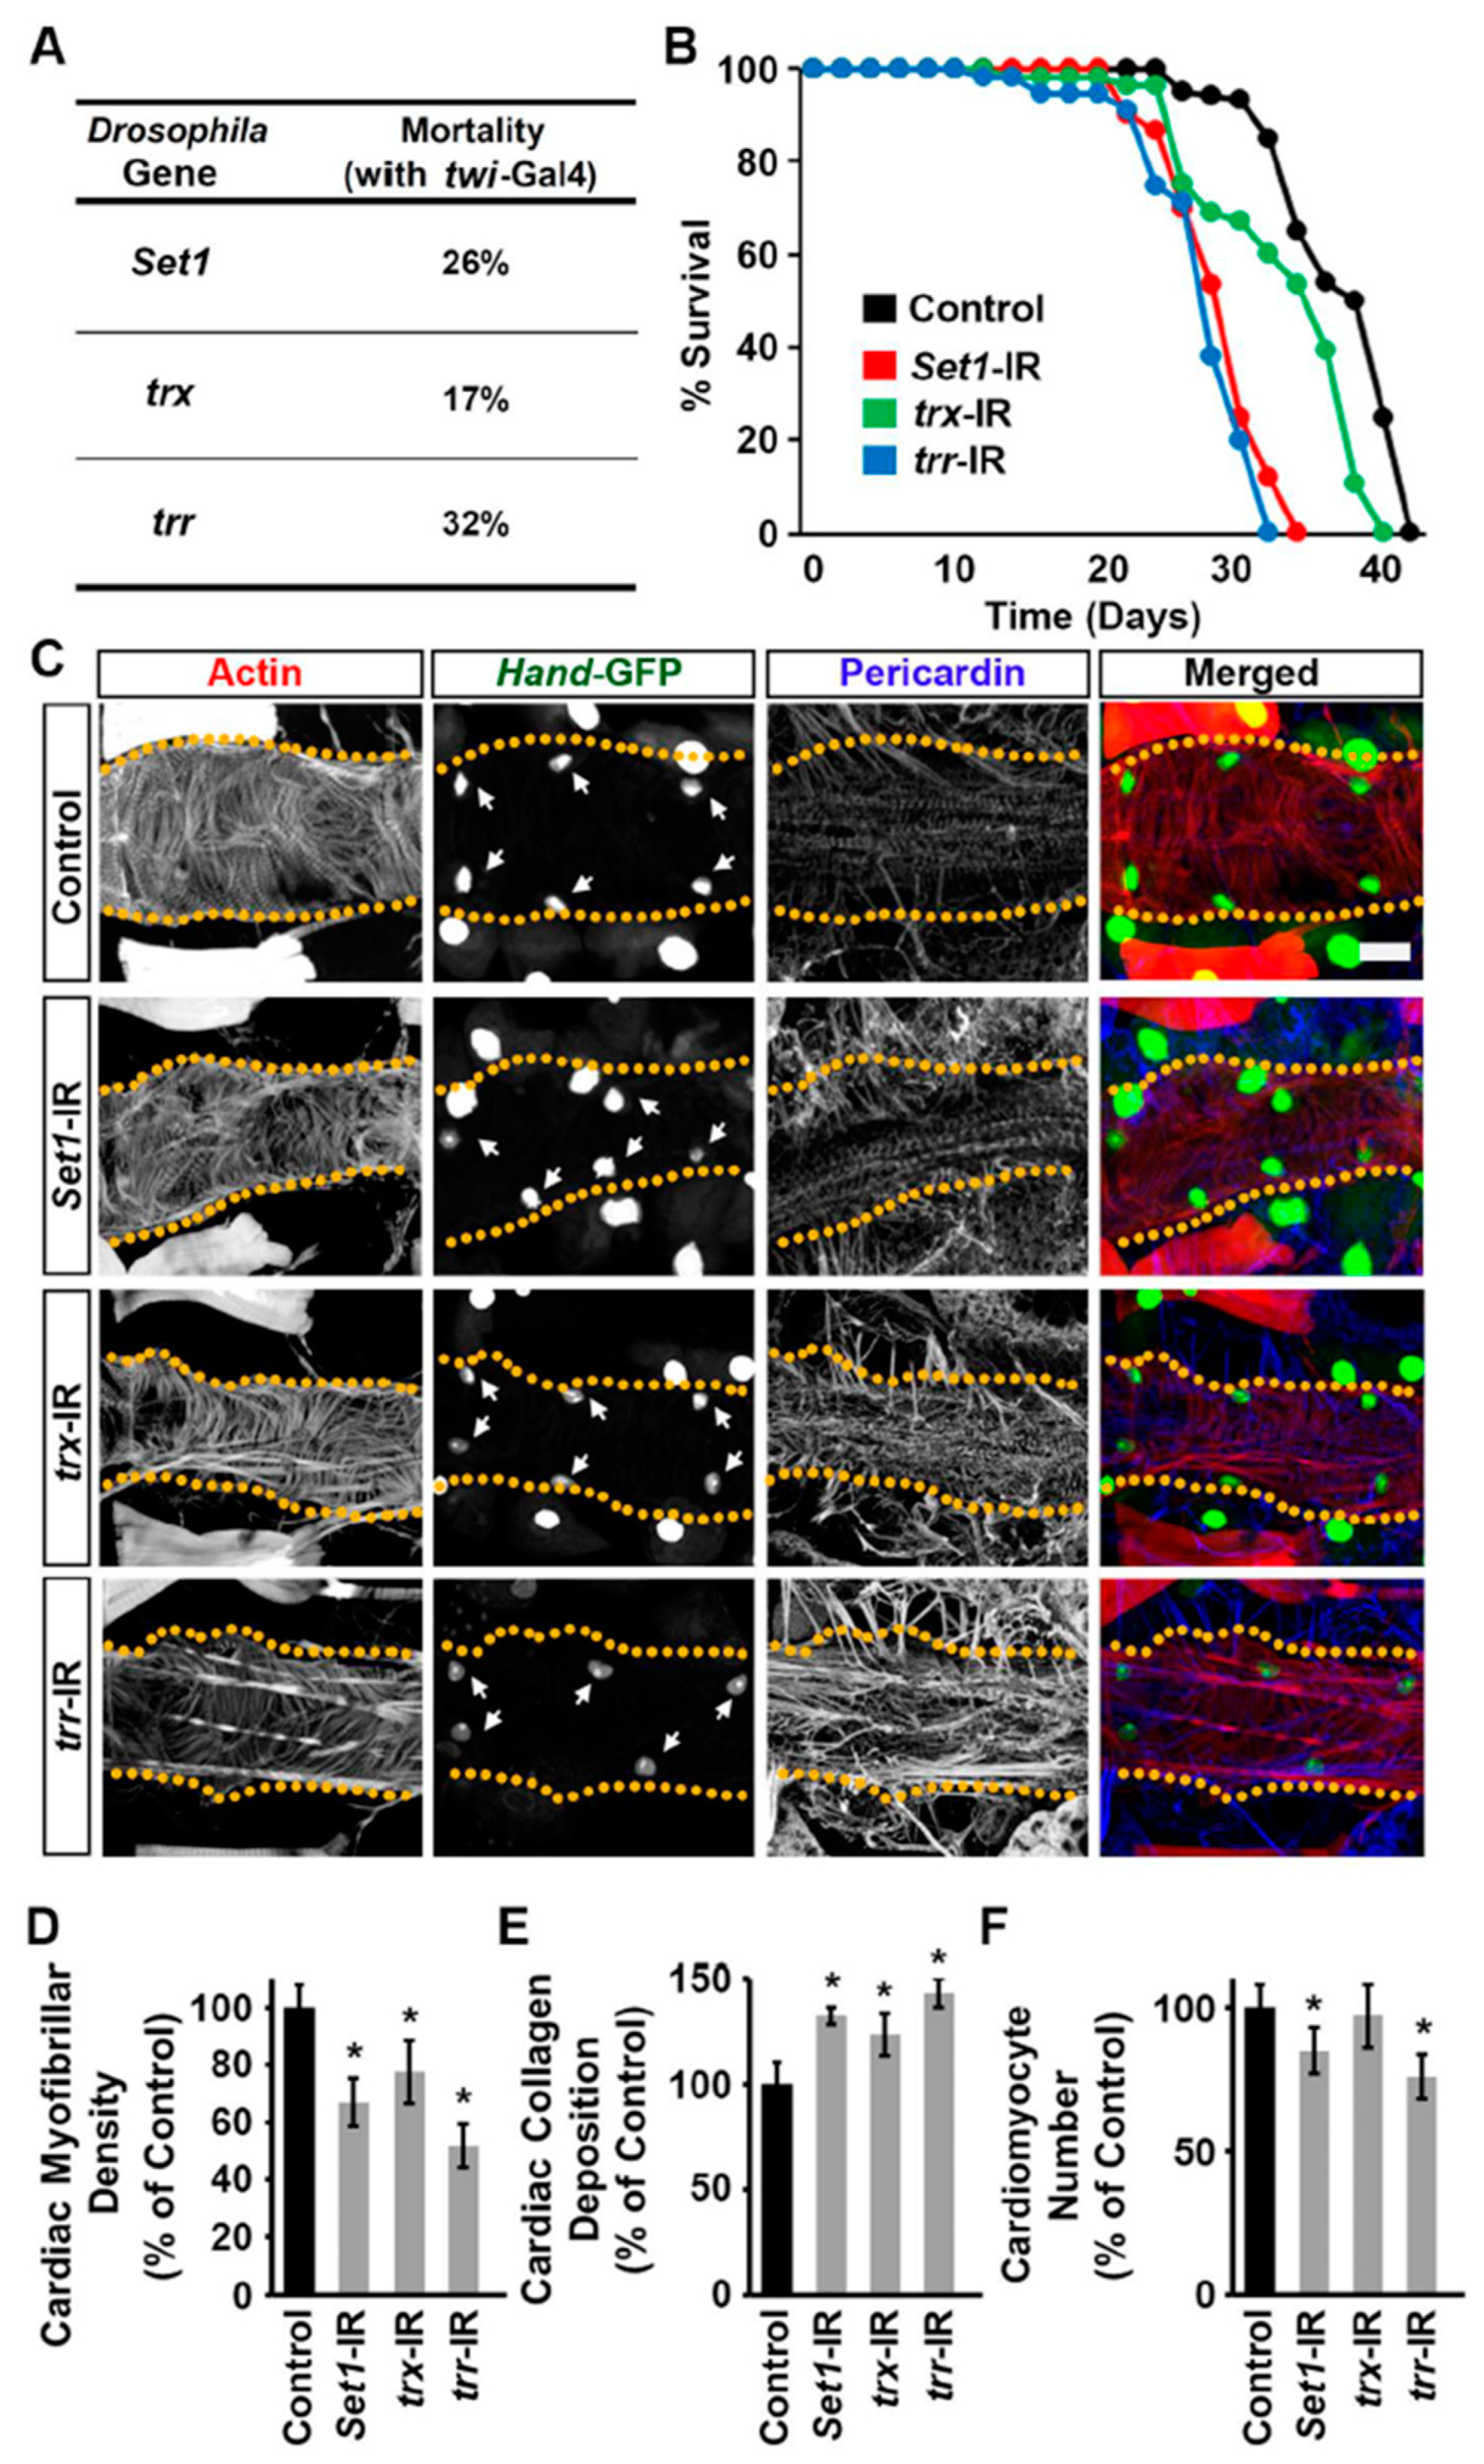
2.3. Set1, Trx, and Trr Silencing Impacted Survival and Cardiac Defects in Adult Drosophila

Previously, we had shown that silencing trx with 4XHand-Gal4 results in the absence of a heart tube and leads to early lethality with no adult flies surviving beyond 25 days [25]. Therefore, we used twi-Gal4 to silence the COMPASS histone H3K4 methyltransferases to study their effect on the adult fly heart. When silencing Set1, trx, or trr driven by twi-Gal4, we observed high mortality at eclosion (i.e., emergence of adult flies from their pupal case): 26%, 17%, and 32%, respectively (Figure 3A). Adult flies that did emerge from these RNAi lines showed markedly shortened lifespans compared to control flies (twi-Gal4+/−), less so for trx-RNAi (Figure 3B).
To look at the effect on the adult fly heart structure, the hearts were stained with phalloidin to visualize the cardiac actin filaments. Set1, trx, or trr gene silencing (twi-Gal4 driver) in the heart was associated with overall disorganization of cardiac actin filaments and reduced cardiac muscle fiber density (Figure 3C,D). We also observed increased deposition of Pericardin, a type IV collagen that plays a critical role in maintaining Drosophila cardiac tissue integrity (Figure 3C,E). The overabundance of Pericardin indicates a pathophysiological condition of fibrosis and can be used as an indicator of cardiac injury [29,30,31,32]. Cardiomyocytes were marked by the expression of green fluorescent protein (GFP) driven by a Hand gene regulatory element (Figure 3C). Silencing Set1 or trr led to significantly reduced cardiomyocyte numbers in the adult flies that survived (Figure 3C,F). Notably, at the larval stage, cardiomyocyte levels following Set1 or trr silencing were increased (Figure 2C). We hypothesize that early-stage cardiomyocytes are dysfunctional and have died by the adult stage, resulting in reduced heart cell numbers (Figure 3F). Additional studies across the early developmental stages could confirm this. Together, the findings show that all three COMPASS core subunits are needed for a normal heart structure.
Figure 3. Heart structure and pericardin deposition in flies following heart-specific silencing of Set1, trx, or trr. (A) Eclosion lethality induced by twi-Gal4-driven expression of UAS-RNAi transgenes targeting Set1, trx, or trr starting from the early larval fly developmental stage. By crossing with a CyO (curly wing) balancer, emerging adults with curly wings (CyO) have no transgene expression, whereas those with straight wings express twi-Gal4 > RNAi. The mortality rate is calculated as [((curly—straight)/curly) × 100]. All lines also expressed Hand-Gal4. n = 400+ flies (female and male) per genotype. (B) Survival curves for adult flies expressing Set1, trx, or trr RNAi (-IR) transgenes (twi-Gal4) in heart cells; and Hand-GFP. Control, Hand-GFP;twi-Gal4+/−. n = 100 male flies (20 flies/vial) per genotype. (C) Adult (5-day-old females) heart phenotype induced by expression of UAS-RNAi transgenes targeting Set1, trx, or trr starting from the early larval developmental stage (twi-Gal4). Cardiac actin myofibers were visualized by phalloidin staining (red). Hand-GFP expression (green; nuclear) labels cardiomyocytes (heart cells). Pericardin was detected by immunofluorescence (blue). Dotted lines delineate the outline of the heart tube. Arrows point to heart cardiomyocytes. Control, Hand-GFP;twi-Gal4+/−. Scale bar = 40 µm. (D) Quantitation of adult heart cardiac myofibrillar density relative to control (see (C)). n = 6 flies (5-day-old females) per genotype. (E) Quantitation of adult heart cardiac collagen (Pericardin) deposition relative to control (see (C)). n = 6 flies (5-day-old females) per genotype. (F) Quantitation of adult heart cardiomyocyte numbers relative to control (see C). n = 6 flies (5-day-old females) per genotype. Values are presented as mean along with the standard deviation (s.d). Statistical significance (*) was defined as p < 0.05 using Kruskal–Wallis H-test followed by Dunn’s test.
Ijms 24 17314 g003

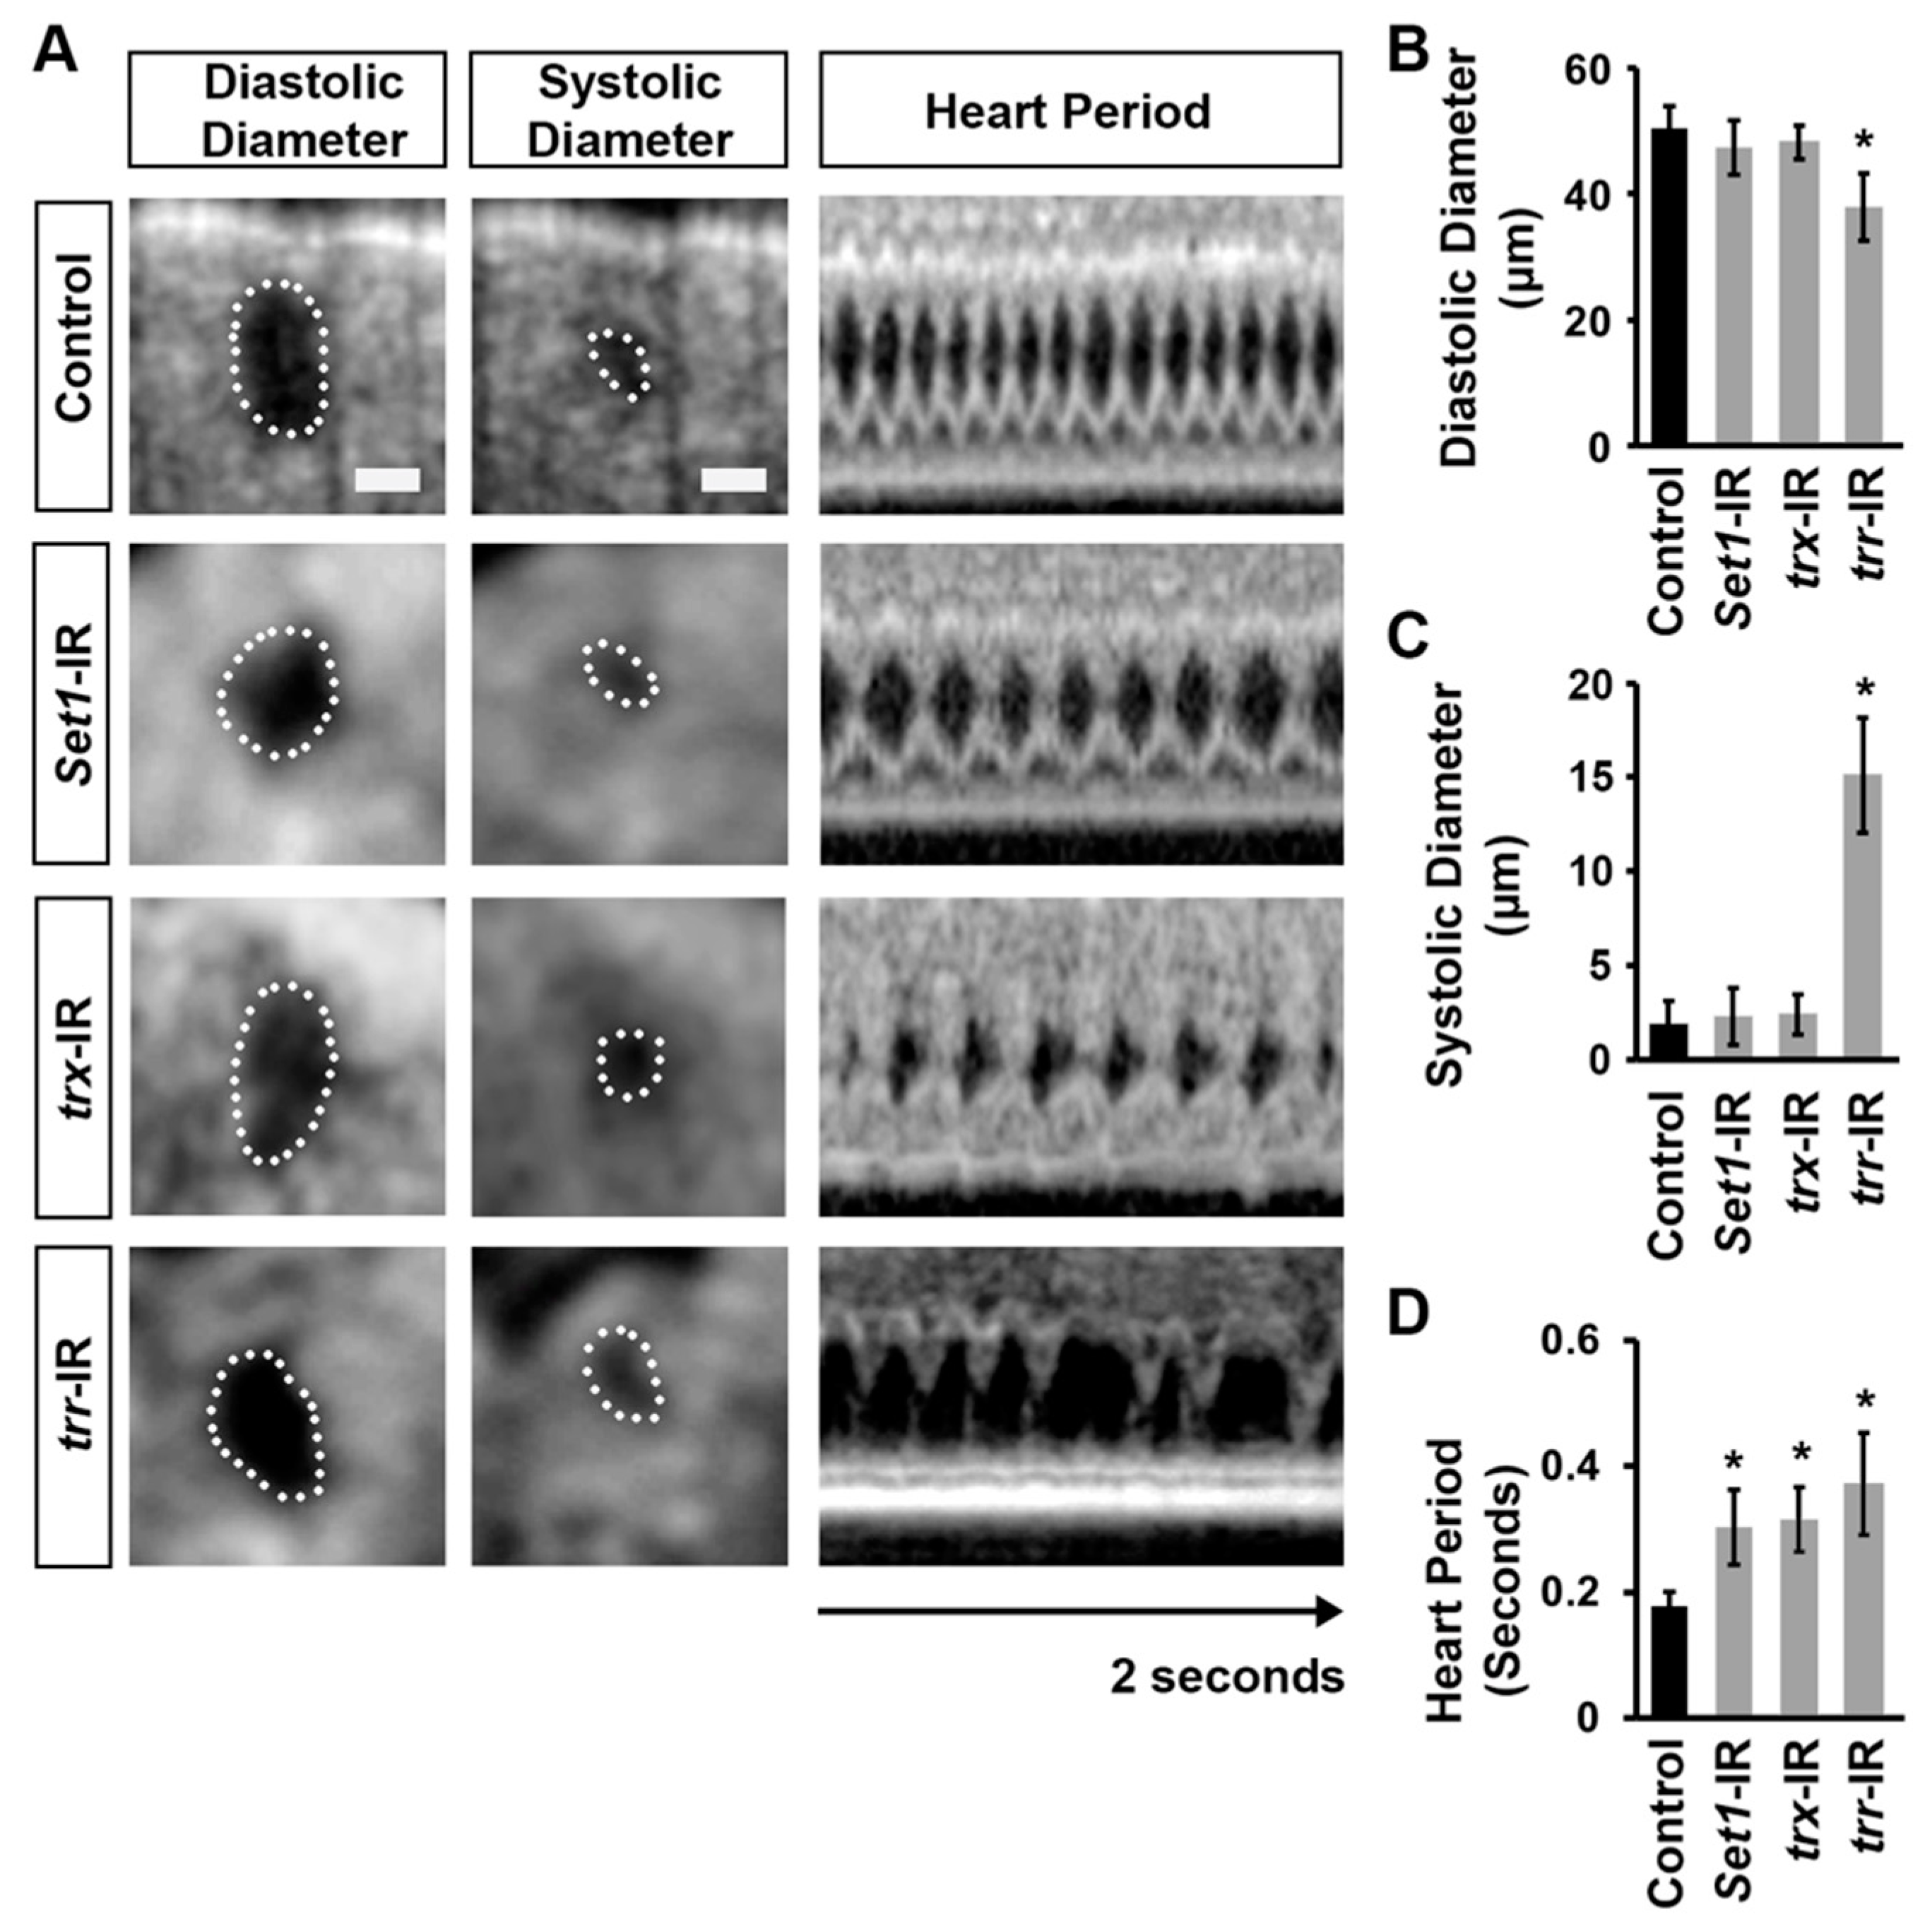
2.4. Set1, Trx, and Trr Silencing Induced Cardiac Dysfunction

To assess cardiac functional defects induced by silencing Set1, trx, or trr (twi-Gal4), we applied optical coherence tomography (OCT). The orthogonal view of the heart provides accurate and real-time measurements of the heart tube diameter and heart period (Figure 4A). Silencing of trr, but not Set1 or trx, was associated with reduced diastolic and increased systolic diameters (Figure 4B,C). Compared to control flies (twi-Gal4+/−), the heart period in Set1, trx, and trr gene-silenced flies was significantly increased (Figure 4D). Thus, all three COMPASS core subunits are required for normal heart function.
Figure 4. Cardiac function in flies following heart-specific silencing of Set1, trx, or trr. (A) Images from Drosophila (4-day-old females) heartbeat videos obtained by optical coherence tomography (OCT). Representative images show changes in heart function induced by expression of UAS-RNAi transgenes targeting Set1, trx, or trr starting from the early larval developmental stage (twi-Gal4). Control, Hand-GFP;twi-Gal4+/−; all RNAi (-IR) lines also expressed Hand-GFP. Dotted line outlines the circumference of the heart tube. Scare bar = 20 µm. (B) Quantitation of adult heart diastolic diameter. n = 10 flies (4-day-old females) per genotype (see (A)). (C) Quantitation of adult heart systolic diameter. n = 10 flies (4-day-old females) per genotype (see (A)). (D) Quantitation of heart period. n = 10 flies (4-day-old females) per genotype (see (A)). Values are presented as mean along with the standard deviation (s.d). Statistical significance (*) was defined as p < 0.05 using Kruskal–Wallis H-test followed by Dunn’s test.
Ijms 24 17314 g004

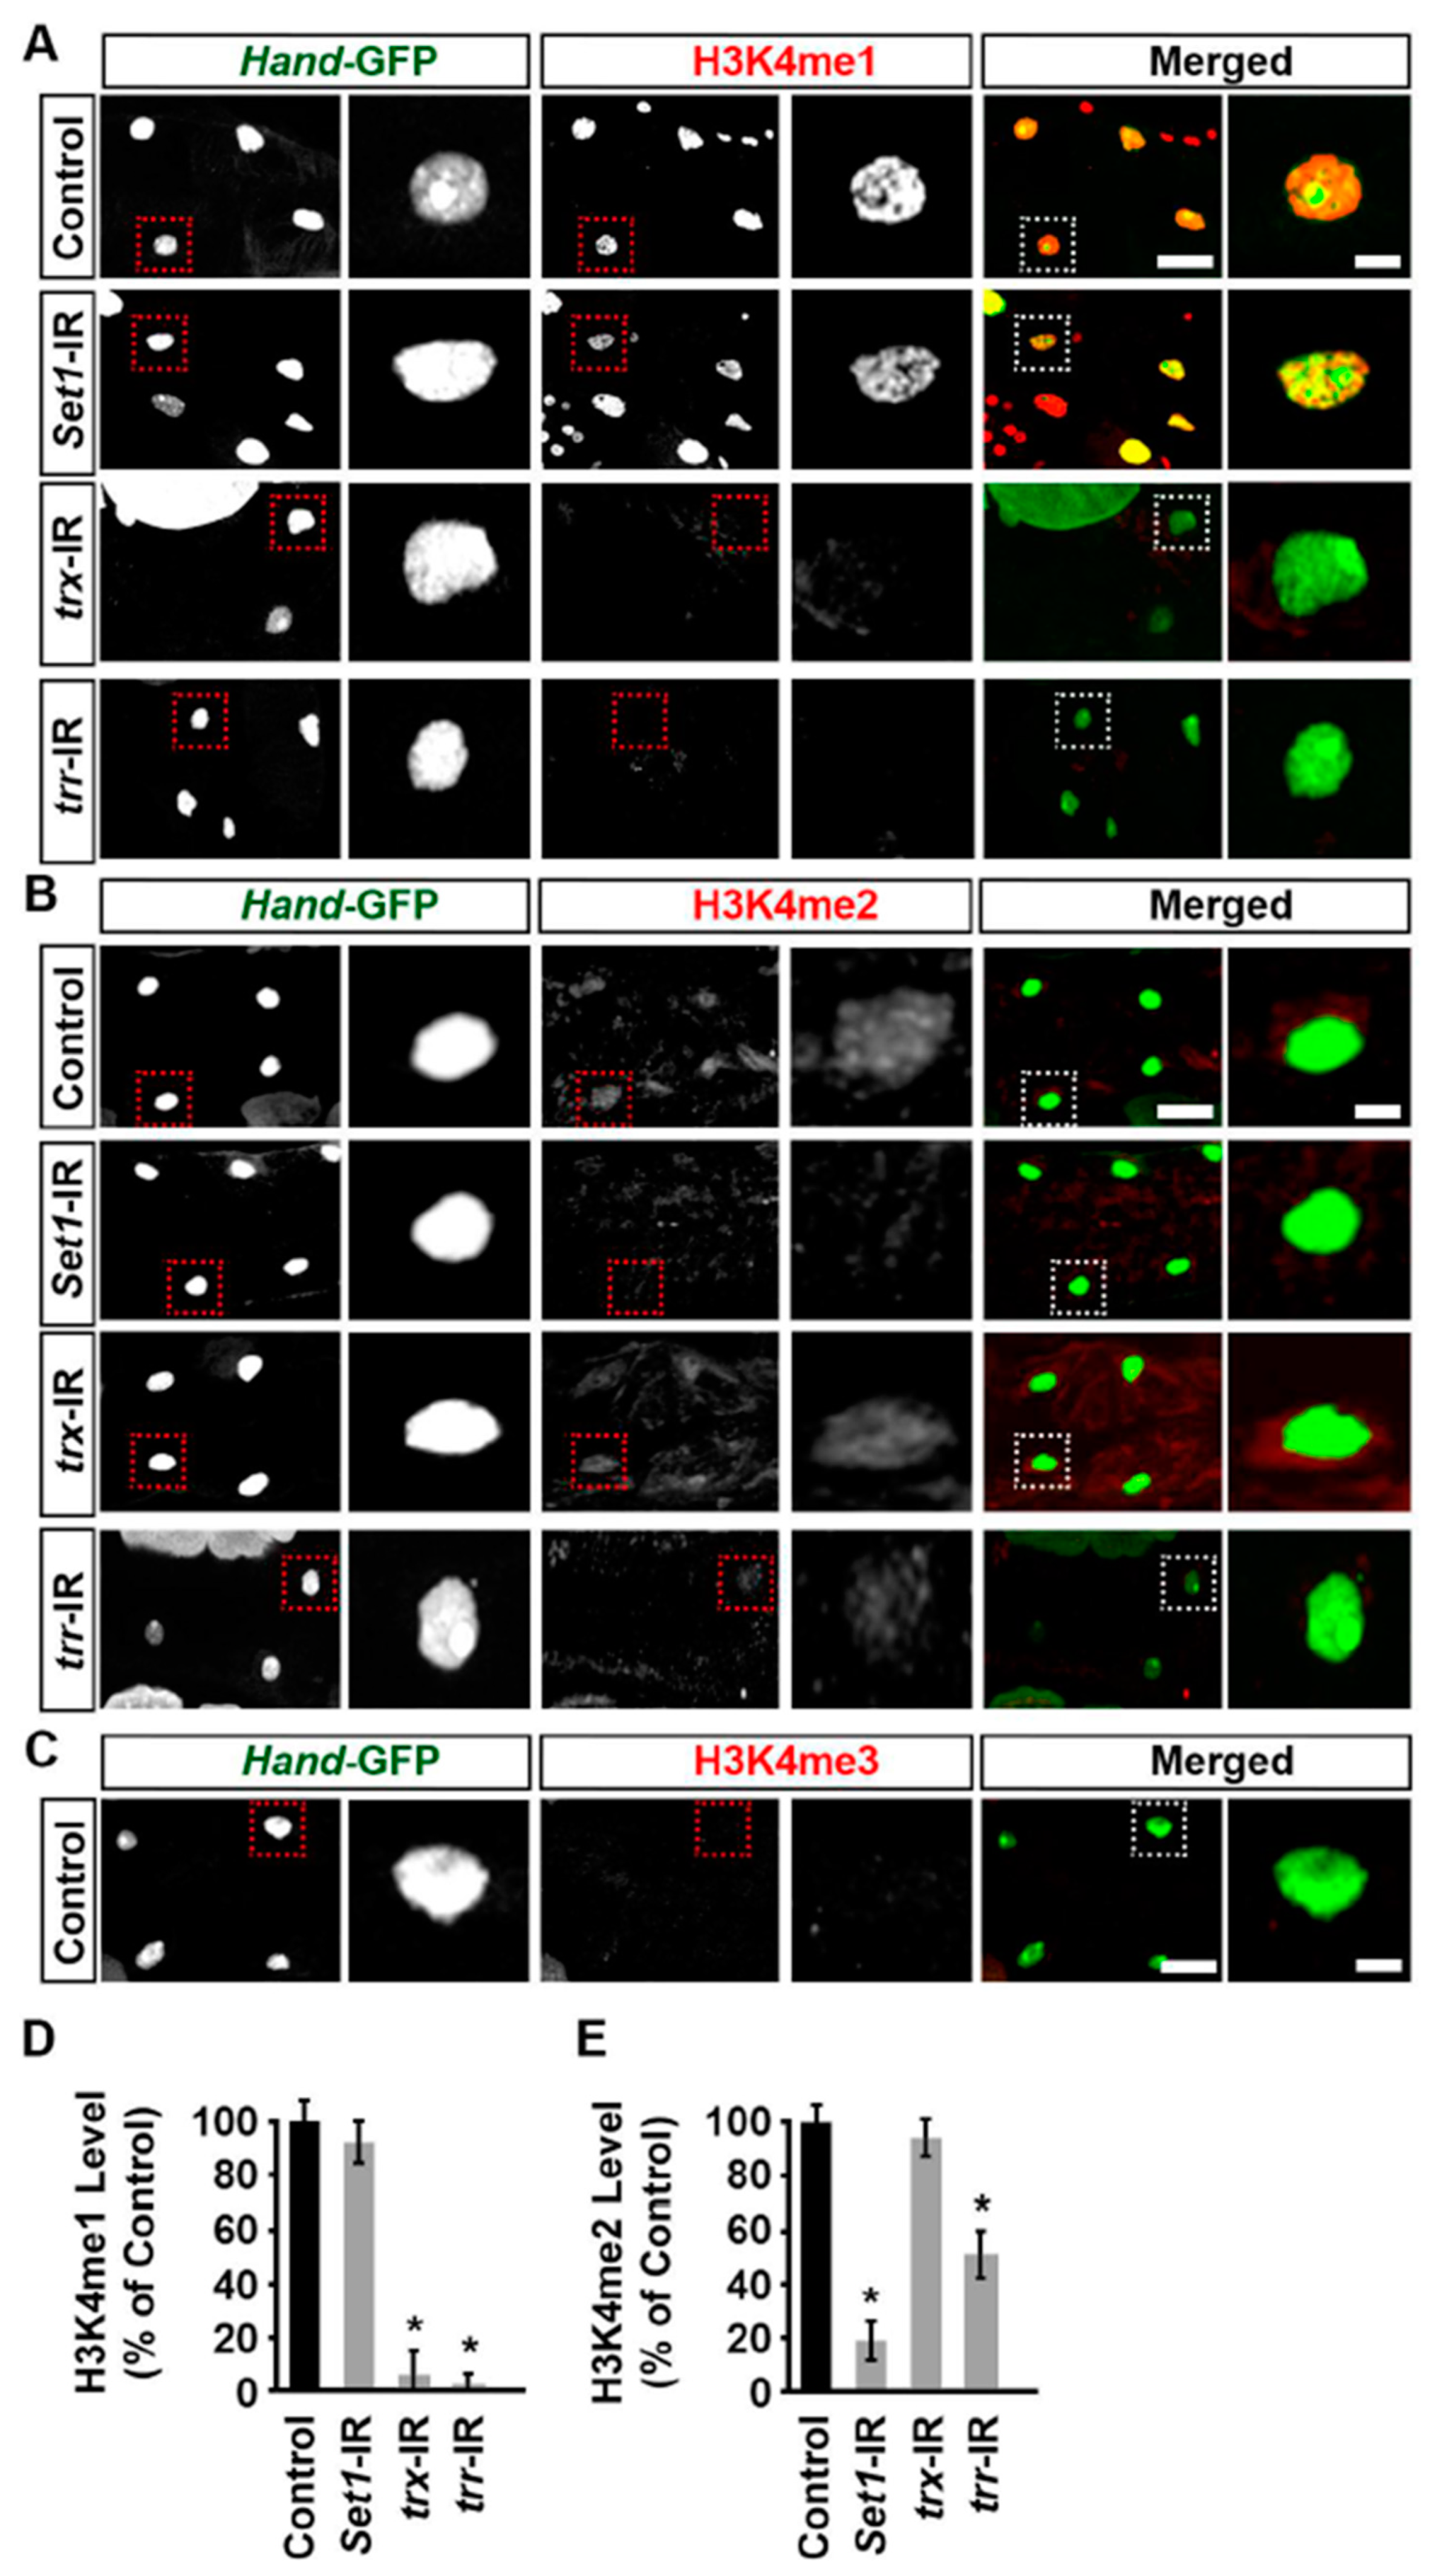
2.5. Set1, Trx, and Trr Regulated H3K4 Mono- and Dimethylation Levels in the Drosophila Heart

Set1, Trx, and Trr have been shown to be essential in regulating gene expression through H3K4 methylation at enhancers and promoters [8]. To test whether they are similarly important for H3K4 methylation in the Drosophila heart, we examined H3K4 methylation status in the adult fly heart using immunofluorescence. In typical control flies, H3K4me1 and H3K4me2 were found in the nucleus of cardiomyocytes (Figure 5A,B), but we were unable to detect H3K4me3 (Figure 5C). We found that silencing Set1 led to a significant reduction in H3K4me2 but not H3K4me1 levels in Drosophila cardiomyocyte nuclei (Figure 5A,B,D,E). On the other hand, silencing trx led to a significant reduction in H3K4me1 but not H3K4me2 levels, whereas silencing trr led to significant reductions in both the H3K4me1 and H3K4me2 levels in Drosophila cardiomyocyte nuclei (Figure 5A,B,D,E). These findings indicate that Set1, trx, and trr differentially regulate H3K4 methylation, which is crucial for Drosophila heart development.
Figure 5. H3K4 methylation levels in cardiomyocytes of heart-specific Set1-, trx-, or trr-RNAi flies. (AC) Representative images for adult heart H3K4 methylation: (A) monomethylation (H3K4me1); (B) dimethylation (H3K4me2); and (C) trimethylation (H3K4me3). Flies (5-day-old females) expressed UAS-RNAi transgenes targeting Set1, trx, or trr driven by (twi-Gal4), starting from the early larval fly developmental stage. Control, Hand-GFP;twi-Gal4+/−; all RNAi (-IR) lines also expressed Hand-GFP. The dotted box indicates the magnified area to show the cardiomyocyte nucleus. Scale bar = 20 μm. Scale bar (magnification) = 5 μm. (D) Quantitation of adult heart cardiac H3K4me1 level relative to the level in control flies (Hand-GFP;twi-Gal4+/−; 5-day-old females). n = 24 cardiomyocytes (six flies, four cardiomyocytes each) per genotype (see (AC)). (E) Quantitation of adult heart cardiac H3K4me2 level relative to the level in control flies (Hand-GFP;twi-Gal4+/−; 5-day-old females). n = 24 cardiomyocytes (six flies, four cardiomyocytes each) per genotype (see (AC)). Values are presented as mean along with the standard deviation (s.d). Statistical significance (*) was defined as p < 0.05 using Kruskal–Wallis H-test followed by Dunn’s test.
Ijms 24 17314 g005

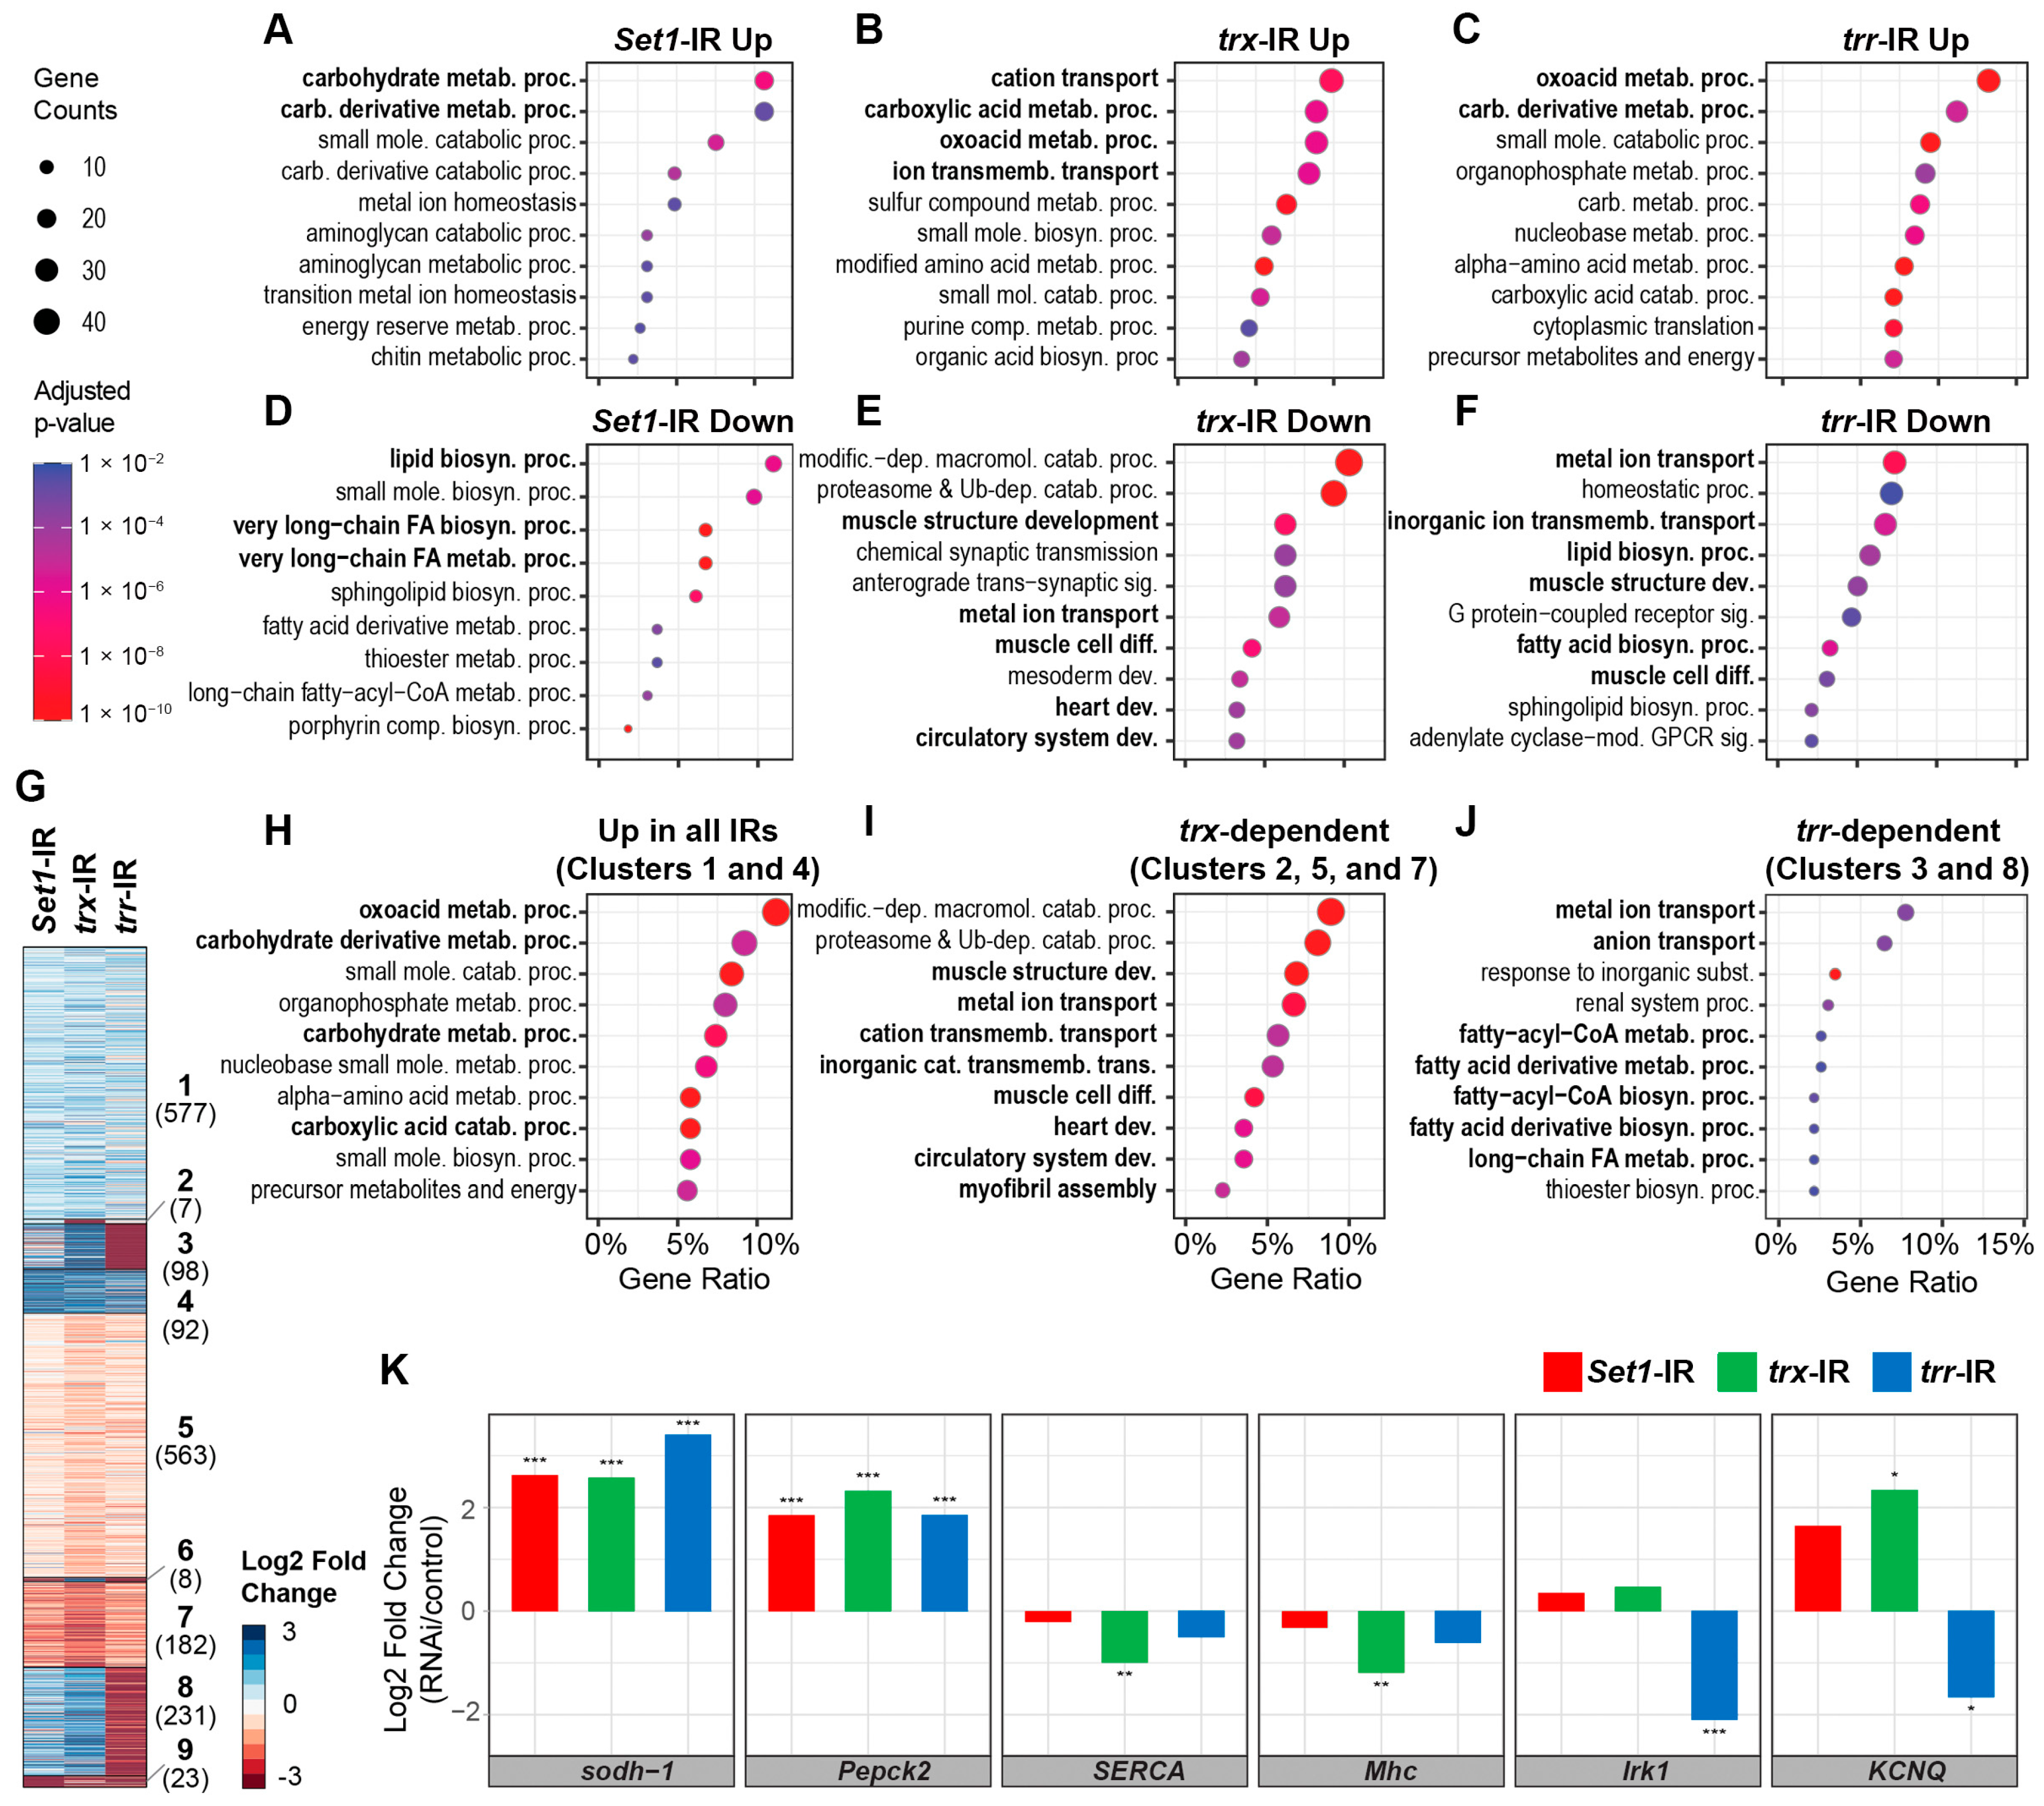
2.6. Silencing Set1, Trx, or Trr Led to Differential Transcriptomic Responses in the Drosophila Heart

Next, we investigated the transcriptional control exerted by Set1, Trx, and Trr. RNAi-mediated silencing of each of the three COMPASS core subunits resulted in both shared and different transcriptomic responses in the adult Drosophila hearts (Figure 6A–F). For example, silencing Set1 resulted in the upregulation of genes that are involved in the carbohydrate metabolic process (GO:0005975; adjusted p-value = 2.7 × 10⁻⁷. Fisher’s exact test, corrected with the Benjamini-Hochberg method) (Figure 6A) and the downregulation of lipid biosynthetic process (GO:0008610)-related genes (adjusted p-value = 7.16 × 10⁻⁷) (Figure 6D). Silencing either trx or trr led to increased expression of oxoacid metabolic process genes (GO:0043436, adjusted p values 7.49 × 10⁻⁷ and, 1.46 × 10⁻¹², respectively) (Figure 6B,C). Interestingly, we observed that ion transport-related genes (GO:0034220 and GO:0030001) were significantly enriched among the upregulated genes in the trx-silenced hearts (adjusted p-value = 1.34 × 10⁻⁶) (Figure 6B), as well as among the downregulated genes in the trr silenced hearts (adjusted p-value = 9.8 × 10⁻⁹) (Figure 6F). Silencing either trx or trr led to the downregulation of muscle development-related genes (GO:0061061; adjusted p values = 3.94 × 10⁻⁸, and 0.00016, respectively) (Figure 6E,F).
To gain further insight into the regulation by each COMPASS core subunit, we performed k-means clustering analysis on the differential expression profiles (Figure 6G). The data revealed diverse transcriptional programs, some of which were controlled by all three KMTs, Set1, trx, and trr (Figure 6H). The genes that demonstrated increased expression following knockdown of either COMPASS KMT included metabolic genes that are required for carboxylic acid (GO:0019752; adj. p = 3.04 × 10⁻¹⁶) or oxoacid metabolism (GO:0043436; adj. p = 1.54 × 10⁻¹⁷) pathways (Figure 6H). These GO terms include the fly sorbitol dehydrogenase 1 (sodh-1) and Phosphoenolpyruvate carboxykinase (Pepck2) genes (Figure 6K).
Given the differences in temporal expression for trx and trr during heart development in the fly (Figure 1 and Figure 2), we tested if this corresponded to differential regulation of gene expression. While Trx and Trr shared many common target genes, we also found genes that showed a greater reduction in expression in trx-silenced fly hearts (i.e., trx-dependent activation; Figure 6I). These genes were enriched for functional categories of muscle structure development (GO:0061061; adj. p = 1.88 × 10⁻¹¹), metal ion transport (GO:0030001; adj. p = 3.52 × 10⁻⁹), and cation transmembrane transport (GO:0098655; adj. p = 1.41 × 10⁻⁵). Genes in these categories included SERCA for Ca2+ physiology and Mhc for muscle structure GO terms (Figure 6K).
Other gene clusters showed significantly decreased expression in trr-IR fly hearts but increased expression in trx-IR fly hearts (Figure 6J). This suggests that these genes are targets, direct or indirect, of trr-mediated transactivation at the later stages of heart development (i.e., trr-dependent). These clusters included genes required for metal and/or anion transports (GO:0030001 and GO:0006820, adjusted p-value = 0.0038 for both), which are essential for muscle maturation. They included the Drosophila ortholog of the human potassium channel gene KCNJ2 (Irk1; Figure 6K)—the KCNJ2 mutation has been associated with long QT syndrome in human hearts [33]—as well as a voltage-gated channel gene (KCNQ; Figure 6K) that has been known to function in cardiac muscle contraction [34]. In contrast, we found only seven genes with trx-specific upregulation (i.e., decreased expression only in trx-IR fly hearts; Figure 6G, Cluster 2). While these genes did not show any enriched functional terms in our GO analysis, we did find that six out of the seven genes are known targets of the Drosophila p53 transcription factor (adjusted p-value = 8.13 × 10⁻⁹) [35].
Figure 6. Differential cardiac transcriptomic responses in heart-specific Set1-, trx-, or trr-RNAi flies. Flies (one-week-old females): Set1-IR (Hand-GFP;twi-Gal4 > Set1-RNAi), trr-IR (Hand-GFP;twi-Gal4 > trr-RNAi), trx-IR (Hand-GFP;twi-Gal4 > trx-RNAi). Each sample contained RNA extracted from 50 dissected fly hearts. (AF) Enriched functional terms from Gene Ontology (GO) analysis for the significantly upregulated (AC) or downregulated (DF) genes for flies with Set1 (A,D), trx (B,E), or trr (C,F) silenced in the heart. (G) A heatmap (log2 scale) summarizes the differential expression analyses between Set1-, trx-, and trr-silenced hearts, compared to control (Hand-GFP;twi-Gal4+/−). Gene clusters were obtained by k-means clustering; cluster name in bold text, number of genes in cluster in brackets. Genes that did not show significant differential expression (adjusted p-value < 0.05) from any of the comparisons or that were not expressed in any of the samples (Transcripts per million < 1) were omitted. (HJ) Enriched GO functional terms for genes grouped by similar differential expression patterns across Set1-IR, trx-IR, and trr-IR fly hearts. The indicated clusters correspond to the heatmap (see G). (H) Enriched GO terms for gene clusters that represent negative regulation by Set1, trx, and trr, i.e., upregulated expression in all three IR lines. (I) Clusters that are more dependent on trx, i.e., more downregulated in trx-IR than in trr-IR fly hearts. (J) Clusters with trr-specific regulation, i.e., that show downregulation in trr-IR but upregulation in trx-IR. (K) Graphs plot differentially expressed genes from the enriched GO terms in H-J: (H) sodh-1 and Pepck2, metabolic genes; (I) SERCA, Ca2+ physiology, and Mhc, muscle-related genes; and (J) Irk1 and KCNQ, ion transport genes. Statistical significance was defined as adjusted p-value < 0.05 using the Wald test and corrected for multiple testing using the Benjamini–Hochberg method; (*) signifies adjusted p < 0.05, (**) signifies adjusted p < 0.005, and (***) signifies adjusted p < 0.001.
Ijms 24 17314 g006
These data suggest that each of the COMPASS core subunits controls histone methylation of distinct sets of genes, with many metabolic pathways active early in development and throughout, while cardiac development and Ca2+ physiology processes are active during later stages of development.

3. Discussion

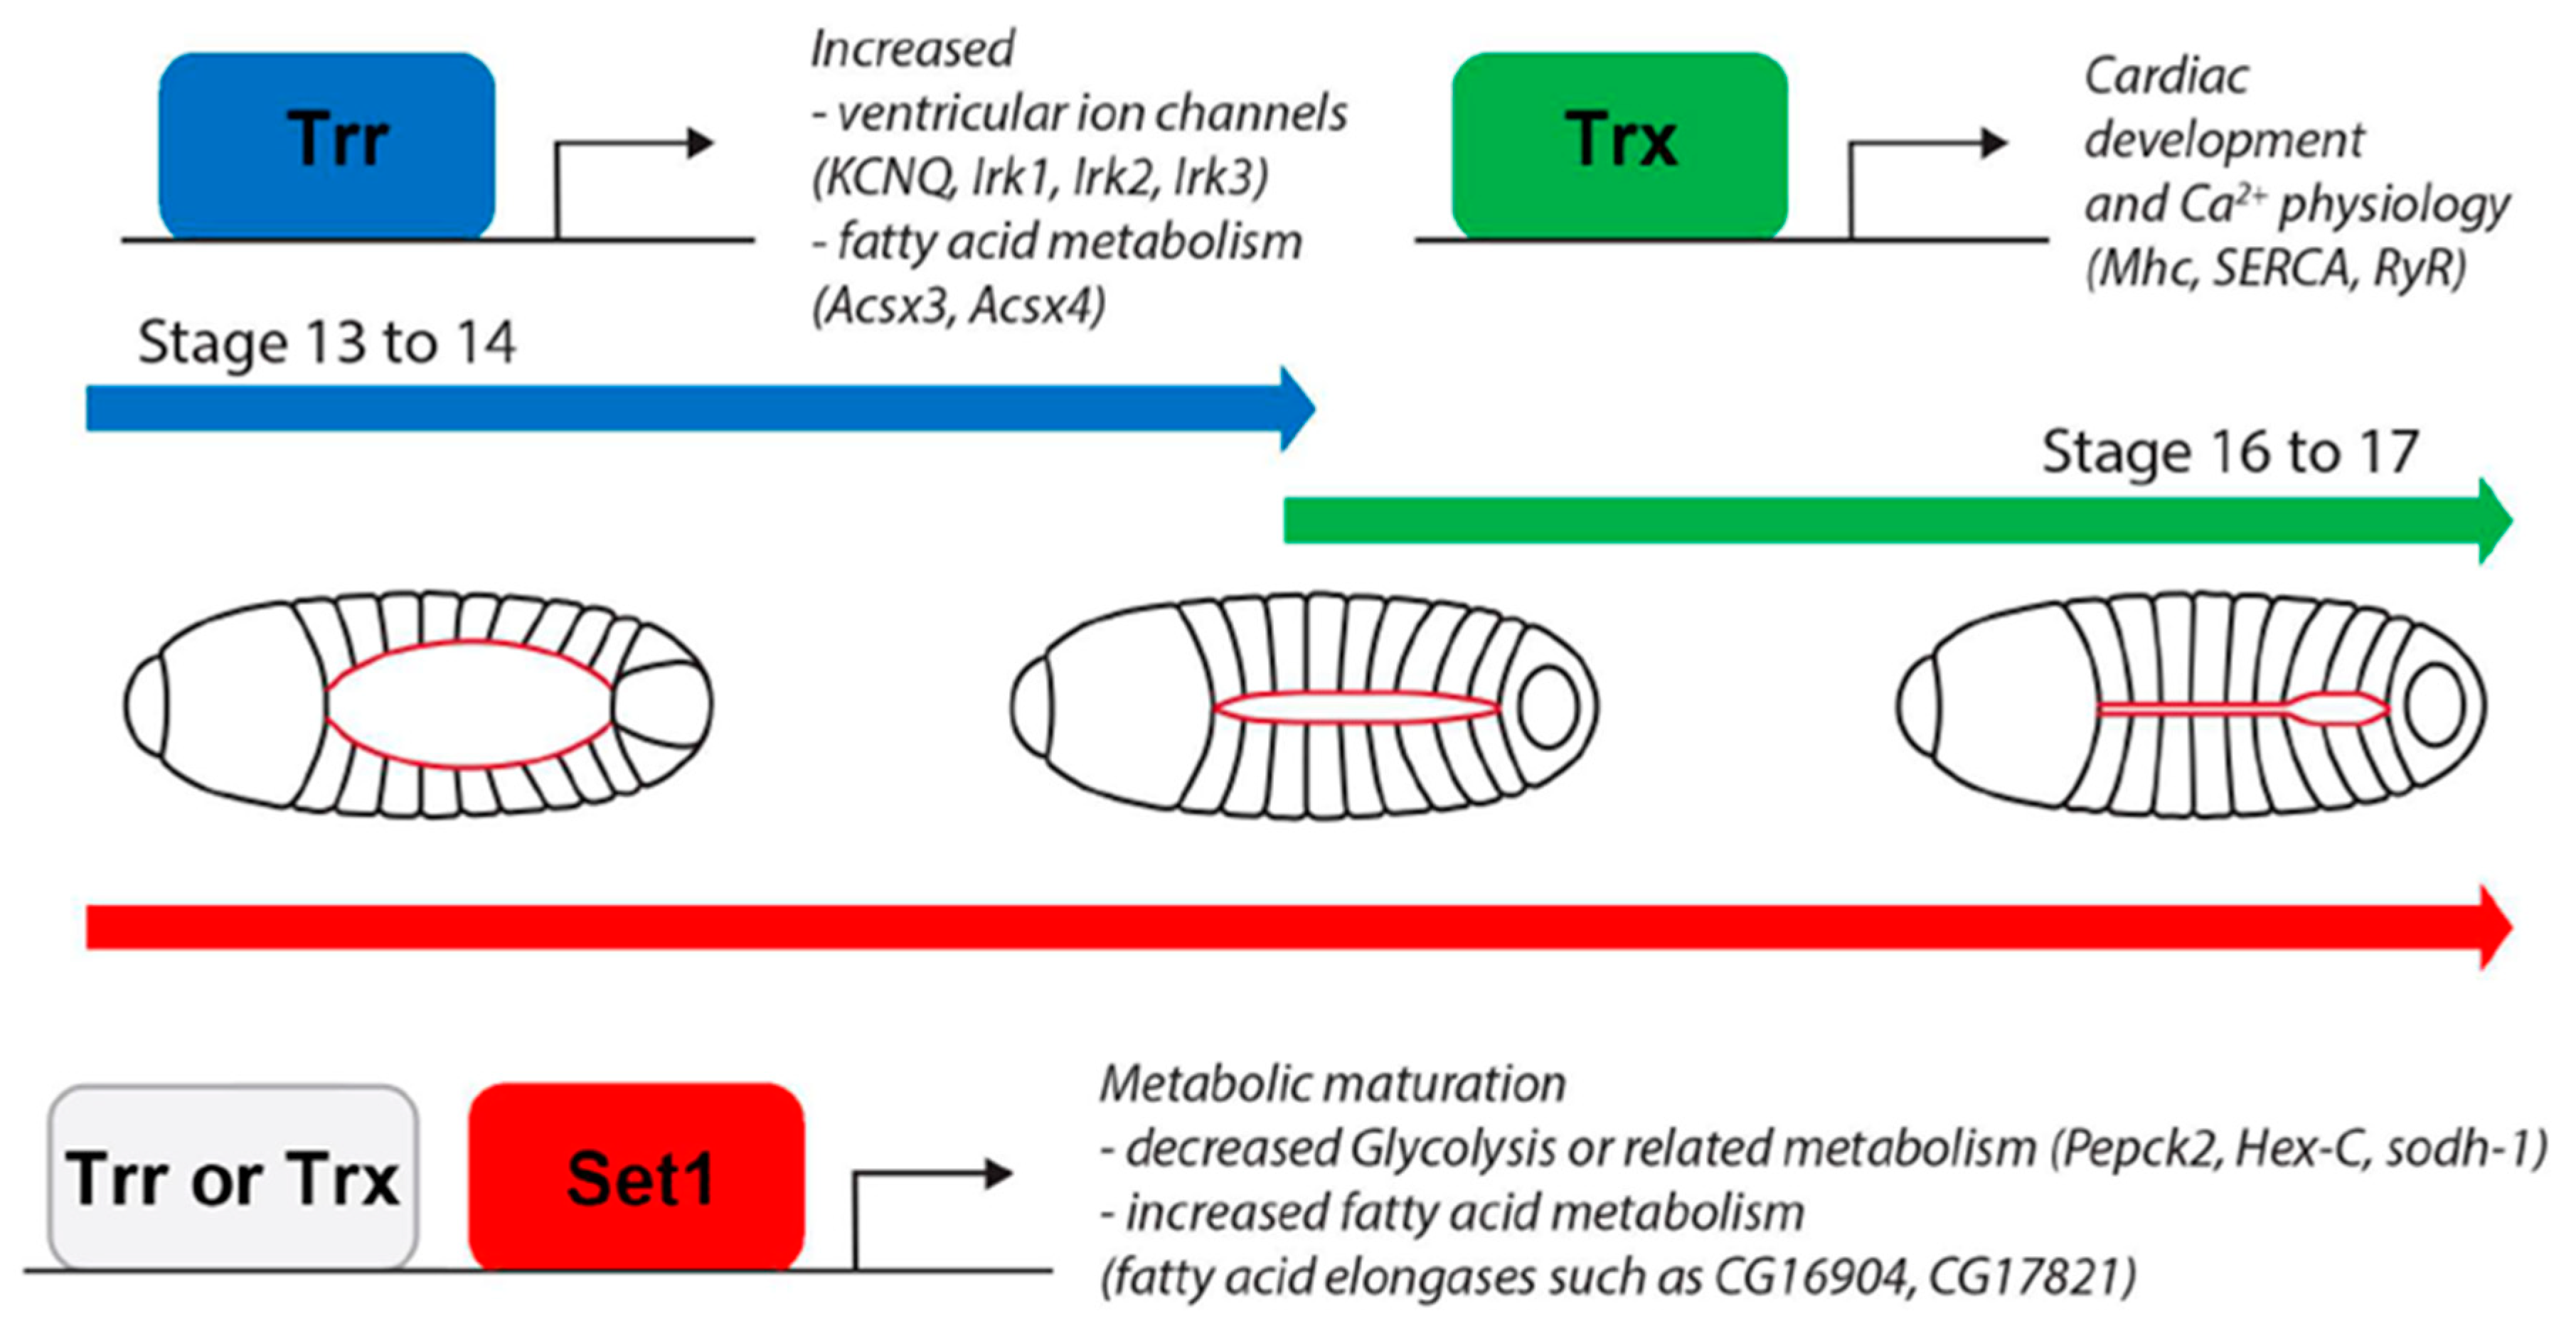
3.1. Set1, Trx, and Trr Distinctly Contribute to Methylation during Drosophila Heart Development

Drosophila Set1 is homologous to the mammalian SETD1A and SETD1B COMPASS core subunits, which display mono-, di-, and trimethyltransferase (H3K4me1, -me2, and -me3) activity [36,37,38]. However, their activity in the heart and during its development remains unknown. Here, we demonstrate that in the developing fly heart, Set1 displays H3K4me2 activity to regulate gene expression patterns that promote healthy heart development.
Fly Trx is homologous to mammalian KMT2A and KMT2B. Mutations in KMT2A cause Wiedemann–Steiner syndrome, a rare congenital disease with multiple anomalies [39,40]. Around 35% of patients present with cardiac abnormalities, mostly structural [41]. We had previously shown that trx-deficiency in the fly heart (4XHand > trx-RNAi) resulted in the absence of a heart structure [25]. Here, using a different driver, we demonstrate that Trx induces H3K4me1 activity to regulate gene expression in the developing fly heart.
We recently showed that Lpt and Trr work together to conduct the function of mammalian KMT2C and KMT2D in regulating methylation and transcription during heart development [10]. Whereas for the previous study, we had used 4Xhand-Gal4 to drive heart-specific silencing of Lpt and trr, here we used twi-Gal4, which is expressed earlier during development, to silence the genes encoding the COMPASS core methyltransferases. With either driver, silencing trr in the developing heart led to the same structural and functional cardiac phenotypes. In addition, in patients and a mouse model, increased KMT2C mRNA and protein levels were linked to dilated cardiomyopathy [42]. Moreover, H3K4me2, but not -me3, levels were increased in heart tissue from patients with dilated cardiomyopathy [42]. The study did not test H3K4me1 levels, even though KMT2C H3K4me1 and -me2 were required during cell differentiation [43], albeit a role for KMT2C monomethylation in a cardiac context is yet to be determined. Variants in KMT2D cause Kabuki syndrome, a rare congenital disease with multiple anomalies, in which around 70% of patients present with congenital heart defects, with a unique predilection for left-sided obstructive lesions [18,21,22,23,44]. Additional variants in KMT2D have been linked to various other congenital heart conditions [45,46,47,48,49]. Animal models of KMT2D mimic the cardiac phenotype seen in patients and have indicated a role in Notch signaling [18,19,20]. In addition, Kmt2D was shown to be essential for cardiac lineage differentiation of mouse embryonic stem cells (ESCs) by H3K4me3 activity at the promoter of cardiac-specific genes, thus promoting their expression [50]. Notably, that study did not investigate H3K4me1 or -me2 activity. Our findings show that in flies, Trr mediates both H3K4me1 and me2 methylation during fly heart development.
Combined, the data show that each of the COMPASS cores facilitates different methylation states during fly heart development. This implies that they act in concert and that each of the H3K4 methyltransferases—Set1, Trx, or Trr—is required for healthy heart development.

3.2. COMPASS Complex-Mediated Methylation during Heart Development and Disease

Even though variants in COMPASS complex core subunits have been implicated in congenital heart disease, little is known about the underlying pathomechanisms or the roles of these core subunits in heart development. Here we showed that, like in mammals, in flies, the Set1, Trx, and Trr core units play essential roles in heart development. The transcriptional data further showed that the distinct methylation activity and preferred activity window for each COMPASS complex core subunit leads to the regulation of a diverse set of pathways. Several metabolic pathways were active early in development (Trr, Set1) and throughout (Set1), while muscle and heart differentiation processes were methylated during later stages of development (Trx) (Figure 7). Some pathways were shared, i.e., regulated by more than one COMPASS complex. However, we also identified several pathways, including those involved in ion transport and fatty-acyl-CoA metabolism, that were regulated oppositely by Trx- and Trr-mediated methylation. Ion transport genes are essential for muscle maturation [51], which is consistent with our data that showed Trx is required for heart development at late larval stages. The deletion of Kmt2d in mice identified similar pathways, including ion transport, which were regulated by Kmt2d methylation and caused structural and functional cardiac defects [18]. These findings indicate evolutionary conservation between Drosophila and mammals of the essential molecular mechanisms that regulate heart development.
Altogether, each of the COMPASS complexes mediates distinct methylation states and displays preferential times (early vs. later) of activity during fly heart development. However, we cannot rule out effects originating during pupal stages on adult methylation and gene expression as we focused on the earliest stages of heart development. Together, these findings strongly support the conservation of the COMPASS series complex in heart development from flies to mammals. Furthermore, our findings strengthen the value of Drosophila as a model system for both heart development and congenital heart diseases.

4. Materials and Methods

4.1. Drosophila Lines

Drosophila stocks were obtained from the Bloomington Drosophila Stock Center (Indiana University Bloomington, IN, USA). The following lines were used in this study: UAS-Set1-RNAi (ID 33704 and 40931), UAS-trx-RNAi (ID 31902 and 33703), and UAS-trr-RNAi (BDSC ID 29563 and 36916). Wildtype w1118 (BDSC ID 3605) flies were used in the crosses. The twi-Gal4 (BDSC ID 80574) and 4XHand-Gal4 [25] drivers were used to express RNAi-based silencing (-IR) constructs in the heart starting early or late in larval development, respectively. Hand-GFP was previously generated by our team [52].

4.2. Live Imaging of Drosophila Larva

First instar larvae (Hand-GFP) were anesthetized by CO2 at room temperature. Fluorescence images of live anesthetized larvae were acquired using a ZEISS ApoTome.2 microscope with a 20X Plan-Apochromat 0.8 N.A. air objective (ZEISS, Jena, Germany). Images were obtained using ZEN blue edition (version 3.0) acquisition software. The whole heart was imaged by collecting Z-stacks. Since these images were used for cell counting, not the quantitation of fluorescence, the exposure time was modified for each genotype, if needed, to ensure the cardiomyocytes were clearly visible. ImageJ (version 1.49) (Schneider, Rasband, and Eliceiri 2012) was used for image processing. Six fly larvae were imaged per genotype, and representative images are shown in the figures.

4.3. Immunochemistry

Drosophila 5-day-old adult flies were dissected and fixed for 10 min in 4% paraformaldehyde in phosphate-buffered saline (1× PBS). Primary antibodies were incubated overnight at 4 °C in 2% bovine serum albumin (BSA; Sigma, St. Louis, MO, USA) with 0.1% Triton-X (Sigma, St. Louis, MO, USA) in 1× PBS. Following washes, secondary antibodies were incubated for 2 h at room temperature in 2% BSA (Sigma, St. Louis, MO, USA) with 0.1% Triton-X (Sigma, St. Louis, MO, USA) in 1× PBS. Alexa Fluor 555 phalloidin (Thermo Fisher, Waltham, MA, USA; A34055) was used at 1:1000 dilution. Mouse anti-Pericardin antibody (EC11; Developmental Studies Hybridoma Bank, Iowa City, IA, USA) was used at 1:500 dilution. Confocal imaging was performed using a ZEISS LSM900 microscope with a 63× Plan-Apochromat 1.4 N.A. oil objective (ZEISS, Jena, Germany). Images were obtained using ZEN blue edition (version 3.0) acquisition software. Segment A2 of the heart was imaged by collecting Z-stacks. Control groups were imaged first to establish the laser intensity and exposure time for the entire experiment. The exposure time was based on image saturation (at a set point of approximately 70% of maximum saturation) to enable the comparison of fluorescence intensity across all genotypes. ImageJ (version 1.49) (Schneider, Rasband, and Eliceiri 2012) was used for processing. Six fly larvae were imaged per genotype, and representative images are shown in the figures.

4.4. Heart Structural Analysis and Quantitation

Drosophila heart cardiac myofibril density, cardiomyocyte number, and Pericardin deposition were quantified as previously described [53]. For quantitative comparisons, we analyzed either six 1st instar larvae (female and male) for each genotype (Hand-GFP; twi-Gal4/4xHand-Gal4 > UAS-Set1-IR/UAS-trx-IR/UAS-trr-IR) or six 5-day-old female adult flies for each genotype (Hand-GFP;twi-Gal4 > UAS-Set1-IR/UAS-trx-IR/UAS-trr-IR or control, Hand-GFP;twi-Gal4+/−). ImageJ software (version 1.49) [54] was used to process the images. The Z-stack projections were screened, and image levels containing cardiac myofibrils were selected for analysis while avoiding the ventral muscle layer that underlies the heart tube. The cardiac myofibril number was quantified by using the MyofibrilJ plugin for Fiji (version 1.53q) [55]. The entire heart region in segment A2 was selected using the freehand selection function in Fiji to count the number of cardiac myofibrils. For quantitation, cardiac myofibrillar density was calculated as the cardiac myofibril number divided by the size of the heart region. Cardiomyocyte numbers were manually counted in a standard-sized area in heart segment A2. Pericardin deposition was measured in heart segment A2 based on the fluorescence intensity. Cardiac myofibril density, cardiomyocyte number, and Pericardin deposition were each normalized to the values obtained in the control flies.

4.5. Lethality at Eclosion

Eclosion lethality is evidenced by the percentage of flies expressing an RNAi-based silencing construct (straight wings) (twi-Gal4 > UAS-Set1-IR/UAS-trx-IR/UAS-trr-IR) that fail to emerge as adults, relative to siblings that do not express the silencing construct (curly wings). The result is presented as a Mortality Index (MI) calculated as [((curly straight)/curly) × 100]. At least 400 flies (female and male) were counted per genotype.

4.6. Adult Drosophila Survival Assay

Drosophila larvae were kept at 25 °C to induce UAS-transgene expression (twi-Gal4 > UAS-Set1-IR/UAS-trx-IR/UAS-trr-IR). Adult male flies were subsequently maintained in vials at 25 °C, with each vial containing 20 animals. Mortality was monitored every 48 h. One hundred flies were assayed per genotype.

4.7. Optical Coherence Tomography (OCT)

Cardiac function in adult Drosophila was measured using OCT. The system (Bioptigen) was built as described by the Biophotonics Group, Duke University, NC, USA [56,57]. Four-day-old flies (twi-Gal4 > UAS-Set1-IR/UAS-trx-IR/UAS-trr-IR) were anesthetized by carbon dioxide (CO2) for 3–5 min and females were preselected from each group. Each fly was gently placed on a plate with petroleum jelly (Vaseline) for immobilization with the dorsal aspect facing the OCT microscopy source and then rested for at least 10 min to ensure the fly was fully awake. For each genotype, 10 control and 10 RNAi-expressing flies were used. OCT was used to record the adult heart rhythm and heart wall movement in the same position, i.e., the cardiac chamber in the abdominal segment A2 of each fly. Each measurement was obtained in three different positions within the abdominal segment A2, and these were averaged to obtain the cardiac diameter for that fly. M-mode images recorded the heart wall movement during the cardiac cycle. ImageJ software (version 1.49) (Schneider, Rasband, and Eliceiri 2012) was used to process the images. The diastolic dimension and systolic diameter were processed, measured, and determined based on three consecutive heartbeats. The heart period was determined by counting the total number of beats that occurred during a 15-s recording and then dividing 15 by the number of beats.

4.8. Methylation Levels

Adult (5-day-old) female Drosophila (Hand-GFP;twi-Gal4 > UAS-Set1-IR/UAS-trx-IR/UAS-trr-IR or control, Hand-GFP;twi-Gal4+/−) were dissected and fixed for 10 min in 4% paraformaldehyde in phosphate-buffered saline (1× PBS). Primary antibodies were incubated overnight at 4 °C in 2% bovine serum albumin (BSA; Sigma, St. Louis, MO, USA) with 0.1% Triton-X (Sigma, St. Louis, MO, USA) in 1× PBS. Following washes, secondary antibodies were incubated for 2 h at room temperature in 2% BSA (Sigma, St. Louis, MO, USA) with 0.1% Triton-X (Sigma, St. Louis, MO, USA) in 1× PBS. We previously validated the anti-H3K4me1/2/3 antibodies in fly larval brain tissue (ventral nerve cord and central brain lobes), in which each showed clear expression in the neural nuclei [10]. Here, rabbit anti-H3K4me1 (Abcam, Cambridge, UK; ab8895), rabbit anti-H3K4me2 (Abcam, Cambridge, UK; ab7766), and rabbit anti-H3K4me3 (ActiveMotif, Carlsbad, CA, USA; 39159) were each used at a 1:2000 dilution, followed by Alexa Fluor 568 secondary antibodies at a 1:1000 dilution (Invitrogen, Waltham, MA, USA; A11011). Confocal imaging was performed using a ZEISS LSM900 microscope with a 63× Plan-Apochromat 1.4 N.A. oil objective (ZEISS, Jena, Germany). Images were obtained using ZEN blue edition (version 3.0) acquisition software. Segment A2 of the heart was imaged by collecting Z-stacks. Control groups were imaged first to establish the laser intensity and exposure time for the entire experiment. The exposure time was based on image saturation (at a set point of approximately 70% of maximum saturation) to enable the comparison of fluorescence intensity across all genotypes. ImageJ (version 1.49) (Schneider, Rasband, and Eliceiri 2012)was used for processing.
For quantitative comparison of the nuclear methylation levels, cardiac cells in segment A2 were analyzed. A single image typically captured four cells, equaling four nuclei. We obtained images from six flies for each genotype (RNAi or control), then used the mean fluorescent intensity in the nucleus of ~20 heart cells total (3/4 per fly) to determine the nuclear methylation level. Finally, nuclear methylation levels were normalized to the value obtained from the control flies. ImageJ (version 1.49) (Schneider, Rasband, and Eliceiri 2012) was used for processing. Representative images are shown in the figures.

4.9. RNA Extraction and Sequencing of Drosophila Cardiomyocytes

For each sample, hearts from 50 one-week-old adult female flies (Hand-GFP;twi-Gal4 > UAS-Set1-IR/UAS-trx-IR/UAS-trr-IR or control, Hand-GFP; twi-Gal4+/−) were manually dissected and collected in ice-cold TRIzol LS reagent (Thermo Fisher Scientific, Waltham, MA, USA). Then, RNA extraction was performed according to the instructions provided by the manufacturer (Direct-zol RNA Microprep, Zymo Research, Irvine, CA, USA). RNA quality and concentration were analyzed by agarose gel electrophoresis, the NanoDrop 8000 Spectrophotometer, and Agilent 2100 (Thermo Fisher Scientific, Waltham, MA, USA). More than 400 ng of total RNA for each sample was used in subsequent library preparation and sequencing.
Preparation of the RNA-Seq libraries and their sequencing were carried out by Novogene (Sacramento, CA, USA) using Illumina’s Nova-Seq platform with 150 bp read lengths. We mapped the short reads onto the Drosophila melanogaster reference genome release 6 [58], which we obtained from Ensembl [59]. We used STAR aligner (version 2.4.2a) [60] for short-read mapping with the following parameters: sjdbOverhang, 149; genomeSAindexNbases, 12; and alignIntronMax, 250,000. We used the gene annotation model from Ensembl release 100, which corresponds to FlyBase 6.28 [61]. For the gene and transcript level quantification, we used RSEM (version 1.2.22) [62] with default parameters. The differential expression analyses were carried out on the RSEM output with DESeq2 (version 1.34.0) [63] by comparing the RNAi fly samples to the control (one from this study, Hand-GFP; twi-Gal4+/− and one from our previously published data (GSE173835), 4xHand-Gal4 > w1118 one-week-old flies [64]). We used clusterProfiler (version 4.2.2) [65] for the gene ontology enrichment analysis.

4.10. Statistical Analysis

Statistical analysis was performed using PAST.exe software (version 2.17C) [Natural History Museum, University of Oslo (UiO), Oslo, Norway]. Values are presented as the mean along with the standard deviation (s.d). Data were first tested for normality using the Shapiro–Wilk test (a = 0.05). The Kruskal–Wallis H-test followed by Dunn’s test was used for comparisons between multiple groups (non-normal distributed data). For RNA-Seq, the Wald test was used, and p-values were correct for multiple testing using the Benjamini–Hochberg method. Statistical significance was defined as p (adjusted p for RNA-seq) < 0.05.

Author Contributions

J.-y.Z., H.L. and X.H. performed experiments and analyzed data; J.-y.Z. and Z.H. designed the research; Z.H. provided oversight; and J.-y.Z., J.v.d.L. and Z.H. interpreted the findings and wrote the paper. All authors have read and agreed to the published version of the manuscript.

Funding

Z.H. is supported by U.S. National Institutes of Health (NIH) grants R01-HL134940 and R01-HD111480.

Institutional Review Board Statement

Not applicable.

Informed Consent Statement

Not applicable.

Data Availability Statement

All source data have been deposited in NCBI’s Gene Expression Omnibus and are accessible through GEO accession numbers: GSE240313 (this study), GSE173835 (control used for RNA-seq data analysis) [64], and GSE168774 (scRNA-seq of the developing fly heart) [26]. Other data and materials that support the findings of this study are available from the corresponding authors upon reasonable request.

Acknowledgments

We thank the Bloomington Drosophila Stock Center at Indiana University Bloomington (IN) for the Drosophila lines and the Developmental Studies Hybridoma Bank at the University of Iowa (IA) for the antibody.

Conflicts of Interest

Author Xiaohu Huang was employed by the company Onco4 Inc. The remaining authors declare that the research was conducted in the absence of any commercial or financial relationships that could be construed as a potential conflict of interest.

References

  1. Han, P.; Hang, C.T.; Yang, J.; Chang, C.-P. Chromatin Remodeling in Cardiovascular Development and Physiology. Circ. Res. 2011, 108, 378–396. [Google Scholar] [CrossRef]
  2. Ohtani, K.; Dimmeler, S. Epigenetic Regulation of Cardiovascular Differentiation. Cardiovasc. Res. 2011, 90, 404–412. [Google Scholar] [CrossRef]
  3. van Weerd, J.H.; Koshiba-Takeuchi, K.; Kwon, C.; Takeuchi, J.K. Epigenetic Factors and Cardiac Development. Cardiovasc. Res. 2011, 91, 203–211. [Google Scholar] [CrossRef] [PubMed]
  4. Zhu, J.-Y.; van de Leemput, J.; Han, Z. The Roles of Histone Lysine Methyltransferases in Heart Development and Disease. J. Cardiovasc. Dev. Dis. 2023, 10, 305. [Google Scholar] [CrossRef] [PubMed]
  5. Collins, B.E.; Greer, C.B.; Coleman, B.C.; Sweatt, J.D. Histone H3 Lysine K4 Methylation and Its Role in Learning and Memory. Epigenet. Chromatin 2019, 12, 7. [Google Scholar] [CrossRef] [PubMed]
  6. Zaidi, S.; Choi, M.; Wakimoto, H.; Ma, L.; Jiang, J.; Overton, J.D.; Romano-Adesman, A.; Bjornson, R.D.; Breitbart, R.E.; Brown, K.K.; et al. De Novo Mutations in Histone-Modifying Genes in Congenital Heart Disease. Nature 2013, 498, 220–223. [Google Scholar] [CrossRef] [PubMed]
  7. Shilatifard, A. The COMPASS Family of Histone H3K4 Methylases: Mechanisms of Regulation in Development and Disease Pathogenesis. Annu. Rev. Biochem. 2012, 81, 65–95. [Google Scholar] [CrossRef] [PubMed]
  8. Mohan, M.; Herz, H.-M.; Smith, E.R.; Zhang, Y.; Jackson, J.; Washburn, M.P.; Florens, L.; Eissenberg, J.C.; Shilatifard, A. The COMPASS Family of H3K4 Methylases in Drosophila. Mol. Cell. Biol. 2011, 31, 4310–4318. [Google Scholar] [CrossRef]
  9. Takahashi, Y.-H.; Westfield, G.H.; Oleskie, A.N.; Trievel, R.C.; Shilatifard, A.; Skiniotis, G. Structural Analysis of the Core COMPASS Family of Histone H3K4 Methylases from Yeast to Human. Proc. Natl. Acad. Sci. USA 2011, 108, 20526–20531. [Google Scholar] [CrossRef]
  10. Huang, W.; Zhu, J.-Y.; Fu, Y.; van de Leemput, J.; Han, Z. Lpt, Trr, and Hcf Regulate Histone Mono- and Dimethylation That Are Essential for Drosophila Heart Development. Dev. Biol. 2022, 490, 53–65. [Google Scholar] [CrossRef]
  11. Szulik, M.W.; Davis, K.; Bakhtina, A.; Azarcon, P.; Bia, R.; Horiuchi, E.; Franklin, S. Transcriptional Regulation by Methyltransferases and Their Role in the Heart: Highlighting Novel Emerging Functionality. Am. J. Physiol. Heart Circ. Physiol. 2020, 319, H847–H865. [Google Scholar] [CrossRef]
  12. Qian, C.; Zhou, M.-M. SET Domain Protein Lysine Methyltransferases: Structure, Specificity and Catalysis. Cell. Mol. Life Sci. 2006, 63, 2755–2763. [Google Scholar] [CrossRef]
  13. Fagan, R.J.; Dingwall, A.K. COMPASS Ascending: Emerging Clues Regarding the Roles of MLL3/KMT2C and MLL2/KMT2D Proteins in Cancer. Cancer Lett. 2019, 458, 56–65. [Google Scholar] [CrossRef] [PubMed]
  14. Herz, H.-M.; Hu, D.; Shilatifard, A. Enhancer Malfunction in Cancer. Mol. Cell 2014, 53, 859–866. [Google Scholar] [CrossRef] [PubMed]
  15. Ji, W.; Ferdman, D.; Copel, J.; Scheinost, D.; Shabanova, V.; Brueckner, M.; Khokha, M.K.; Ment, L.R. De Novo Damaging Variants Associated with Congenital Heart Diseases Contribute to the Connectome. Sci. Rep. 2020, 10, 7046. [Google Scholar] [CrossRef] [PubMed]
  16. Jinxiu, L.; Shuimei, L.; Ming, X.; Jonathan, L.C.; Xiangju, L.; Wenyuan, D. Wiedemann-Steiner Syndrome with a de Novo Mutation in KMT2A: A Case Report. Medicine 2020, 99, e19813. [Google Scholar] [CrossRef] [PubMed]
  17. Borland, S.; Tenin, G.; Williams, S.; Monaghan, R.; Baxter, M.; Ray, D.; Abraham, S.; Keavney, B. BS9 KMT2C—A Tetralogy of Fallot Candidate Gene. Heart 2019, 105, A145–A146. [Google Scholar]
  18. Ang, S.-Y.; Uebersohn, A.; Spencer, C.I.; Huang, Y.; Lee, J.-E.; Ge, K.; Bruneau, B.G. KMT2D Regulates Specific Programs in Heart Development via Histone H3 Lysine 4 Di-Methylation. Development 2016, 143, 810–821. [Google Scholar] [CrossRef]
  19. Serrano, M.d.L.A.; Demarest, B.L.; Tone-Pah-Hote, T.; Tristani-Firouzi, M.; Yost, H.J. Inhibition of Notch Signaling Rescues Cardiovascular Development in Kabuki Syndrome. PLoS Biol. 2019, 17, e3000087. [Google Scholar] [CrossRef]
  20. Schwenty-Lara, J.; Nürnberger, A.; Borchers, A. Loss of Function of Kmt2d, a Gene Mutated in Kabuki Syndrome, Affects Heart Development in Xenopus Laevis. Dev. Dyn. 2019, 248, 465–476. [Google Scholar] [CrossRef]
  21. Van Laarhoven, P.M.; Neitzel, L.R.; Quintana, A.M.; Geiger, E.A.; Zackai, E.H.; Clouthier, D.E.; Artinger, K.B.; Ming, J.E.; Shaikh, T.H. Kabuki Syndrome Genes KMT2D and KDM6A: Functional Analyses Demonstrate Critical Roles in Craniofacial, Heart and Brain Development. Hum. Mol. Genet. 2015, 24, 4443–4453. [Google Scholar] [CrossRef]
  22. Bokinni, Y. Kabuki Syndrome Revisited. J. Hum. Genet. 2012, 57, 223–227. [Google Scholar] [CrossRef] [PubMed]
  23. Digilio, M.C.; Gnazzo, M.; Lepri, F.; Dentici, M.L.; Pisaneschi, E.; Baban, A.; Passarelli, C.; Capolino, R.; Angioni, A.; Novelli, A.; et al. Congenital Heart Defects in Molecularly Proven Kabuki Syndrome Patients. Am. J. Med. Genet. A 2017, 173, 2912–2922. [Google Scholar] [CrossRef] [PubMed]
  24. Souidi, A.; Jagla, K. Drosophila Heart as a Model for Cardiac Development and Diseases. Cells 2021, 10, 3078. [Google Scholar] [CrossRef] [PubMed]
  25. Zhu, J.-Y.; Fu, Y.; Nettleton, M.; Richman, A.; Han, Z. High Throughput in Vivo Functional Validation of Candidate Congenital Heart Disease Genes in Drosophila. eLife 2017, 6, e22617. [Google Scholar] [CrossRef] [PubMed]
  26. Huang, X.; Fu, Y.; Lee, H.; Zhao, Y.; Yang, W.; van de Leemput, J.; Han, Z. Single-Cell Profiling of the Developing Embryonic Heart in Drosophila. Development 2023, 150, dev201936. [Google Scholar] [CrossRef] [PubMed]
  27. modENCODE Consortium; Roy, S.; Ernst, J.; Kharchenko, P.V.; Kheradpour, P.; Negre, N.; Eaton, M.L.; Landolin, J.M.; Bristow, C.A.; Ma, L.; et al. Identification of Functional Elements and Regulatory Circuits by Drosophila ModENCODE. Science 2010, 330, 1787–1797. [Google Scholar] [PubMed]
  28. Graveley, B.R.; Brooks, A.N.; Carlson, J.W.; Duff, M.O.; Landolin, J.M.; Yang, L.; Artieri, C.G.; van Baren, M.J.; Boley, N.; Booth, B.W.; et al. The Developmental Transcriptome of Drosophila Melanogaster. Nature 2011, 471, 473–479. [Google Scholar] [CrossRef]
  29. Vaughan, L.; Marley, R.; Miellet, S.; Hartley, P.S. The Impact of SPARC on Age-Related Cardiac Dysfunction and Fibrosis in Drosophila. Exp. Gerontol. 2018, 109, 59–66. [Google Scholar] [CrossRef]
  30. Hughes, C.J.R.; Turner, S.; Andrews, R.M.; Vitkin, A.; Jacobs, J.R. Matrix Metalloproteinases Regulate ECM Accumulation but Not Larval Heart Growth in Drosophila Melanogaster. J. Mol. Cell. Cardiol. 2020, 140, 42–55. [Google Scholar] [CrossRef]
  31. Gupta, H.P.; Fatima, M.-U.; Pandey, R.; Ravi Ram, K. Adult Exposure of Atrazine Alone or in Combination with Carbohydrate Diet Hastens the Onset/Progression of Type 2 Diabetes in Drosophila. Life Sci. 2023, 316, 121370. [Google Scholar] [CrossRef]
  32. Ren, J.; Zeng, Q.; Wu, H.; Liu, X.; Guida, M.C.; Huang, W.; Zhai, Y.; Li, J.; Ocorr, K.; Bodmer, R.; et al. Deacetylase-Dependent and -Independent Role of HDAC3 in Cardiomyopathy. J. Cell. Physiol. 2023, 238, 647–658. [Google Scholar] [CrossRef] [PubMed]
  33. Tristani-Firouzi, M.; Jensen, J.L.; Donaldson, M.R.; Sansone, V.; Meola, G.; Hahn, A.; Bendahhou, S.; Kwiecinski, H.; Fidzianska, A.; Plaster, N.; et al. Functional and Clinical Characterization of KCNJ2 Mutations Associated with LQT7 (Andersen Syndrome). J. Clin. Investig. 2002, 110, 381–388. [Google Scholar] [CrossRef] [PubMed]
  34. Ocorr, K.; Reeves, N.L.; Wessells, R.J.; Fink, M.; Chen, H.-S.V.; Akasaka, T.; Yasuda, S.; Metzger, J.M.; Giles, W.; Posakony, J.W.; et al. KCNQ Potassium Channel Mutations Cause Cardiac Arrhythmias in Drosophila That Mimic the Effects of Aging. Proc. Natl. Acad. Sci. USA 2007, 104, 3943–3948. [Google Scholar] [CrossRef]
  35. Kurtz, P.; Jones, A.E.; Tiwari, B.; Link, N.; Wylie, A.; Tracy, C.; Krämer, H.; Abrams, J.M. Drosophila P53 Directs Nonapoptotic Programs in Postmitotic Tissue. Mol. Biol. Cell 2019, 30, 1339–1351. [Google Scholar] [CrossRef] [PubMed]
  36. Lee, J.-H.; Tate, C.M.; You, J.-S.; Skalnik, D.G. Identification and Characterization of the Human Set1B Histone H3-Lys4 Methyltransferase Complex. J. Biol. Chem. 2007, 282, 13419–13428. [Google Scholar] [CrossRef]
  37. Shinsky, S.A.; Monteith, K.E.; Viggiano, S.; Cosgrove, M.S. Biochemical Reconstitution and Phylogenetic Comparison of Human SET1 Family Core Complexes Involved in Histone Methylation. J. Biol. Chem. 2015, 290, 6361–6375. [Google Scholar] [CrossRef]
  38. Higgs, M.R.; Sato, K.; Reynolds, J.J.; Begum, S.; Bayley, R.; Goula, A.; Vernet, A.; Paquin, K.L.; Skalnik, D.G.; Kobayashi, W.; et al. Histone Methylation by SETD1A Protects Nascent DNA through the Nucleosome Chaperone Activity of FANCD2. Mol. Cell 2018, 71, 25–41.e6. [Google Scholar] [CrossRef]
  39. Jones, W.D.; Dafou, D.; McEntagart, M.; Woollard, W.J.; Elmslie, F.V.; Holder-Espinasse, M.; Irving, M.; Saggar, A.K.; Smithson, S.; Trembath, R.C.; et al. De Novo Mutations in MLL Cause Wiedemann-Steiner Syndrome. Am. J. Hum. Genet. 2012, 91, 358–364. [Google Scholar] [CrossRef]
  40. Miyake, N.; Tsurusaki, Y.; Koshimizu, E.; Okamoto, N.; Kosho, T.; Brown, N.J.; Tan, T.Y.; Yap, P.J.J.; Suzumura, H.; Tanaka, T.; et al. Delineation of Clinical Features in Wiedemann-Steiner Syndrome Caused by KMT2A Mutations. Clin. Genet. 2016, 89, 115–119. [Google Scholar] [CrossRef]
  41. Sheppard, S.E.; Campbell, I.M.; Harr, M.H.; Gold, N.; Li, D.; Bjornsson, H.T.; Cohen, J.S.; Fahrner, J.A.; Fatemi, A.; Harris, J.R.; et al. Expanding the Genotypic and Phenotypic Spectrum in a Diverse Cohort of 104 Individuals with Wiedemann-Steiner Syndrome. Am. J. Med. Genet. A 2021, 185, 1649–1665. [Google Scholar] [CrossRef]
  42. Jiang, D.-S.; Yi, X.; Li, R.; Su, Y.-S.; Wang, J.; Chen, M.-L.; Liu, L.-G.; Hu, M.; Cheng, C.; Zheng, P.; et al. The Histone Methyltransferase Mixed Lineage Leukemia (MLL) 3 May Play a Potential Role on Clinical Dilated Cardiomyopathy. Mol. Med. 2017, 23, 196–203. [Google Scholar] [CrossRef] [PubMed]
  43. Lee, J.-E.; Wang, C.; Xu, S.; Cho, Y.-W.; Wang, L.; Feng, X.; Baldridge, A.; Sartorelli, V.; Zhuang, L.; Peng, W.; et al. H3K4 Mono- and Di-Methyltransferase MLL4 Is Required for Enhancer Activation during Cell Differentiation. eLife 2013, 2, e01503. [Google Scholar] [CrossRef] [PubMed]
  44. Ng, S.B.; Bigham, A.W.; Buckingham, K.J.; Hannibal, M.C.; McMillin, M.J.; Gildersleeve, H.I.; Beck, A.E.; Tabor, H.K.; Cooper, G.M.; Mefford, H.C.; et al. Exome Sequencing Identifies MLL2 Mutations as a Cause of Kabuki Syndrome. Nat. Genet. 2010, 42, 790–793. [Google Scholar] [CrossRef] [PubMed]
  45. Li, A.H.; Hanchard, N.A.; Furthner, D.; Fernbach, S.; Azamian, M.; Nicosia, A.; Rosenfeld, J.; Muzny, D.; D’Alessandro, L.C.A.; Morris, S.; et al. Whole Exome Sequencing in 342 Congenital Cardiac Left Sided Lesion Cases Reveals Extensive Genetic Heterogeneity and Complex Inheritance Patterns. Genome Med. 2017, 9, 95. [Google Scholar] [CrossRef]
  46. Cuvertino, S.; Hartill, V.; Colyer, A.; Garner, T.; Nair, N.; Al-Gazali, L.; Canham, N.; Faundes, V.; Flinter, F.; Hertecant, J.; et al. A Restricted Spectrum of Missense KMT2D Variants Cause a Multiple Malformations Disorder Distinct from Kabuki Syndrome. Genet. Med. 2020, 22, 867–877. [Google Scholar] [CrossRef] [PubMed]
  47. Liang, S.; Shi, X.; Yu, C.; Shao, X.; Zhou, H.; Li, X.; Chang, C.; Lai, K.S.; Ma, J.; Zhang, R. Identification of Novel Candidate Genes in Heterotaxy Syndrome Patients with Congenital Heart Diseases by Whole Exome Sequencing. Biochim. Biophys. Acta Mol. Basis Dis. 2020, 1866, 165906. [Google Scholar] [CrossRef]
  48. Sun, H.; Yi, T.; Hao, X.; Yan, H.; Wang, J.; Li, Q.; Gu, X.; Zhou, X.; Wang, S.; Wang, X.; et al. Contribution of Single-Gene Defects to Congenital Cardiac Left-Sided Lesions in the Prenatal Setting. Ultrasound Obstet. Gynecol. 2020, 56, 225–232. [Google Scholar] [CrossRef]
  49. Luo, S.; Chen, L.; Wei, W.; Tan, L.; Zhang, M.; Duan, Z.; Cao, J.; Zhou, Y.; Zhou, A.; He, X. Prenatal Genetic Diagnosis in Three Fetuses With Left Heart Hypoplasia (LHH) From Three Unrelated Families. Front. Cardiovasc. Med. 2021, 8, 631374. [Google Scholar] [CrossRef]
  50. Wan, X.; Liu, L.; Ding, X.; Zhou, P.; Yuan, X.; Zhou, Z.; Hu, P.; Zhou, H.; Li, Q.; Zhang, S.; et al. Mll2 Controls Cardiac Lineage Differentiation of Mouse Embryonic Stem Cells by Promoting H3K4me3 Deposition at Cardiac-Specific Genes. Stem Cell Rev. Rep. 2014, 10, 643–652. [Google Scholar] [CrossRef]
  51. Chen, L.; Hassani Nia, F.; Stauber, T. Ion Channels and Transporters in Muscle Cell Differentiation. Int. J. Mol. Sci. 2021, 22, 13615. [Google Scholar] [CrossRef]
  52. Han, Z.; Olson, E.N. Hand Is a Direct Target of Tinman and GATA Factors during Drosophila Cardiogenesis and Hematopoiesis. Development 2005, 132, 3525–3536. [Google Scholar] [CrossRef]
  53. Zhu, J.-Y.; Fu, Y.; Richman, A.; Han, Z. Validating Candidate Congenital Heart Disease Genes in Drosophila. Bio-Protocol 2017, 7, e2350. [Google Scholar] [CrossRef] [PubMed]
  54. Schneider, C.A.; Rasband, W.S.; Eliceiri, K.W. NIH Image to ImageJ: 25 Years of Image Analysis. Nat. Methods 2012, 9, 671–675. [Google Scholar] [CrossRef] [PubMed]
  55. Spletter, M.L.; Barz, C.; Yeroslaviz, A.; Zhang, X.; Lemke, S.B.; Bonnard, A.; Brunner, E.; Cardone, G.; Basler, K.; Habermann, B.H.; et al. A Transcriptomics Resource Reveals a Transcriptional Transition during Ordered Sarcomere Morphogenesis in Flight Muscle. eLife 2018, 7, e34058. [Google Scholar] [CrossRef] [PubMed]
  56. Yelbuz, T.M.; Choma, M.A.; Thrane, L.; Kirby, M.L.; Izatt, J.A. Optical Coherence Tomography: A New High-Resolution Imaging Technology to Study Cardiac Development in Chick Embryos. Circulation 2002, 106, 2771–2774. [Google Scholar] [CrossRef] [PubMed]
  57. Choma, M.A.; Izatt, S.D.; Wessells, R.J.; Bodmer, R.; Izatt, J.A. Images in Cardiovascular Medicine: In Vivo Imaging of the Adult Drosophila Melanogaster Heart with Real-Time Optical Coherence Tomography. Circulation 2006, 114, e35–e36. [Google Scholar] [CrossRef] [PubMed]
  58. Hoskins, R.A.; Carlson, J.W.; Wan, K.H.; Park, S.; Mendez, I.; Galle, S.E.; Booth, B.W.; Pfeiffer, B.D.; George, R.A.; Svirskas, R.; et al. The Release 6 Reference Sequence of the Drosophila Melanogaster Genome. Genome Res. 2015, 25, 445–458. [Google Scholar] [CrossRef]
  59. Howe, K.L.; Achuthan, P.; Allen, J.; Allen, J.; Alvarez-Jarreta, J.; Amode, M.R.; Armean, I.M.; Azov, A.G.; Bennett, R.; Bhai, J.; et al. Ensembl 2021. Nucleic Acids Res. 2021, 49, D884–D891. [Google Scholar] [CrossRef]
  60. Dobin, A.; Davis, C.A.; Schlesinger, F.; Drenkow, J.; Zaleski, C.; Jha, S.; Batut, P.; Chaisson, M.; Gingeras, T.R. STAR: Ultrafast Universal RNA-Seq Aligner. Bioinformatics 2013, 29, 15–21. [Google Scholar] [CrossRef]
  61. Gramates, L.S.; Agapite, J.; Attrill, H.; Calvi, B.R.; Crosby, M.A.; Dos Santos, G.; Goodman, J.L.; Goutte-Gattat, D.; Jenkins, V.K.; Kaufman, T.; et al. FlyBase: A Guided Tour of Highlighted Features. Genetics 2022, 220, iyac035. [Google Scholar] [CrossRef] [PubMed]
  62. Li, B.; Dewey, C.N. RSEM: Accurate Transcript Quantification from RNA-Seq Data with or without a Reference Genome. BMC Bioinform. 2011, 12, 323. [Google Scholar] [CrossRef] [PubMed]
  63. Love, M.I.; Huber, W.; Anders, S. Moderated Estimation of Fold Change and Dispersion for RNA-Seq Data with DESeq2. Genome Biol. 2014, 15, 550. [Google Scholar] [CrossRef] [PubMed]
  64. Zhu, J.-Y.; Wang, G.; Huang, X.; Lee, H.; Lee, J.-G.; Yang, P.; van de Leemput, J.; Huang, W.; Kane, M.A.; Yang, P.; et al. SARS-CoV-2 Nsp6 Damages Drosophila Heart and Mouse Cardiomyocytes through MGA/MAX Complex-Mediated Increased Glycolysis. Commun. Biol. 2022, 5, 1039. [Google Scholar] [CrossRef]
  65. Wu, T.; Hu, E.; Xu, S.; Chen, M.; Guo, P.; Dai, Z.; Feng, T.; Zhou, L.; Tang, W.; Zhan, L.; et al. ClusterProfiler 4.0: A Universal Enrichment Tool for Interpreting Omics Data. Innovation 2021, 2, 100141. [Google Scholar] [CrossRef]
Figure 1. Drosophila COMPASS core Set1, trx, and trr expression at different embryonic heart developmental stages. (A) Schematic representation of three different Drosophila COMPASS complexes: Set1/COMPASS, Trithorax (Trx) COMPASS-like, and Trithorax-related (Trr) COMPASS-like complex. Ash2, Absent, small, or homeotic discs 2; Cfp1, CXXC finger protein 1; Dpy-30L1, Dpy-30-like 1; Hcf, Host cell factor; Mnn1, Menin 1; Ncoa6, Nuclear receptor coactivator 6; Pa1, PTIP associated 1; Ptip, PAX transcription activation domain interacting protein; Rbbp5, Retinoblastoma binding protein 5; Set1, SET domain containing 1; Utx, Utx histone demethylase; Wdr82, WD repeat domain 82; Wds, Will die slowly. (B) Relative gene expression levels of Set1, trx, and trr in Drosophila heart (cardiogenic progenitors) at embryonic stages 13, 14-E (early), 14-L (late), 15, and 16. None of the changes reached statistical significance.
Ijms 24 17314 g001
Figure 7. Model of Set1-, trx-, and trr-mediated Drosophila heart development. Graphical representation of proposed model for SET domain containing 1 (Set1), trithorax (trx), and trithorax-related (trr)-mediated fly heart development; H3K4 methyltransferases and core subunits of the different COMPASS complexes. Stage refers to the established Drosophila developmental stages. Fly larvae demonstrate the developing heart, represented in red. At the early stages (stage 13–14), the heart progenitor cells migrate, and Set1 and trr are active; during later stages (stage 16–17), the heart forms as a closed tube, Set1 remains active, and trx takes over from trr.
Ijms 24 17314 g007
Disclaimer/Publisher’s Note: The statements, opinions and data contained in all publications are solely those of the individual author(s) and contributor(s) and not of MDPI and/or the editor(s). MDPI and/or the editor(s) disclaim responsibility for any injury to people or property resulting from any ideas, methods, instructions or products referred to in the content.

