
Using an RNA Aptamer to Inhibit the Action of Effector Proteins of Plant Pathogens


Abstract
:1. Introduction
2. Results and Discussion
3. Material and Methods
3.1. HopU1 Preparations
3.2. Mass Spectrometry (LC–MS)
3.3. SELEX
3.4. Agrobacterial Transformation of A. Thaliana Plants
3.5. P. syringae hopU1 Mutant Creation
3.6. Analysis of the Transgenic Arabidopsis Plants’ Resistance to the Action of Phytopathogens
3.7. Quantitative Real-Time PCR
4. Conclusions
Supplementary Materials
Author Contributions
Funding
Data Availability Statement
Acknowledgments
Conflicts of Interest
References
- Büttner, D. Behind the lines–actions of bacterial type III effector proteins in plant cells. FEMS Microbiol. Rev. 2016, 40, 894–937. [Google Scholar] [CrossRef] [PubMed]
- Kjemtrup, S.; Nimchuk, Z.; Dangl, J.L. Effector proteins of phytopathogenic bacteria: Bifunctional signals in virulence and host recognition. Curr. Opin. Microbiol. 2000, 3, 73–78. [Google Scholar] [CrossRef] [PubMed]
- Ceulemans, E.; Ibrahim, H.M.; De Coninck, B.; Goossens, A. Pathogen effectors: Exploiting the promiscuity of plant sig-naling hubs. Trends Plant Sci. 2021, 26, 1–16. [Google Scholar] [CrossRef]
- Alfano, J.R.; Collmer, A. Type III secretion system effector proteins: Double agents in bacterial disease and plant defense. Annu. Rev. Phytopathol. 2004, 42, 385–414. [Google Scholar] [CrossRef] [PubMed]
- Nicaise, V.; Joe, A.; Jeong, B.-R.; Korneli, C.; Boutrot, F.; Westedt, I.; Staiger, D.; Alfano, J.R.; Zipfel, C. Pseudomonas HopU1 modulates plant immune receptor levels by blocking the interaction of their mRNAs with GRP7. EMBO J. 2013, 32, 701–712. [Google Scholar] [CrossRef]
- Jeong, B.-R.; Lin, Y.; Joe, A.; Guo, M.; Korneli, C.; Yang, H.; Wang, P.; Yu, M.; Cerny, R.L.; Staiger, D.; et al. Structure Function Analysis of an ADP-ribosyltransferase Type III Effector and Its RNA-binding Target in Plant Immunity. J. Biol. Chem. 2011, 286, 43272–43281. [Google Scholar] [CrossRef]
- Fu, Z.Q.; Guo, M.; Jeong, B.-R.; Tian, F.; Elthon, T.E.; Cerny, R.L.; Staiger, D.; Alfano, J.R. A type III effector ADP-ribosylates RNA-binding proteins and quells plant immunity. Nature 2007, 447, 284–288. [Google Scholar] [CrossRef]
- Staiger, D.; Zecca, L.; Kirk, D.A.W.; Apel, K.; Eckstein, L. The circadian clock regulated RNA-binding protein AtGRP7 autoregulates its expression by influencing alternative splicing of its own pre-mRNA. Plant J. 2003, 33, 361–371. [Google Scholar] [CrossRef]
- Pestourie, C.; Tavitian, B.; Duconge, F. Aptamers against extracellular targets for in vivo applications. Biochimie 2005, 87, 921–930. [Google Scholar] [CrossRef]
- Nimjee, S.M.; Rusconi, C.P.; Sullenger, B.A. Aptamers: An emerging class of therapeutics. Annu. Rev. Med. 2005, 56, 555–583. [Google Scholar] [CrossRef]
- Abdeeva, I.A.; Maloshenok, L.G.; Pogorelko, G.V.; Mokrykova, M.V.; Bruskin, S.A. RNA-aptamers—As targeted inhibitors of protein functions in plants. J. Plant Physiol. 2018, 232, 127–129. [Google Scholar] [CrossRef]
- Deng, B.; Lin, Y.; Wang, C.; Li, F.; Wang, Z.; Zhang, H.; Li, X.F.; Le, X.C. Aptamer binding assays for proteins: The thrombin example. Anal. Chim. Acta 2014, 837, 1–15. [Google Scholar] [CrossRef] [PubMed]
- Antonyuk, S.V.; Trevitt, C.R.; Strange, R.W.; Jackson, G.S.; Sangar, D.; Batchelor, M.; Cooper, S.; Fraser, C.; Jones, S.; Georgiou, T.; et al. Crystal structure of human prion protein bound to a therapeutic antibody. Proc. Natl. Acad. Sci. USA 2009, 106, 2554–2558. [Google Scholar] [CrossRef] [PubMed]
- Patel, D.J.; Suri, A.K.; Jiang, F.; Jiang, L.; Fan, P.; Kumar, R.; Nonin, S. Structure, recognition and adaptive binding in RNA aptamer complexes. J. Mol. Biol. 1997, 272, 645–664. [Google Scholar] [CrossRef] [PubMed]
- Ringquist, S.; Jones, T.; Snyder, E.E.; Gibson, T.; Boni, I.; Gold, L. High-affinity RNA ligands to Escherichia coli ribosomes and ribosomal protein S1: Comparison of natural and unnatural binding sites. Biochemistry 1995, 34, 3640–3648. [Google Scholar] [CrossRef] [PubMed]
- Convery, M.A.; Rowsell, S.; Storehouse, N.J.; Ellington, A.D.; Hirao, I.; Murray, J.B.; Peabody, D.S.; Phillips, S.E.; Stockley, P.G. Crystal structure of an RNA aptamer-protein complex at 2.8 A resolution. Nat. Struct. Biol. 1998, 5, 133–139. [Google Scholar] [CrossRef]
- Hermann, T.; Patel, J. RNA bulges as architectural and recognition motifs. Structure 2000, 8, 47–54. [Google Scholar] [CrossRef]
- Chen, S.; Songkumarn, P.; Liu, J.L.; Wang, G.L. A Versatile Zero Background T-Vector System for Gene Cloning and Functional Genomics. Plant Physiol. 2009, 150, 1111–1121. [Google Scholar] [CrossRef]
- Manley, J.L. SELEX to Identify Protein-Binding Sites on RNA. Cold Spring Harb. Protoc. 2013, 2013, 156–163. [Google Scholar] [CrossRef]
- Logemann, E.; Birkenbihl, R.P.; Ülker, B.; Somssich, I.E. An improved method for preparing Agrobacterium cells that simplifies the Arabidopsis transformation protocol. Plant Methods 2006, 2, 16. [Google Scholar] [CrossRef]
- Prentki, P.; Krisch, H.M. In vitro insertional mutagenesis with a selectable DNA fragment. Gene 1984, 29, 303–313. [Google Scholar] [CrossRef] [PubMed]
- Keen, N.; Tamaki, S.; Kobayashi, D.; Trollinger, D. Improved broad-host-range plasmids for DNA cloning in Gram-negative bacteria. Gene 1988, 70, 191–197. [Google Scholar] [CrossRef] [PubMed]
- Swanson, J.; Kearney, B.; Dahlbeck, D.; Staskawicz, B.J. Cloned avirulence gene of Xanthomonas campestris pv. vesicatoria complements spontaneous race-change mutants. Mol. Plant-Microbe Interact. 1988, 1, 5–9. [Google Scholar] [CrossRef]


| Aptamer ID | Sequence |
|---|---|
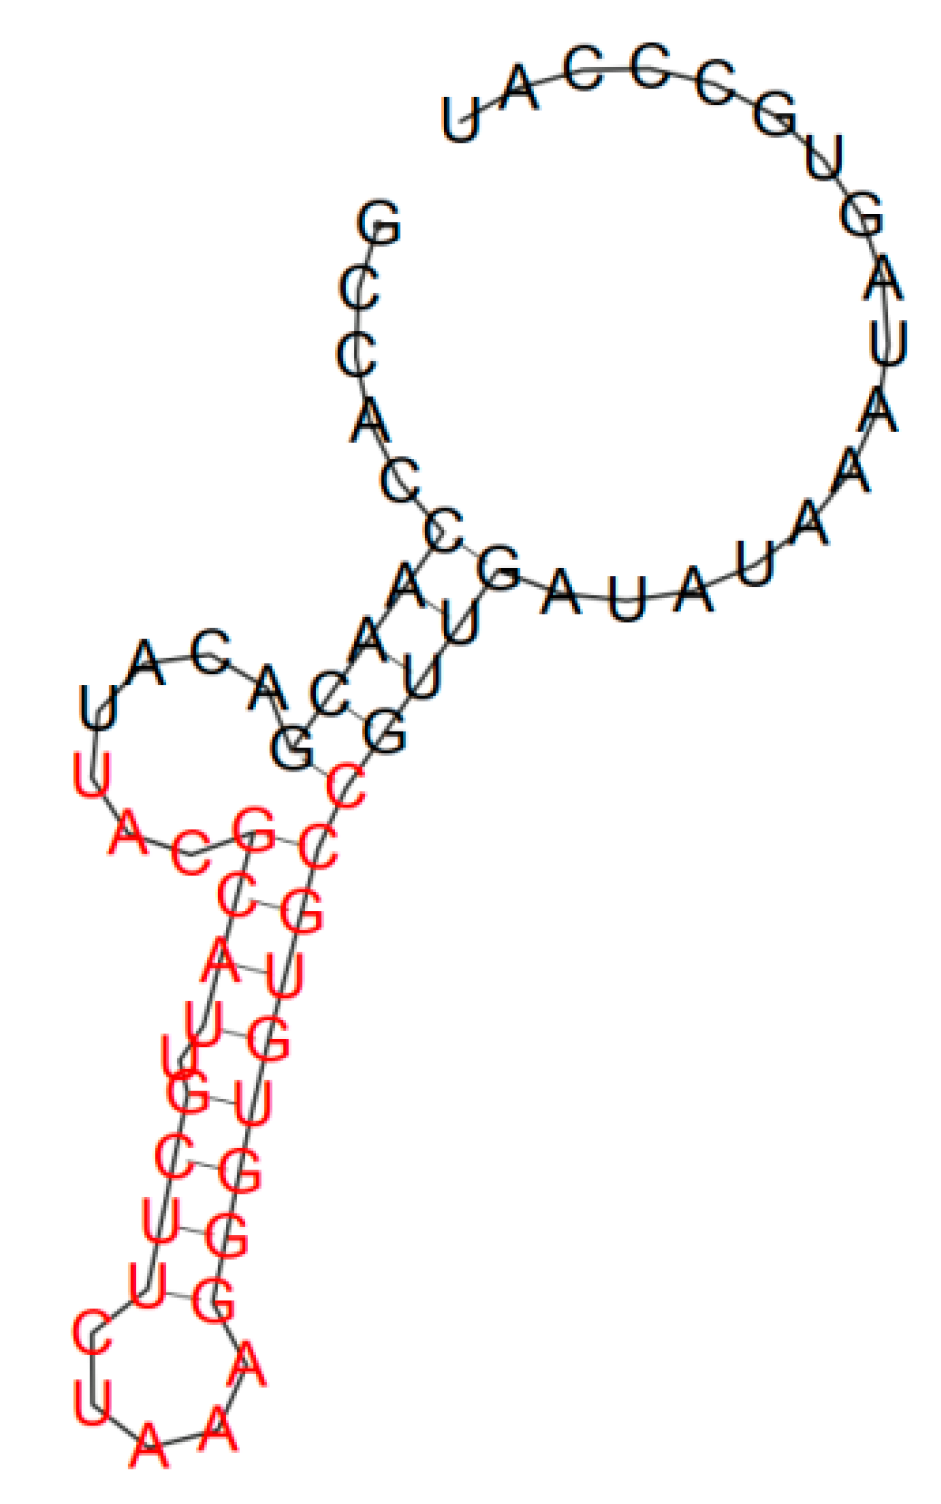
| H1 | 5′-GCCACCAACGACATTTTGTCAATCTGTAGAAAAAATCAGGGTTGATATAAATAGTGCCCAT-3′ |
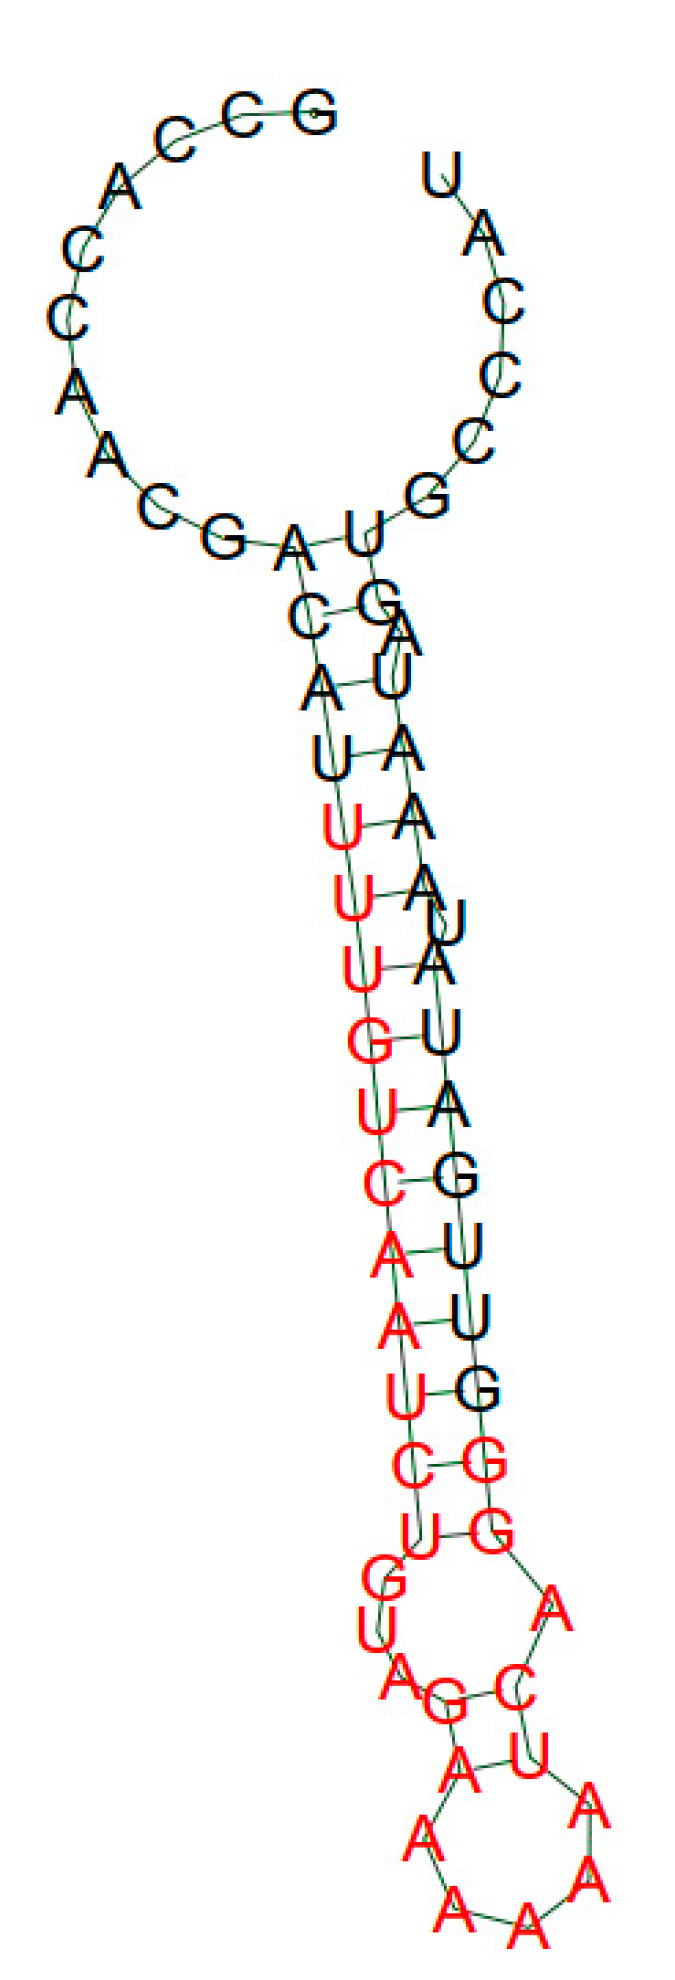
| H2 | 5′-GCCACCAACGACATTACGCATTGCTTCTAAAGGGTGTGCCGTTGATATAAATAGTGCCCAT-3′ |
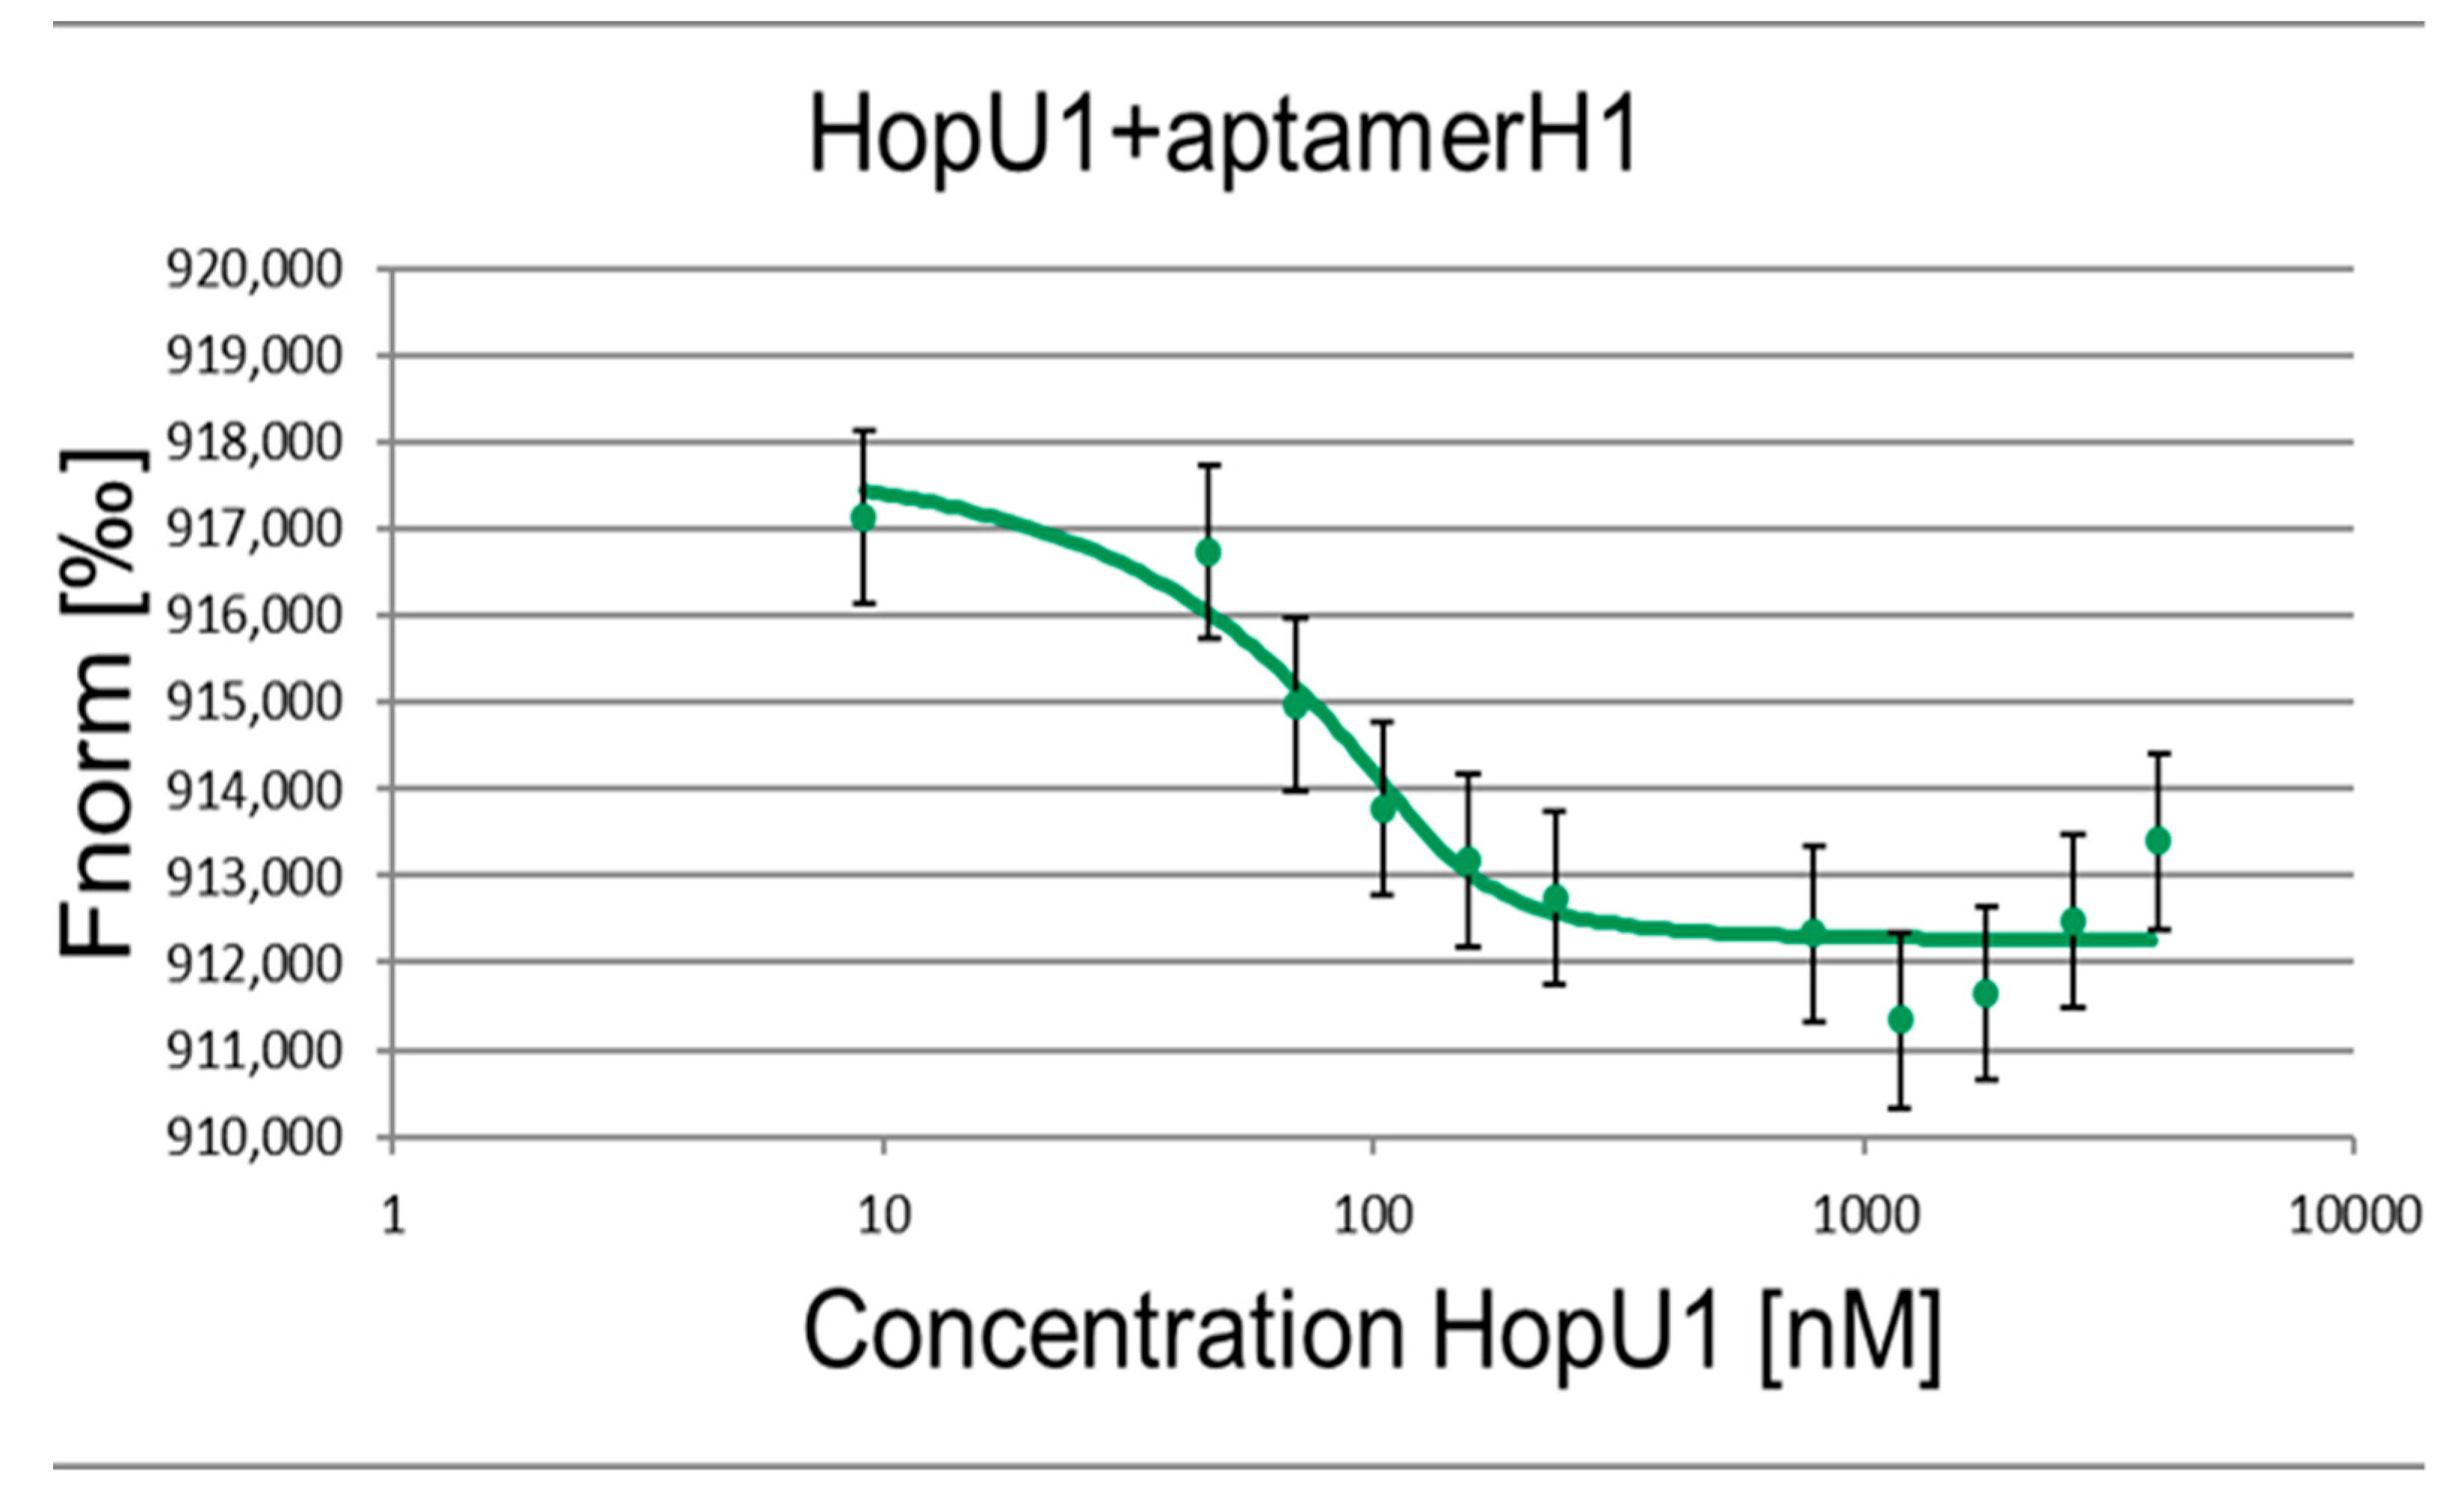
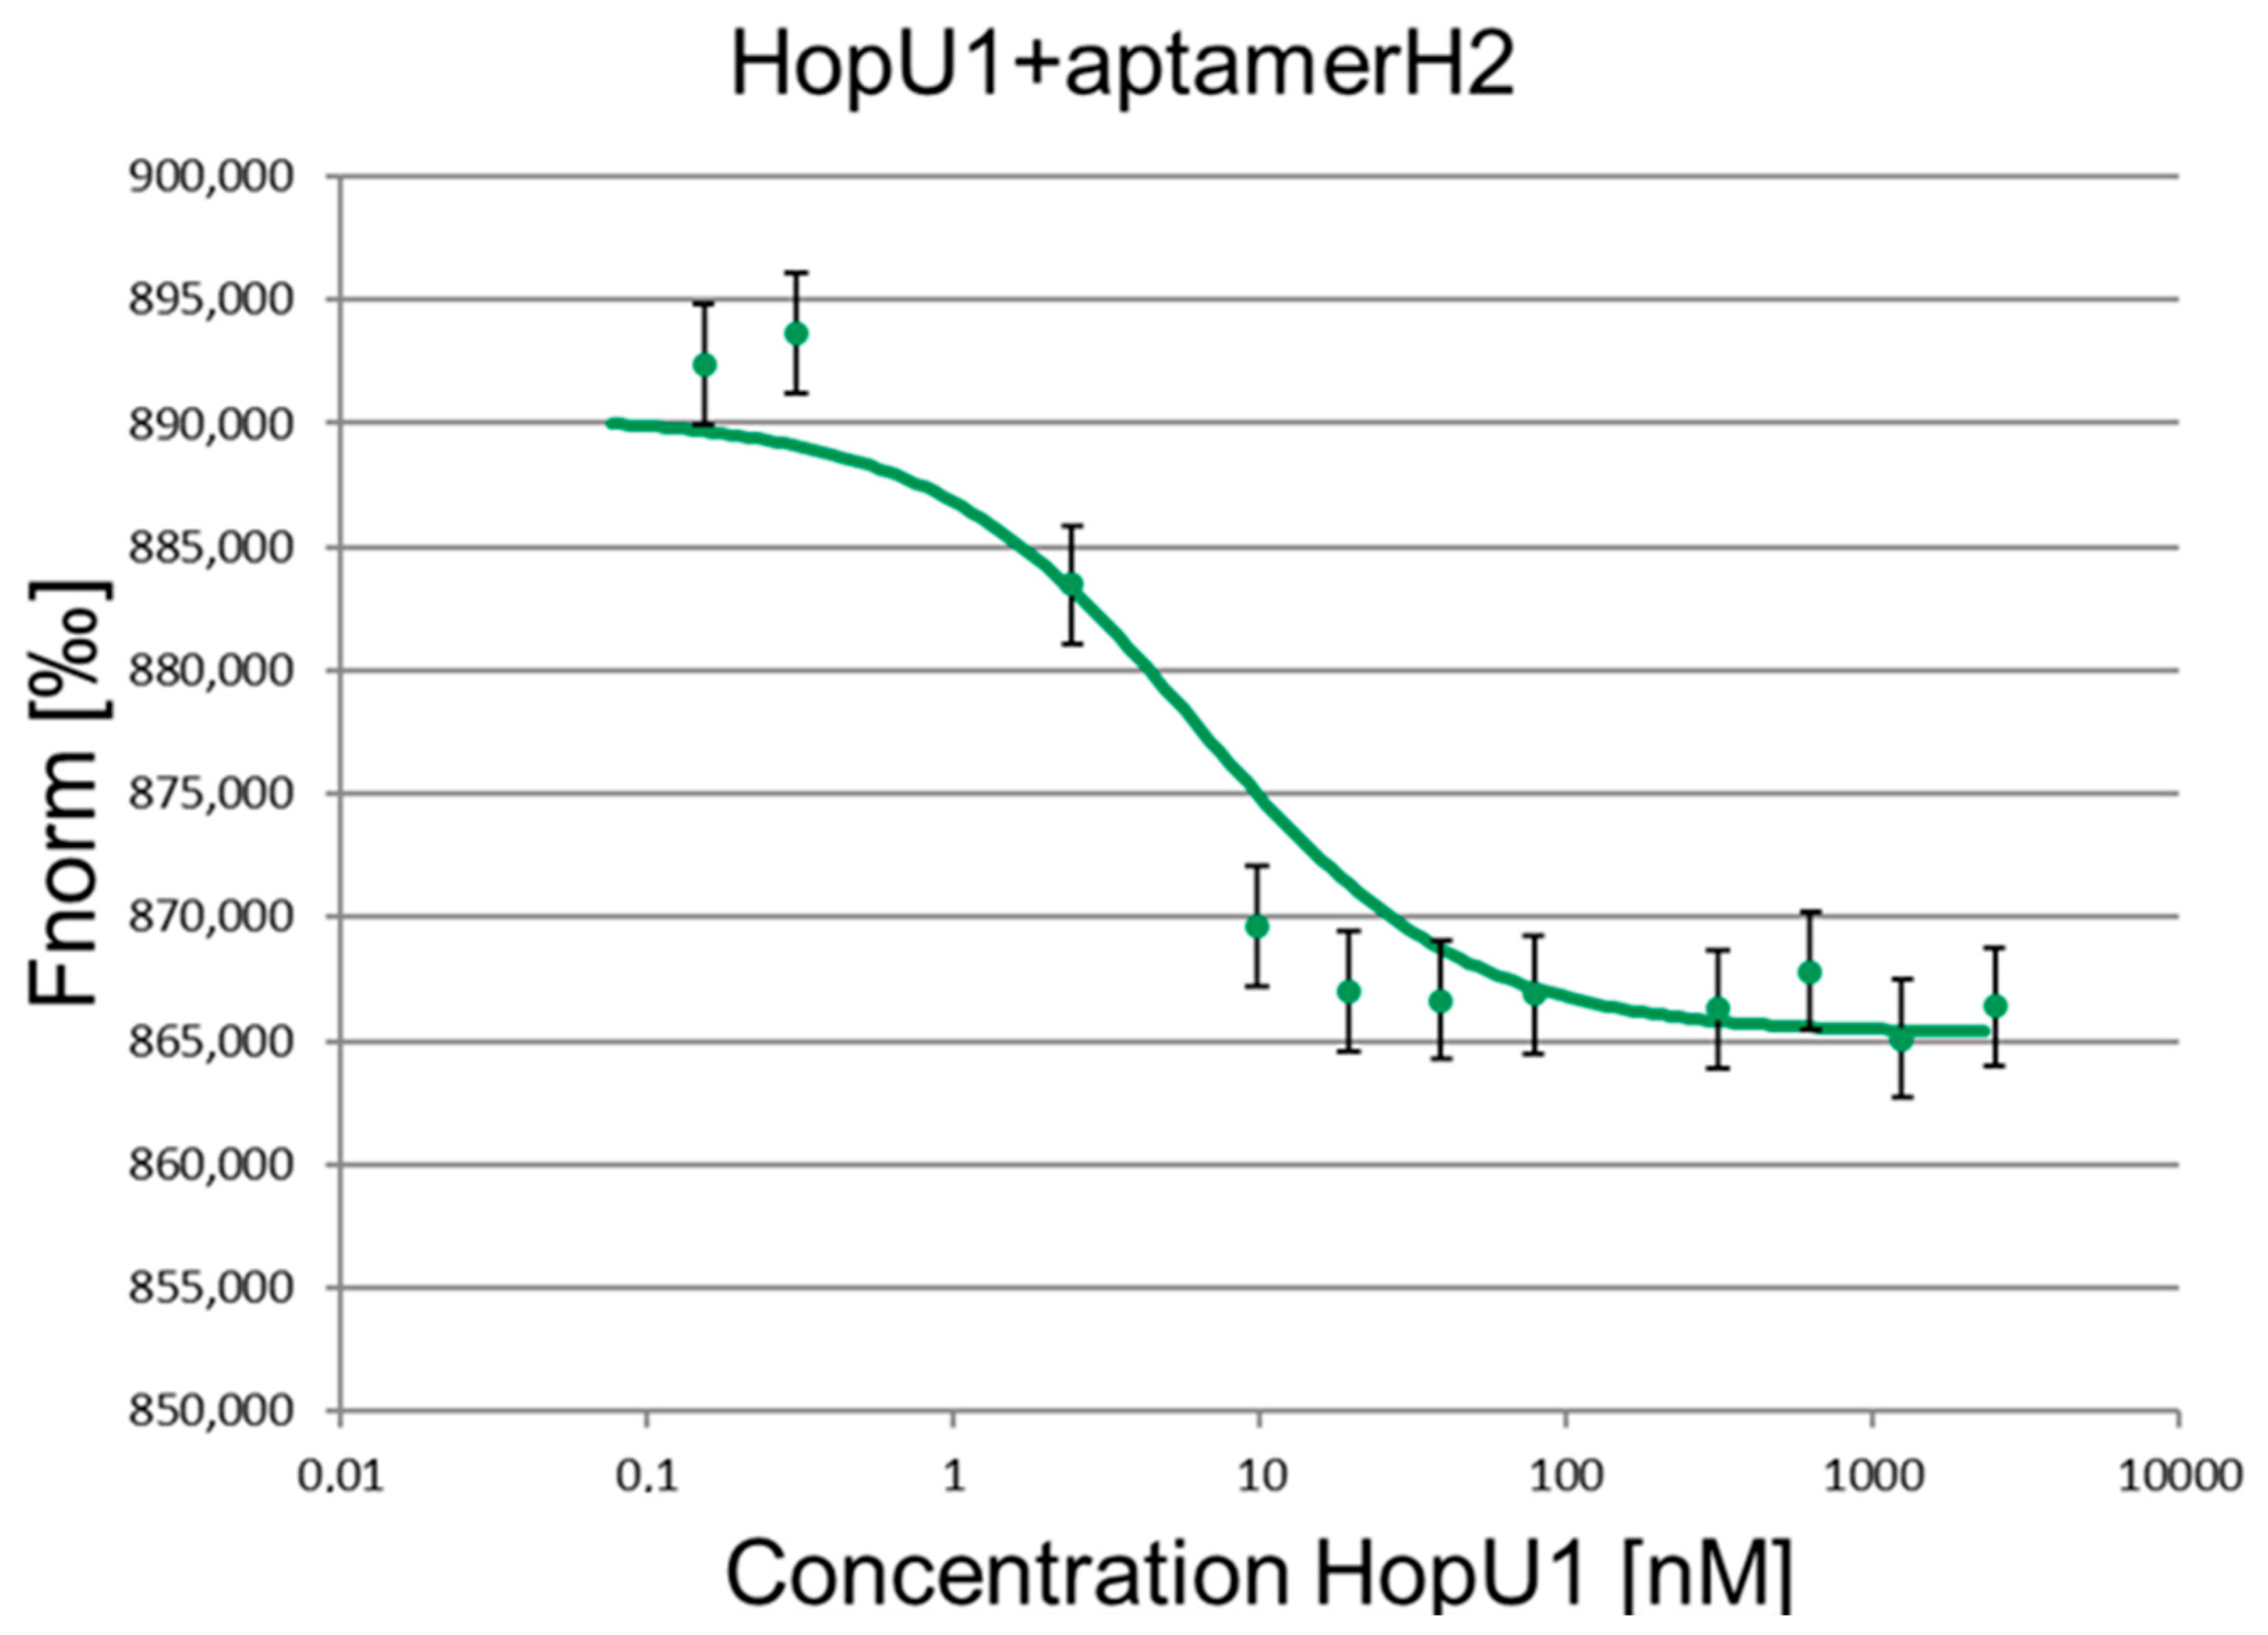
| Aptamer | H1 | H2 |
|---|---|---|
| Kd, nM | 6.71 ± 0.69 | 6.41 ± 0.48 |
Disclaimer/Publisher’s Note: The statements, opinions and data contained in all publications are solely those of the individual author(s) and contributor(s) and not of MDPI and/or the editor(s). MDPI and/or the editor(s) disclaim responsibility for any injury to people or property resulting from any ideas, methods, instructions or products referred to in the content. |
© 2023 by the authors. Licensee MDPI, Basel, Switzerland. This article is an open access article distributed under the terms and conditions of the Creative Commons Attribution (CC BY) license (https://creativecommons.org/licenses/by/4.0/).
Share and Cite
Abdeeva, I.A.; Maloshenok, L.G.; Pogorelko, G.V.; Bruskin, S.A. Using an RNA Aptamer to Inhibit the Action of Effector Proteins of Plant Pathogens. Int. J. Mol. Sci. 2023, 24, 16604. https://doi.org/10.3390/ijms242316604
Abdeeva IA, Maloshenok LG, Pogorelko GV, Bruskin SA. Using an RNA Aptamer to Inhibit the Action of Effector Proteins of Plant Pathogens. International Journal of Molecular Sciences. 2023; 24(23):16604. https://doi.org/10.3390/ijms242316604
Chicago/Turabian StyleAbdeeva, Inna A., Liliya G. Maloshenok, Gennady V. Pogorelko, and Sergey A. Bruskin. 2023. "Using an RNA Aptamer to Inhibit the Action of Effector Proteins of Plant Pathogens" International Journal of Molecular Sciences 24, no. 23: 16604. https://doi.org/10.3390/ijms242316604