
High-Proportion Blue Light Irradiation at the End-of-Production Stage Promotes the Biosynthesis and Recycling of Ascorbate in Lettuce
 , ,
, ,  and
and
Abstract
:1. Introduction
2. Results
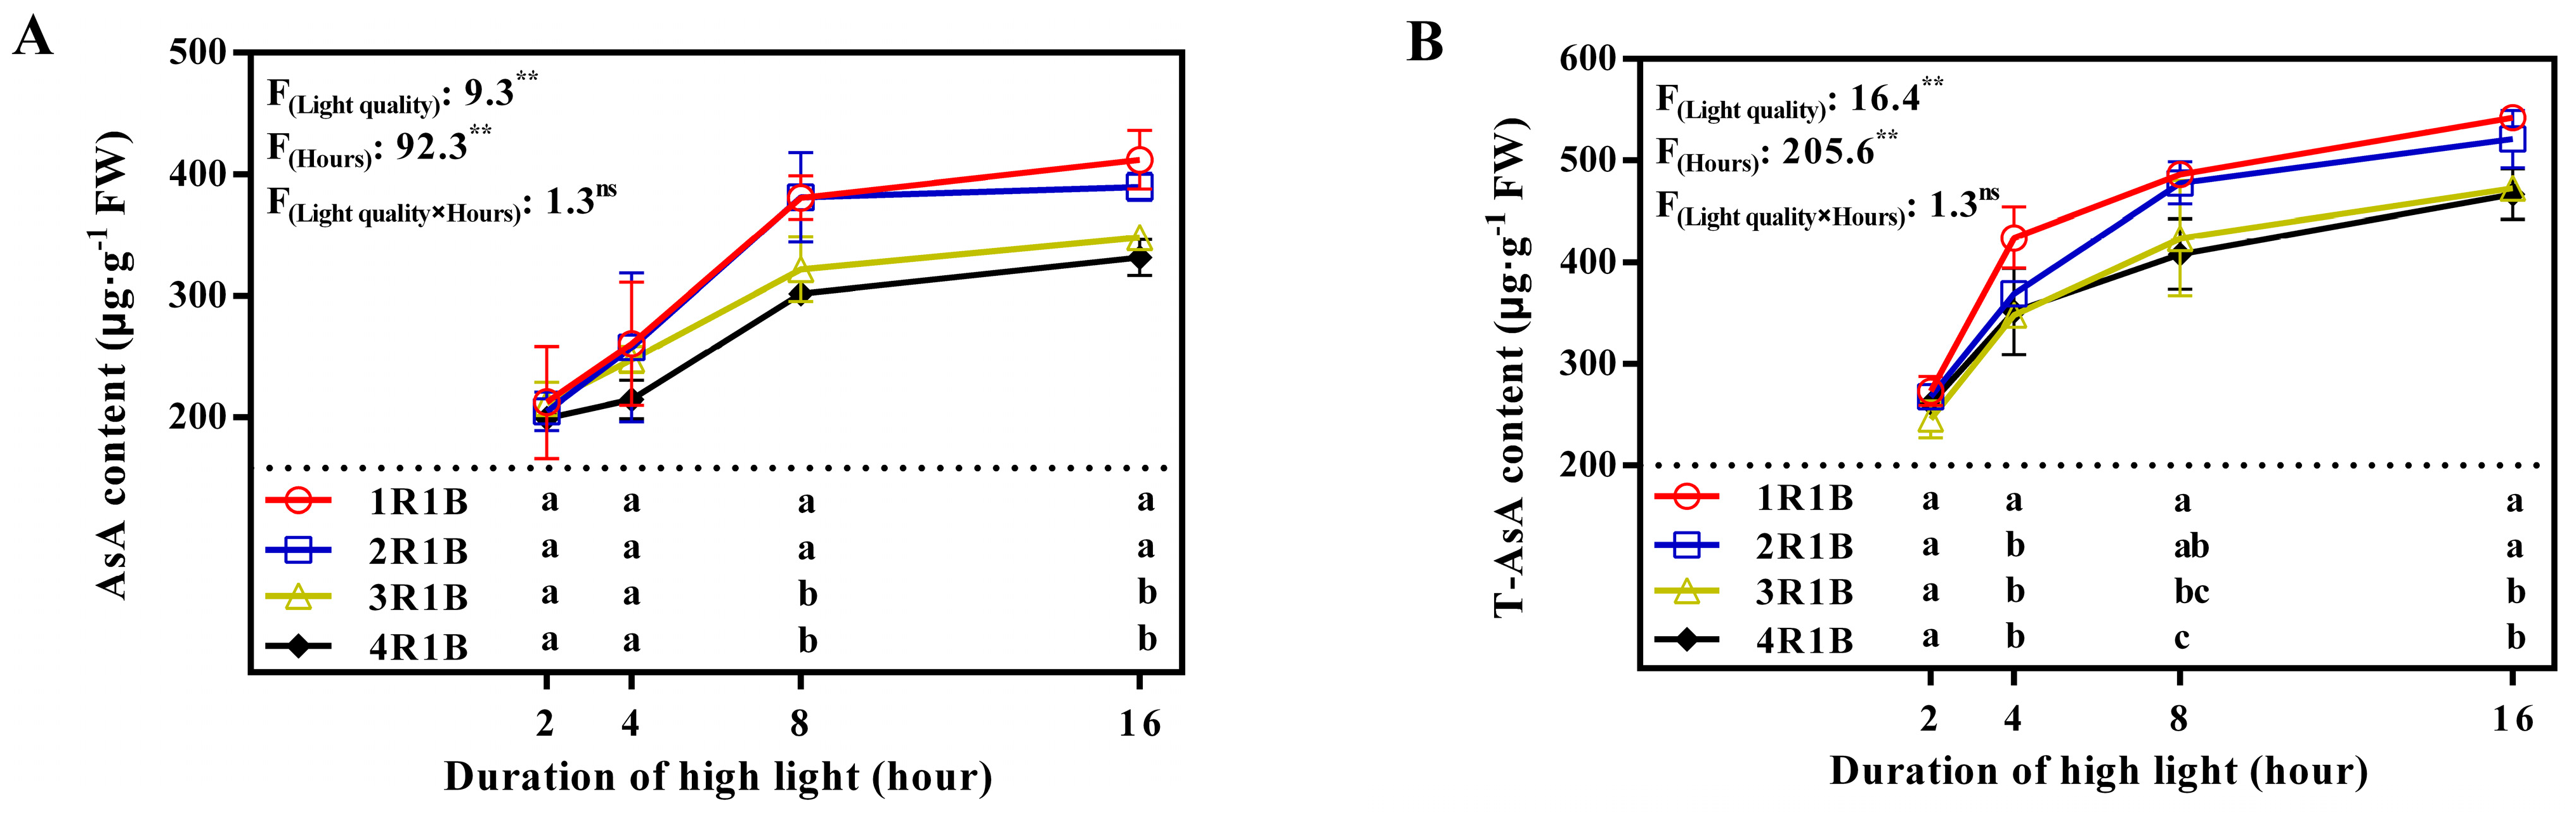
2.1. Ascorbate Pool
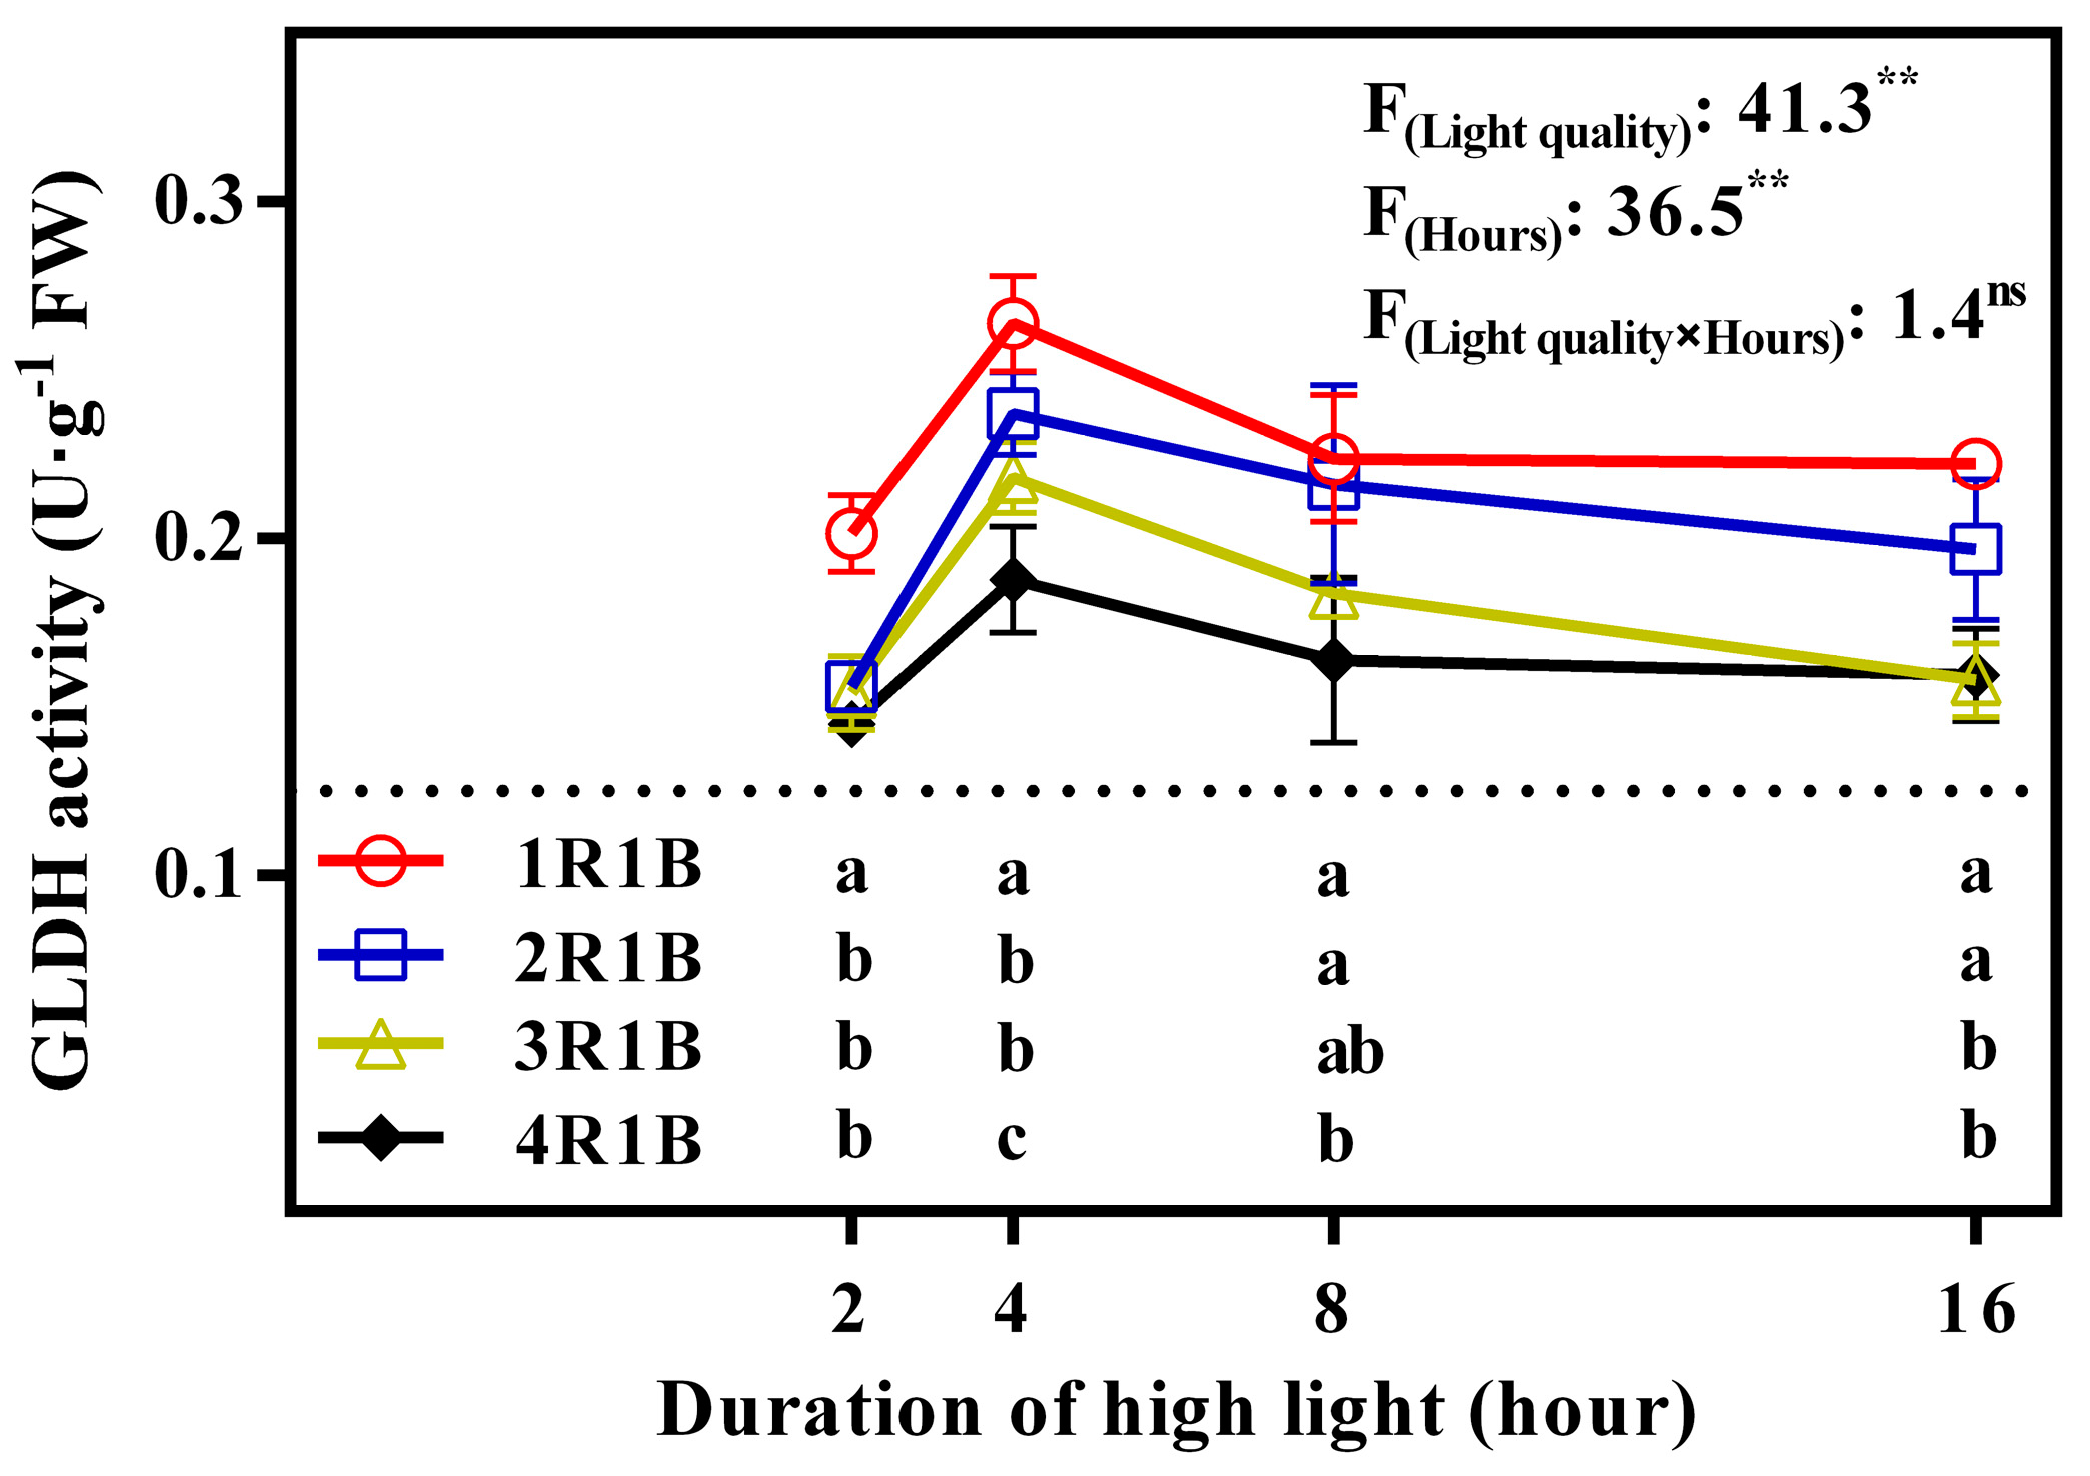
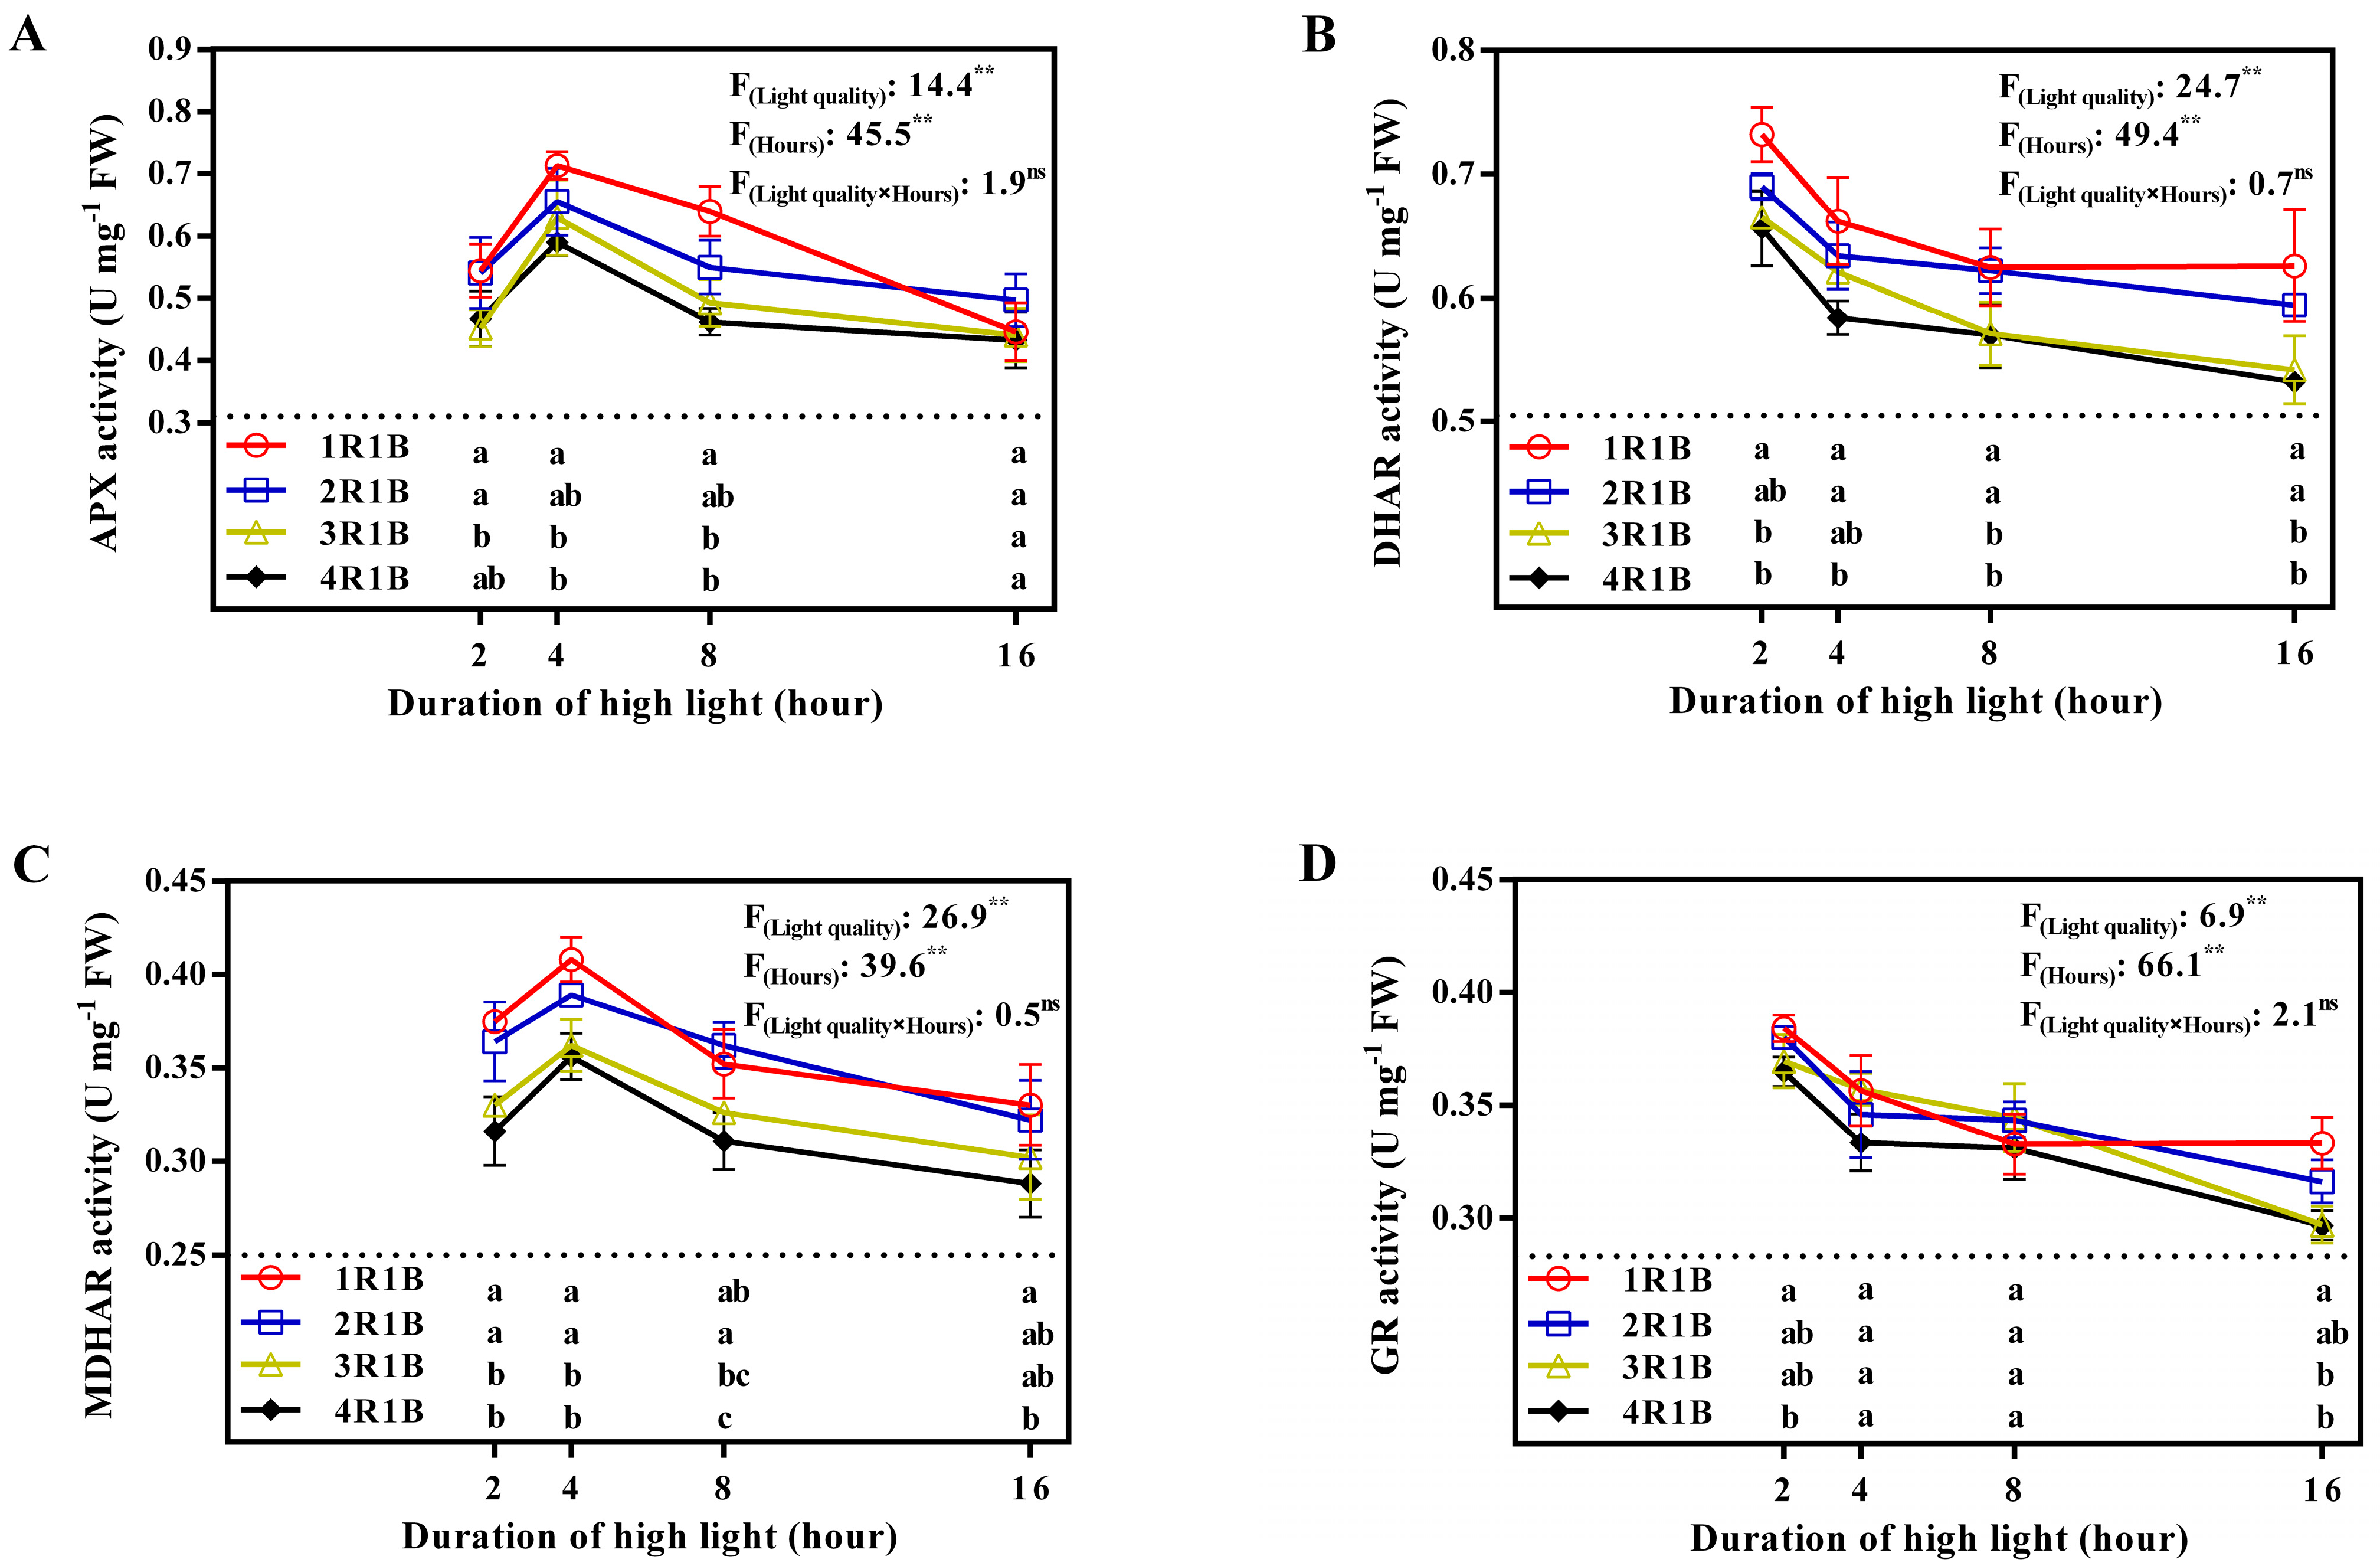
2.2. Enzyme Activity
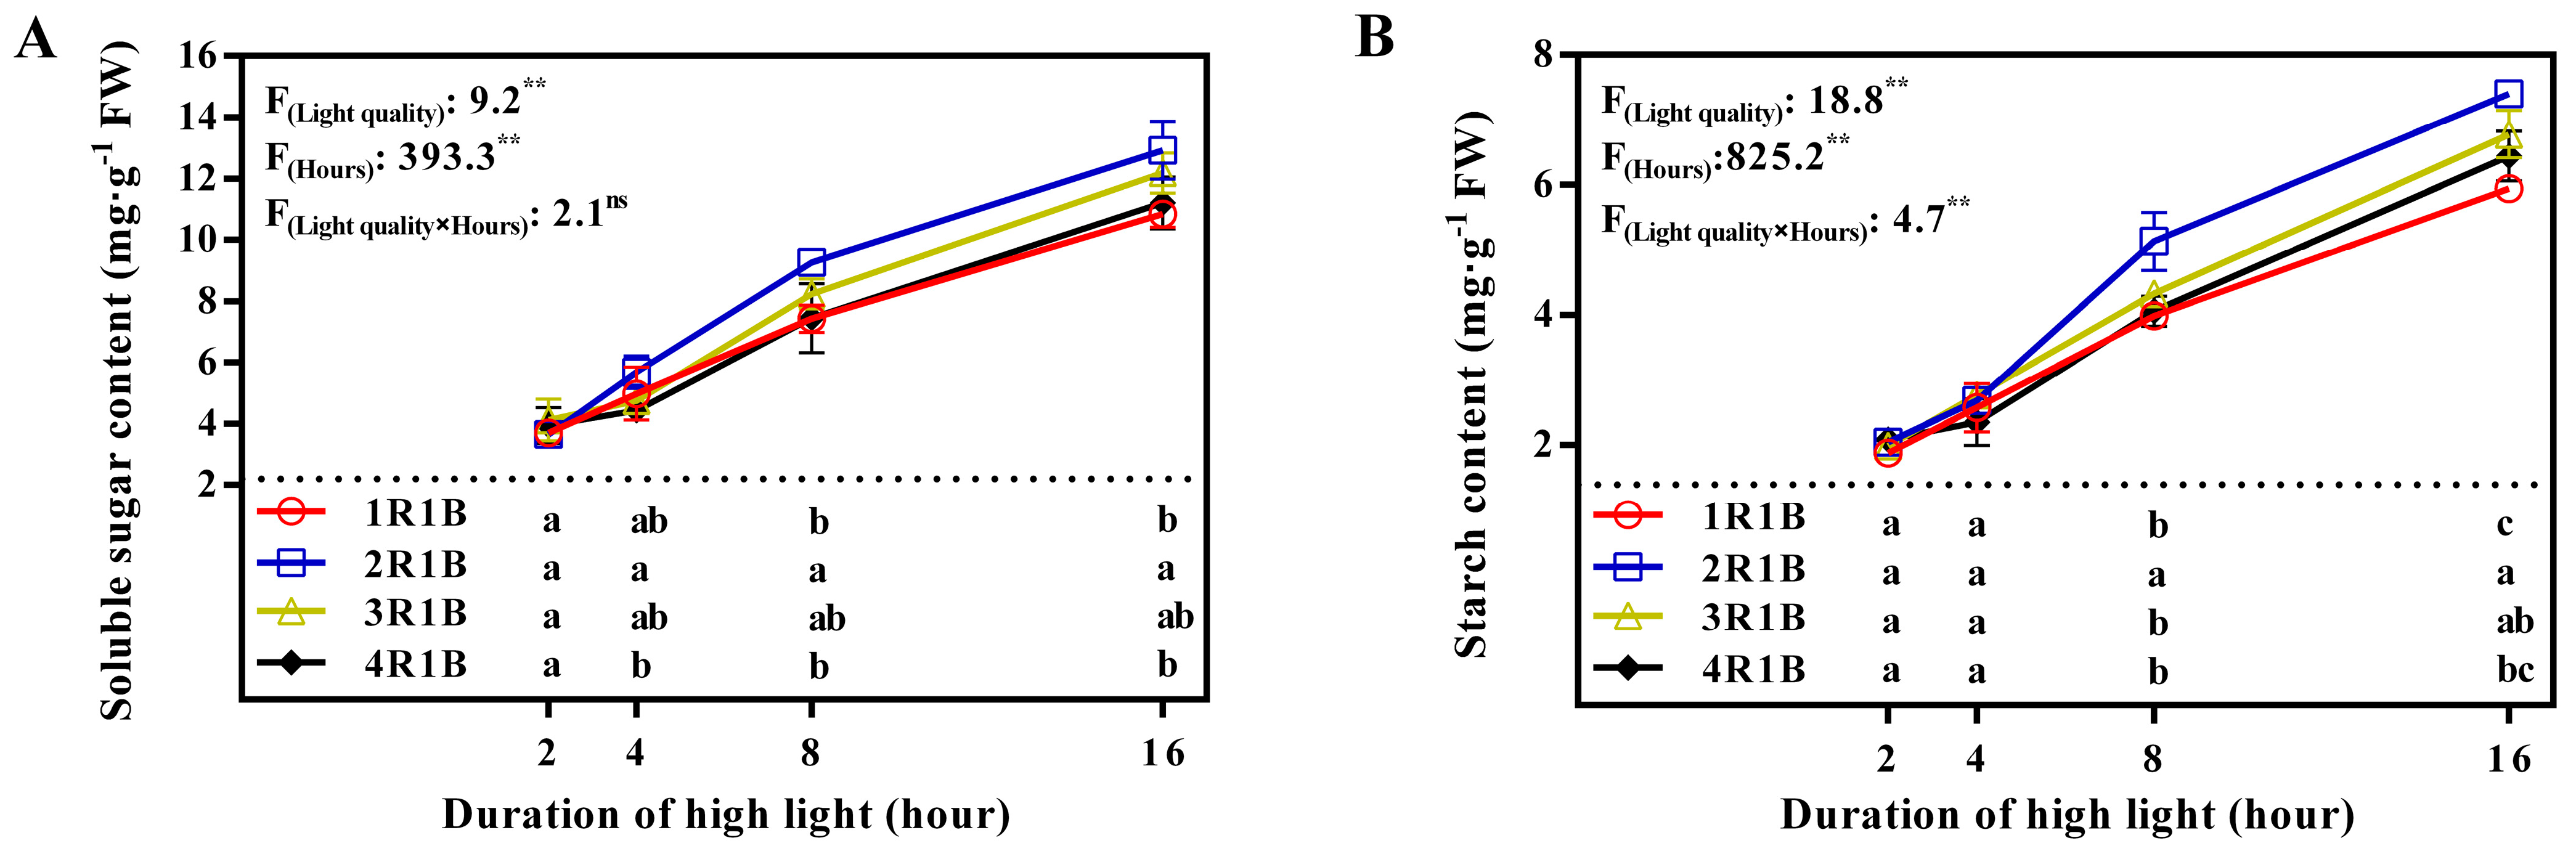
2.3. Soluble Sugar and Starch Levels
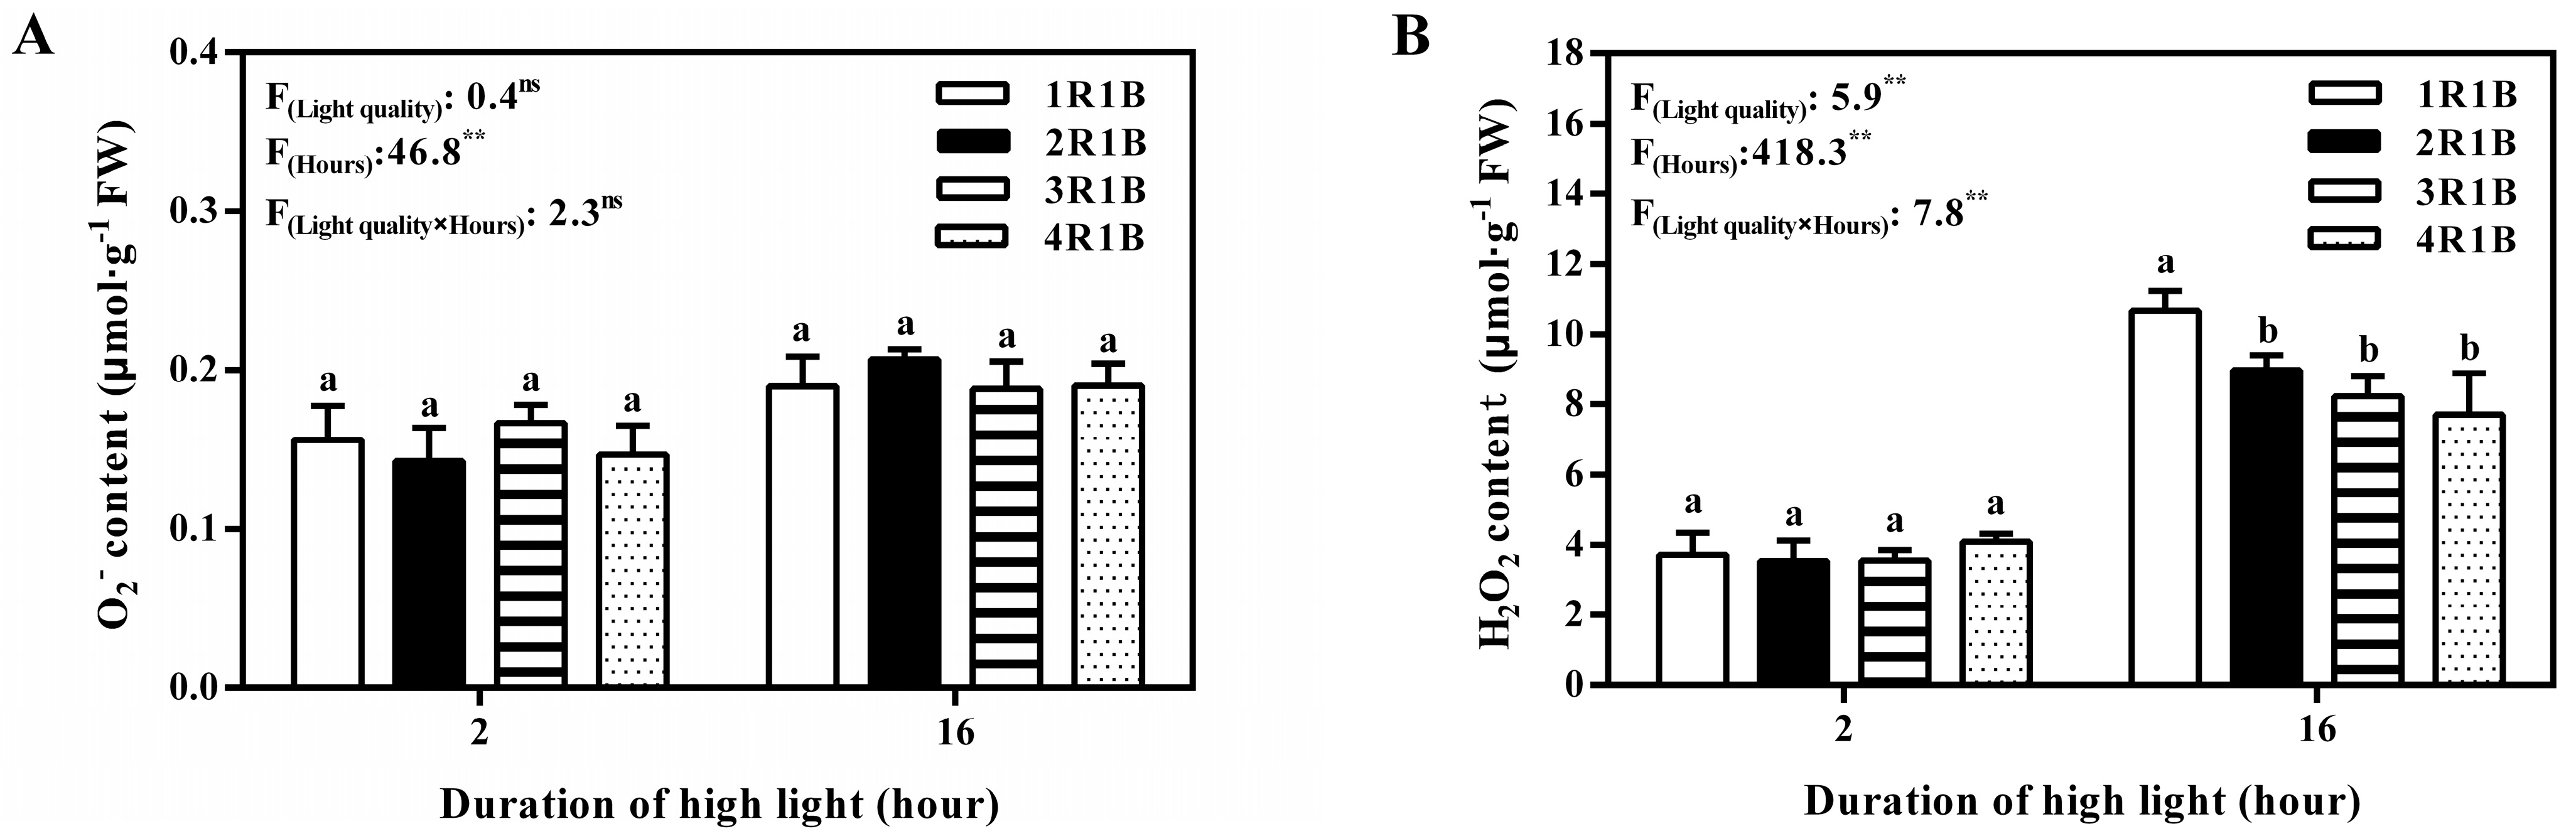
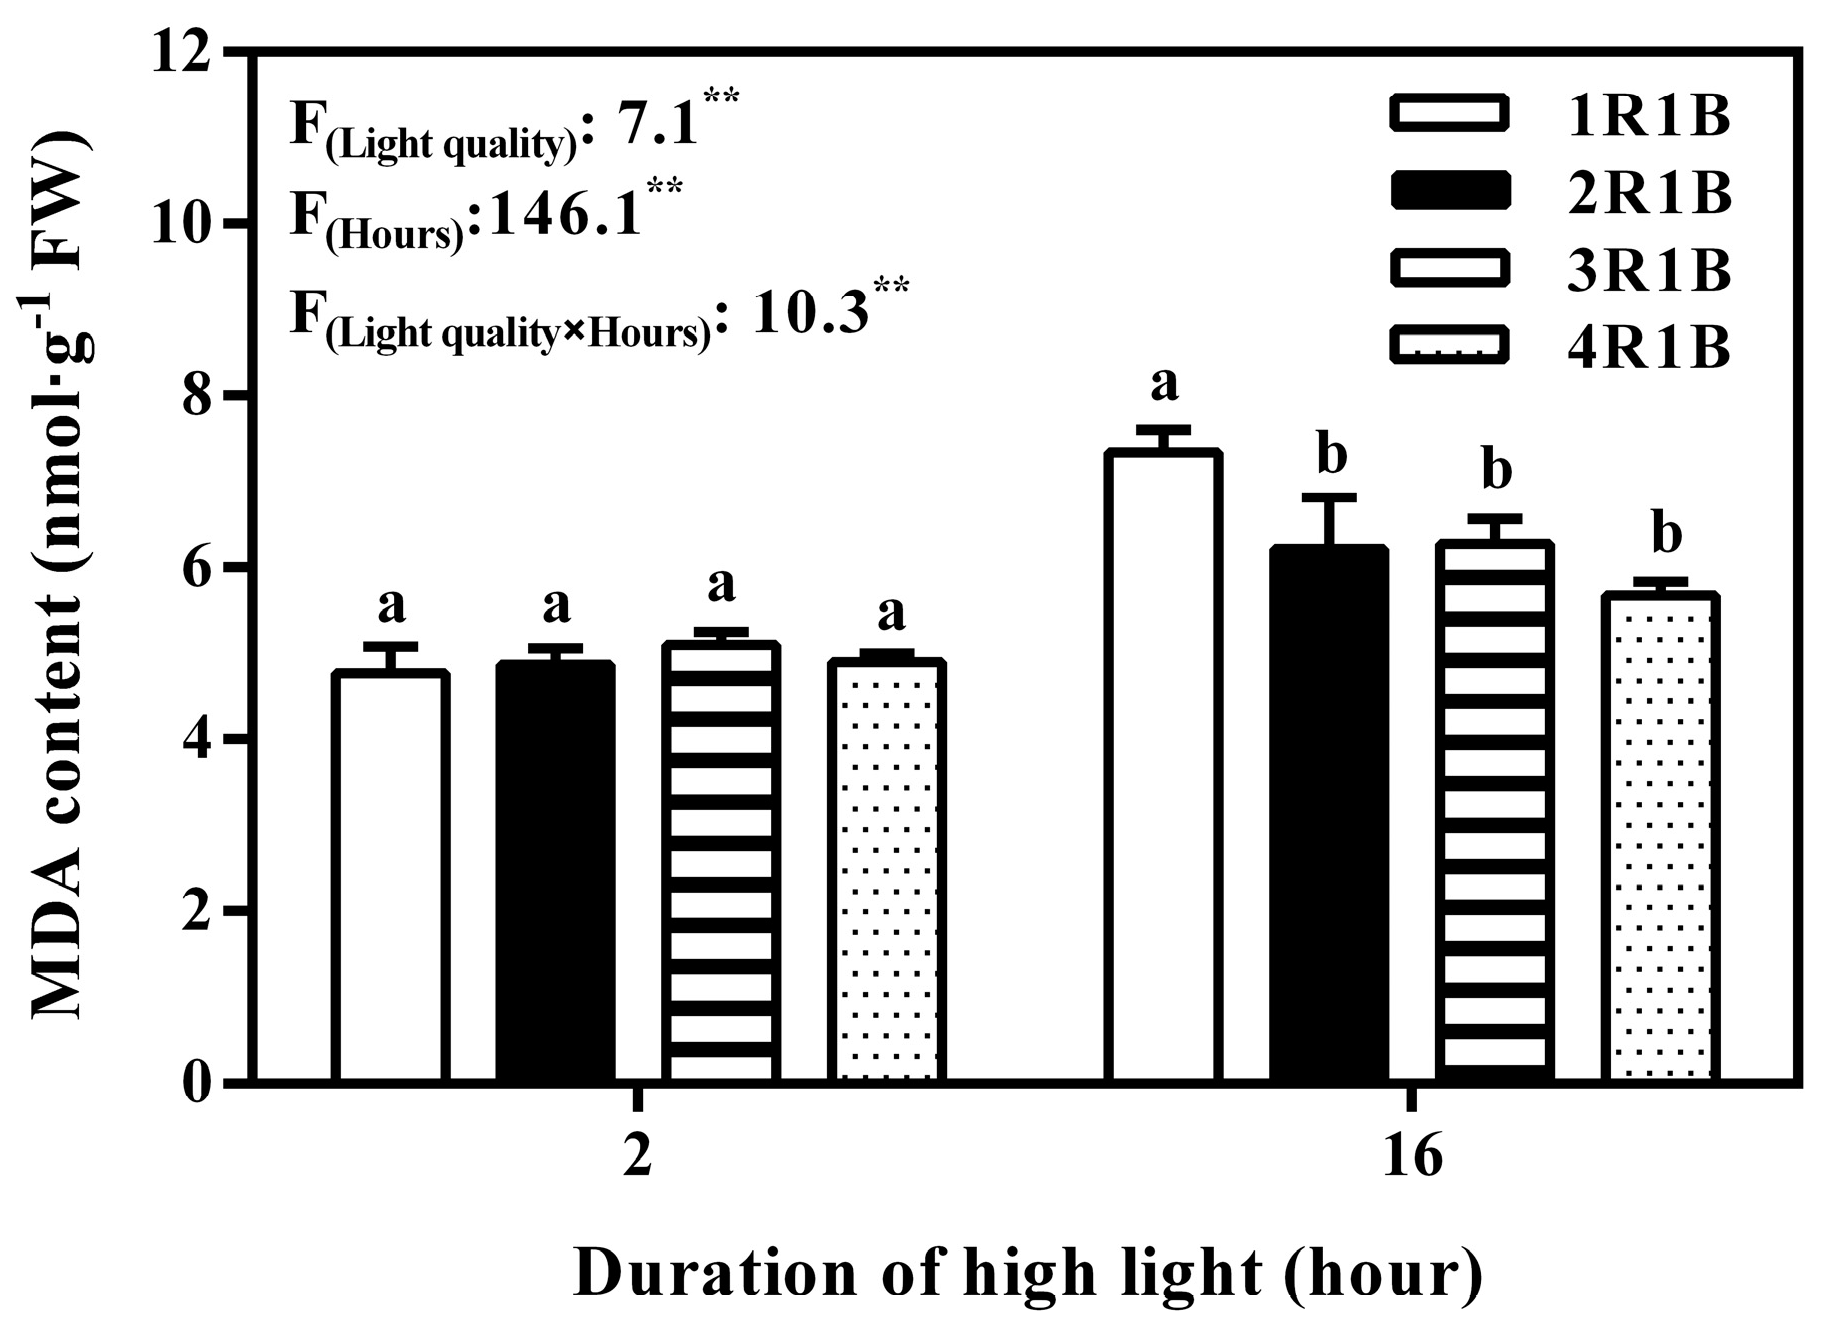
2.4. O2−, H2O2, and MDA Contents
3. Discussion
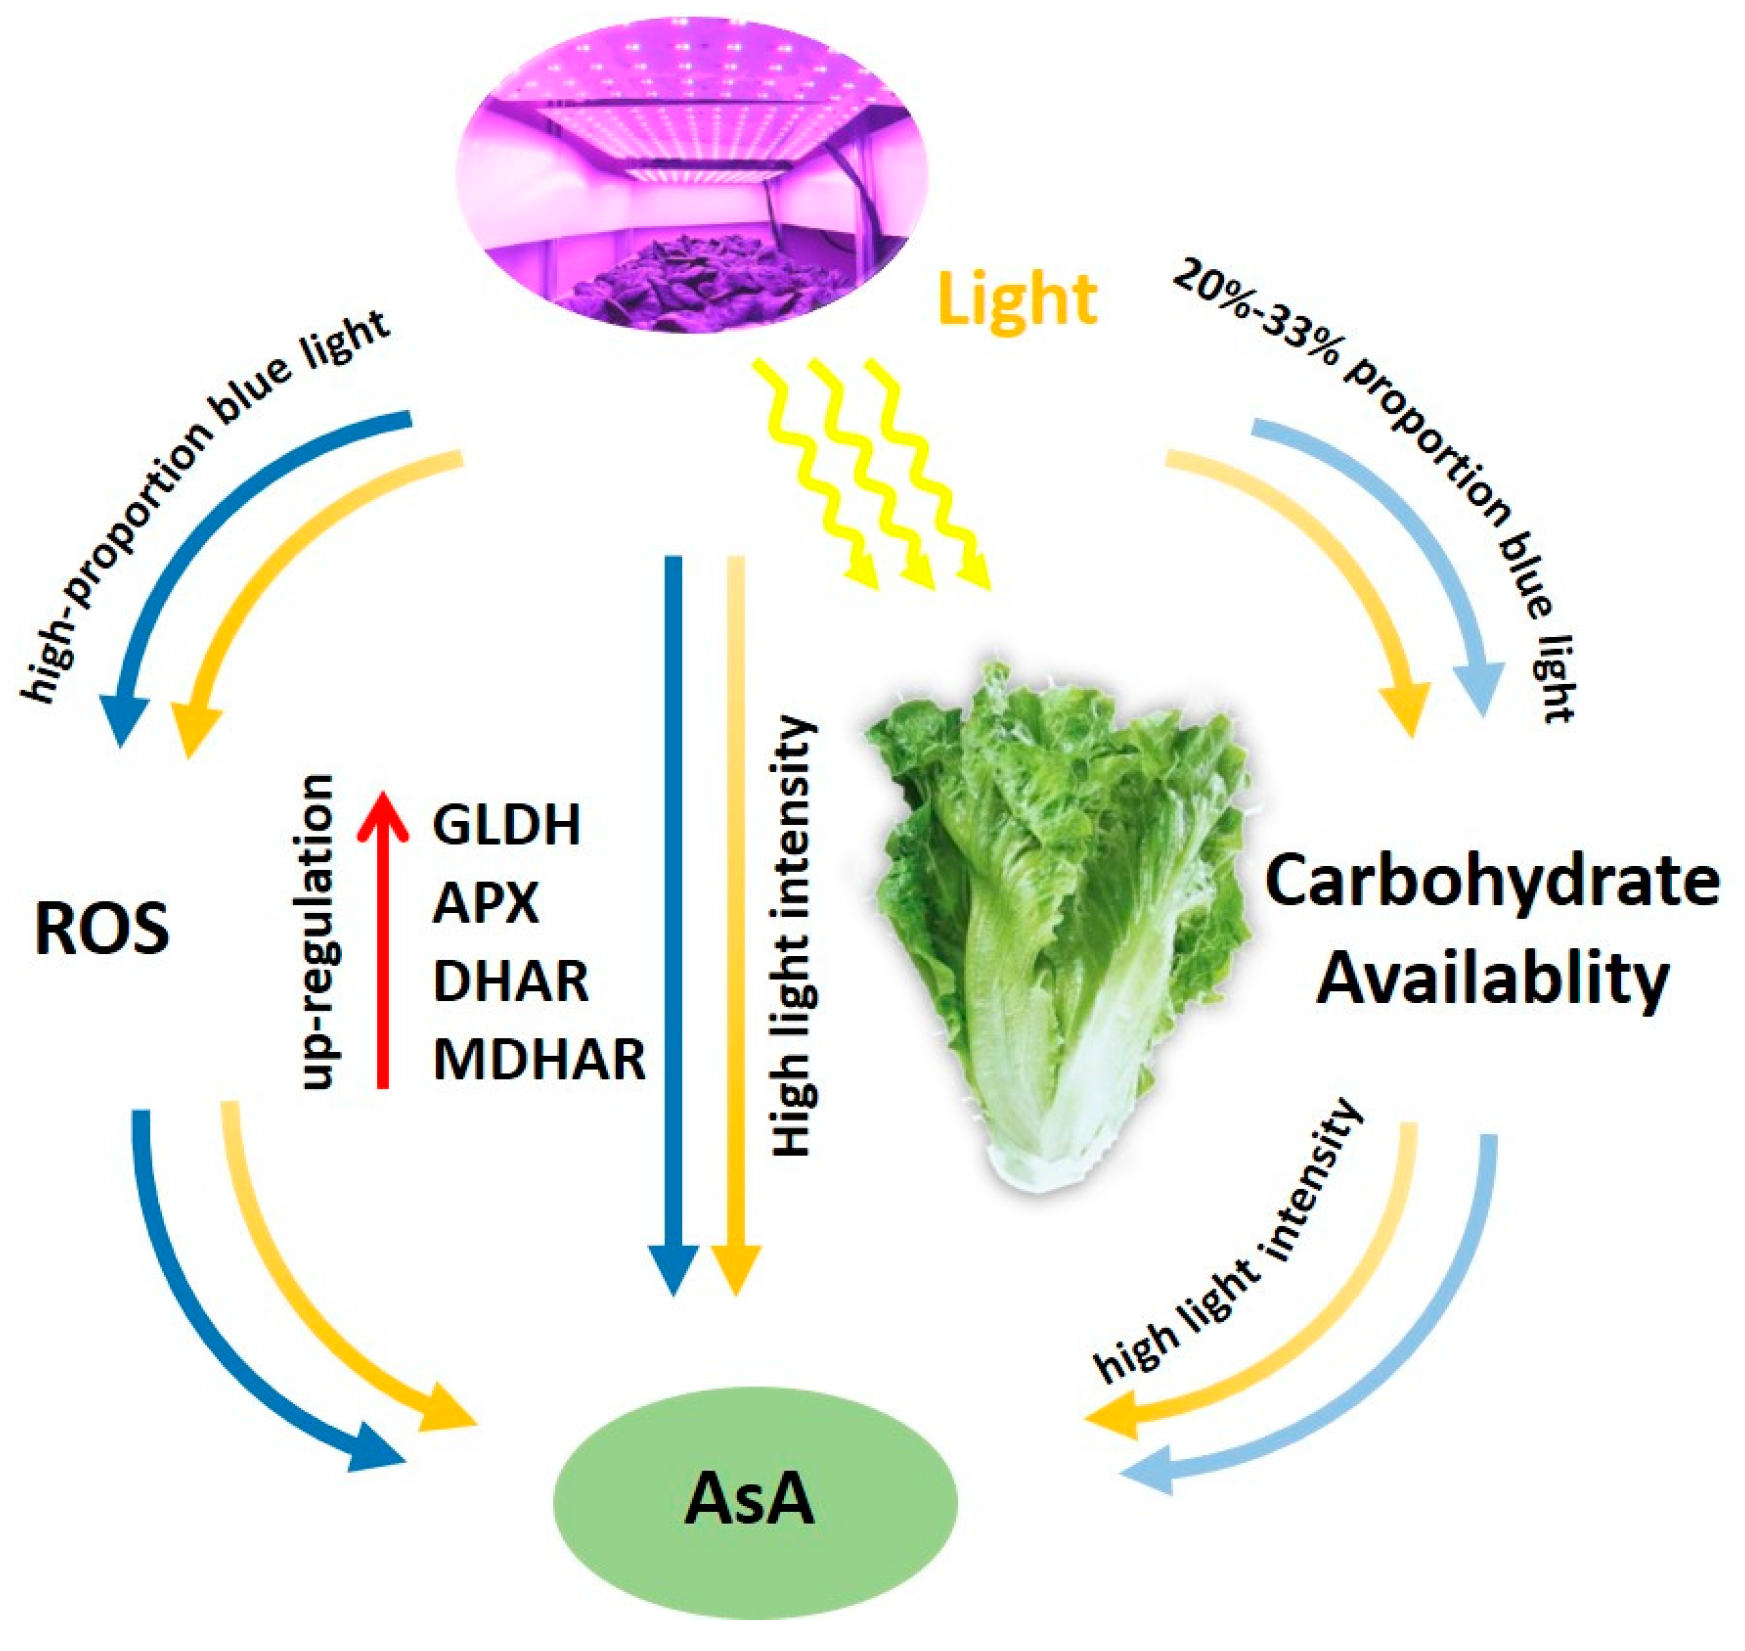
3.1. EOP-HLI with a High Blue Light Proportion Increased AsA Accumulation by Promoting Its Biosynthesis and Recycling
3.2. AsA Level Was Influenced by Carbohydrate Accumulation within the Range of Blue Light Accounting for No More than 33%
3.3. The AsA Accumulation in Lettuce Induced by EOP-HLI with a High Blue Light Proportion Was Correlated with ROS
4. Materials and Methods
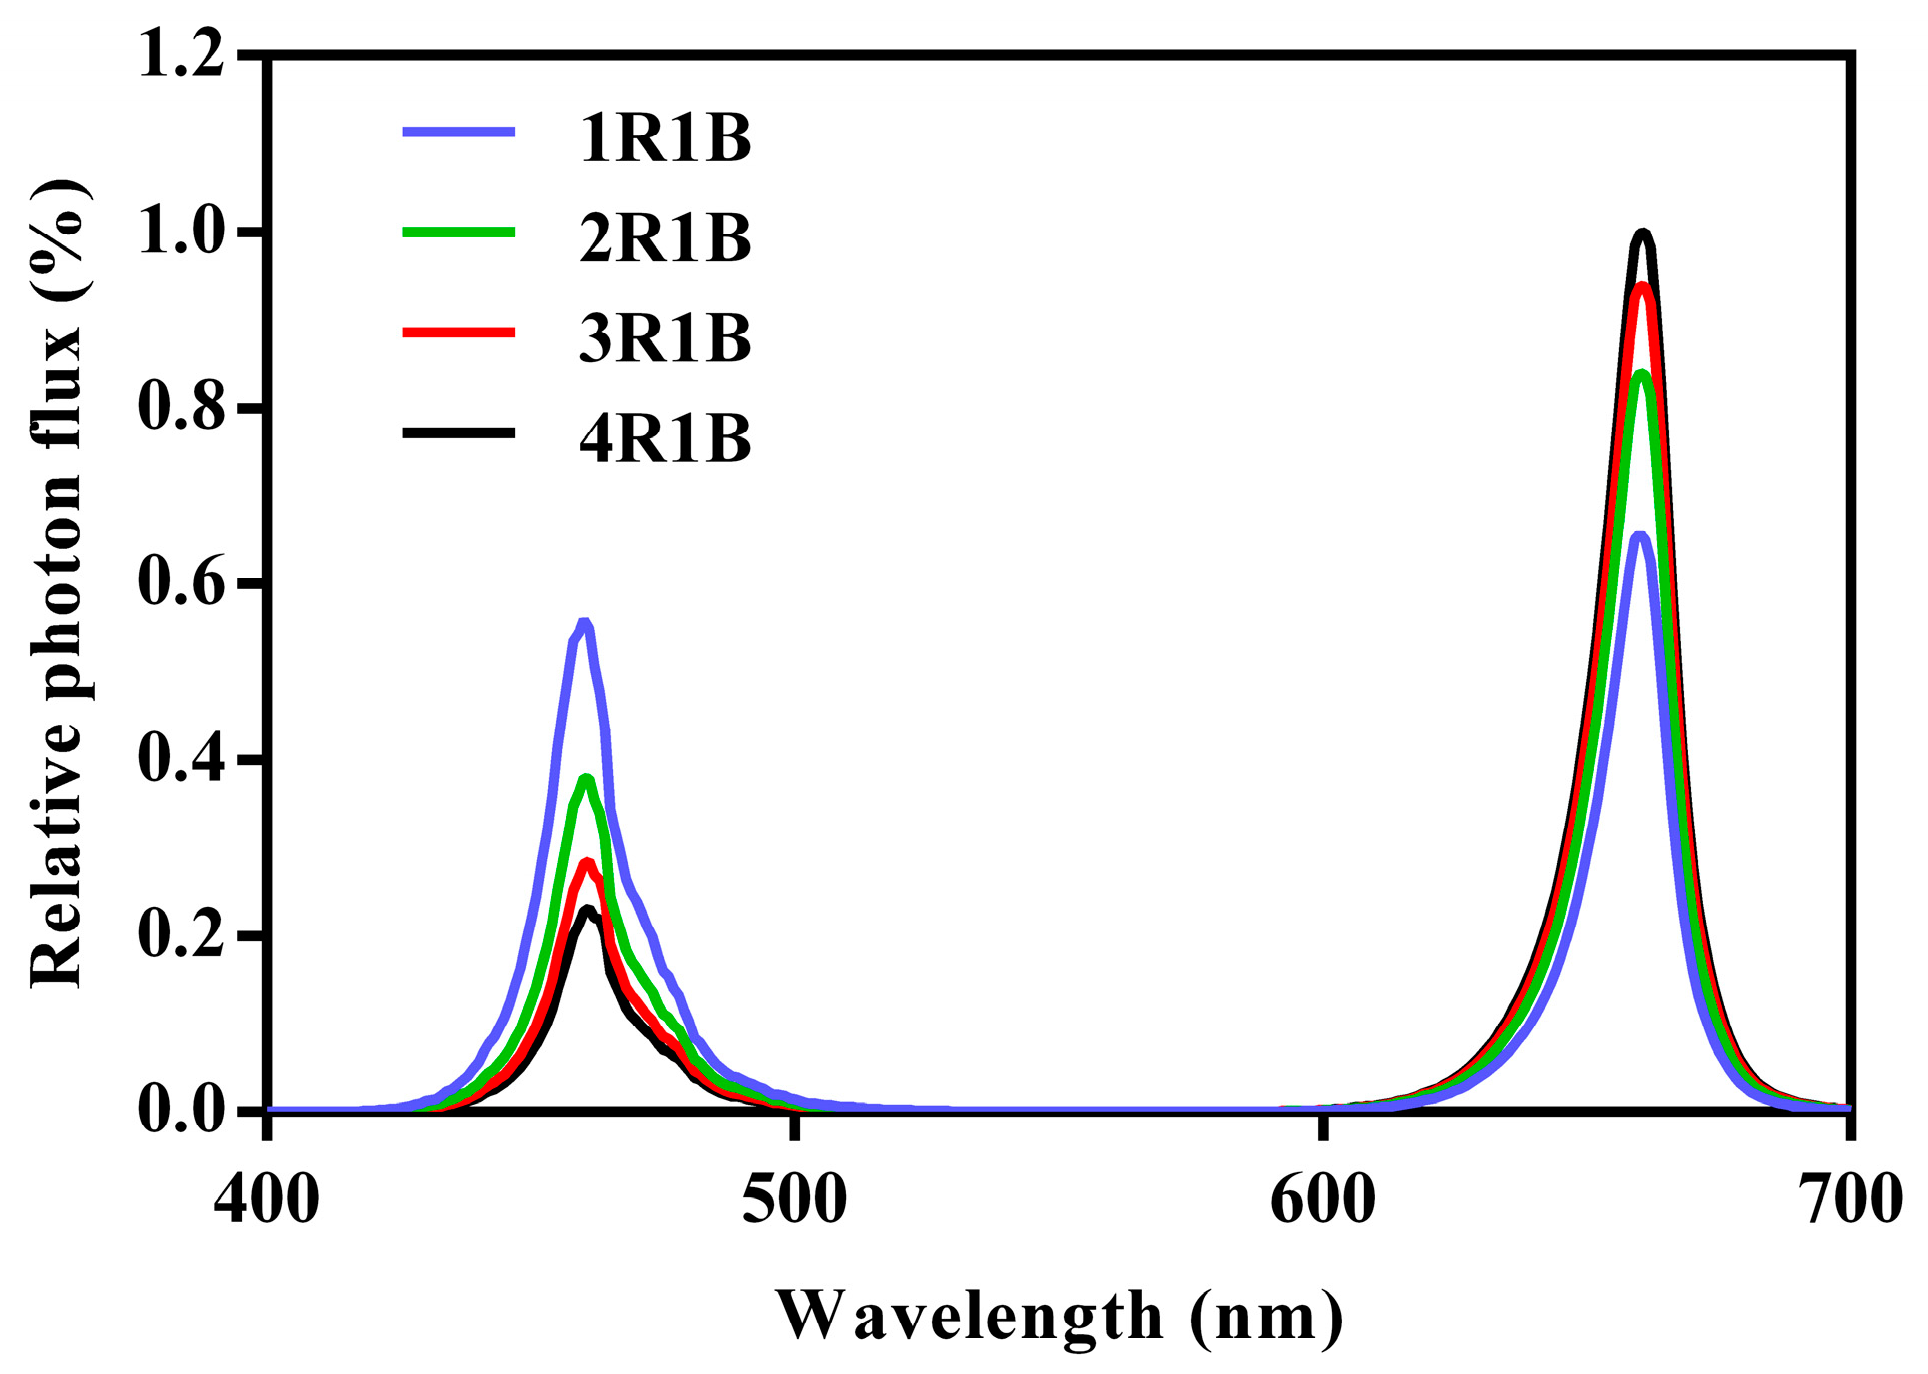
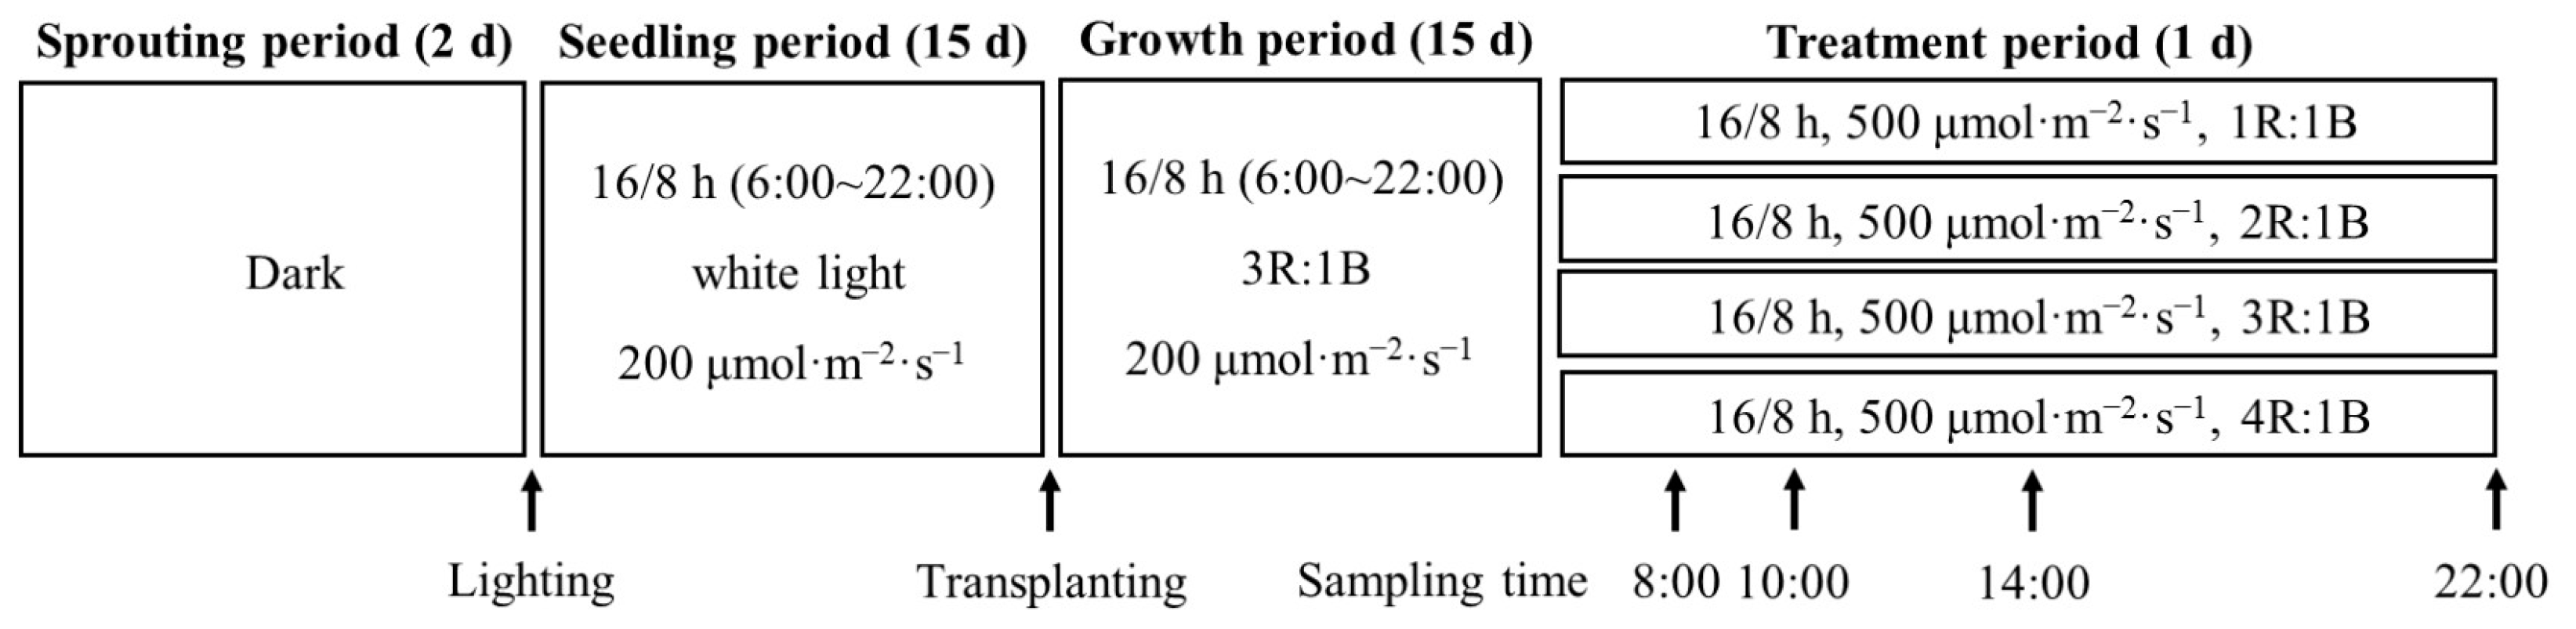
4.1. Plants and Light Treatments
4.2. Destructive Measurements
4.3. Soluble Sugar and Starch Determination
4.4. Determination of AsA and Total-AsA
4.5. Enzyme Extraction and Activity Measurement
4.6. Measurement of H2O2 and O2− Contents
4.7. Measurement of Malondialdehyde Levels
4.8. Statistical Analysis
5. Conclusions
Author Contributions
Funding
Institutional Review Board Statement
Informed Consent Statement
Data Availability Statement
Conflicts of Interest
Appendix A

| Treatments | Leaf Area (cm2) | Shoot Fresh Weight (g) | Shoot Dry Weight (g) | Root Fresh Weight (g) | Root Dry Weight (g) |
|---|---|---|---|---|---|
| 1R1B | 446.03 ± 37.48 ns | 27.62 ± 0.69 ns | 1.43 ± 0.04 ns | 3.09 ± 0.39 ns | 0.173 ± 0.01 ns |
| 2R1B | 468.33 ± 5.01 ns | 28.24 ± 1.36 ns | 1.43 ± 0.13 ns | 3.55 ± 0.48 ns | 0.212 ± 0.02 ns |
| 3R1B | 464.90 ± 45.65 ns | 31.75 ± 1.67 ns | 1.52 ± 0.09 ns | 3.56 ± 0.06 ns | 0.206 ± 0.02 ns |
| 4R1B | 475.03 ± 59.85 ns | 31.54 ± 4.76 ns | 1.61 ± 0.08 ns | 3.57 ± 0.38 ns | 0.220 ± 0.06 ns |
References
- Ntagkas, N.; Woltering, E.J.; Marcelis, L.F.M. Light regulates ascorbate in plants: An integrated view on physiology and biochemistry. Environ. Exp. Bot. 2018, 147, 271–280. [Google Scholar] [CrossRef]
- Min, Q.; Marcelis, L.F.M.; Nicole, C.S.; Woltering, E.J. High light intensity applied shortly before harvest improves lettuce nutritional quality and extends the shelf life. Front. Plant Sci. 2021, 12, 615355. [Google Scholar] [CrossRef] [PubMed]
- Massot, C.; Genard, M.; Stevens, R.; Gautier, H. Fluctuations in sugar content are not determinant in explaining variations in vitamin C in tomato fruit. Plant Physiol. Biochem. 2010, 48, 751–757. [Google Scholar] [CrossRef] [PubMed]
- Zha, L.; Zhang, Y.; Liu, W. Dynamic responses of ascorbate pool and metabolism in lettuce to long-term continuous light provided by red and blue LEDs. Environ. Exp. Bot. 2019, 163, 15–23. [Google Scholar] [CrossRef]
- Laing, W.; Norling, C.; Di, B.; Wright, M.; Bulley, S. Ascorbate concentration in Arabidopsis thaliana and expression of ascorbate related genes using RNAseq in response to light and the diurnal cycle. Cold Spring Harbor Labs J. 2017. [Google Scholar] [CrossRef]
- Mittler, R. ROS are good. Trends Plant Sci. 2017, 22, 11–19. [Google Scholar] [CrossRef]
- Miller, G.; Suzuki, N.; Ciftci-Yilmaz, S.; Mittler, R. Reactive oxygen species homeostasis and signalling during drought and salinity stresses. Plant Cell Environ. 2010, 33, 453–467. [Google Scholar] [CrossRef]
- Gilroy, S.; Białasek, M.; Suzuki, N.; Górecka, M.; Devireddy, A.R.; Karpinski, S. ROS, calcium, and electric signals: Key mediators of rapid systemic signaling in plants. Plant Physiol. 2016, 171, 1606–1615. [Google Scholar] [CrossRef]
- Raja, V.; Majeed, U.; Kang, H.; Andrabi, K.I.; John, R. Abiotic stress: Interplay between ROS, hormones and MAPKs. Environ. Exp. Bot. 2017, 137, 142–157. [Google Scholar] [CrossRef]
- Foyer, C.H.; Noctor, G. Stress-triggered redox signalling: What’s in pROSpect? Plant Cell Environ. 2016, 39, 951–964. [Google Scholar] [CrossRef]
- Foyer, C.H. Reactive oxygen species, oxidative signaling and the regulation of photosynthesis. Environ. Exp. Bot. 2018, 154, 134–142. [Google Scholar] [CrossRef] [PubMed]
- Terai, Y.; Ueno, H.; Ogawa, T.; Sawa, Y.; Miyagi, A.; Kawai-Yamada, M.; Ishikawa, T.; Maruta, T. Dehydroascorbate reductases and glutathione set a threshold for high-light-induced ascorbate accumulation. Plant Physiol. 2020, 183, 112–122. [Google Scholar] [CrossRef] [PubMed]
- Ntagkas, N.; Woltering, E.; Nicole, C.; Labrie, C.; Marcelis, L.F.M. Light regulation of vitamin C in tomato fruit is mediated through photosynthesis. Environ. Exp. Bot. 2019, 158, 180–188. [Google Scholar] [CrossRef]
- Zhang, Y.; Ntagkas, N.; Fanourakis, D.; Tsaniklidis, G.; Zhao, J.; Cheng, R.; Yang, Q.; Li, T. The role of light intensity in mediating ascorbic acid content during postharvest tomato ripening: A transcriptomic analysis. Postharvest Biol. Tec. 2021, 180, 111622. [Google Scholar] [CrossRef]
- Zha, L.; Liu, W.; Zhang, Y.; Zhou, C.; Shao, M. Morphological and physiological stress responses of lettuce to different intensities of continuous light. Front. Plant Sci. 2019, 10, 1440. [Google Scholar] [CrossRef] [PubMed]
- Zhou, C.; Shao, M.; Liu, W.; Li, B.; Wang, Q.; Liu, J.; Wen, Y.; Yang, Q. Regulation of ascorbate accumulation and metabolism in lettuce by end-of-production high light irradiation provided by red and blue LEDs. Environ. Exp. Bot. 2021, 189, 104567. [Google Scholar] [CrossRef]
- Gómez, C.; Jiménez, J. Effect of end-of-production high-energy radiation on nutritional quality of indoor-grown red-leaf lettuce. HortScience 2020, 55, 1055–1060. [Google Scholar] [CrossRef]
- Ohashi-Kaneko, K.; Takase, M.; Kon, N.; Fujiwara, K.; Kurata, K. Effect of light quality on growth and vegetable quality in leaf lettuce, spinach and komatsuna. Environ. Control Biol. 2007, 45, 189–198. [Google Scholar] [CrossRef]
- Miyagi, A.; Uchimiya, H.; Kawaiyamada, M. Synergistic effects of light quality, carbon dioxide and nutrients on metabolite compositions of head lettuce under artificial growth conditions mimicking a plant factory. Food Chem. 2017, 218, 561–568. [Google Scholar] [CrossRef]
- Hornitschek, P.; Kohnen, M.V.; Lorrain, S.; Rougemont, J.; Ljung, K.; López-Vidriero, I.; Franco-Zorrilla, J.M.; Solano, R.; Trevisan, M.; Pradervand, S.; et al. Phytochrome interacting factors 4 and 5 control seedling growth in changing light conditions by directly controlling auxin signaling. Plant J. 2012, 71, 699–711. [Google Scholar] [CrossRef] [PubMed]
- de Wit, M.; Keuskamp, D.H.; Bongers, F.J.; Hornitschek, P.; Gommers, C.M.M.; Reinen, E.; Martínez-Cerón, C.; Fankhauser, C.; Pierik, R. Integration of Phytochrome and cryptochrome signals determines plant growth during competition for light. Curr. Biol. 2016, 26, 3320–3326. [Google Scholar] [CrossRef] [PubMed]
- Pham, M.D.; Hwang, H.; Park, S.W.; Cui, M.; Lee, H.; Chun, C. Leaf chlorosis, epinasty, carbohydrate contents and growth of tomato show different responses to the red/blue wavelength ratio under continuous light. Plant Physiol. Biochem. 2019, 141, 477–486. [Google Scholar] [CrossRef]
- Hogewoning, S.W.; Trouwborst, G.; Maljaars, H.; Poorter, H.; Van Ieperen, W.; Harbinson, J. Blue light dose-esponses of leaf photosynthesis, morphology, and chemical composition of Cucumis sativus grown under different combinations of red and blue light. J. Exp. Bot. 2010, 61, 3107–3117. [Google Scholar] [CrossRef]
- Wang, J.; Lu, W.; Tong, Y.; Yang, Q. Leaf morphology, photosynthetic performance, chlorophyll fluorescence, stomatal development of lettuce (Lactuca sativa L.) exposed to different ratios of red light to blue light. Front. Plant Sci. 2016, 7, 250. [Google Scholar] [CrossRef] [PubMed]
- Ma, G.; Zhang, L.; Setiawan, C.K.; Yamawaki, K.; Asai, T.; Nishikawa, F.; Maezawa, S.; Sato, H.; Kanemitsu, N.; Kato, M. Effect of red and blue LED light irradiation on ascorbate content and expression of genes related to ascorbate metabolism in postharvest broccoli. Postharvest Biol. Technol. 2014, 94, 97–103. [Google Scholar] [CrossRef]
- Gao, B.; Yang, Z.; Li, W.; Wang, X.; Ding, J.; Geng, F.; Cai, H.; Wang, D.F. Effects of three different red and blue led light ratio on growth and quality of celery. Acta Agric. Boreali-Occident. Sin. 2015, 24, 125–132. [Google Scholar] [CrossRef]
- Wojciechowska, R.; Długosz-Grochowska, O.; Kołton, A.; Zupnik, M. Effects of LED supplemental lighting on yield and some quality parameters of lamb’s lettuce grown in two winter cycles. Sci. Hortic. 2015, 187, 80–86. [Google Scholar] [CrossRef]
- Zha, L.; Liu, W.; Yang, Q.; Zhang, Y.; Zhou, C.; Shao, M. Regulation of ascorbate accumulation and metabolism in lettuce by the red:blue ratio of continuous light using LEDs. Front. Plant Sci. 2020, 11, 704. [Google Scholar] [CrossRef]
- Johkan, M.; Shoji, K.; Goto, F.; Hashida, S.; Yoshihara, T. Blue light-emitting diode light irradiation of seedlings improves seedling quality and growth after transplanting in red leaf lettuce. HortScience 2010, 45, 1809–1814. [Google Scholar] [CrossRef]
- Kreslavski, V.D.; Lyubimov, V.Y.; Shirshikova, G.N.; Shmarev, A.N.; Kosobryukhov, A.A.; Schmitt, F.J.; Friedrich, T.; Allakhverdiev, S.I. Preillumination of lettuce seedlings with red light enhances the resistance of photosynthetic apparatus to UV-A. J. Photochem. Photobiol. B 2013, 122, 1–6. [Google Scholar] [CrossRef]
- Zhou, C.; Zhang, Y.; Liu, W.; Zha, L.; Shao, M.; Li, B. Light quality affected the growth and root organic carbon and autotoxin secretions of hydroponic lettuce. Plants 2020, 9, 1542. [Google Scholar] [CrossRef]
- Ying, Q.; Kong, Y.; Jones-Baumgardt, C.; Zheng, Y. Responses of yield and appearance quality of four Brassicaceae microgreens to varied blue light proportion in red and blue light-emitting diodes lighting. Sci. Hortic. 2020, 259, 108857. [Google Scholar] [CrossRef]
- Hao, X.; Jia, J.; Mi, J.; Yang, S.; Khattak, A.M.; Zheng, L.; Gao, W.; Wang, M. An optimization model of light intensity and nitrogen concentration coupled with yield and quality. Plant Growth Regul. 2020, 92, 319–331. [Google Scholar] [CrossRef]
- Zheng, X.T.; Zhang, X.H.; Wang, Y.Z.; Cai, M.L.; Li, M.; Zhang, T.J.; Peng, C.L. Identification of a GLDH-overexpressing Arabidopsis mutant and its responses to high-light stress. Photosynthetica 2019, 57, 332–341. [Google Scholar] [CrossRef]
- Linster, C.L.; Clarke, S.G. L-ascorbate biosynthesis in higher plants: The role of VTC2. Trends Plant Sci. 2008, 13, 567–573. [Google Scholar] [CrossRef] [PubMed]
- Zhao, W.; Zhang, Q.; Tan, Y.; Liu, Z.; Ma, M.Y.; Wang, M.X.; Luo, C.Y. Photoprotective roles of ascorbate and PSII cyclic electron flow in the response of the seagrass Zostera marina to oxygen-evolving complex photoinactivation. Photosynthetica 2021, 59, 600–605. [Google Scholar] [CrossRef]
- Zhang, Y.; Zha, L.; Liu, W.; Zhou, C.; Shao, M.; Yang, Q. LED light quality of continuous light before harvest affects growth and AsA metabolism of hydroponic lettuce grown under increasing doses of nitrogen. Plants 2021, 10, 176. [Google Scholar] [CrossRef]
- Bartoli, C.G.; Yu, J.; Gomez, F.; Fernandez, L.; McIntosh, L.; Foyer, C.H. Interrelationships between light and respiration in the control of ascorbic acid synthesis and accumulation in Arabidopsis thaliana leaves. J. Exp. Bot. 2006, 57, 1621–1631. [Google Scholar] [CrossRef]
- Smirnoff, N. Ascorbic acid metabolism and functions: A comparison of plants and mammals. Free Radic. Biol. Med. 2018, 122, 116–129. [Google Scholar] [CrossRef] [PubMed]
- Bulley, S.; Laing, W. The regulation of ascorbate biosynthesis. Curr. Opin. Plant Biol. 2016, 33, 15–22. [Google Scholar] [CrossRef]
- He, W.; Chai, Q.; Zhang, D.; Li, W.; Zhao, C.; Yin, W.; Fan, H.; Yu, A.; Hu, F.; Fan, Z. Beneficial effects of red and blue light on potato leaf antioxidant capacity and tuber bulking. Physiol. Mol. Biol. Plants 2023, 29, 513–523. [Google Scholar] [CrossRef] [PubMed]
- Samuolienė, G.; Urbonavičiūtė, A. Decrease in nitrate concentration in leafy vegetables under a solid-state illuminator. HortScience 2009, 44, 1857–1860. [Google Scholar] [CrossRef]
- Nishikawa, F.; Kato, M.; Hyodo, H.; Ikoma, Y.; Sugiura, M.; Yano, M. Effect of sucrose on ascorbate level and expression of genes involved in the ascorbate biosynthesis and recycling pathway in harvested broccoli florets. J. Exp. Bot. 2005, 56, 65–72. [Google Scholar] [CrossRef]
- Ntagkas, N.; Woltering, E.; Bouras, S.; Vos, R.C.H.; Dieleman, J.A.; Nicole, C.C.S.; Labrie, C.; Marcelis, L.F.M. Light-induced vitamin C accumulation in tomato fruits is independent of carbohydrate availability. Plants 2019, 8, 86. [Google Scholar] [CrossRef] [PubMed]
- Liu, J.; Liu, W. Regulation of accumulation and metabolism circadian rhythms of starch and sucrose in two leaf-color lettuces by red: Blue ratios of LED continuous light. Environ. Exp. Bot. 2022, 196, 104811. [Google Scholar] [CrossRef]
- Li, Y.; Xin, G.; Wei, M.; Shi, Q.; Yang, F.; Wang, X. Carbohydrate accumulation and sucrose metabolism responses in tomato seedling leaves when subjected to different light qualities. Sci. Hortic. 2017, 225, 490–497. [Google Scholar] [CrossRef]
- Yabuta, Y.; Mieda, T.; Rapolu, M.; Nakamura, A.; Motoki, T.; Maruta, T.; Yoshimura, K.; Ishikawa, T.; Shigeoka, S. Light regulation of ascorbate biosynthesis is dependent on the photosynthetic electron transport chain but independent of sugars in Arabidopsis. J. Exp. Bot. 2007, 58, 2661–2671. [Google Scholar] [CrossRef]
- Carvalho, S.D.; Folta, K.M. Environmentally modified organisms—Expanding genetic potential with light. Crit. Rev. Plant Sci. 2014, 33, 486–508. [Google Scholar] [CrossRef]
- Zheng, L.; Marie-Christine, V.L. Long-term effects of red- and blue-light emitting diodes on leaf anatomy and photosynthetic efficiency of three ornamental pot plants. Front. Plant Sci. 2017, 8, 917. [Google Scholar] [CrossRef]
- Gulyás, Z.; Székely, A.; Kulman, K.; Kocsy, G. Light-dependent regulatory interactions between the redox system and miRNAs and their biochemical and physiological effects in plants. Int. J. Mol. Sci. 2023, 24, 8323. [Google Scholar] [CrossRef]
- Gill, S.S.; Tuteja, N. Reactive oxygen species and antioxidant machinery in abiotic stress tolerance in crop plants. Plant Physiol. Biochem. 2010, 48, 909–930. [Google Scholar] [CrossRef] [PubMed]
- Consentino, L.; Lambert, S.; Martino, C.; Jourdan, N.; Bouchet, P.E.; Witczak, J.; Castello, P.; El-Esawi, M.; Corbineau, F.; d’Harlingue, A.; et al. Blue-light dependent reactive oxygen species formation by Arabidopsis cryptochrome may define a novel evolutionarily conserved signaling mechanism. New Phytol. 2015, 206, 1450–1462. [Google Scholar] [CrossRef] [PubMed]
- Jourdan, N.; FMartino, C.; El-Esawi, M.; Witczak, J.; Bouchet, P.E.; d’Harlingue, A.; Ahmad, M. Blue-light dependent ROS formation by Arabidopsis cryptochrome-2 may contribute toward its signaling role. Plant Signal. Behav. 2015, 10, e1042647. [Google Scholar] [CrossRef] [PubMed]
- Awad, J.; Stotz, H.U.; Fekete, A.; Krischke, M.; Engert, C.; Havaux, M.; Berger, S.; Mueller, M.J. 2-Cysteine peroxiredoxins and thylakoid ascorbate peroxidase create a water-water cycle that is essential to protect the photosynthetic apparatus under high light stress conditions. Plant Physiol. 2015, 167, 1592–1603. [Google Scholar] [CrossRef] [PubMed]
- El-Esawi, M.; Arthaut, L.D.; Jourdan, N.; d’Harlingue, A.; Link, J.; Martino, C.F.; Ahmad, M. Blue-light induced biosynthesis of ROS contributes to the signaling mechanism of Arabidopsis cryptochrome. Sci. Rep. 2017, 7, 13875. [Google Scholar] [CrossRef]
- Tuzet, A.; Rahantaniaina, M.S.; Noctor, G. Analyzing the function of catalase and the ascorbate-glutathione pathway in H2O2 processing: Insights from an experimentally constrained kinetic model. Antioxid. Redox Sign. 2018, 30, 7601. [Google Scholar] [CrossRef]
- Borbély, P.; Gasperl, A.; Pálmai, T.; Ahres, M.; Asghar, M.A.; Galiba, G.; Müller, M.; Kocsy, G. Light intensity- and spectrum-dependent redox regulation of plant metabolism. Antioxidants 2022, 11, 1311. [Google Scholar] [CrossRef]
- Chalapathi, R.A.S.V.; Reddy, A.R. Glutathione reductase: A putative redox regulatory system in plant cells. In Sulfur Assimilation and Abiotic Stress in Plants; Khan, N.A., Singh, S., Umar, S., Eds.; Springer: Berlin/Heidelberg, Germany, 2008; pp. 111–147. [Google Scholar] [CrossRef]
- Spínola, V.; Mendes, B.; Câmara, J.S.; Castilho, P.C. An improved and fast UHPLC-PDA methodology for determination of L-ascorbic and dehydroascorbic acids in fruits and vegetables. Evaluation of degradation rate during storage. Anal. Bioanal. Chem. 2012, 403, 1049–1058. [Google Scholar] [CrossRef]
- Shiroma, S.; Tanaka, M.; Sasaki, T.; Ogawa, T.; Yoshimura, K.; Sawa, Y.; Maruta, T.; Ishikawa, T. Chloroplast development activates the expression of ascorbate biosynthesis-associated genes in Arabidopsis roots. Plant Sci. 2019, 284, 185–191. [Google Scholar] [CrossRef]
- Ma, F.; Cheng, L. Exposure of the shaded side of apple fruit to full sun leads to upregulation of both the xanthophyll cycle and the ascorbate-glutathione cycle. Plant Sci. 2004, 166, 1479–1486. [Google Scholar] [CrossRef]
- Zhang, Z.; Liu, H.; Sun, C.; Ma, Q.; Bu, H.; Chong, K.; Xu, Y. A C2H2 zinc-finger protein OsZFP213 interacts with OsMAPK3 to enhance salt tolerance in rice. J. Plant Physiol. 2018, 229, 100–110. [Google Scholar] [CrossRef] [PubMed]


Disclaimer/Publisher’s Note: The statements, opinions and data contained in all publications are solely those of the individual author(s) and contributor(s) and not of MDPI and/or the editor(s). MDPI and/or the editor(s) disclaim responsibility for any injury to people or property resulting from any ideas, methods, instructions or products referred to in the content. |
© 2023 by the authors. Licensee MDPI, Basel, Switzerland. This article is an open access article distributed under the terms and conditions of the Creative Commons Attribution (CC BY) license (https://creativecommons.org/licenses/by/4.0/).
Share and Cite
Zhou, C.; Li, Z.; Liu, W.; Bian, Z.; Lu, W.; Zhou, B.; Wang, S.; Li, Q.; Yang, Q. High-Proportion Blue Light Irradiation at the End-of-Production Stage Promotes the Biosynthesis and Recycling of Ascorbate in Lettuce. Int. J. Mol. Sci. 2023, 24, 16524. https://doi.org/10.3390/ijms242216524
Zhou C, Li Z, Liu W, Bian Z, Lu W, Zhou B, Wang S, Li Q, Yang Q. High-Proportion Blue Light Irradiation at the End-of-Production Stage Promotes the Biosynthesis and Recycling of Ascorbate in Lettuce. International Journal of Molecular Sciences. 2023; 24(22):16524. https://doi.org/10.3390/ijms242216524
Chicago/Turabian StyleZhou, Chengbo, Zonggeng Li, Wenke Liu, Zhonghua Bian, Wei Lu, Bo Zhou, Sen Wang, Qingming Li, and Qichang Yang. 2023. "High-Proportion Blue Light Irradiation at the End-of-Production Stage Promotes the Biosynthesis and Recycling of Ascorbate in Lettuce" International Journal of Molecular Sciences 24, no. 22: 16524. https://doi.org/10.3390/ijms242216524