
Autoantibody Profiling and Anti-Kinesin Reactivity in ANCA-Associated Vasculitis
 , , , , , and
Abstract
:1. Introduction
2. Results
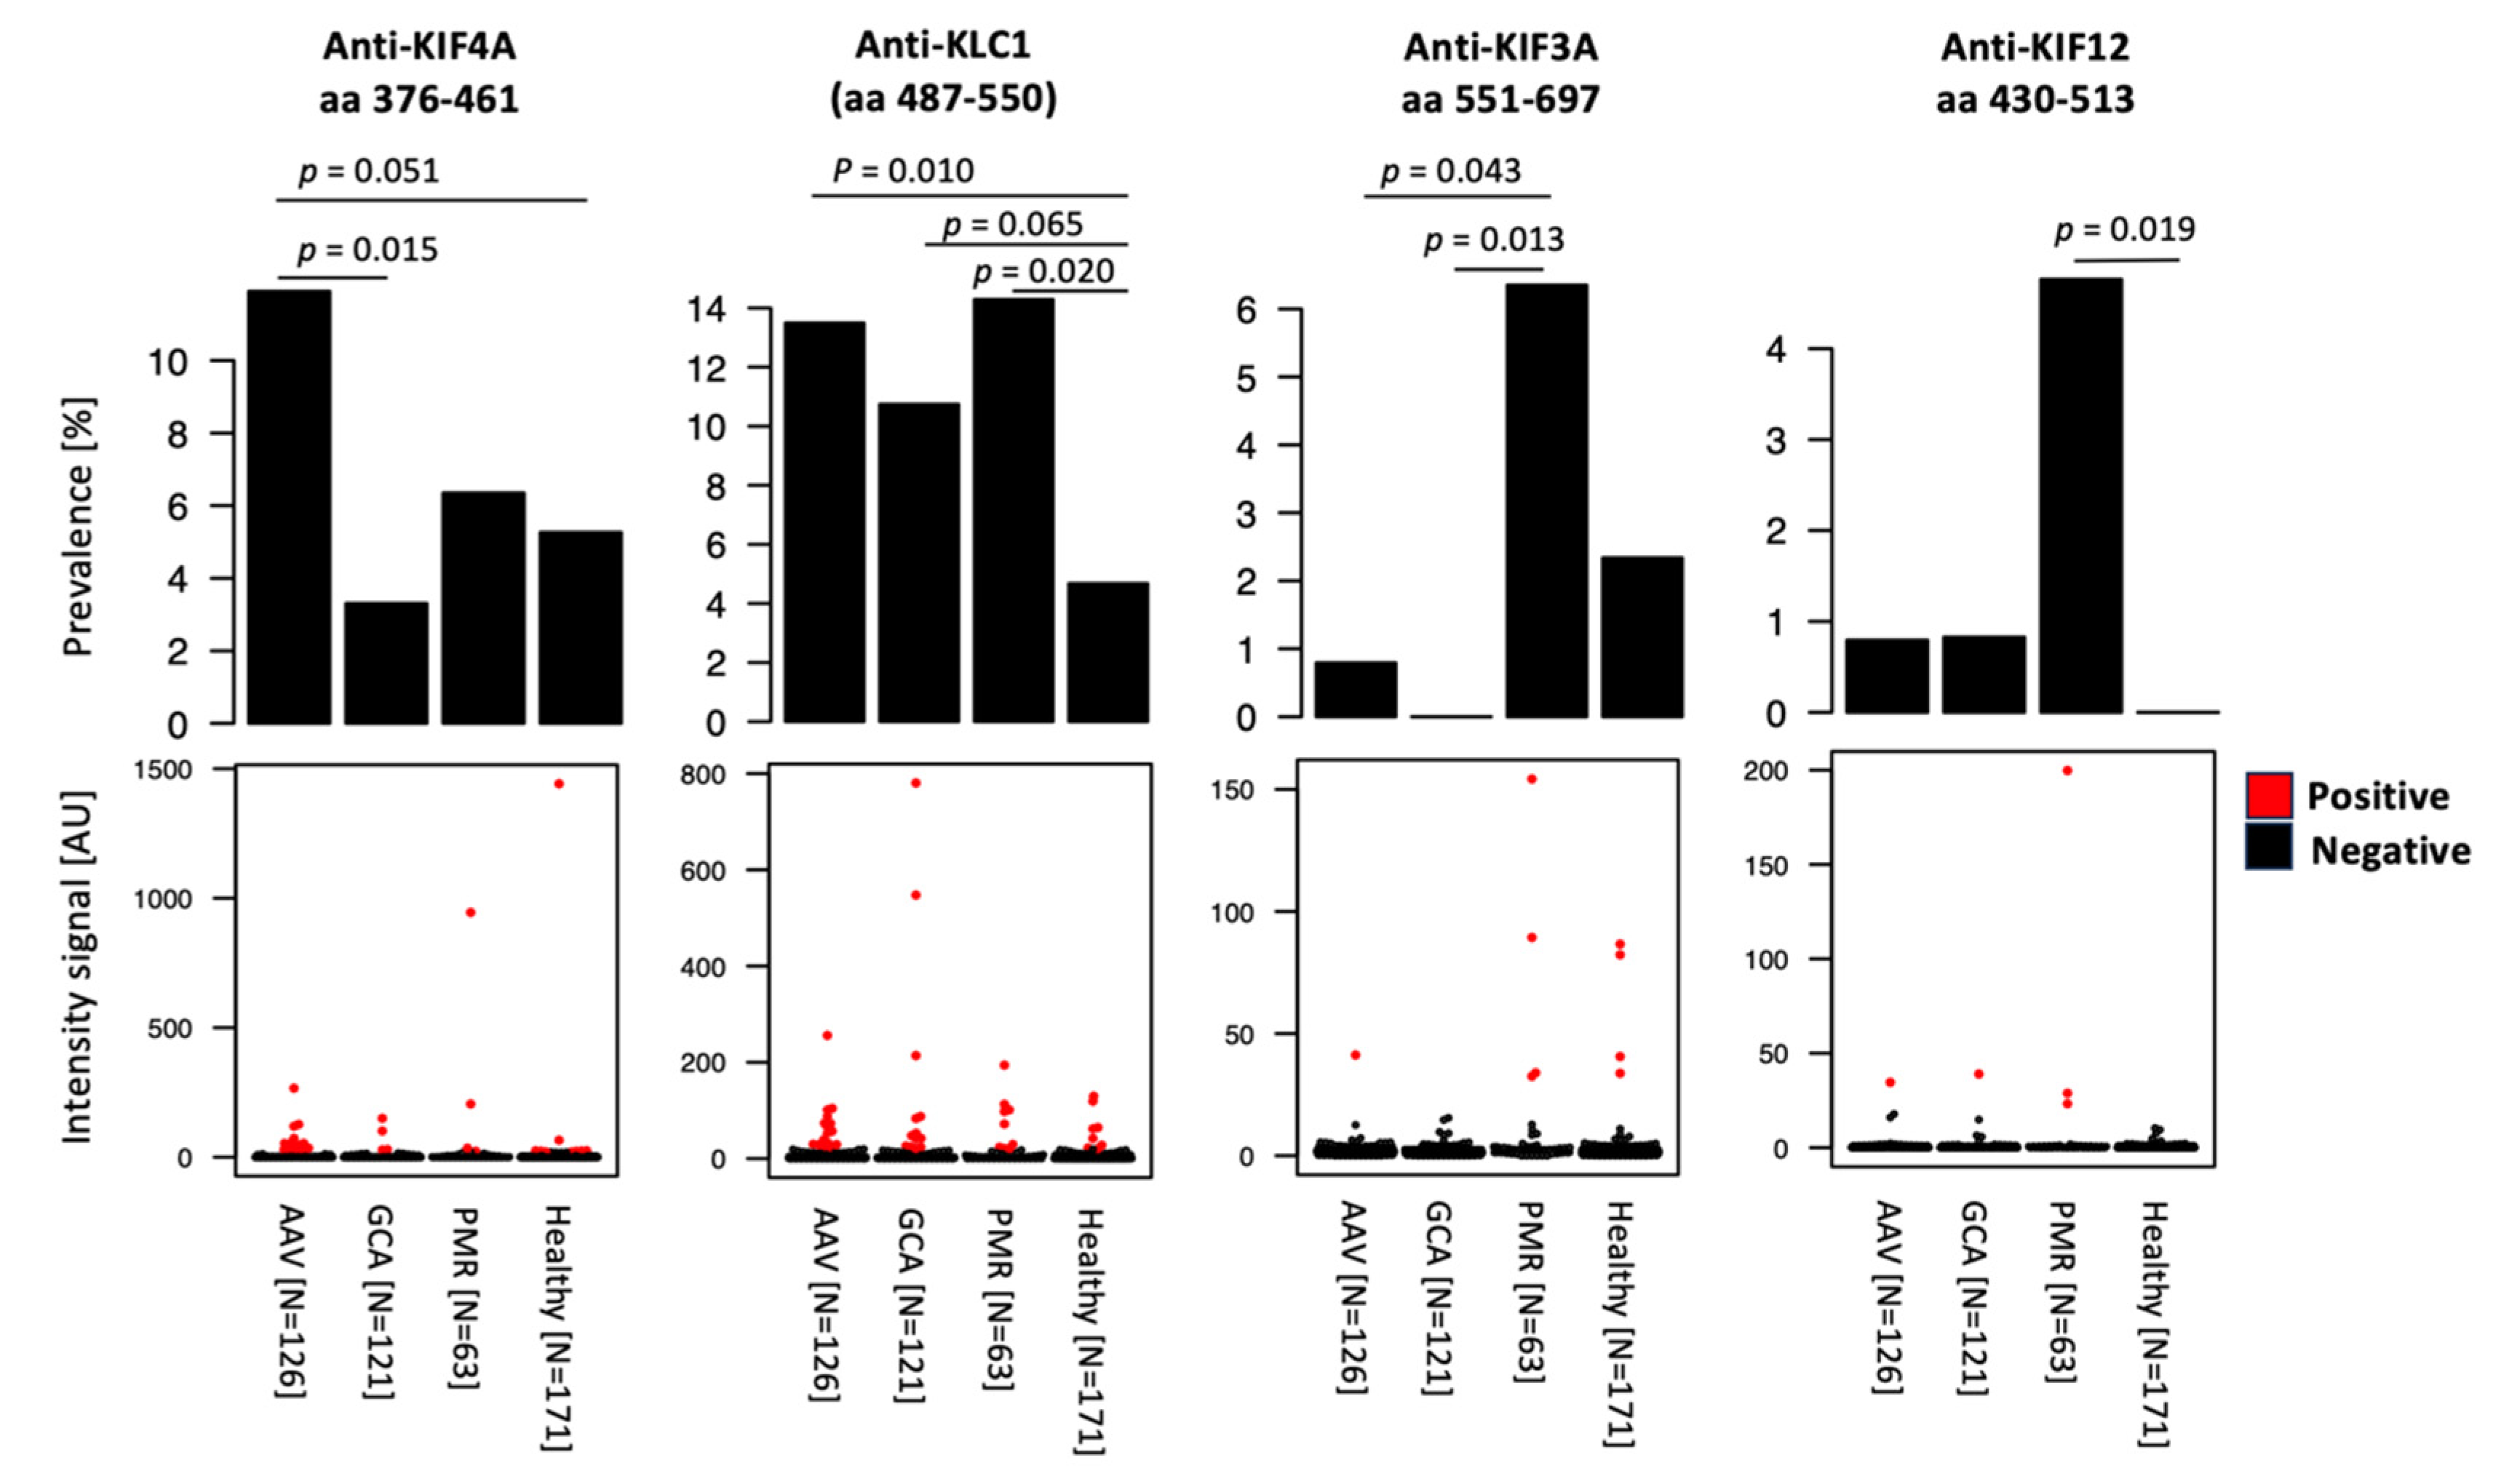
2.1. Autoantibody Screening Revealed Reactivities to Kinesins in AAV Patients
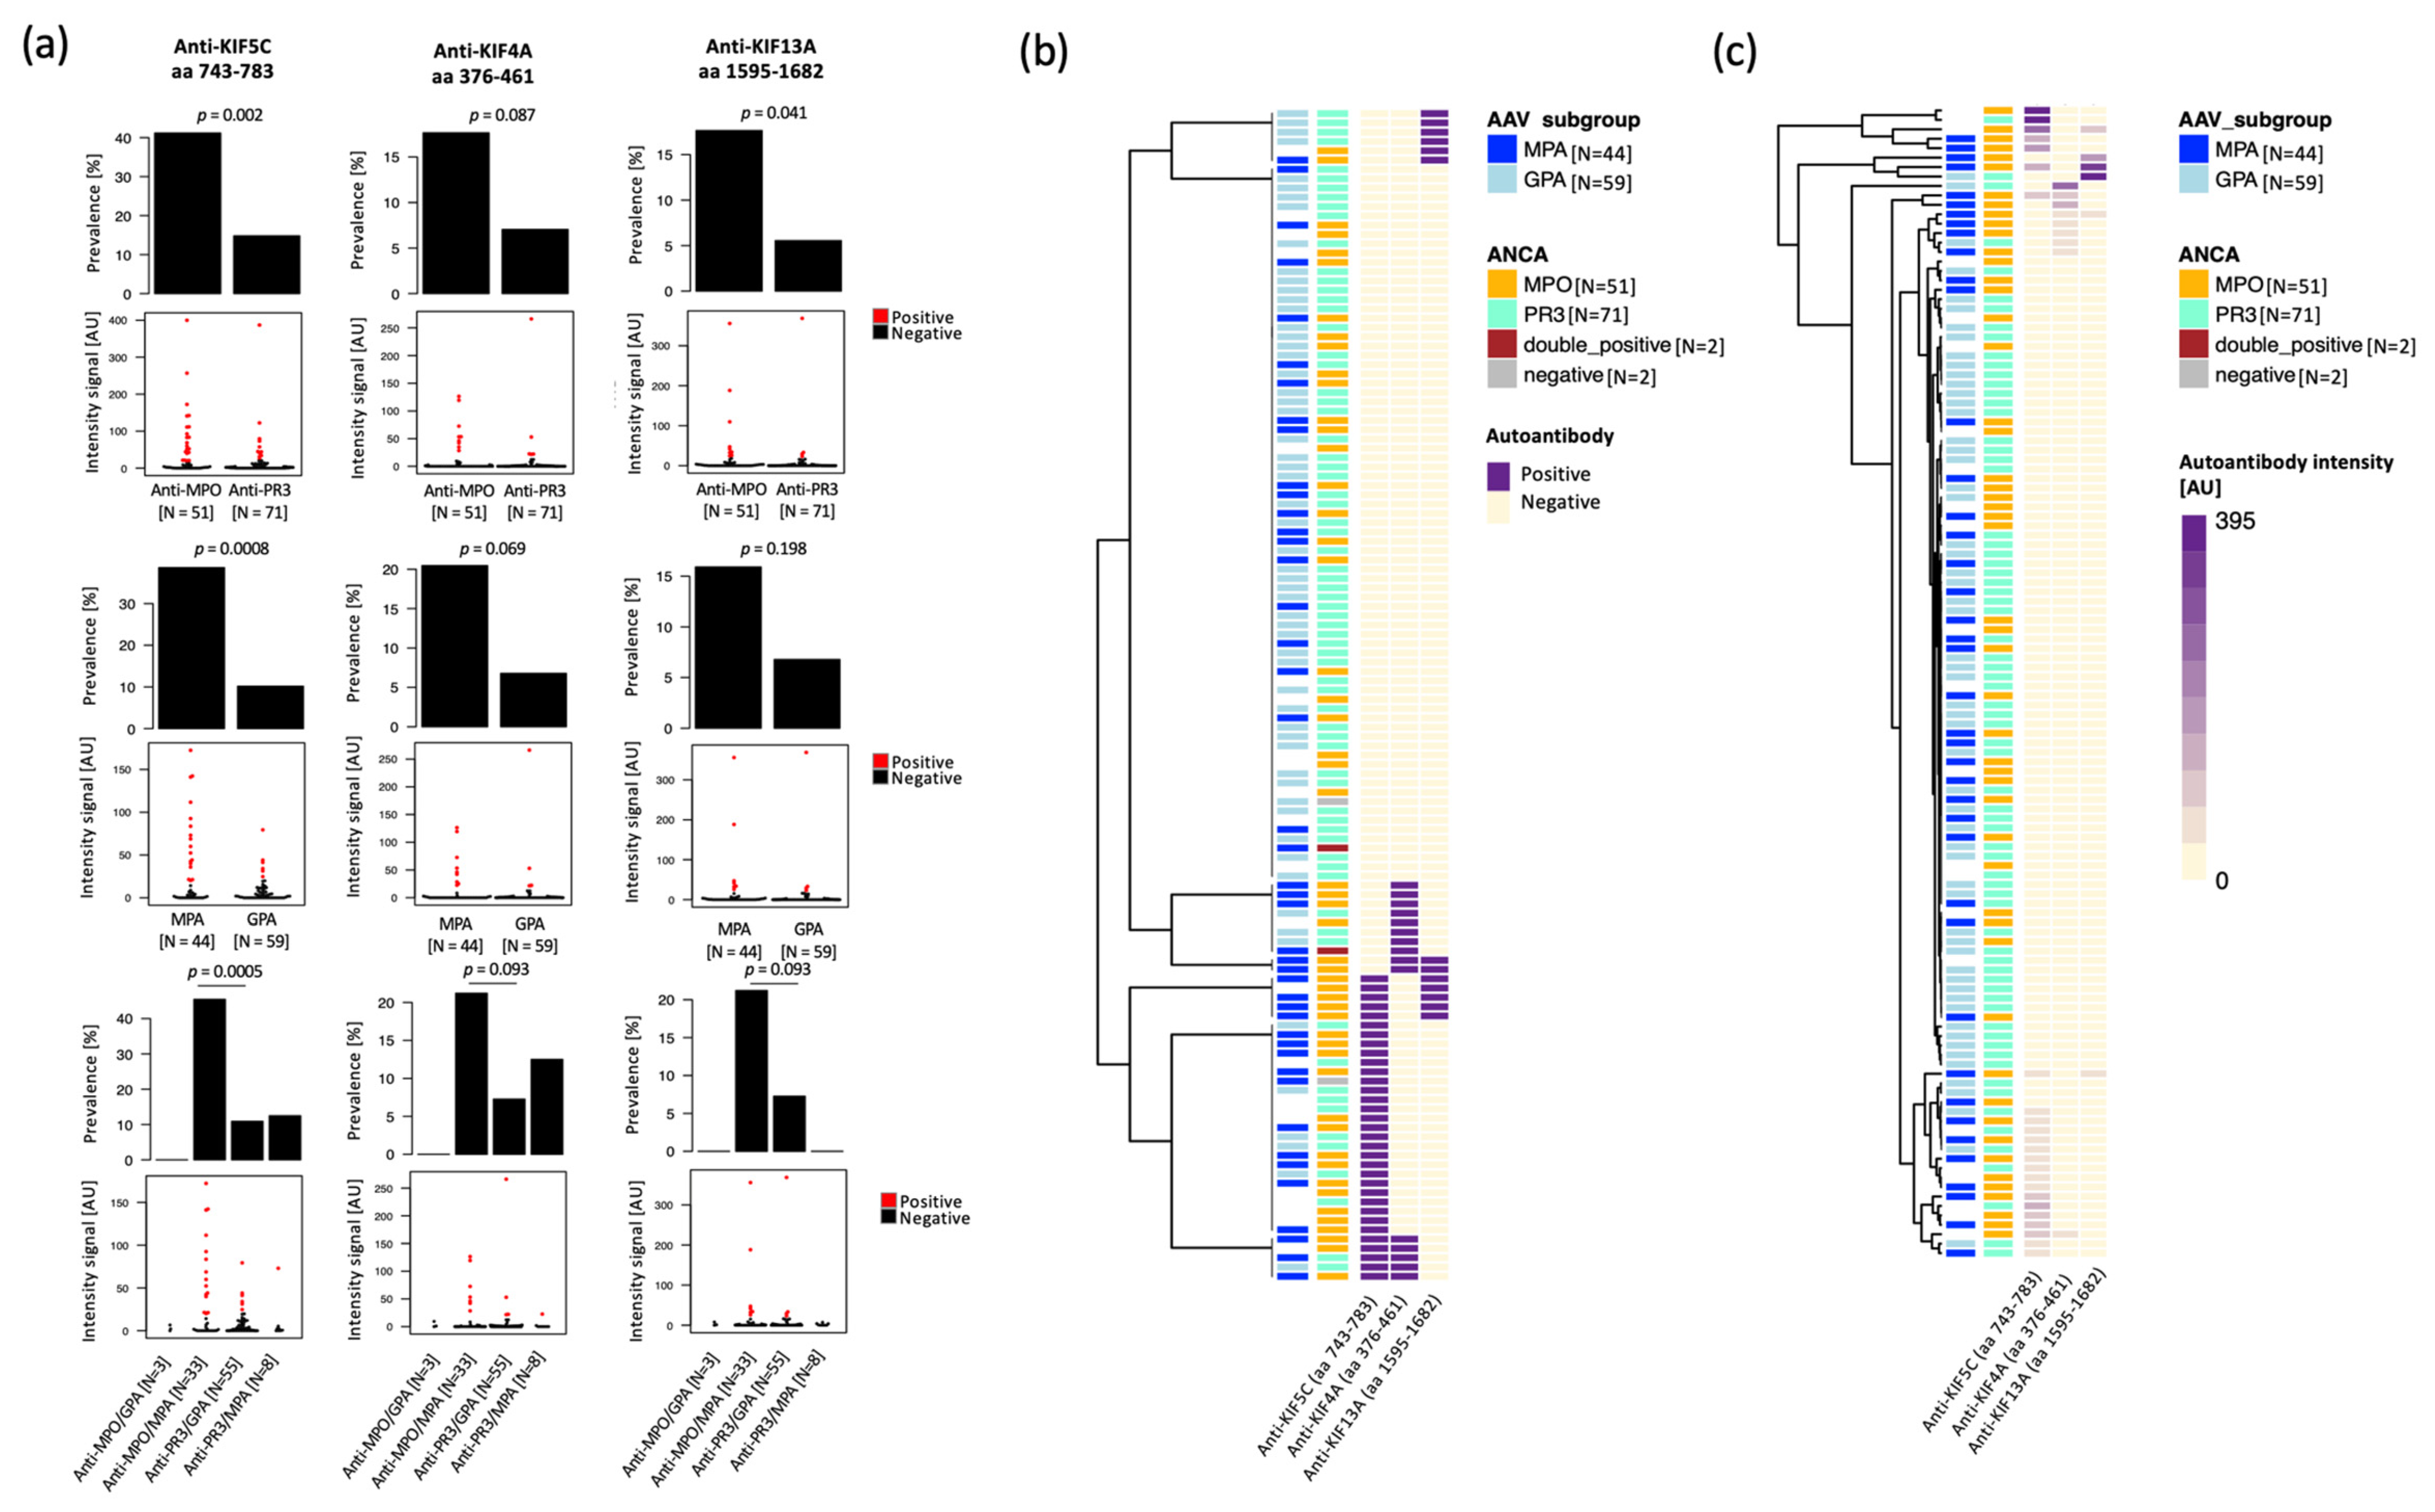
2.2. Anti-Kinesin Antibodies at Higher Prevalence in Anti-MPO Positive and MPA Patients
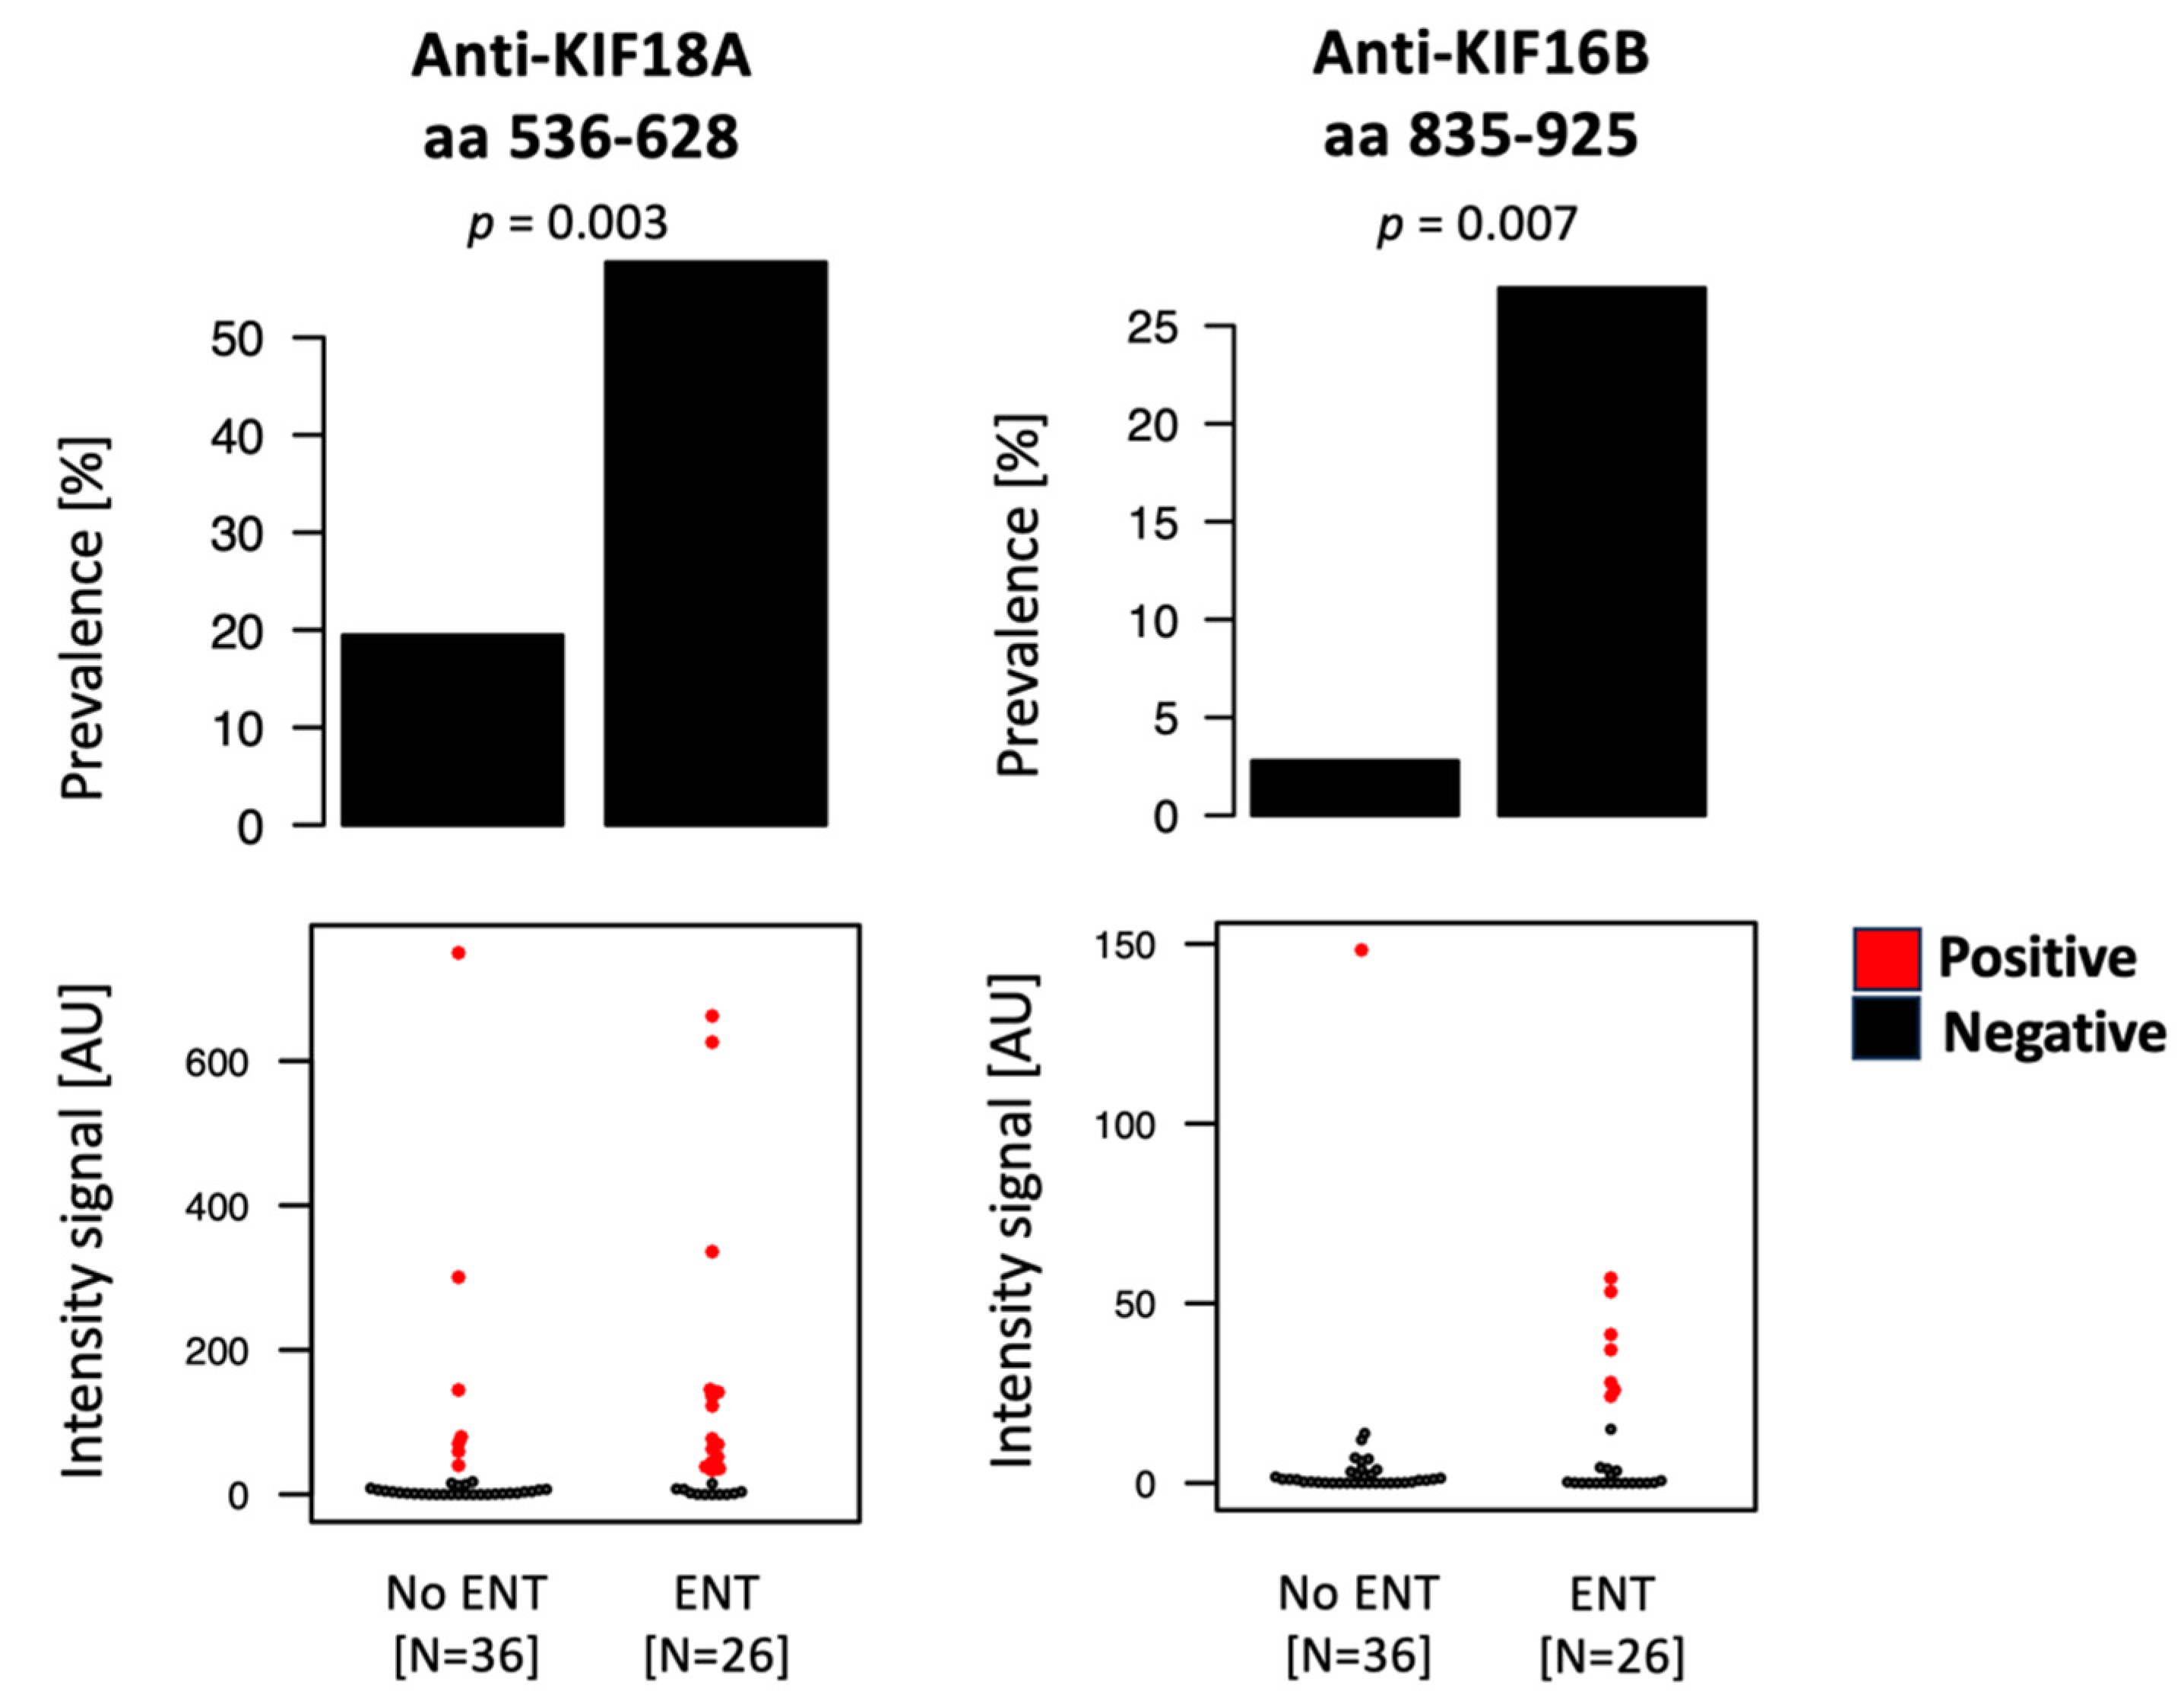
2.3. Anti-Kinesin Autoantibodies Show Association with Organ Involvement, While No Significant Variation Was Detected Based on Disease Activity
3. Discussion
4. Materials and Methods
4.1. Study Group
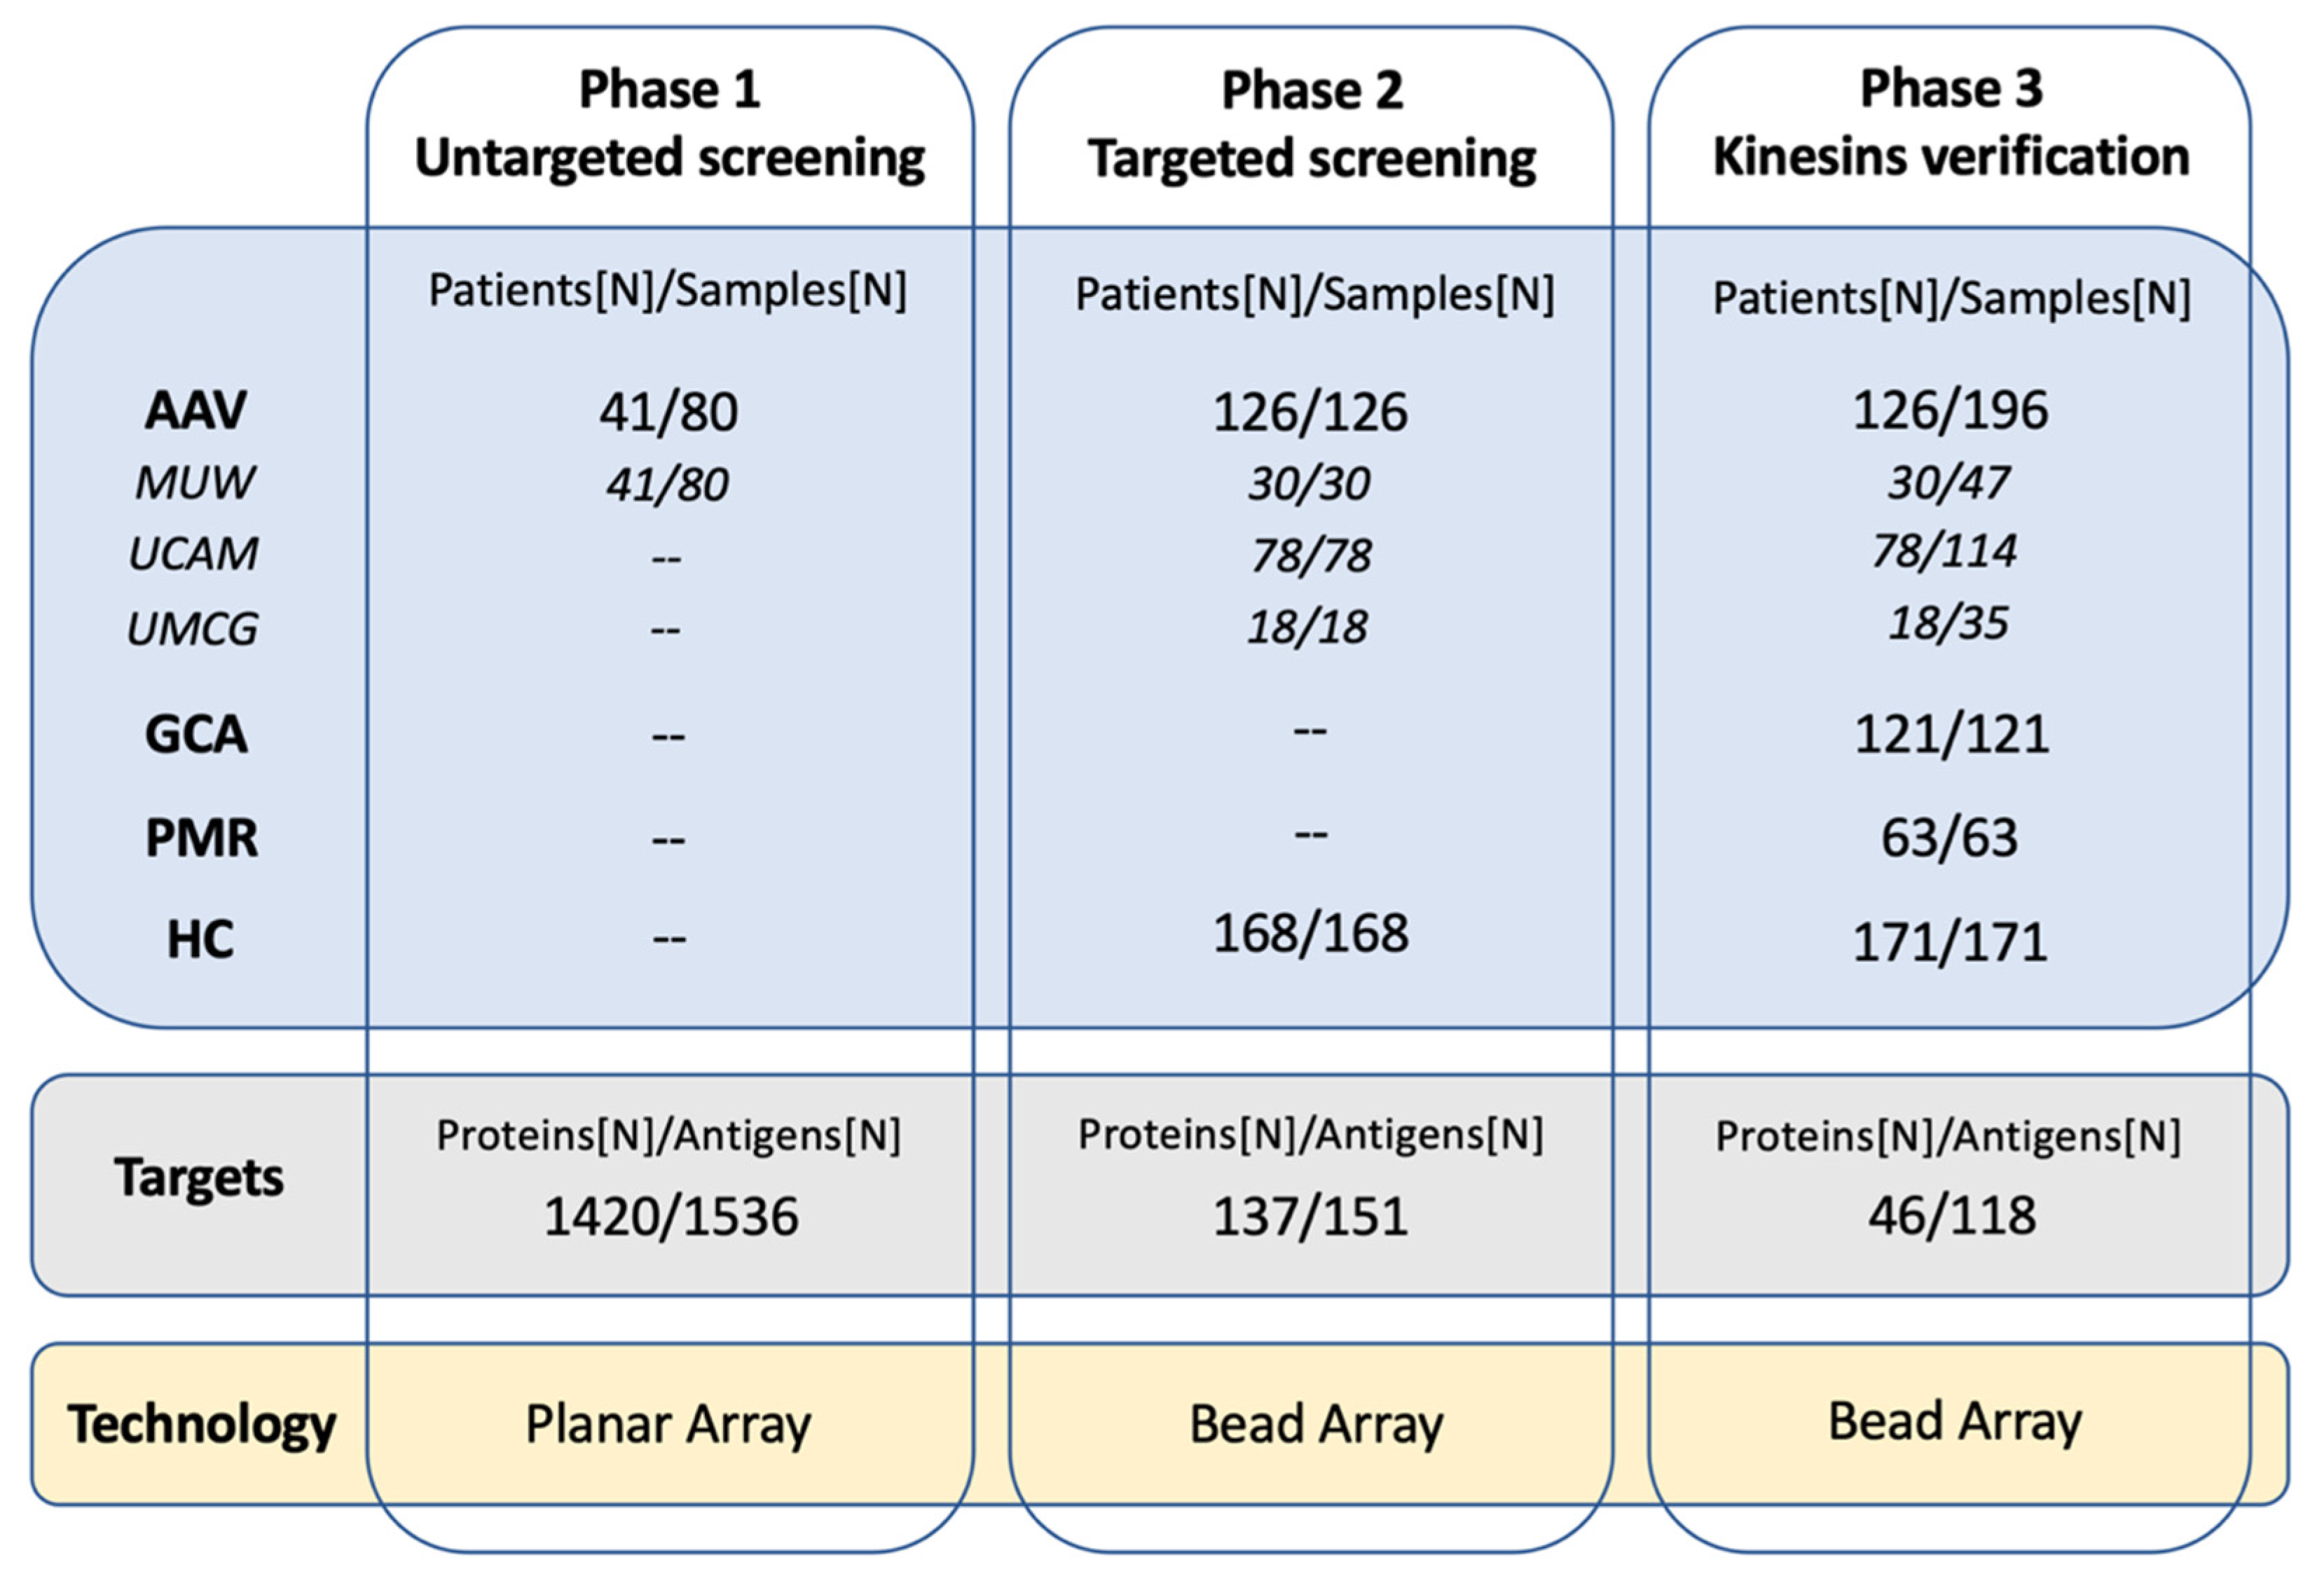
4.2. Study Design
4.3. Antigens
4.4. Untargeted Autoantibody Screening Using Planar Antigen Array
4.5. Targeted Autoantibody Screening and Anti-Kinesin Autoantibody Verification by Antigen Bead Array
4.6. ELISA Assay
4.7. Data Analysis
Supplementary Materials
Author Contributions
Funding
Institutional Review Board Statement
Informed Consent Statement
Data Availability Statement
Conflicts of Interest
References
- Watts, R.A.; Hatemi, G.; Burns, J.C.; Mohammad, A.J. Global epidemiology of vasculitis. Nat. Rev. Rheumatol. 2022, 18, 22–34. [Google Scholar] [CrossRef] [PubMed]
- Sinico, R.A.; Di Toma, L.; Radice, A. Renal involvement in anti-neutrophil cytoplasmic autoantibody associated vasculitis. Autoimmun. Rev. 2013, 12, 477–482. [Google Scholar] [CrossRef] [PubMed]
- Almaani, S.; Fussner, L.A.; Brodsky, S.; Meara, A.S.; Jayne, D. ANCA-Associated Vasculitis: An Update. J. Clin. Med. 2021, 10, 1446. [Google Scholar] [CrossRef] [PubMed]
- Jennette, J.C. Overview of the 2012 revised International Chapel Hill Consensus Conference nomenclature of vasculitides. Clin. Exp. Nephrol. 2013, 17, 603–606. [Google Scholar] [CrossRef]
- Bossuyt, X.; Cohen Tervaert, J.W.; Arimura, Y.; Blockmans, D.; Flores-Suarez, L.F.; Guillevin, L.; Hellmich, B.; Jayne, D.; Jennette, J.C.; Kallenberg, C.G.M.; et al. Position paper: Revised 2017 international consensus on testing of ANCAs in granulomatosis with polyangiitis and microscopic polyangiitis. Nat. Rev. Rheumatol. 2017, 13, 683–692. [Google Scholar] [CrossRef]
- Al-Soudi, A.; Vegting, Y.; Klarenbeek, P.L.; Hilhorst, M.L. Do Relapses Follow ANCA Rises? A Systematic Review and Meta-Analysis on the Value of Serial ANCA Level Evaluation. Front. Med. 2022, 9, 844112. [Google Scholar] [CrossRef]
- Morgan, M.D.; Szeto, M.; Walsh, M.; Jayne, D.; Westman, K.; Rasmussen, N.; Hiemstra, T.F.; Flossmann, O.; Berden, A.; Hoglund, P.; et al. Negative anti-neutrophil cytoplasm antibody at switch to maintenance therapy is associated with a reduced risk of relapse. Arthritis Res. Ther. 2017, 19, 129. [Google Scholar] [CrossRef]
- McClure, M.E.; Wason, J.; Gopaluni, S.; Tieu, J.; Smith, R.M.; Jayne, D.R.; Jones, R.B. Evaluation of PR3-ANCA Status After Rituximab for ANCA-Associated Vasculitis. J. Clin. Rheumatol. 2019, 25, 217–223. [Google Scholar] [CrossRef]
- Cui, Z.; Zhao, M.H.; Segelmark, M.; Hellmark, T. Natural autoantibodies to myeloperoxidase, proteinase 3, and the glomerular basement membrane are present in normal individuals. Kidney Int. 2010, 78, 590–597. [Google Scholar] [CrossRef]
- Kain, R.; Tadema, H.; McKinney, E.F.; Benharkou, A.; Brandes, R.; Peschel, A.; Hubert, V.; Feenstra, T.; Sengolge, G.; Stegeman, C.; et al. High prevalence of autoantibodies to hLAMP-2 in anti-neutrophil cytoplasmic antibody-associated vasculitis. J. Am. Soc. Nephrol. 2012, 23, 556–566. [Google Scholar] [CrossRef]
- Berden, A.E.; Nolan, S.L.; Morris, H.L.; Bertina, R.M.; Erasmus, D.D.; Hagen, E.C.; Hayes, D.P.; van Tilburg, N.H.; Bruijn, J.A.; Savage, C.O.; et al. Anti-plasminogen antibodies compromise fibrinolysis and associate with renal histology in ANCA-associated vasculitis. J. Am. Soc. Nephrol. 2010, 21, 2169–2179. [Google Scholar] [CrossRef] [PubMed]
- Klapa, S.; Muller, A.; Koch, A.; Kerstein-Stahle, A.; Kahler, W.; Heidecke, H.; Schinke, S.; Huber-Lang, M.; Nitschke, M.; Pitann, S.; et al. Low Concentrations of C5a Complement Receptor Antibodies Are Linked to Disease Activity and Relapse in Antineutrophil Cytoplasmic Autoantibody-Associated Vasculitis. Arthritis Rheumatol. 2023, 75, 760–767. [Google Scholar] [CrossRef]
- Uhlen, M.; Fagerberg, L.; Hallstrom, B.M.; Lindskog, C.; Oksvold, P.; Mardinoglu, A.; Sivertsson, A.; Kampf, C.; Sjostedt, E.; Asplund, A.; et al. Proteomics. Tissue-based map of the human proteome. Science 2015, 347, 1260419. [Google Scholar] [CrossRef]
- Fuentes, M.; Ruiz-Romero, C.; Misiego, S.; Juanes-Velasco, P.; Landeira-Vinuela, A.; Torres-Roda, A.; Lorenzo-Gil, H.; Gonzalez-Gonzalez, M.; Hernandez, A.P.; Lourido, L.; et al. Exploring High-Throughput Immunoassays for Biomarker Validation in Rheumatic Diseases in the Context of the Human Proteome Project. J. Proteome Res. 2023, 22, 1105–1115. [Google Scholar] [CrossRef]
- Jernbom Falk, A.; Galletly, C.; Just, D.; Toben, C.; Baune, B.T.; Clark, S.R.; Liu, D.; Nilsson, P.; Manberg, A.; Schubert, K.O. Autoantibody profiles associated with clinical features in psychotic disorders. Transl. Psychiatry 2021, 11, 474. [Google Scholar] [CrossRef] [PubMed]
- Neiman, M.; Hellstrom, C.; Just, D.; Mattsson, C.; Fagerberg, L.; Schuppe-Koistinen, I.; Gummesson, A.; Bergstrom, G.; Kallioniemi, O.; Achour, A.; et al. Individual and stable autoantibody repertoires in healthy individuals. Autoimmunity 2019, 52, 1–11. [Google Scholar] [CrossRef] [PubMed]
- Yip, Y.Y.; Pernigo, S.; Sanger, A.; Xu, M.; Parsons, M.; Steiner, R.A.; Dodding, M.P. The light chains of kinesin-1 are autoinhibited. Proc. Natl. Acad. Sci. USA 2016, 113, 2418–2423. [Google Scholar] [CrossRef] [PubMed]
- Yamazaki, H.; Nakata, T.; Okada, Y.; Hirokawa, N. Cloning and characterization of KAP3: A novel kinesin superfamily-associated protein of KIF3A/3B. Proc. Natl. Acad. Sci. USA 1996, 93, 8443–8448. [Google Scholar] [CrossRef]
- Hirokawa, N.; Noda, Y.; Tanaka, Y.; Niwa, S. Kinesin superfamily motor proteins and intracellular transport. Nat. Rev. Mol. Cell Biol. 2009, 10, 682–696. [Google Scholar] [CrossRef]
- Geng, A.; Qiu, R.; Murai, K.; Liu, J.; Wu, X.; Zhang, H.; Farhoodi, H.; Duong, N.; Jiang, M.; Yee, J.K.; et al. KIF20A/MKLP2 regulates the division modes of neural progenitor cells during cortical development. Nat. Commun. 2018, 9, 2707. [Google Scholar] [CrossRef]
- Janisch, K.M.; McNeely, K.C.; Dardick, J.M.; Lim, S.H.; Dwyer, N.D. Kinesin-6 KIF20B is required for efficient cytokinetic furrowing and timely abscission in human cells. Mol. Biol. Cell 2018, 29, 166–179. [Google Scholar] [CrossRef]
- Winters, L.; Ban, I.; Prelogovic, M.; Kalinina, I.; Pavin, N.; Tolic, I.M. Pivoting of microtubules driven by minus-end-directed motors leads to spindle assembly. BMC Biol. 2019, 17, 42. [Google Scholar] [CrossRef] [PubMed]
- Munoz, I.; Danelli, L.; Claver, J.; Goudin, N.; Kurowska, M.; Madera-Salcedo, I.K.; Huang, J.D.; Fischer, A.; Gonzalez-Espinosa, C.; de Saint Basile, G.; et al. Kinesin-1 controls mast cell degranulation and anaphylaxis through PI3K-dependent recruitment to the granular Slp3/Rab27b complex. J. Cell Biol. 2016, 215, 203–216. [Google Scholar] [CrossRef] [PubMed]
- Fan, R.; Lai, K.O. Understanding how kinesin motor proteins regulate postsynaptic function in neuron. FEBS J. 2022, 289, 2128–2144. [Google Scholar] [CrossRef] [PubMed]
- Kalantari, S.; Filges, I. ‘Kinesinopathies’: Emerging role of the kinesin family member genes in birth defects. J. Med. Genet. 2020, 57, 797–807. [Google Scholar] [CrossRef]
- International Multiple Sclerosis Genetics, C. Comprehensive follow-up of the first genome-wide association study of multiple sclerosis identifies KIF21B and TMEM39A as susceptibility loci. Hum. Mol. Genet. 2010, 19, 953–962. [Google Scholar] [CrossRef]
- Alcina, A.; Vandenbroeck, K.; Otaegui, D.; Saiz, A.; Gonzalez, J.R.; Fernandez, O.; Cavanillas, M.L.; Cenit, M.C.; Arroyo, R.; Alloza, I.; et al. The autoimmune disease-associated KIF5A, CD226 and SH2B3 gene variants confer susceptibility for multiple sclerosis. Genes Immun. 2010, 11, 439–445. [Google Scholar] [CrossRef]
- del Rio, R.; McAllister, R.D.; Meeker, N.D.; Wall, E.H.; Bond, J.P.; Kyttaris, V.C.; Tsokos, G.C.; Tung, K.S.; Teuscher, C. Identification of Orch3, a locus controlling dominant resistance to autoimmune orchitis, as kinesin family member 1C. PLoS Genet. 2012, 8, e1003140. [Google Scholar] [CrossRef]
- Bernasconi, P.; Cappelletti, C.; Navone, F.; Nessi, V.; Baggi, F.; Vernos, I.; Romaggi, S.; Confalonieri, P.; Mora, M.; Morandi, L.; et al. The kinesin superfamily motor protein KIF4 is associated with immune cell activation in idiopathic inflammatory myopathies. J. Neuropathol. Exp. Neurol. 2008, 67, 624–632. [Google Scholar] [CrossRef]
- Betancur, J.F.; Londono, A.; Estrada, V.E.; Puerta, S.L.; Osorno, S.M.; Loaiza, A.; Carmona, J.A.; Gomez-Puerta, J.A. Uncommon patterns of antinuclear antibodies recognizing mitotic spindle apparatus antigens and clinical associations. Medicine 2018, 97, e11727. [Google Scholar] [CrossRef]
- Bonaci-Nikolic, B.; Andrejevic, S.; Bukilica, M.; Urosevic, I.; Nikolic, M. Autoantibodies to mitotic apparatus: Association with other autoantibodies and their clinical significance. J. Clin. Immunol. 2006, 26, 438–446. [Google Scholar] [CrossRef] [PubMed]
- Xi, Q.; Wu, Y.; Li, L.; Cai, B.; Zhang, J.; Yang, B.; Wang, L. Anti-Mitotic Spindle Apparatus Antoantibodies: Prevalence and Disease Association in Chinese Population. J. Clin. Lab. Anal. 2016, 30, 702–708. [Google Scholar] [CrossRef] [PubMed]
- Mozo, L.; Gutierrez, C.; Gomez, J. Antibodies to mitotic spindle apparatus: Clinical significance of NuMA and HsEg5 autoantibodies. J. Clin. Immunol. 2008, 28, 285–290. [Google Scholar] [CrossRef]
- Shome, M.; Chung, Y.; Chavan, R.; Park, J.G.; Qiu, J.; LaBaer, J. Serum autoantibodyome reveals that healthy individuals share common autoantibodies. Cell Rep. 2022, 39, 110873. [Google Scholar] [CrossRef] [PubMed]
- Hysa, E.; Gotelli, E.; Sammori, S.; Cimmino, M.A.; Paolino, S.; Pizzorni, C.; Sulli, A.; Smith, V.; Cutolo, M. Immune system activation in polymyalgia rheumatica: Which balance between autoinflammation and autoimmunity? A systematic review. Autoimmun. Rev. 2022, 21, 102995. [Google Scholar] [CrossRef] [PubMed]
- Schafer, V.S.; Brossart, P.; Warrington, K.J.; Kurts, C.; Sendtner, G.W.; Aden, C.A. The role of autoimmunity and autoinflammation in giant cell arteritis: A systematic literature review. Autoimmun. Rev. 2023, 22, 103328. [Google Scholar] [CrossRef]
- Watts, R.A.; Gonzalez-Gay, M.A.; Lane, S.E.; Garcia-Porrua, C.; Bentham, G.; Scott, D.G. Geoepidemiology of systemic vasculitis: Comparison of the incidence in two regions of Europe. Ann. Rheum. Dis. 2001, 60, 170–172. [Google Scholar] [CrossRef]
- Weiner, M.; Bjorneklett, R.; Hruskova, Z.; Mackinnon, B.; Poulton, C.J.; Sindelar, L.; Mohammad, A.J.; Eriksson, P.; Gesualdo, L.; Geetha, D.; et al. Proteinase-3 and myeloperoxidase serotype in relation to demographic factors and geographic distribution in anti-neutrophil cytoplasmic antibody-associated glomerulonephritis. Nephrol. Dial. Transpl. 2019, 34, 301–308. [Google Scholar] [CrossRef]
- Lyons, P.A.; Rayner, T.F.; Trivedi, S.; Holle, J.U.; Watts, R.A.; Jayne, D.R.; Baslund, B.; Brenchley, P.; Bruchfeld, A.; Chaudhry, A.N.; et al. Genetically distinct subsets within ANCA-associated vasculitis. N. Engl. J. Med. 2012, 367, 214–223. [Google Scholar] [CrossRef]
- Mohammad, A.J.; Segelmark, M. A population-based study showing better renal prognosis for proteinase 3 antineutrophil cytoplasmic antibody (ANCA)-associated nephritis versus myeloperoxidase ANCA-associated nephritis. J. Rheumatol. 2014, 41, 1366–1373. [Google Scholar] [CrossRef]
- Cornec, D.; Cornec-Le Gall, E.; Fervenza, F.C.; Specks, U. ANCA-associated vasculitis—Clinical utility of using ANCA specificity to classify patients. Nat. Rev. Rheumatol. 2016, 12, 570–579. [Google Scholar] [CrossRef] [PubMed]
- Rathmann, J.; Stamatis, P.; Jonsson, G.; Englund, M.; Segelmark, M.; Jayne, D.; Mohammad, A.J. Infection is associated with increased risk of MPO- but not PR3-ANCA-associated vasculitis. Rheumatology 2022, 61, 4817–4826. [Google Scholar] [CrossRef] [PubMed]
- Mukhtyar, C.; Lee, R.; Brown, D.; Carruthers, D.; Dasgupta, B.; Dubey, S.; Flossmann, O.; Hall, C.; Hollywood, J.; Jayne, D.; et al. Modification and validation of the Birmingham Vasculitis Activity Score (version 3). Ann. Rheum. Dis. 2009, 68, 1827–1832. [Google Scholar] [CrossRef] [PubMed]
- The Human Protein Atlas, v.23.0. Available online: https://www.proteinatlas.org/ (accessed on 30 September 2023).
- Berglund, L.; Bjorling, E.; Jonasson, K.; Rockberg, J.; Fagerberg, L.; Al-Khalili Szigyarto, C.; Sivertsson, A.; Uhlen, M. A whole-genome bioinformatics approach to selection of antigens for systematic antibody generation. Proteomics 2008, 8, 2832–2839. [Google Scholar] [CrossRef]
- Pin, E.; Henjes, F.; Hong, M.G.; Wiklund, F.; Magnusson, P.; Bjartell, A.; Uhlen, M.; Nilsson, P.; Schwenk, J.M. Identification of a Novel Autoimmune Peptide Epitope of Prostein in Prostate Cancer. J. Proteome. Res. 2017, 16, 204–216. [Google Scholar] [CrossRef]


| Demographics | AAV | GCA | PMR | Healthy |
|---|---|---|---|---|
| n (individuals/samples) | 137/229 | 121/121 | 63/63 | 171/171 |
| Provider a | ||||
| MUW | 41/80 | - | - | - |
| UMCG | 18/35 | 121/121 | 63/63 | 78/78 |
| UCAM | 78/114 | - | - | 93/93 |
| Age, median (range) | 62 (19–85) b | 69 (49–89) | 69 (50–84) | 64 (21–86) |
| Sex, n (%) | ||||
| Male | 73 (53) | 42 (35) | 23 (37) | 72 (42) |
| Female | 64 (47) | 79 (65) | 40 (63) | 99 (58) |
Disclaimer/Publisher’s Note: The statements, opinions and data contained in all publications are solely those of the individual author(s) and contributor(s) and not of MDPI and/or the editor(s). MDPI and/or the editor(s) disclaim responsibility for any injury to people or property resulting from any ideas, methods, instructions or products referred to in the content. |
© 2023 by the authors. Licensee MDPI, Basel, Switzerland. This article is an open access article distributed under the terms and conditions of the Creative Commons Attribution (CC BY) license (https://creativecommons.org/licenses/by/4.0/).
Share and Cite
Mescia, F.; Bayati, S.; Brouwer, E.; Heeringa, P.; Toonen, E.J.M.; Beenes, M.; Ball, M.J.; Rees, A.J.; Kain, R.; Lyons, P.A.; et al. Autoantibody Profiling and Anti-Kinesin Reactivity in ANCA-Associated Vasculitis. Int. J. Mol. Sci. 2023, 24, 15341. https://doi.org/10.3390/ijms242015341
Mescia F, Bayati S, Brouwer E, Heeringa P, Toonen EJM, Beenes M, Ball MJ, Rees AJ, Kain R, Lyons PA, et al. Autoantibody Profiling and Anti-Kinesin Reactivity in ANCA-Associated Vasculitis. International Journal of Molecular Sciences. 2023; 24(20):15341. https://doi.org/10.3390/ijms242015341
Chicago/Turabian StyleMescia, Federica, Shaghayegh Bayati, Elisabeth Brouwer, Peter Heeringa, Erik J. M. Toonen, Marijke Beenes, Miriam J. Ball, Andrew J. Rees, Renate Kain, Paul A. Lyons, and et al. 2023. "Autoantibody Profiling and Anti-Kinesin Reactivity in ANCA-Associated Vasculitis" International Journal of Molecular Sciences 24, no. 20: 15341. https://doi.org/10.3390/ijms242015341