1. Introduction
One of the most important abiotic stressors is soil salinization, which hinders crop yields and can destabilize the global food supply [
1]. Maize is an important food crop, accounting for more than half of the calories consumed globally [
2]. However, maize is a glycophyte and is hypersensitive to salt stress [
3]. As such, it is important to understand how maize tolerates salt and to identify new candidate genes in maize breeding.
The NAC transcription factor is an acronym of the
NAM,
ATAF1/2 and
CUC2 genes. The first
NAC gene,
NAM (
No Apical Meristem), is from
Petunia hybrida and is related to the development of the shoot tip meristem [
4]. Subsequently,
ATAF1/2 and
CUC2 genes similar to
NAM structures were found in
Arabidopsis thaliana [
5]. Bioinformatics analyses indicated that the NAC transcription factor has 151 members in rice (
Oryza sativa) [
6], 117 members in
Arabidopsis [
7] and 152 members in tobacco (
Nicotiana tabacum) [
8] and soybean (
Glycine max) [
9]. Analysis of expression profiling demonstrated that 20–25% of NAC genes were activated by a minimum of one abiotic stressor, such as drought conditions, freezing temperatures, salt or phytohormones and ABA [
10]. These helped regulate response gene expression, which contributes to abiotic stress resistance in plants.
Combined with the promoter of the ABA signal regulator
OsbZIP23,
SNAC1 positively regulated the expression of downstream ABA signal genes to improve drought and salt tolerance and increase rice yield [
11,
12]. Its homologous gene
SNAC2 can improve salt and cold resistance [
13].
SNAC3 improves drought and heat resistance by regulating ROS detoxification genes in rice [
14]
OsNAC5,
6 and
10 improved drought tolerance and reduced yield loss [
15,
16,
17].
OsNAC66 can improve rice’s drought resistance and antioxidant ability and resist rice blast and leaf blight by inhibiting the ABA signal pathway [
18,
19].
OsNAC2 depends on the ABA pathway to accelerate leaf senescence in rice [
20]. Other reports indicate that NAC genes can improve crop resistance, including chickpea
CarNAC2 [
21], sorghum
SbSNAC1 [
22], wheat
TaNAC29 [
23,
24] and
TaNAC2-5A [
25], tomato
SlNAP2 [
26] and
SlJUB1 [
27]. This indicates that NAC transcription factors have potential applications in abiotic stress breeding.
Based on the sequence characteristics of NAC protein, Voitsik et al. found 116 NAC genes by scanning the whole genome of maize and cloned two NAC transcription factor genes,
ZmNAC41 and
ZmNAC100, which are related to maize anthracnose [
28]. Previously, the functions of some maize NAC transcription factor genes have been verified:
ZmSNAC1,
ZmNAC33 and
ZmNAC55 significantly increase the drought tolerance of transgenic
Arabidopsis [
29,
30,
31]. A genome-wide association study confirmed that the
ZmNAC111 gene is significantly associated with drought resistance. The promoter region has an insertion of a miniature inverted repeating transposon MITE [
32].
ZmaNAC34 and
ZmNAC36 genes are associated with starch synthesis [
33,
34].
ZmNAC84 was phosphorylated by
ZmCCaMK at Ser-113 and induced antioxidant defense by activating downstream genes [
35].
Previously, we analyzed differentially expressed genes in the maize transcriptome under alkaline–salt Na
2CO
3 stress using second-generation high-throughput sequencing RNA-Seq technology [
36]. We found that the
ZmNAC89 gene significantly increased expression levels under stress conditions. In this study, bioinformatics analysis, gene expression pattern analysis under stress treatment, genetic transformation and RNA-seq were used to achieve the following goals: (1) identify the basic characteristics of
ZmNAC89 gene, (2) identify the expression of
ZmNAC89 gene in other abiotic stresses, (3) identify the best haplotype, as well as predict and identify the extremely saline–alkali-tolerant maize inbred lines for future breeding applications and (4) provide an initial understanding of the response mechanism of maize to saline–alkali stress in the breeding process.
2. Results
2.1. Phylogenetic Analysis of the ZmNAC89 Gene
The
ZmNAC89 gene (Gene ID:
GRMZM2G430849, XM_008653325.1) is localized in the bin 7.05 region based on B73 RefGen_v2 genome-wide data. Sequence analysis indicated that full-length
ZmNAC89 is 2280 bp and that it possesses a common PolyA tail signal (AATAAA) +158 bp~+164 bp after the stop codon TAG (
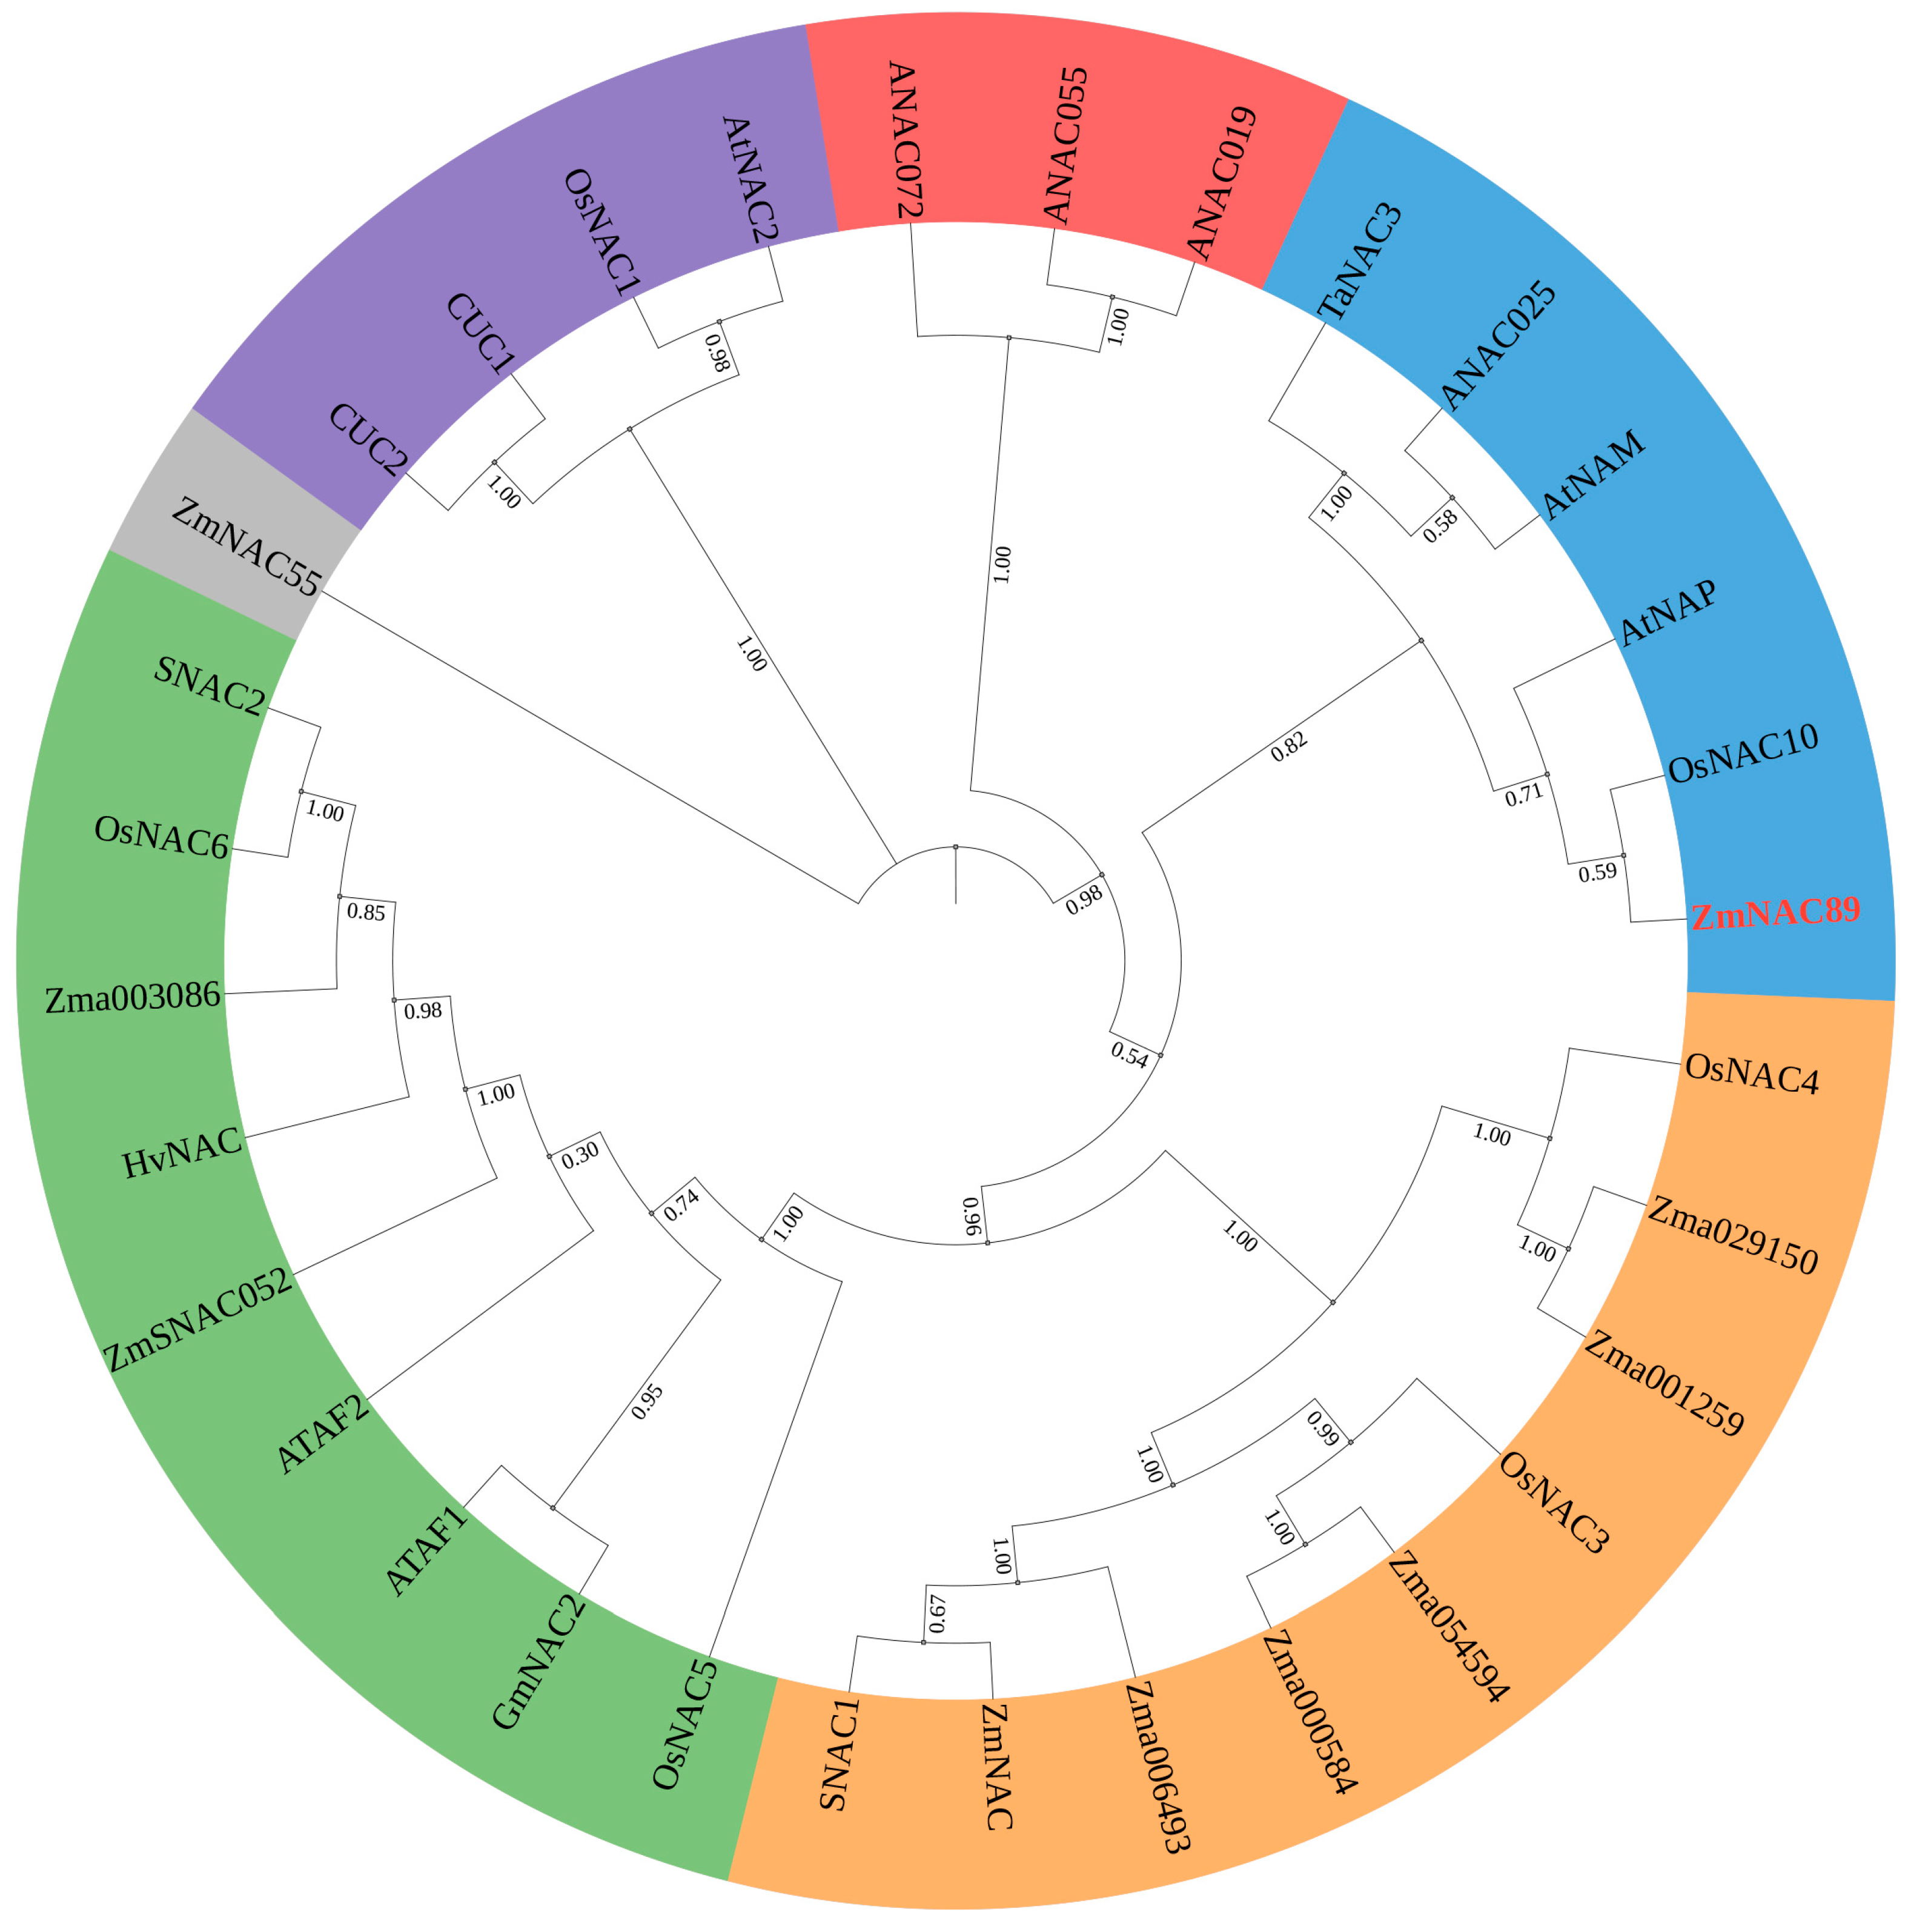
Figure S1). We identified 31 orthologs of ZmNAC89 in different species from
Arabidopsis, rice, wheat and soybean and constructed the phylogenetic tree of ZmNAC89 orthologs. The ZmNAC89 protein is 76% similar to the AtNAP protein associated with salt stress in
Arabidopsis thaliana. It is in the same clade as the OsNAC10 protein related to salt stress in rice and the TaNAC3 protein related to drought resistance in wheat (
Figure 1 and
Table S1). Meanwhile, the
ZmNAC89 promoter has core elements, such as CAAT-box and TATA-box, as well as biotic and abiotic stress-related elements (
Figure S2). Therefore, the promoter could be a stress-inducible promoter.
2.2. Transactivation Activity Analysis of ZmNAC89
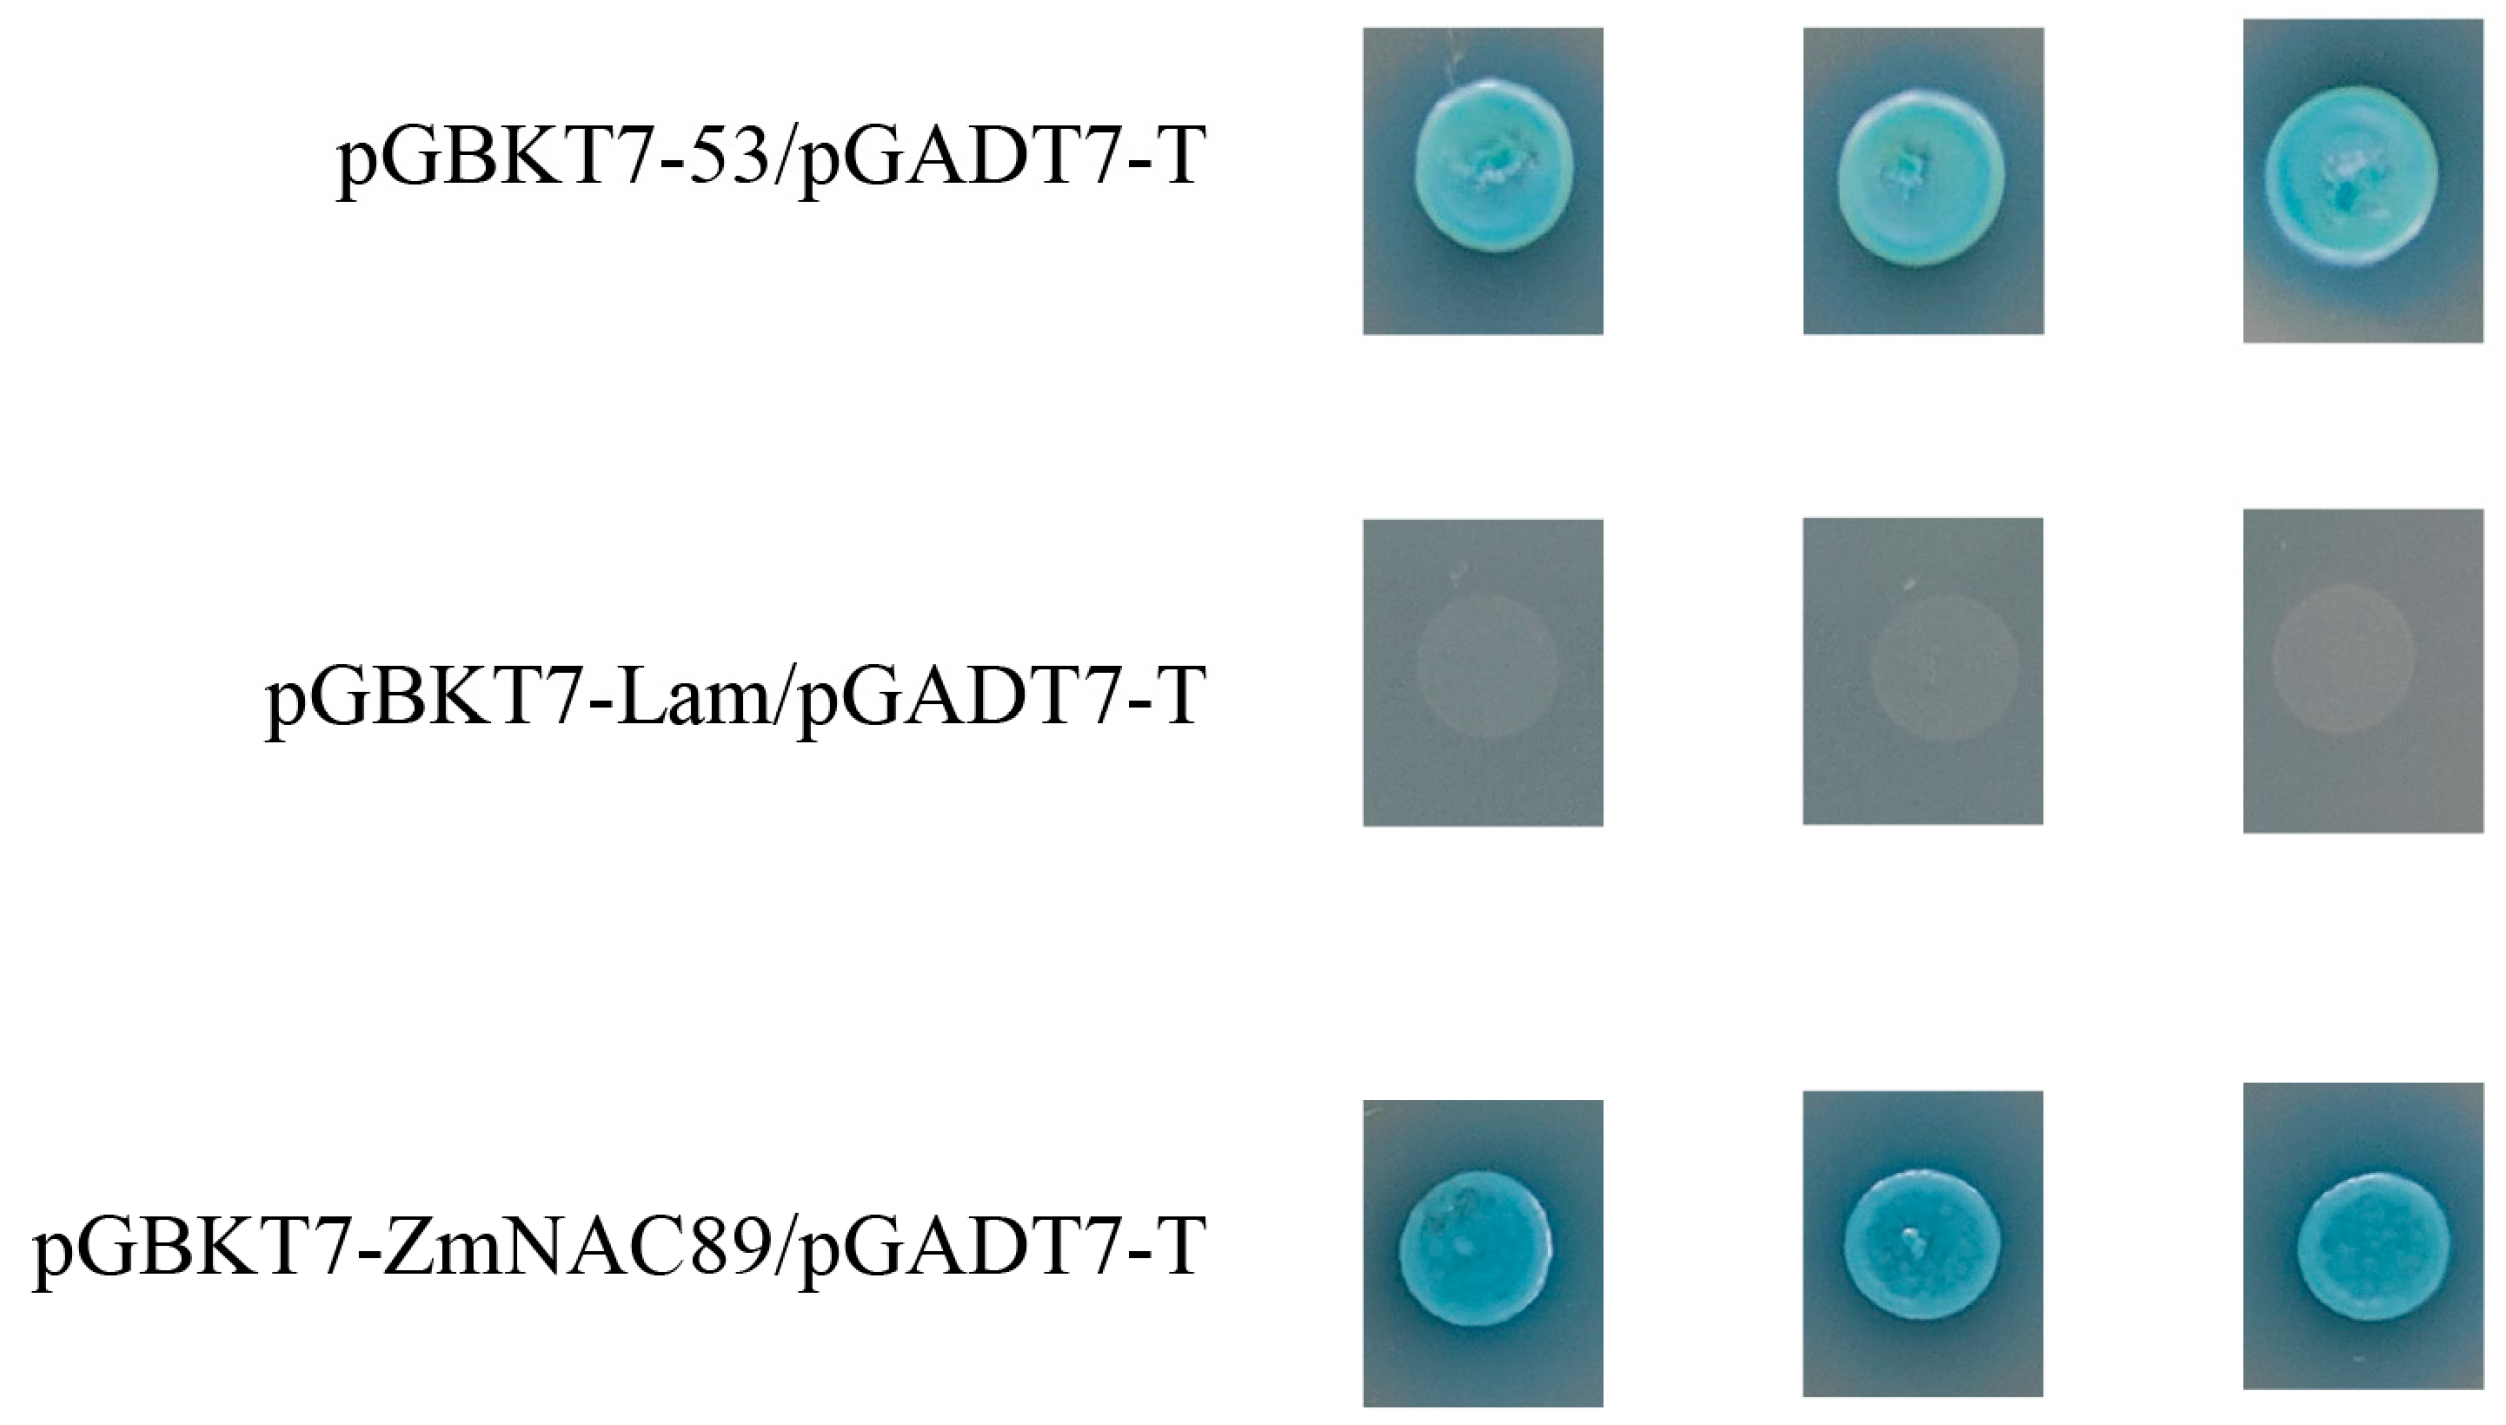
In order to verify whether
ZmNAC89 has transcriptional activation activity, bait plasmid pGBKT7-
ZmNAC89/pGADT7-T, positive control plasmid pGBKT7-53/pGADT7-T and negative control plasmid pGBKT7-Lam/pGADT7-T were, respectively, co-transformed into Y2HGlod yeast cells, and the growth status and color change in colonies were observed on the selection medium to judge whether the bait plasmid has transcriptional activity. Blue spot colonies appeared in bait plasmid pGBKT7-
ZmNAC89/pGADT7-T and positive control plasmid pGBKT7-53/pGADT7-T, indicating that the
ZmNAC89 transcription factor has transcriptional activation activity (
Figure 2).
2.3. Subcellular Localization of the ZmNAC89 Protein
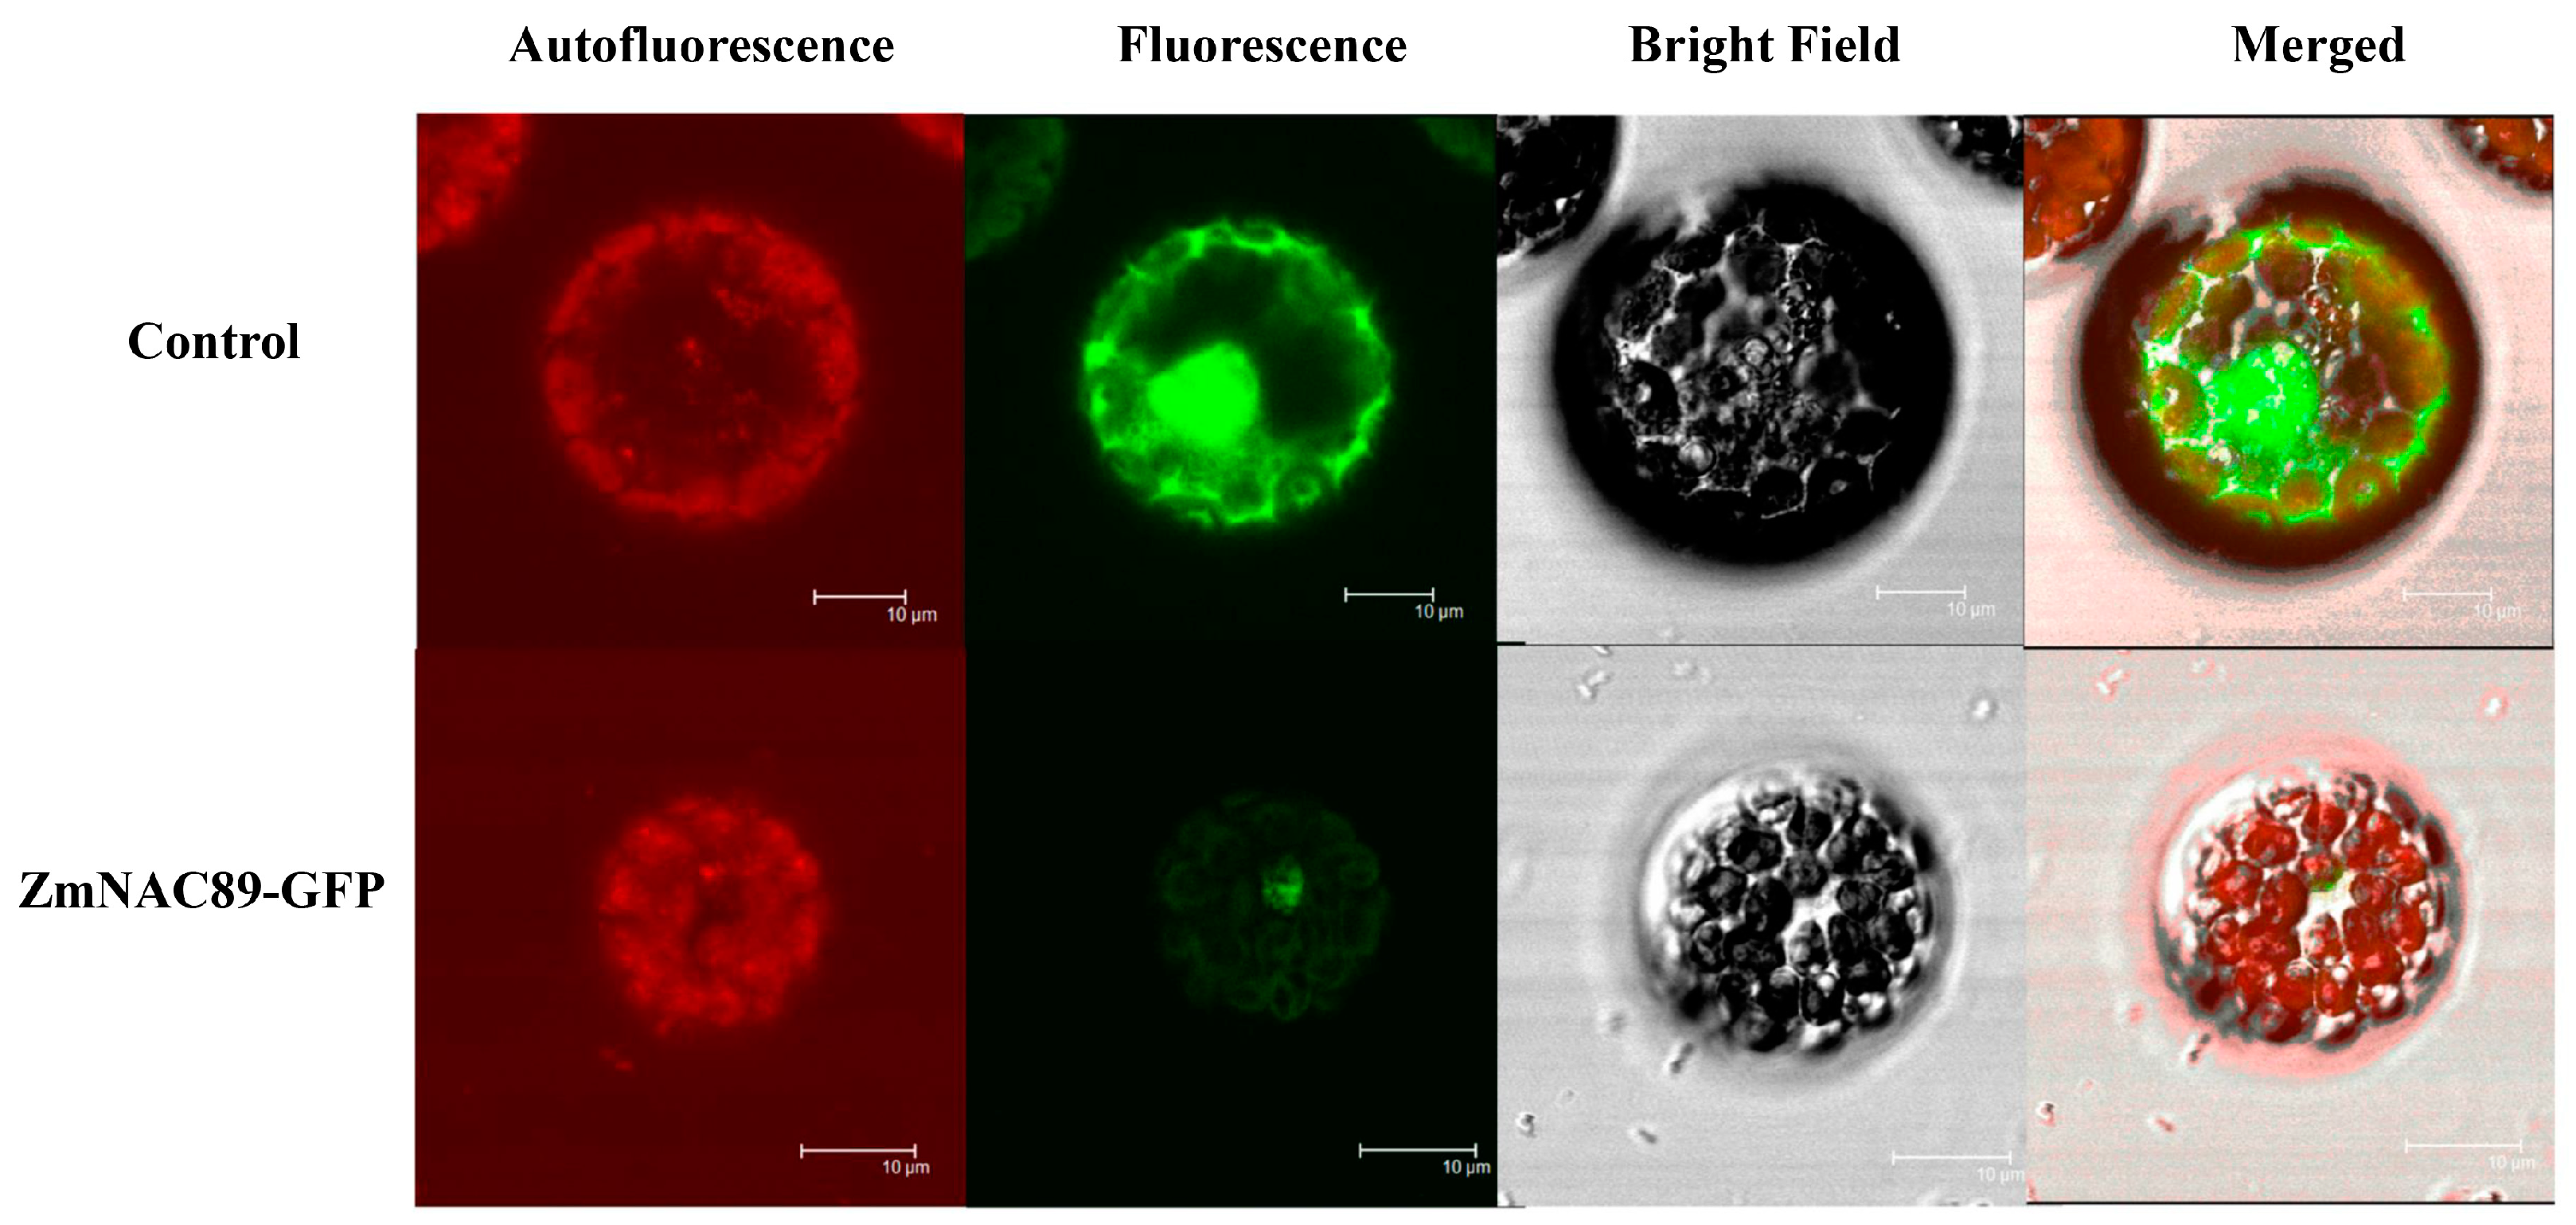
To identify the subcellular localization of the ZmNAC89 protein, we transformed the recombinant plasmid into the protoplast of Arabidopsis thaliana and observed the fluorescence signal by using laser confocal microscopy. The green fluorescence signal of the control sample transformed into the empty vector was present in the nucleus and the cytoplasmic region of the protoplast. However, the green fluorescence signal of the ZmNAC89-GFP fusion protein was located in the nucleus of the protoplast. This suggested that the ZmNAC89 protein is localized on the nucleus (
Figure 3).
2.4. Inducible Expression of ZmNAC89 in Response to Various Abiotic Stresses
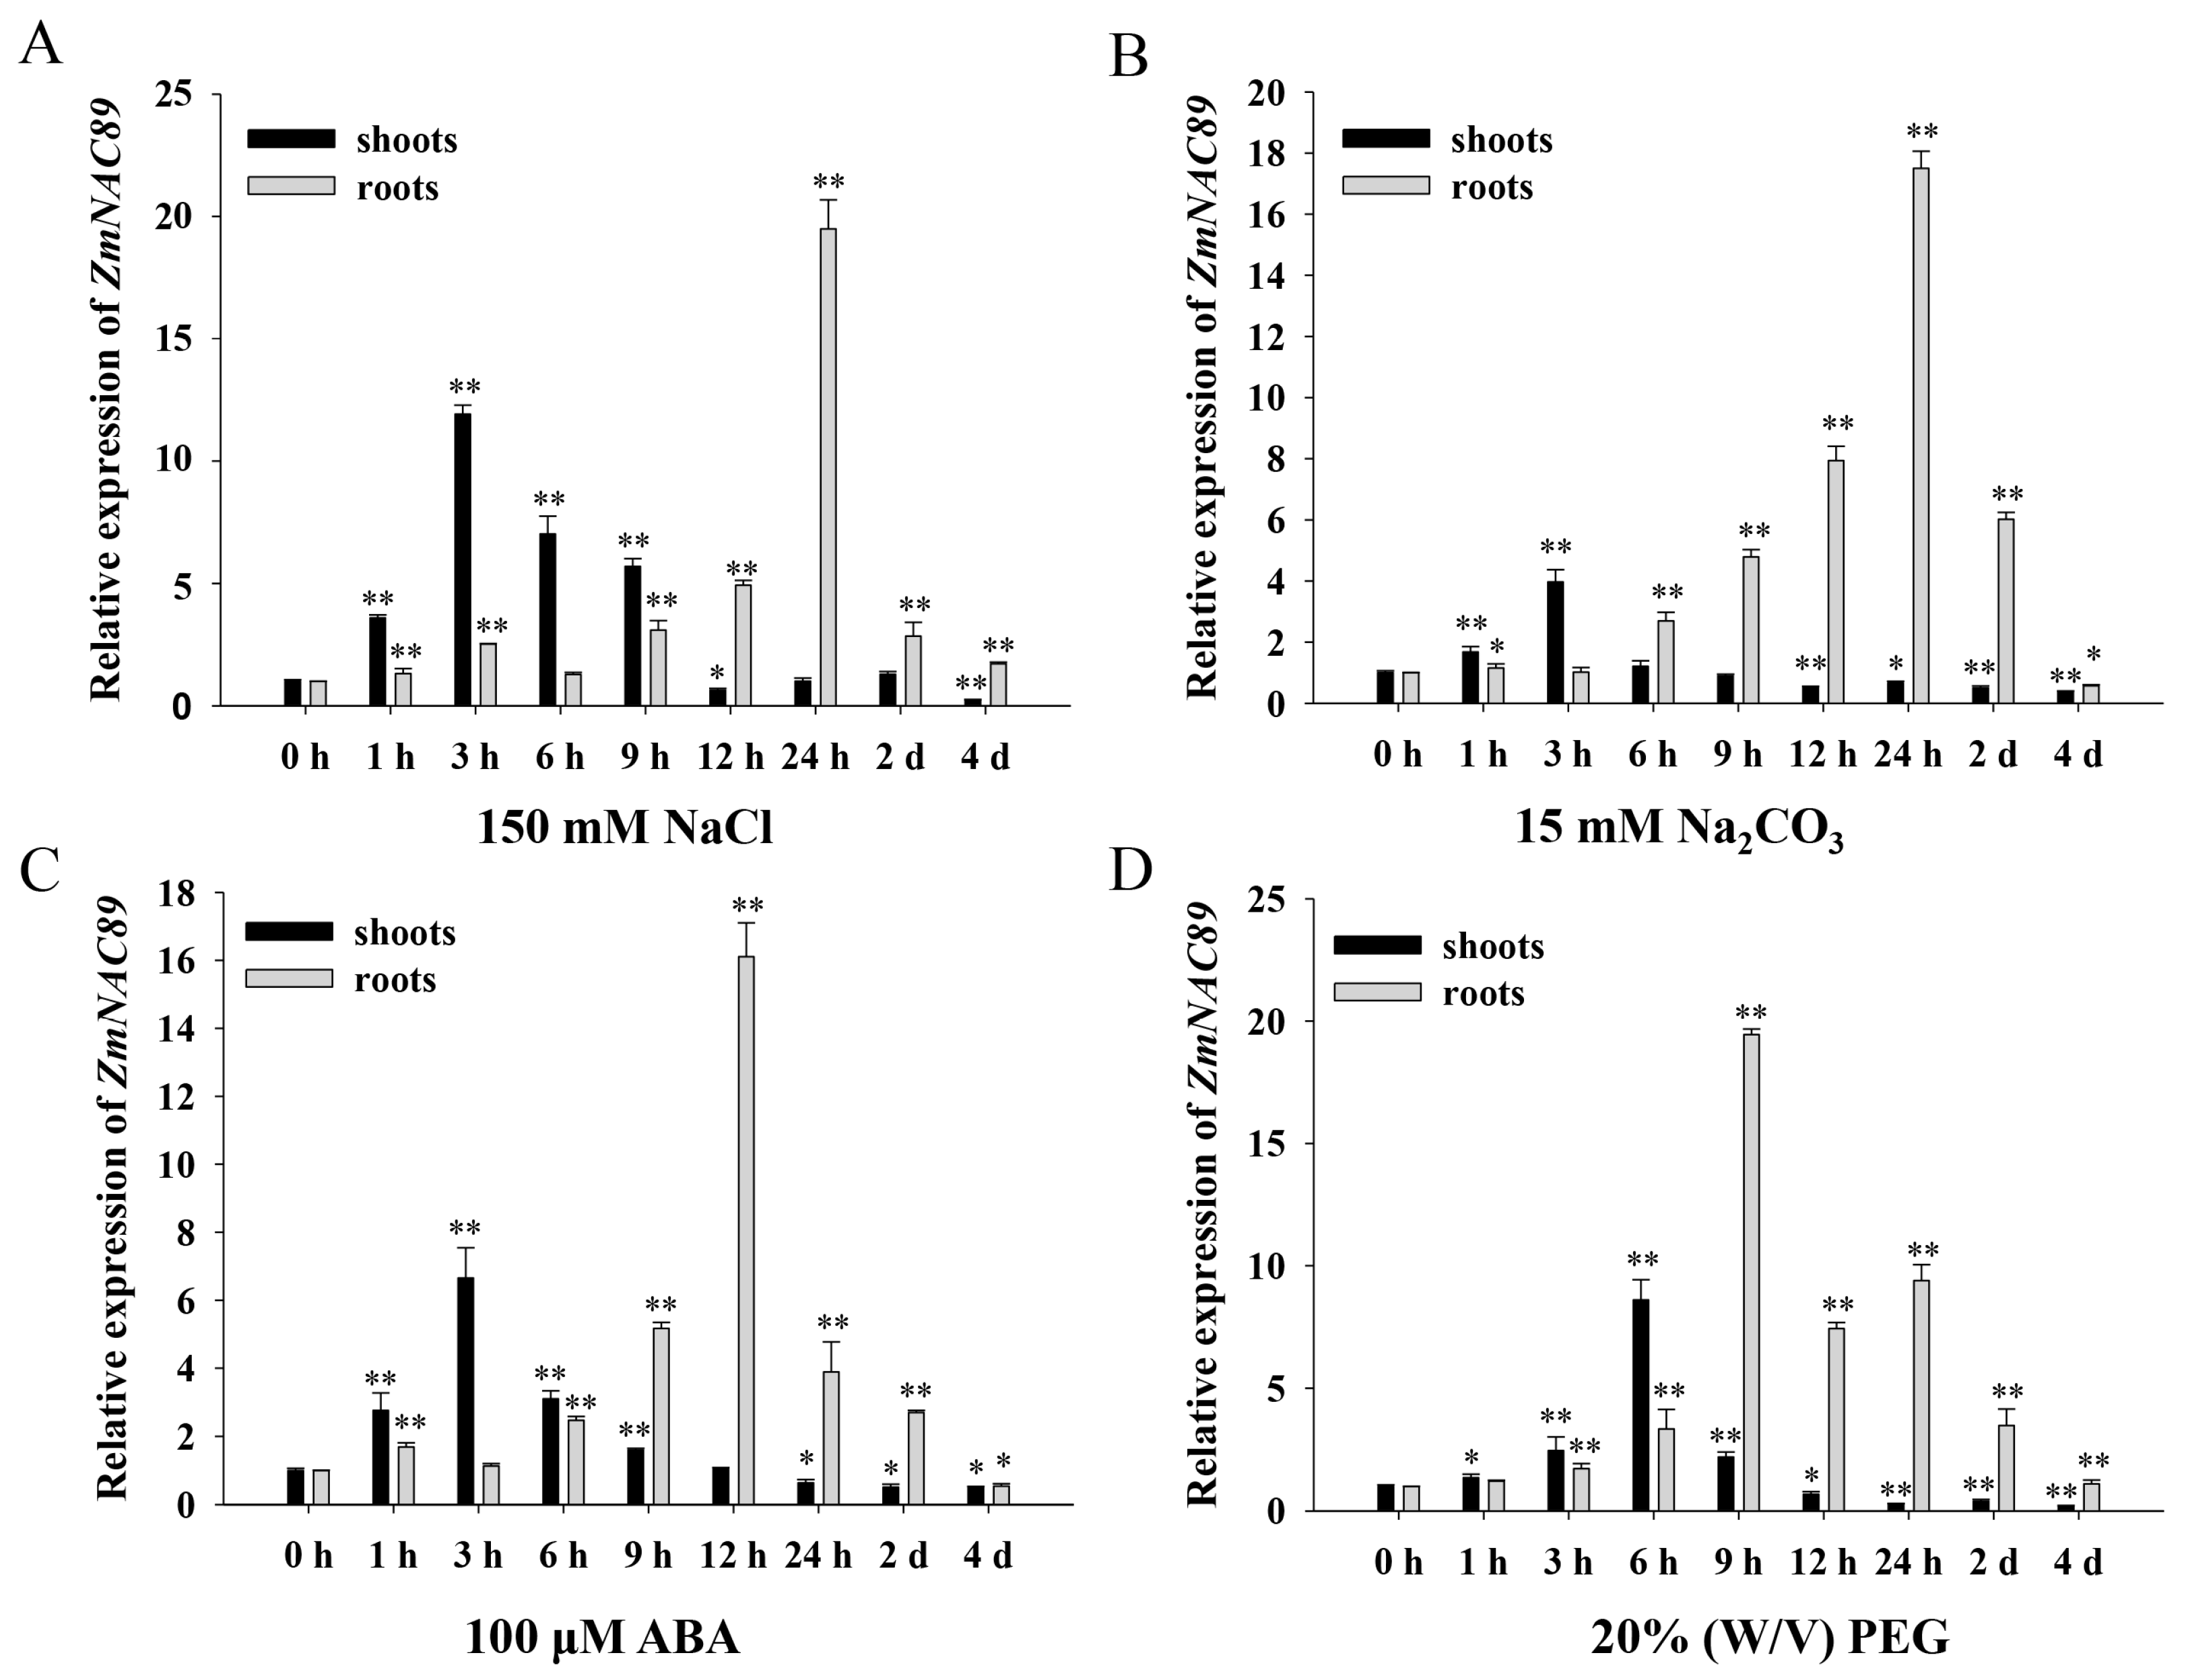
To examine the function of
ZmNAC89, we analyzed the expression pattern of the
ZmNAC89 gene in ‘K10′ inbred lines under salt, alkalinity, ABA and drought stress conditions. The
ZmNAC89 transcript level was induced through treatment with NaCl, Na
2CO
3, ABA and PEG in the roots and leaves. Under NaCl and Na
2CO
3 treatments, the expression of
ZmNAC89 achieved a maximum level at 3 and 24 h in the leaves and roots, respectively (
Figure 4A,B). Under ABA treatment, the transcript level of
ZmNAC89 reached a peak at 3 and 12 h in the leaves and roots, respectively (
Figure 4C). Under PEG treatment, peaks appeared at 6 h and 9 h in the leaves and roots, respectively (
Figure 4D). These results indicated that
ZmNAC89 responds to various abiotic stresses and could have a prominent function in salt and alkalinity adversities.
2.5. ZmNAC89 Gene Overexpression Increased Arabidopsis and Maize Resistance to Alkalinity and Salt
ZmNAC89 expression levels are related to maize salt–alkaline tolerance. Therefore, we produced transgenic maize and Arabidopsis, both of which overexpressed the ZmNAC89 coding sequence (from the K10 genotype). The ZmNAC89 cDNA clone sequence was sent to GenBank (Accession No. MK125509.1).
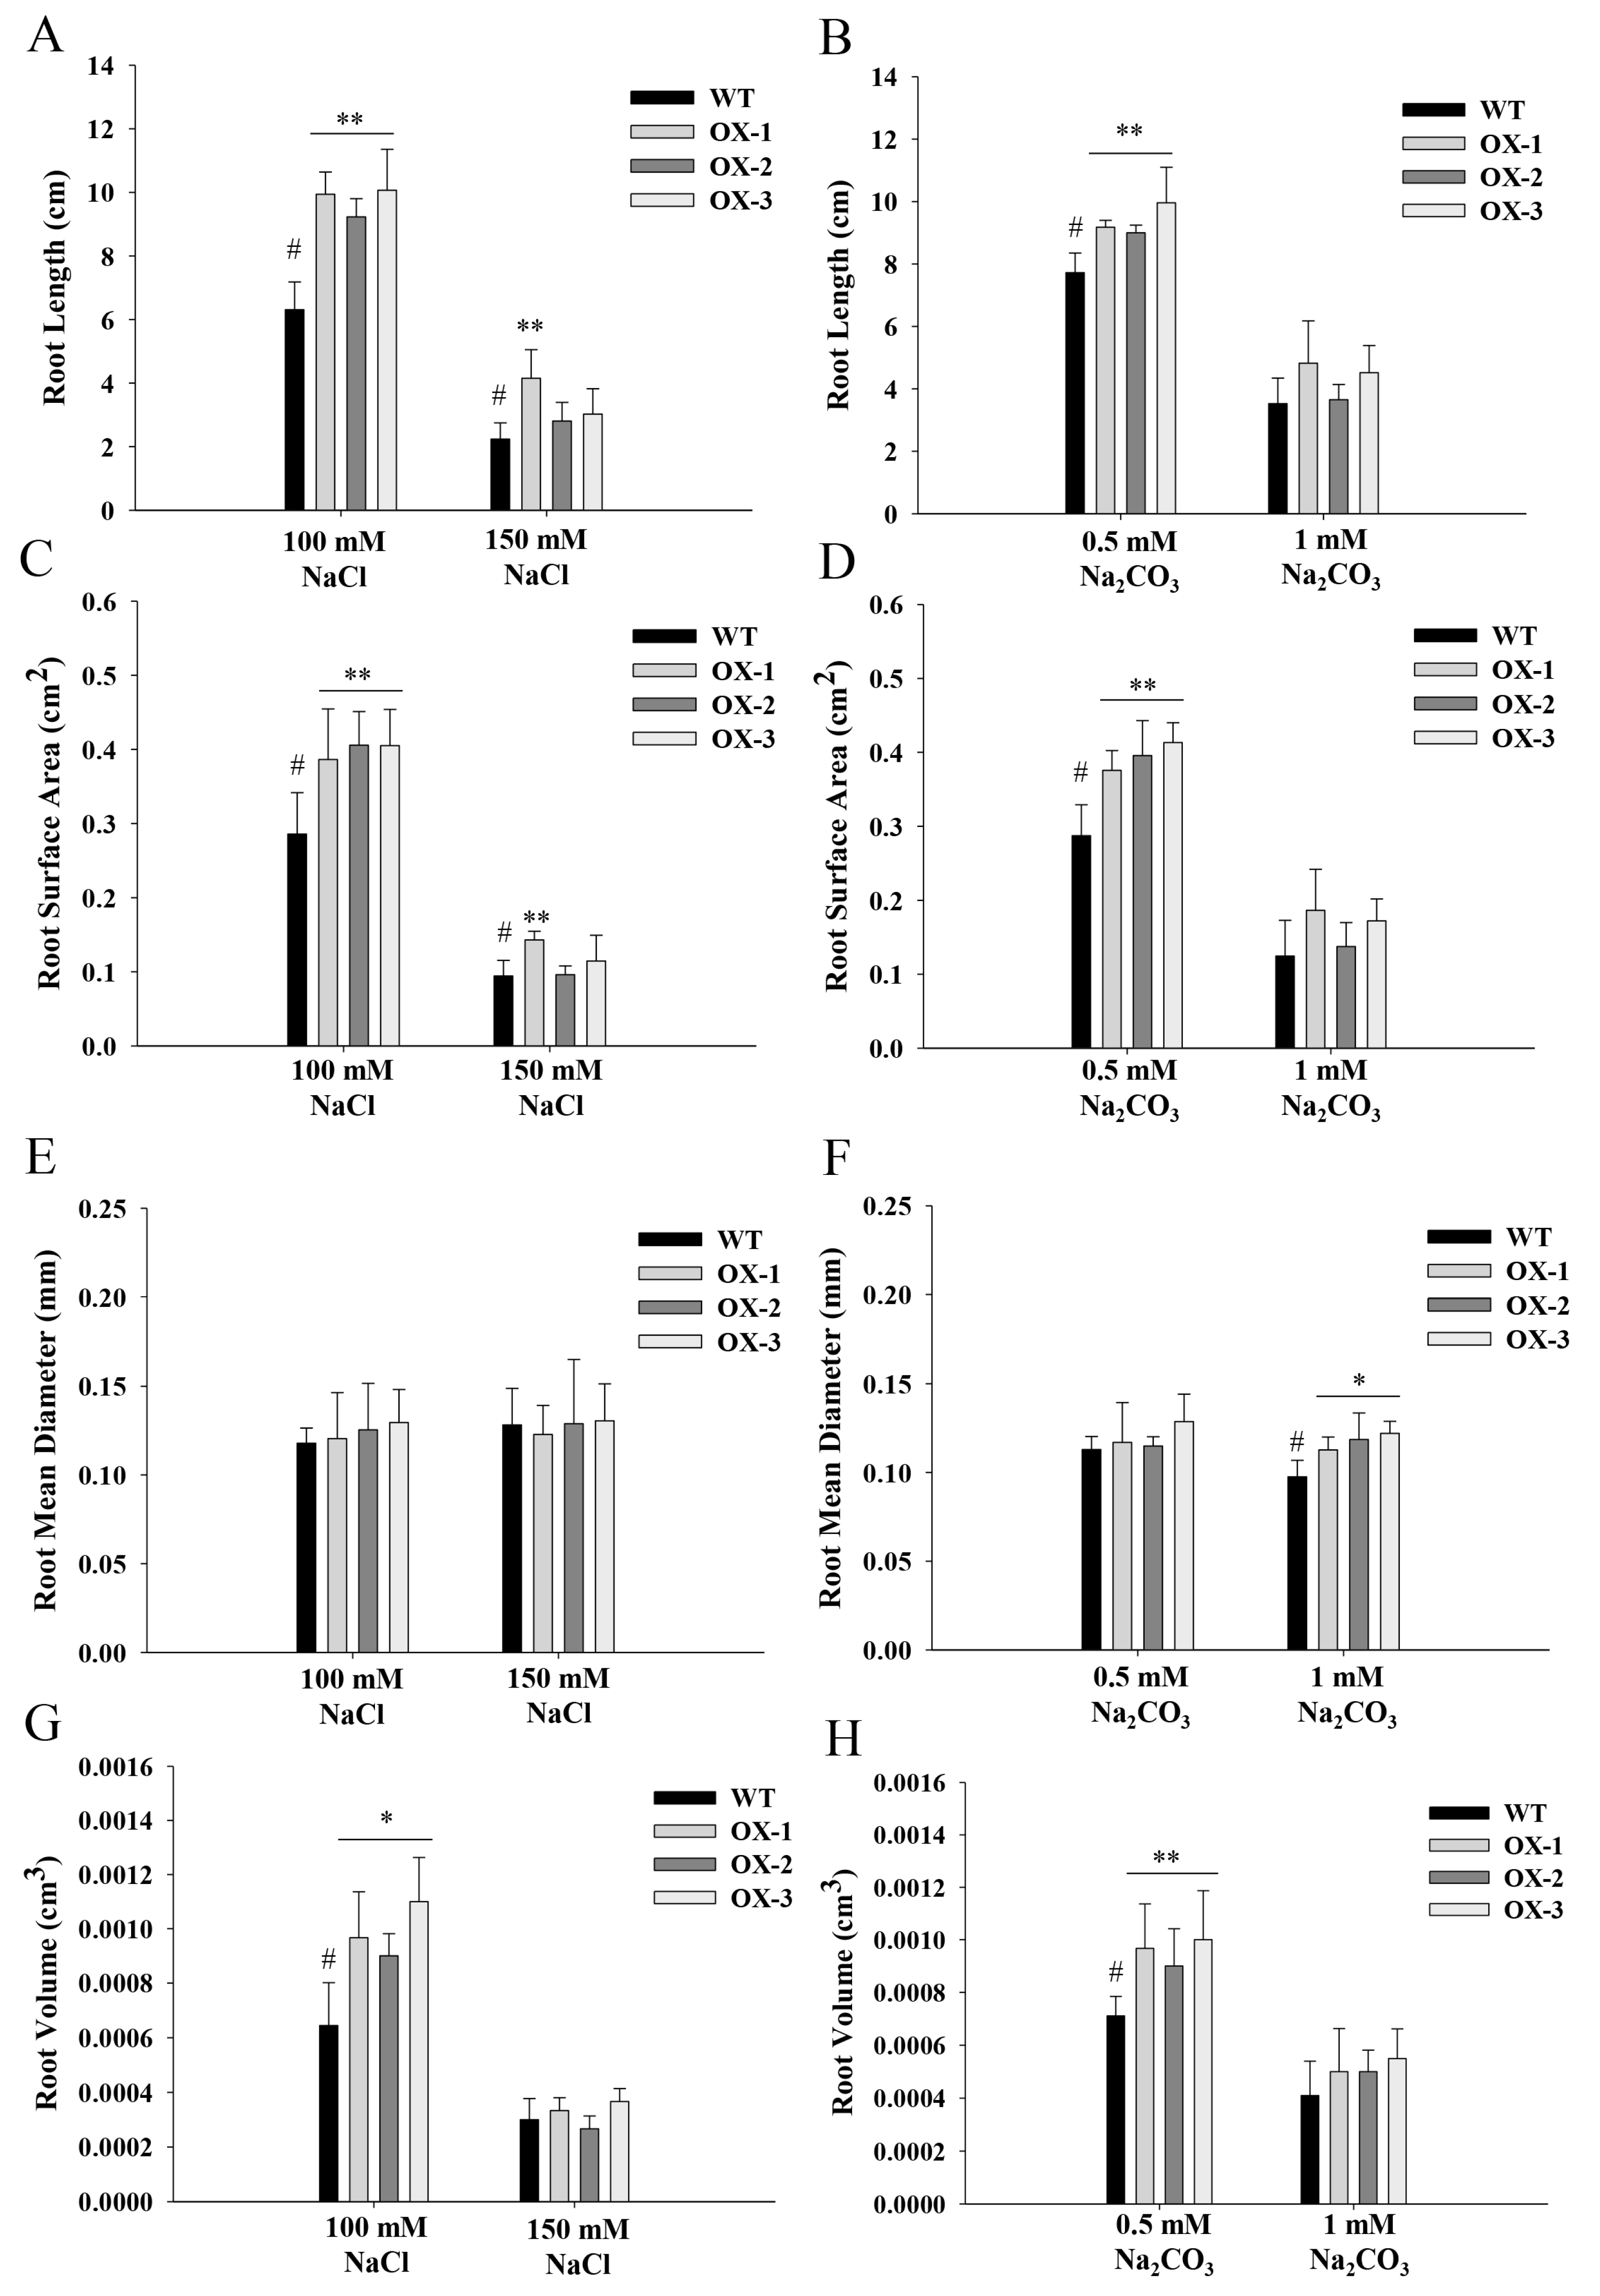
The phenotypes of
ZmNAC89 lines during germination were analyzed for transgenic
Arabidopsis. Under 100 mM NaCl stress, the root length, root surface area and root volume of the transgenic lines were significantly greater than the wild type (6.31 cm, 0.29 cm
2 and 0.00064 cm
3, respectively), with an average of 9.74 cm, 0.4 cm
2 and 0.00099 cm
3 (
Figure 5A,C,G). After 150 mM NaCl treatment, the root length and root surface area were significantly greater in the transgenic lines than in the wild type (2.24 cm and 0.09 cm
2, respectively), with an average of 3.33 cm and 0.12 cm
2 (
Figure 5A,C). Under 0.5 mM NaHCO
3 stress treatment, the root length, root surface area and root volume of the transgenic lines were significantly higher than in the wild type (7.72 cm, 0.29 cm
2 and 0.00071 cm
3, respectively), with an average of 9.38 cm, 0.39 cm
2 and 0.00095 cm
3, respectively (
Figure 5B,D,H). After 1 mM NaHCO
3 stress treatment, the root mean diameter was significantly higher in the transgenic lines than in the wild type (0.098 mm), with an average of 0.12 mm (
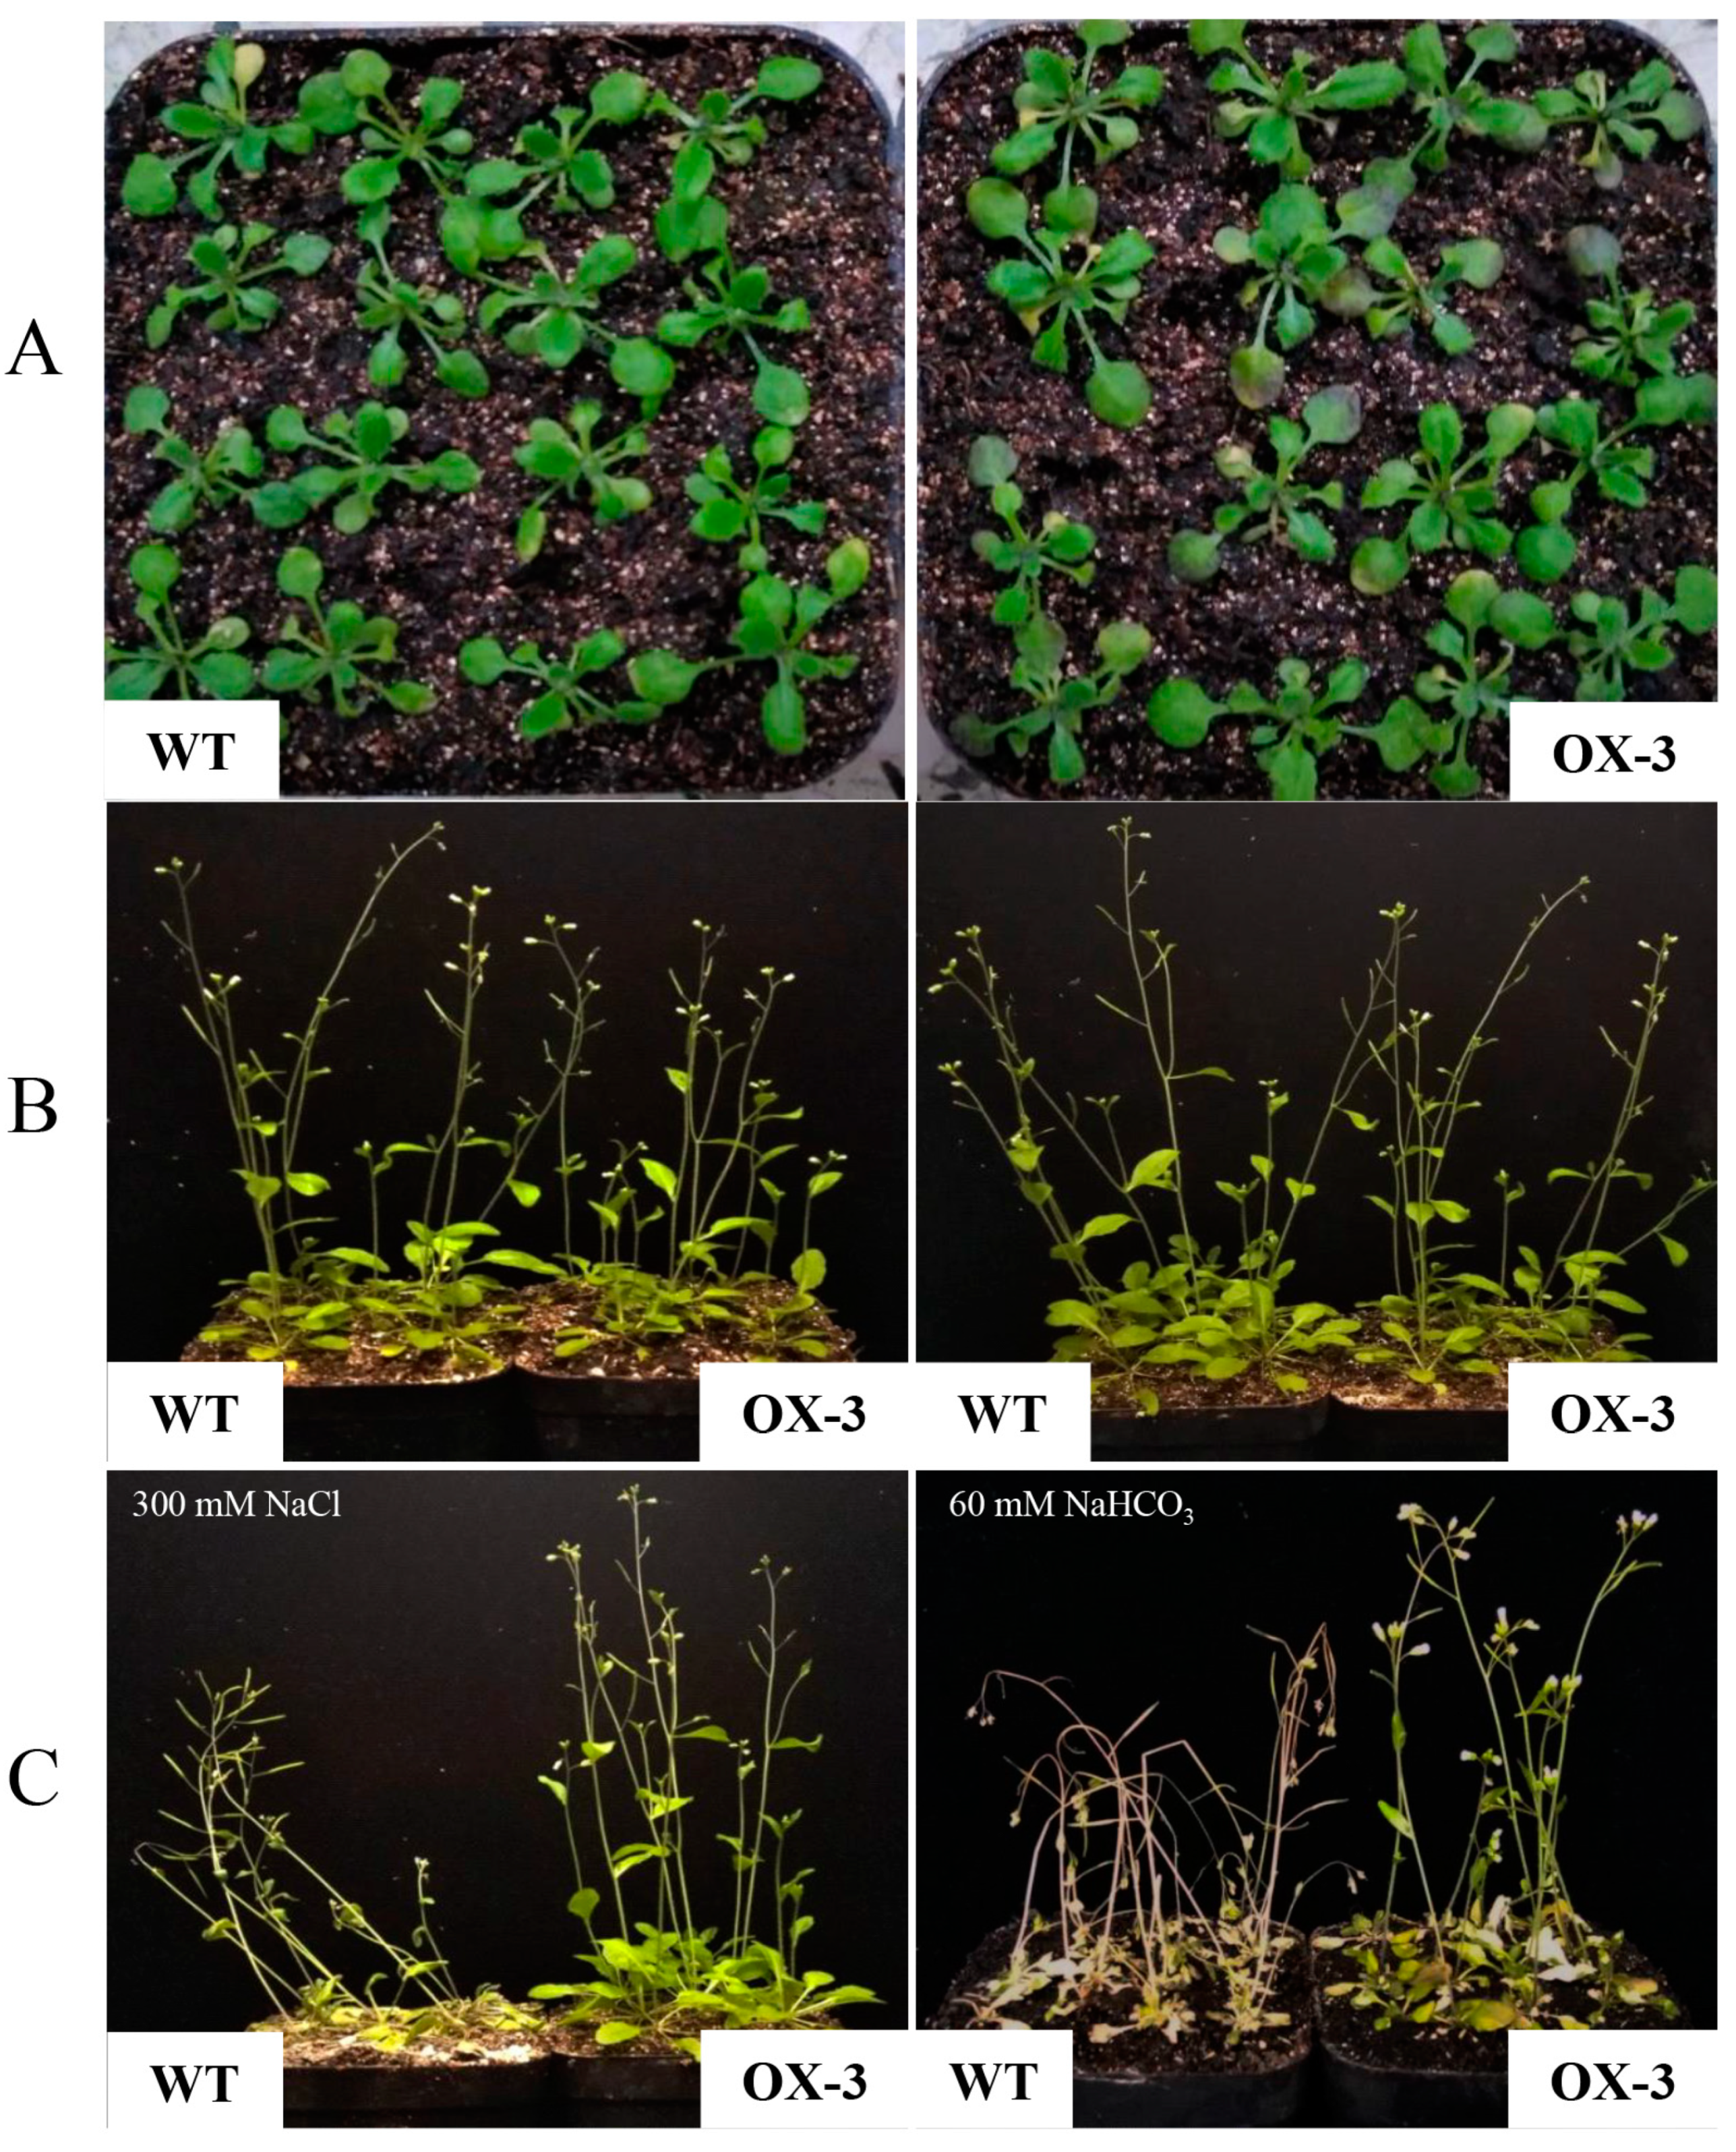
Figure 5F). To further test the function of
ZmNAC89 in salt and alkalinity tolerance, we observed the phenotypes of the transgenic
Arabidopsis in the mature stage. After salt and alkali treatments, the transgenic lines still maintained solid growth and produced yellow-green leaves, erect stems and normal flowering and fruit. However, the wild type showed wilting, white leaves, curved stems and fewer flowers (
Figure 6).
The stress resistance of
ZmNAC89 transgenic lines could be reflected by measuring physiological indexes related to stress, such as relative conductivity, chlorophyll and proline. Under 300 mM NaCl stress or 60 mM NaHCO
3 stress, the six transgenic lines had a relative conductivity that was significantly lower than wild-type
Arabidopsis. In contrast, the proline and chlorophyll contents were significantly higher in all six transgenic lines than in the wild type (
Table 1 and
Table 2). These results suggested that overexpression of the
ZmNAC89 gene can significantly improve the salt and alkalinity tolerance of
Arabidopsis thaliana.
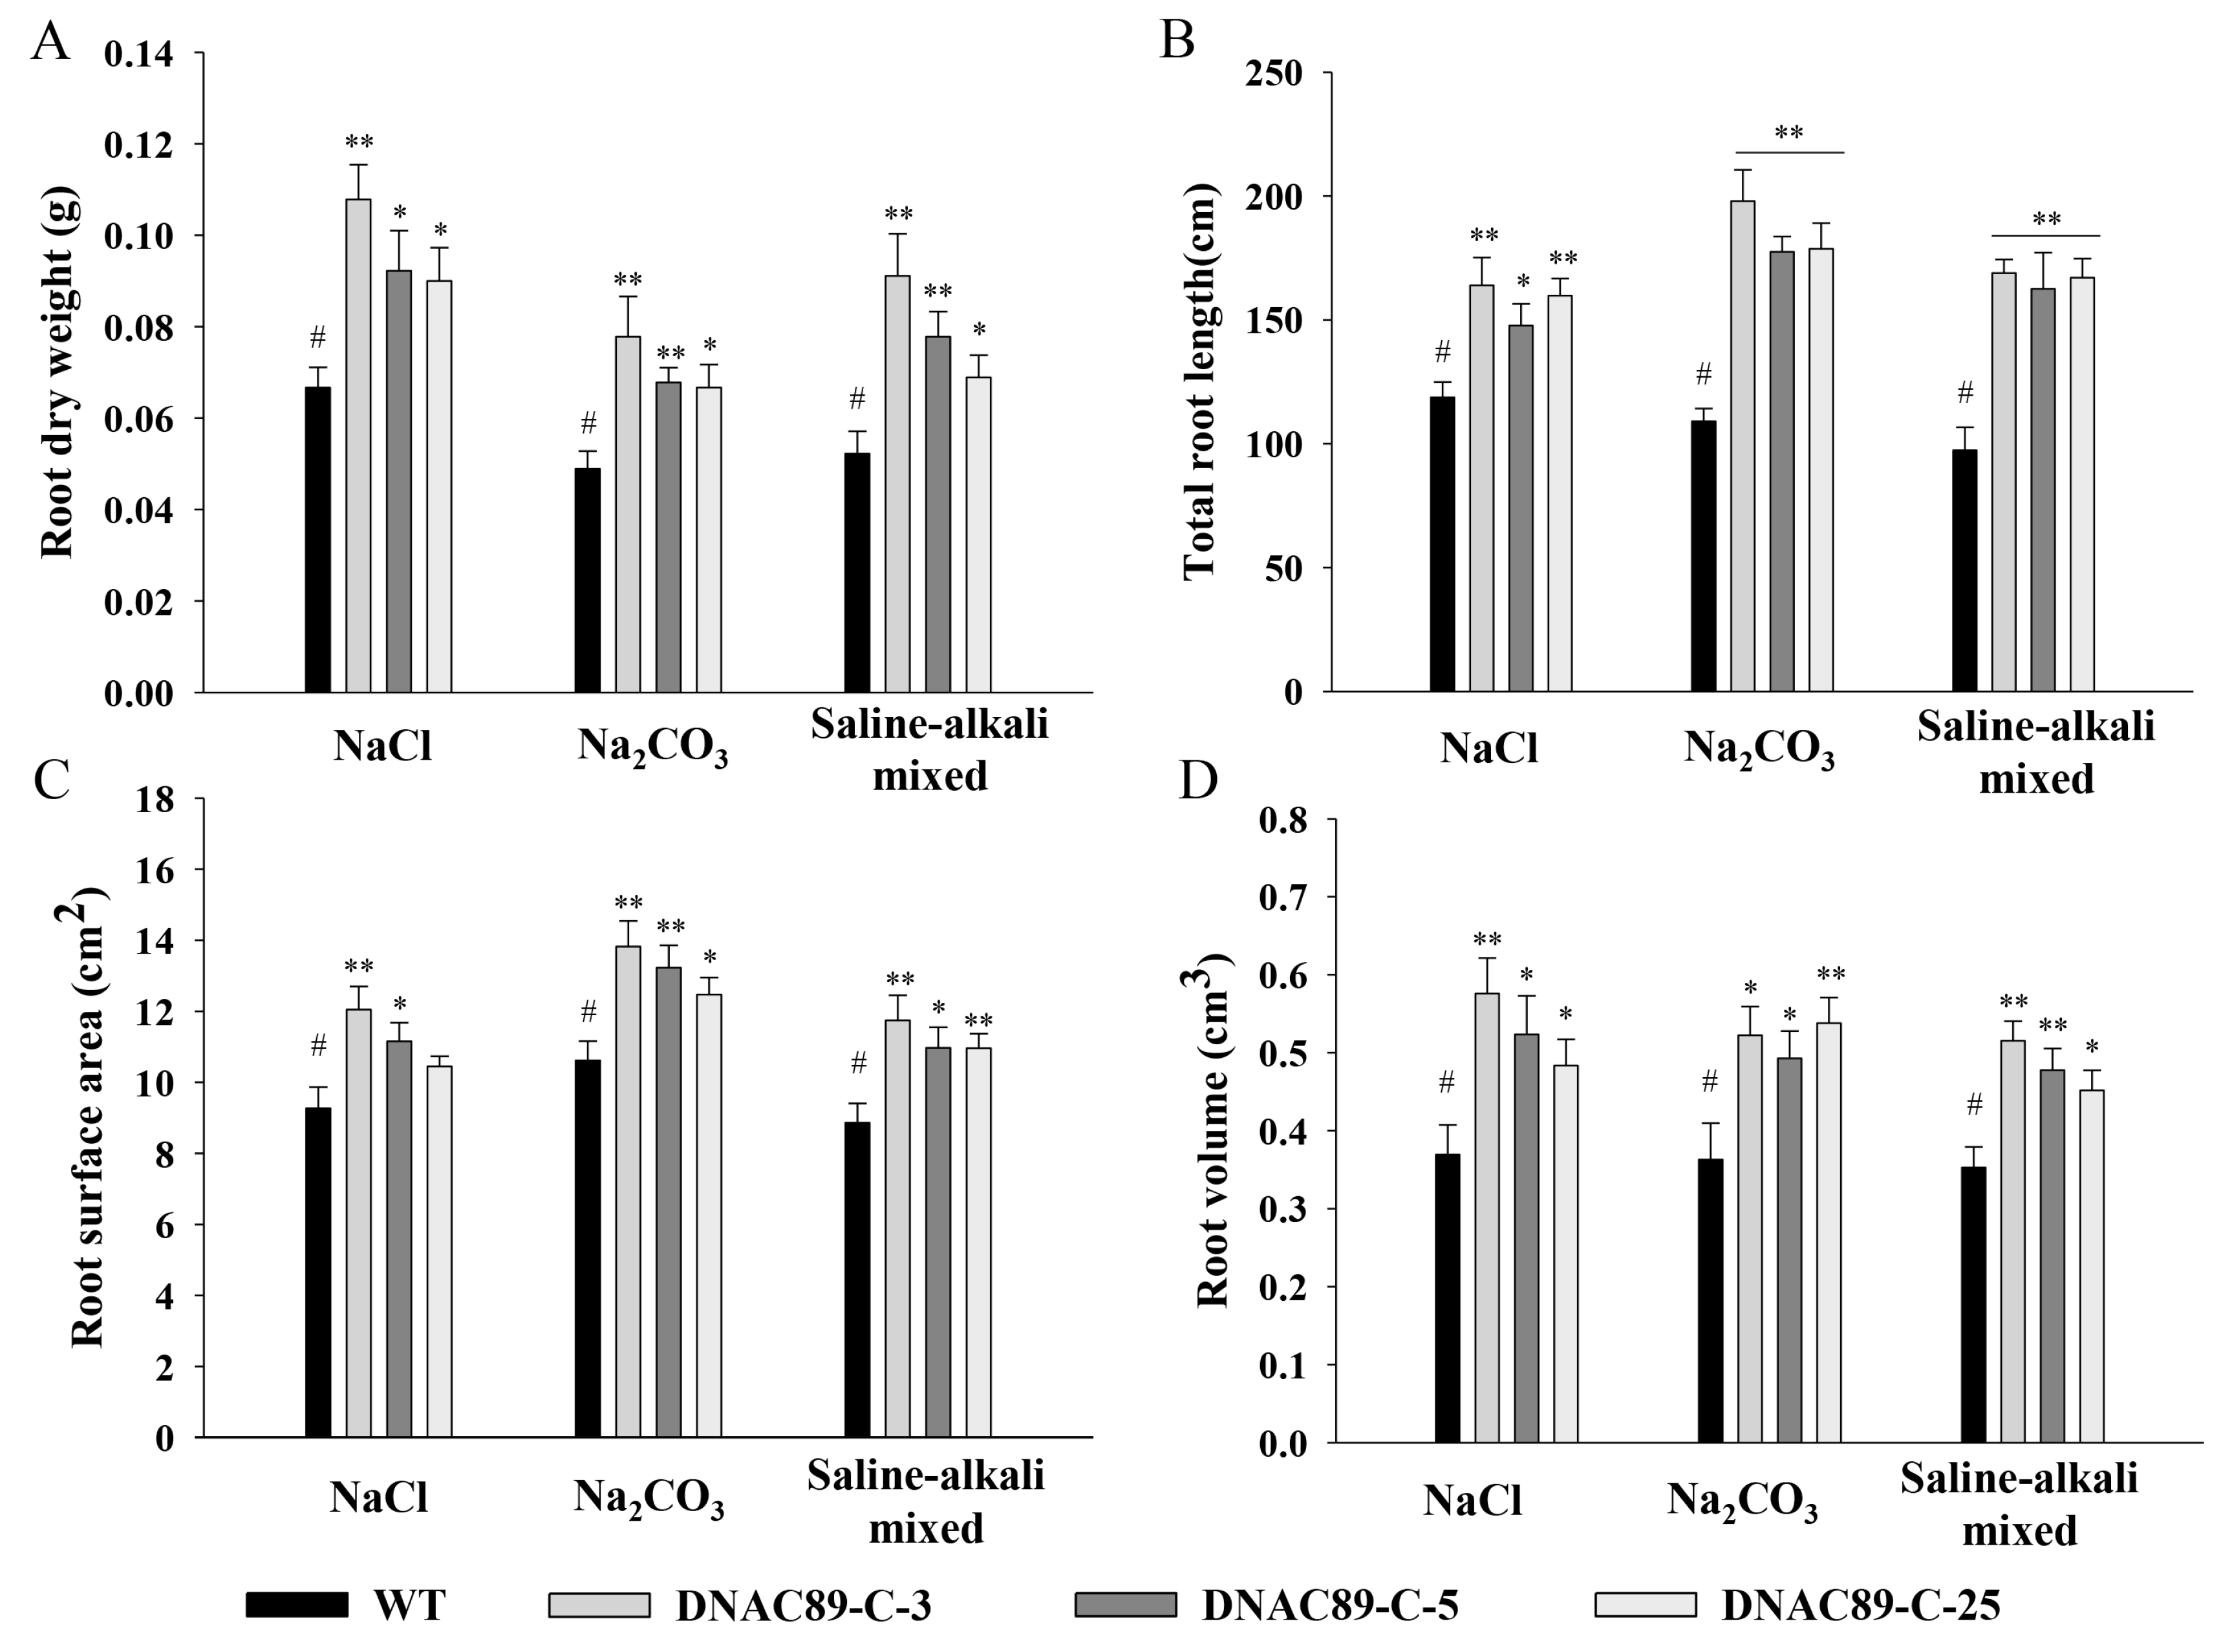
Improvements in alkalinity and salt tolerance were also observed in transgenic maize when the
ZmNAC89 gene was overexpressed. The germination-stage maize was treated with salt, alkali and saline–alkali mixed stresses, after which multiple comparisons of germination potential, germination rate, root length, shoot length, fresh weight and dry weight of each line were performed through Duncan analysis using SPSS20.0 software. Under different stress treatments, the index characteristics of each transgenic line showed that the germination potential, germination rate, root length, shoot length, fresh weight and dry weight of the transgenic lines DNAC89-C-3, DNAC89-C-5 and DNAC89-C-25 performed better than other transgenic lines and were significantly higher than the control line C01 (
Table S2A–C). The seedling-stage maize was treated with salt, alkali and saline–alkali mixed stresses. Multiple comparisons of plant height, dry weight of the shoots and root dry weight were performed with Duncan analysis using SPSS20.0 software. The significance of differences between transgenic lines and C01 were analyzed using the LSD method. Under different stress treatments, the transgenic lines DNAC89-C-3, DNAC89-C-5 and DNAC89-C-25 were the most prominent in plant height, dry weight in the ground, root dry weight, total root length, root surface area and root volume (
Figure 7A–D). The measurement results of relative conductivity, chlorophyll and proline content demonstrated that transgenic lines improved salt–alkali resistance compared to the controls. The relative conductivity of 17 overexpressing lines decreased while chlorophyll and proline content increased. DNAC89-C-3, DNAC89-C-5 and DNAC89-C-25 had better salt–alkali resistance than the other transgenic lines (
Table S3A–C).
2.6. RNA-Seq Analysis and Prediction of Interacting Proteins
To better understand the molecular mechanism of the
ZmNAC89 gene responsible for regulating salt–alkali resistance, we compared transcriptomic data from the WT and transgenic
ZmNAC89 maize lines under Na
2CO
3 and NaCl conditions. edgeR software (3.42.4) was used to analyze the DEGs (|log2foldchange| ≥ 1,
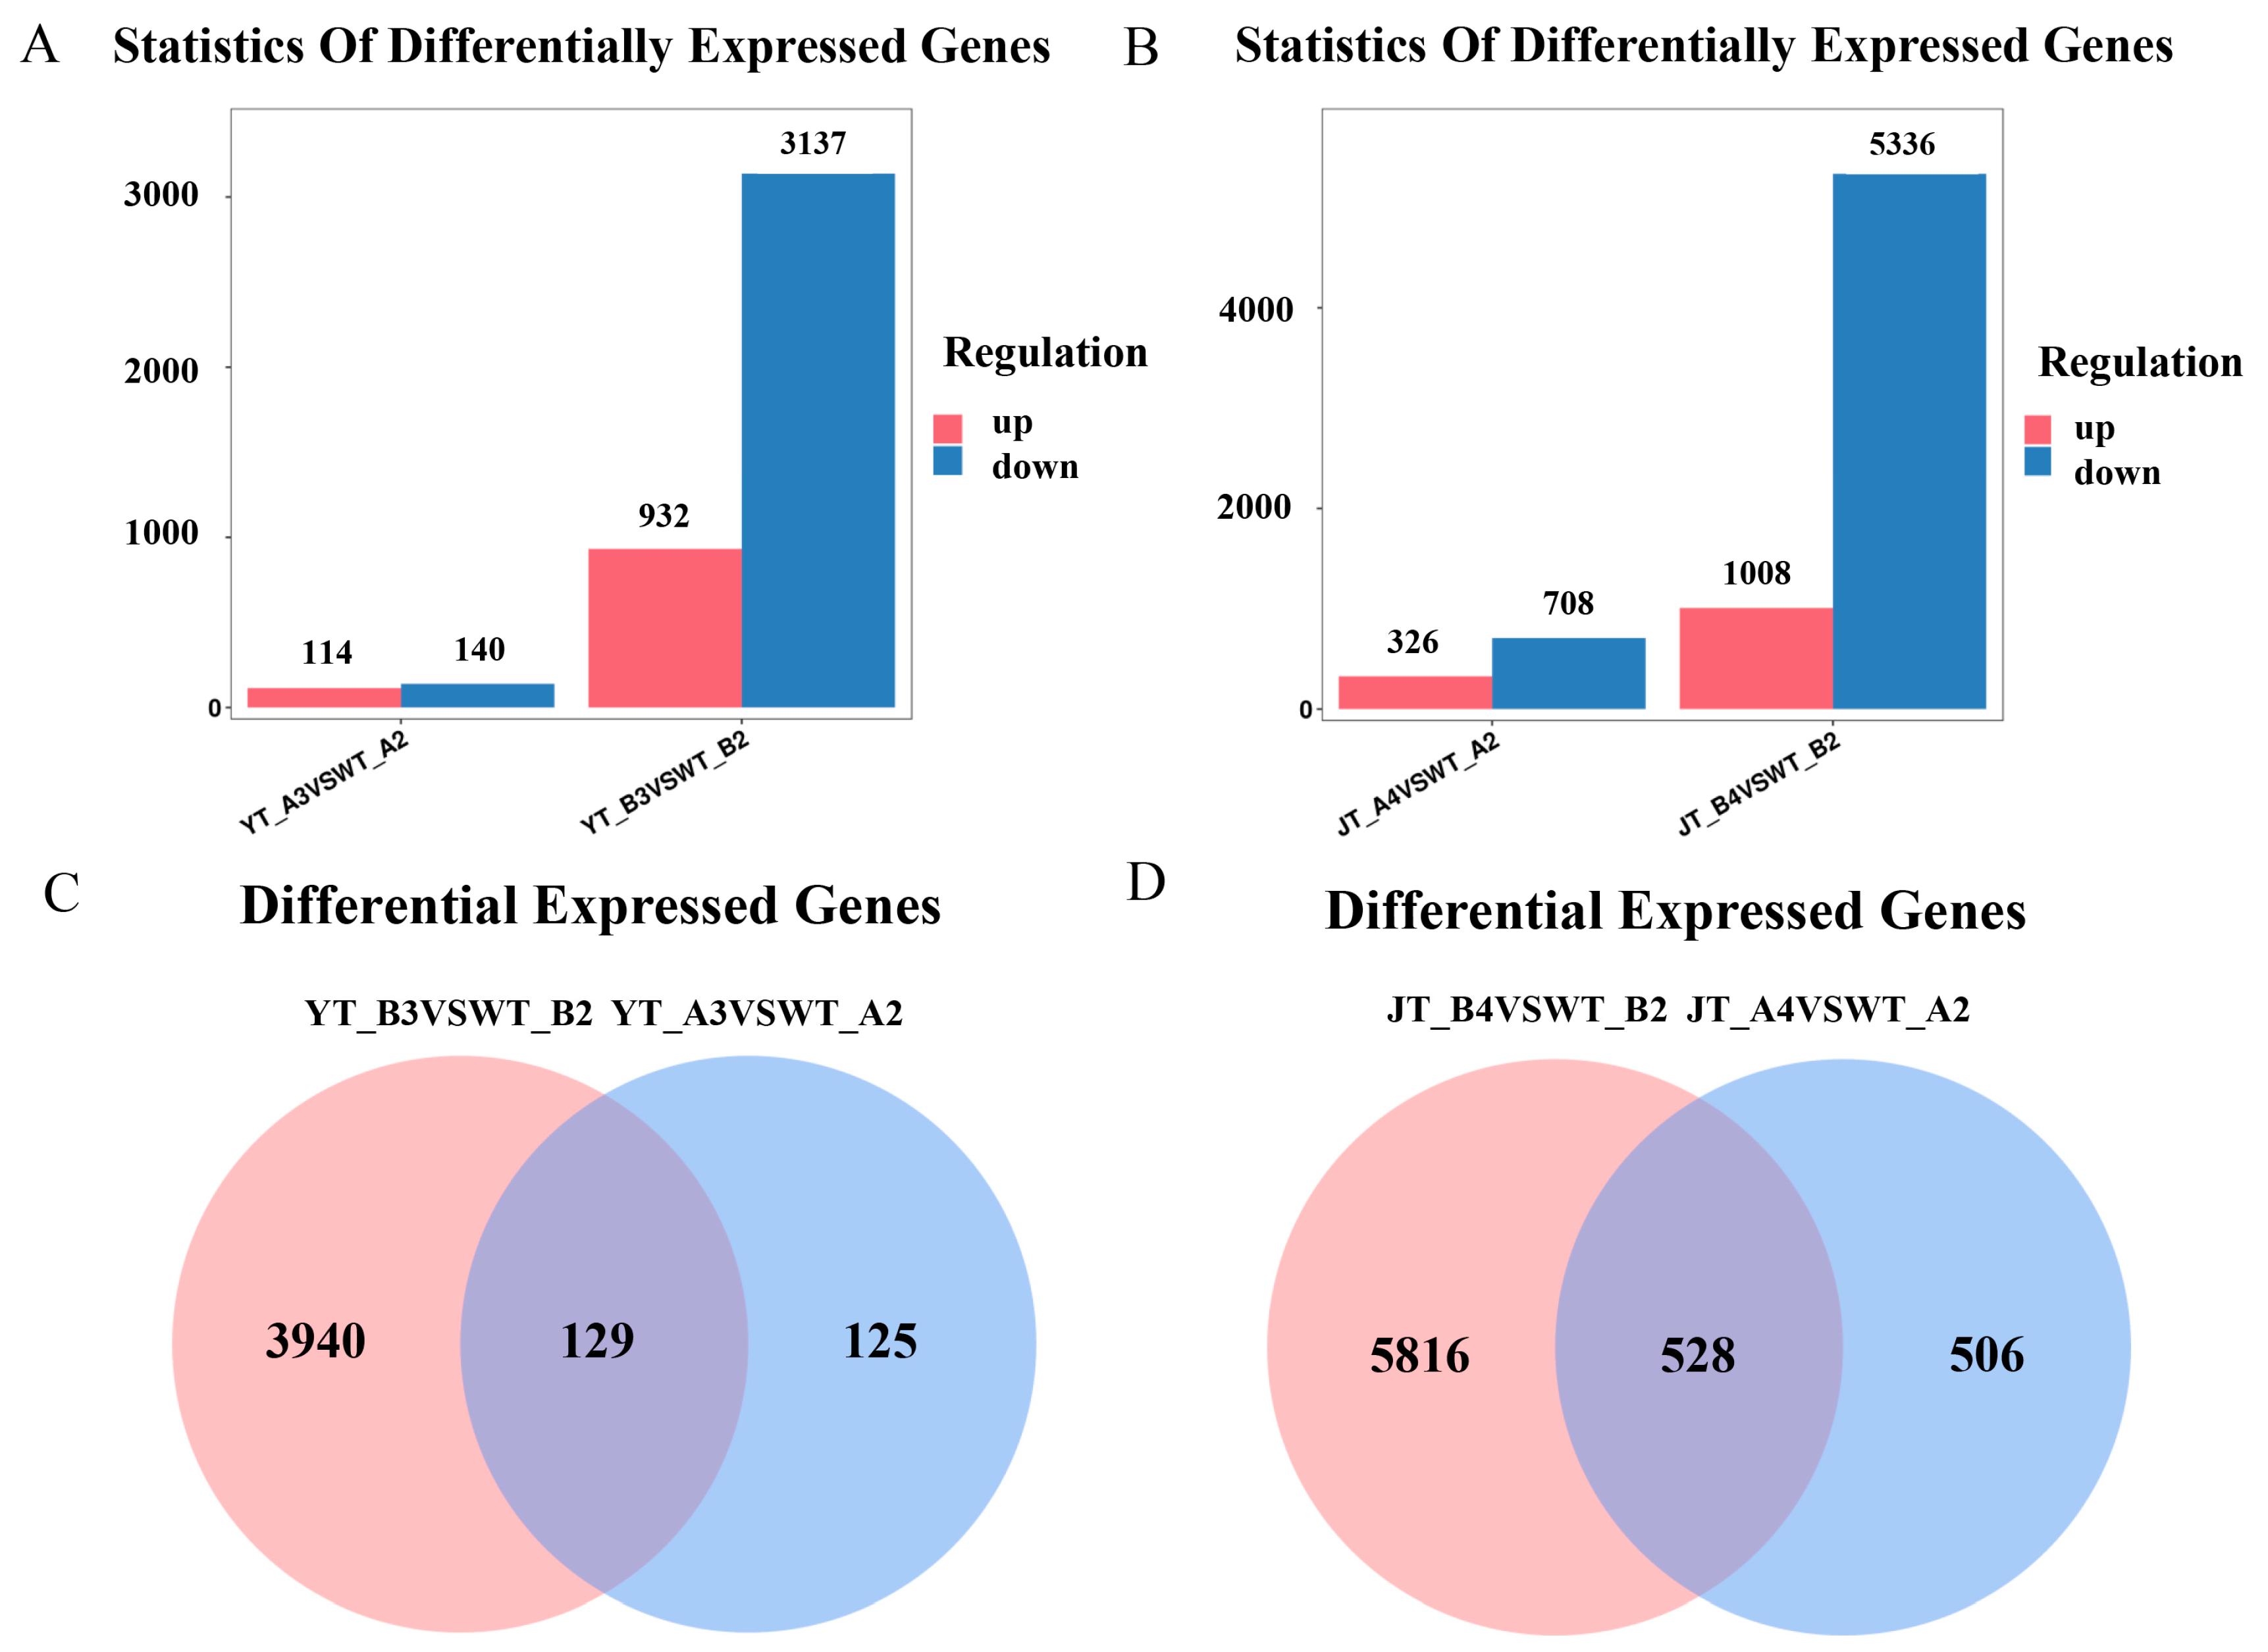
p < 0.05). Compared with the WT, the DEGs of transgenic lines increased significantly after stress treatment, and there were more downregulated DEGs than the upregulated DEGs, indicating that the expression of these genes was strongly regulated by
ZmNAC89 (
Figure S3A–D). Under NaCl treatment, 114 genes were upregulated and 140 were downregulated in the WT, while 932 genes were upregulated and 3137 were downregulated in the transgenic line (
Figure 8A). Under Na
2CO
3 treatment, 326 genes were upregulated and 708 were downregulated in the WT, while there were 1008 upregulated and 5336 downregulated genes in the transgenic control line (
Figure 8B). Wayne diagram analysis demonstrated that under different treatments of NaCl and Na
2CO
3, the transgenic lines had significantly differentially expressed genes compared with the receptor control lines. Under NaCl treatment, 3940 genes were only expressed in the transgenic lines (
Figure 8C). Under Na
2CO
3 treatment, 5816 genes were only expressed in transgenic lines (
Figure 8D). These results will help facilitate future analysis of the mechanism regulating
ZmNAC89 saline–alkali resistance.
To study the salt–alkaline tolerance network of maize regulated by
ZmNAC89, a GO analysis was performed for significantly upregulated and downregulated genes. Under NaCl treatment, many DEGs involved in pathways for the L-phenylalanine catabolic process, oxidation–reduction process, transferase activity and chloroplast were highly enriched (
Figure S4A). Under Na
2CO
3 treatment, many DEGs involved in pathways for photosynthesis, light reaction, chloroplasts, translation and the oxidation–reduction process were highly enriched (
Figure S4B). GO analyses showed that oxidation–reduction process-regulated genes were involved in
ZmNAC89-mediated salt–alkaline stress, and the
ZmNAC89 transcript level was induced by ABA. It has been reported that many MYB [
37,
38,
39] and bZIP [
40,
41] transcription factors regulate the response to salt–alkaline tolerance through the oxidation–reduction process or ABA pathway. In combination with DEGs screened with RNA-seq, the MYB transcription factor (
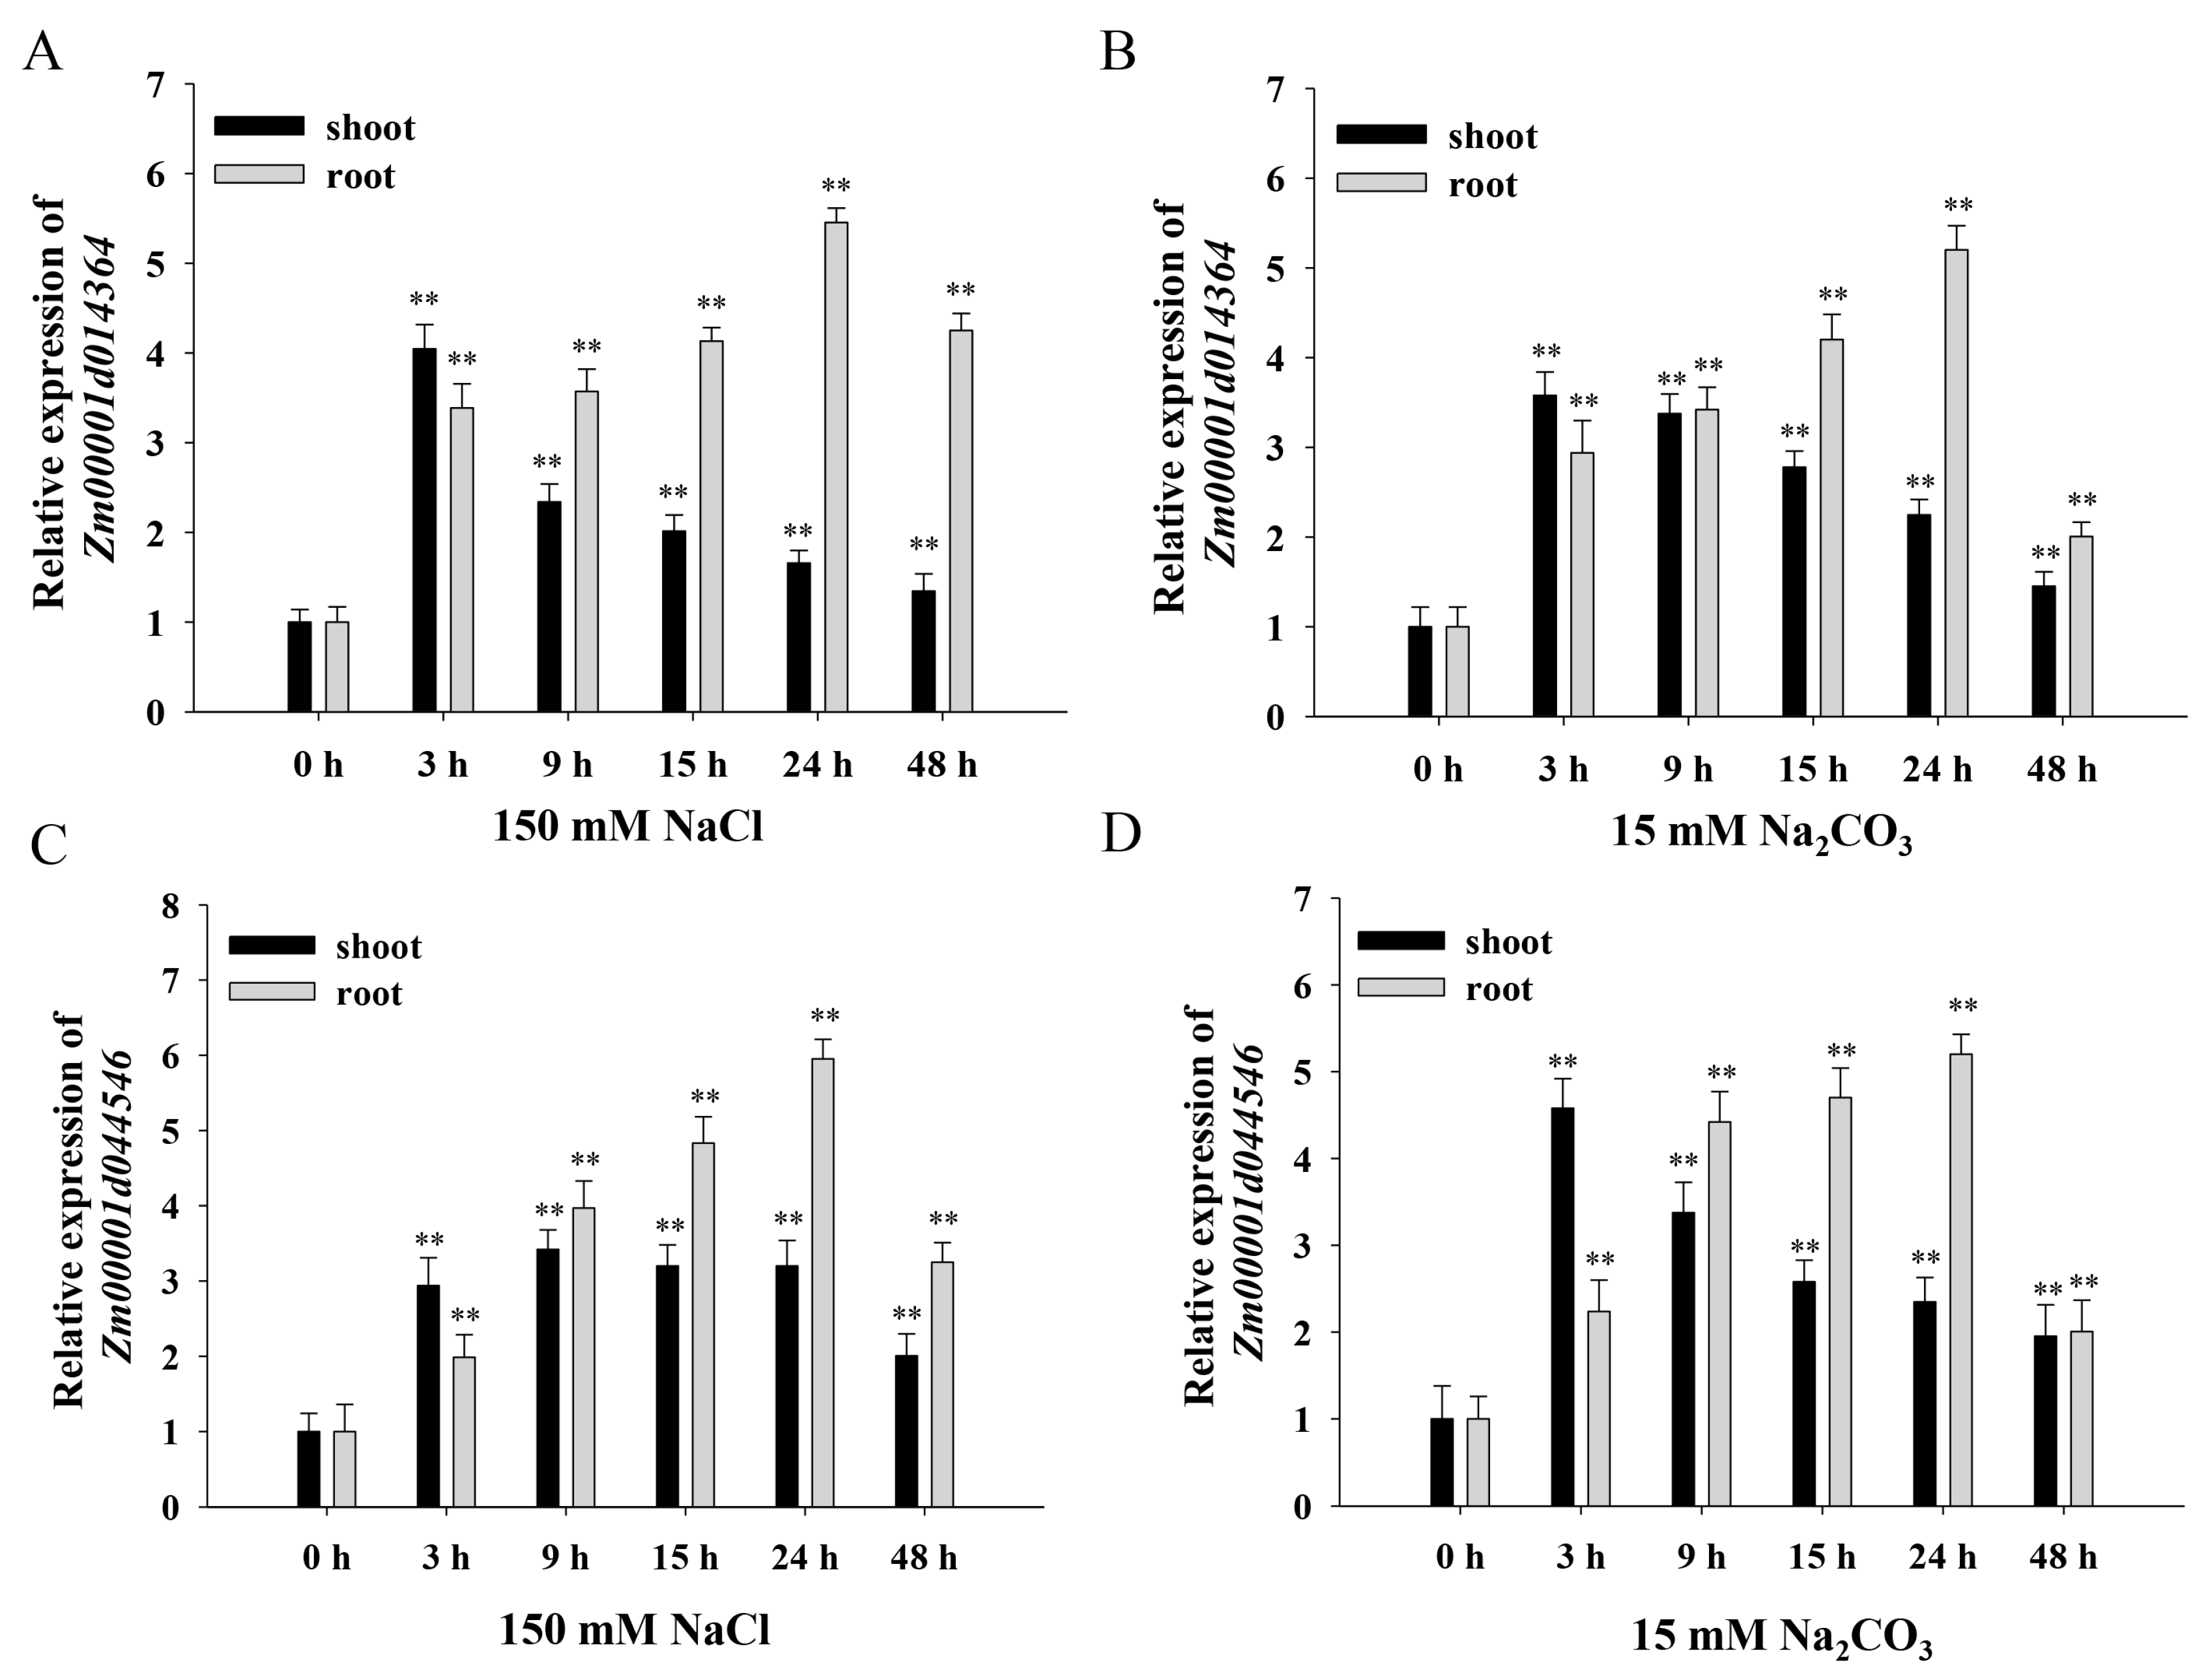
Zm00001d014364) and bZIP transcription factor (
Zm00001d044546) were selected as candidate proteins and for further verification.
Under NaCl and Na
2CO
3 treatments, the expression of
Zm00001d014364 and
Zm00001d044546 (
Figure 9) gradually increased in roots and leaves and peaked at 3 h and 24 h, respectively. Combined with the induced expression analysis of
ZmNAC89, there was a positive correlation with
ZmNAC89 expression levels, indicating that there could be a positive regulatory relationship between them.
2.7. Sequence Variation Analysis of ZmNAC89
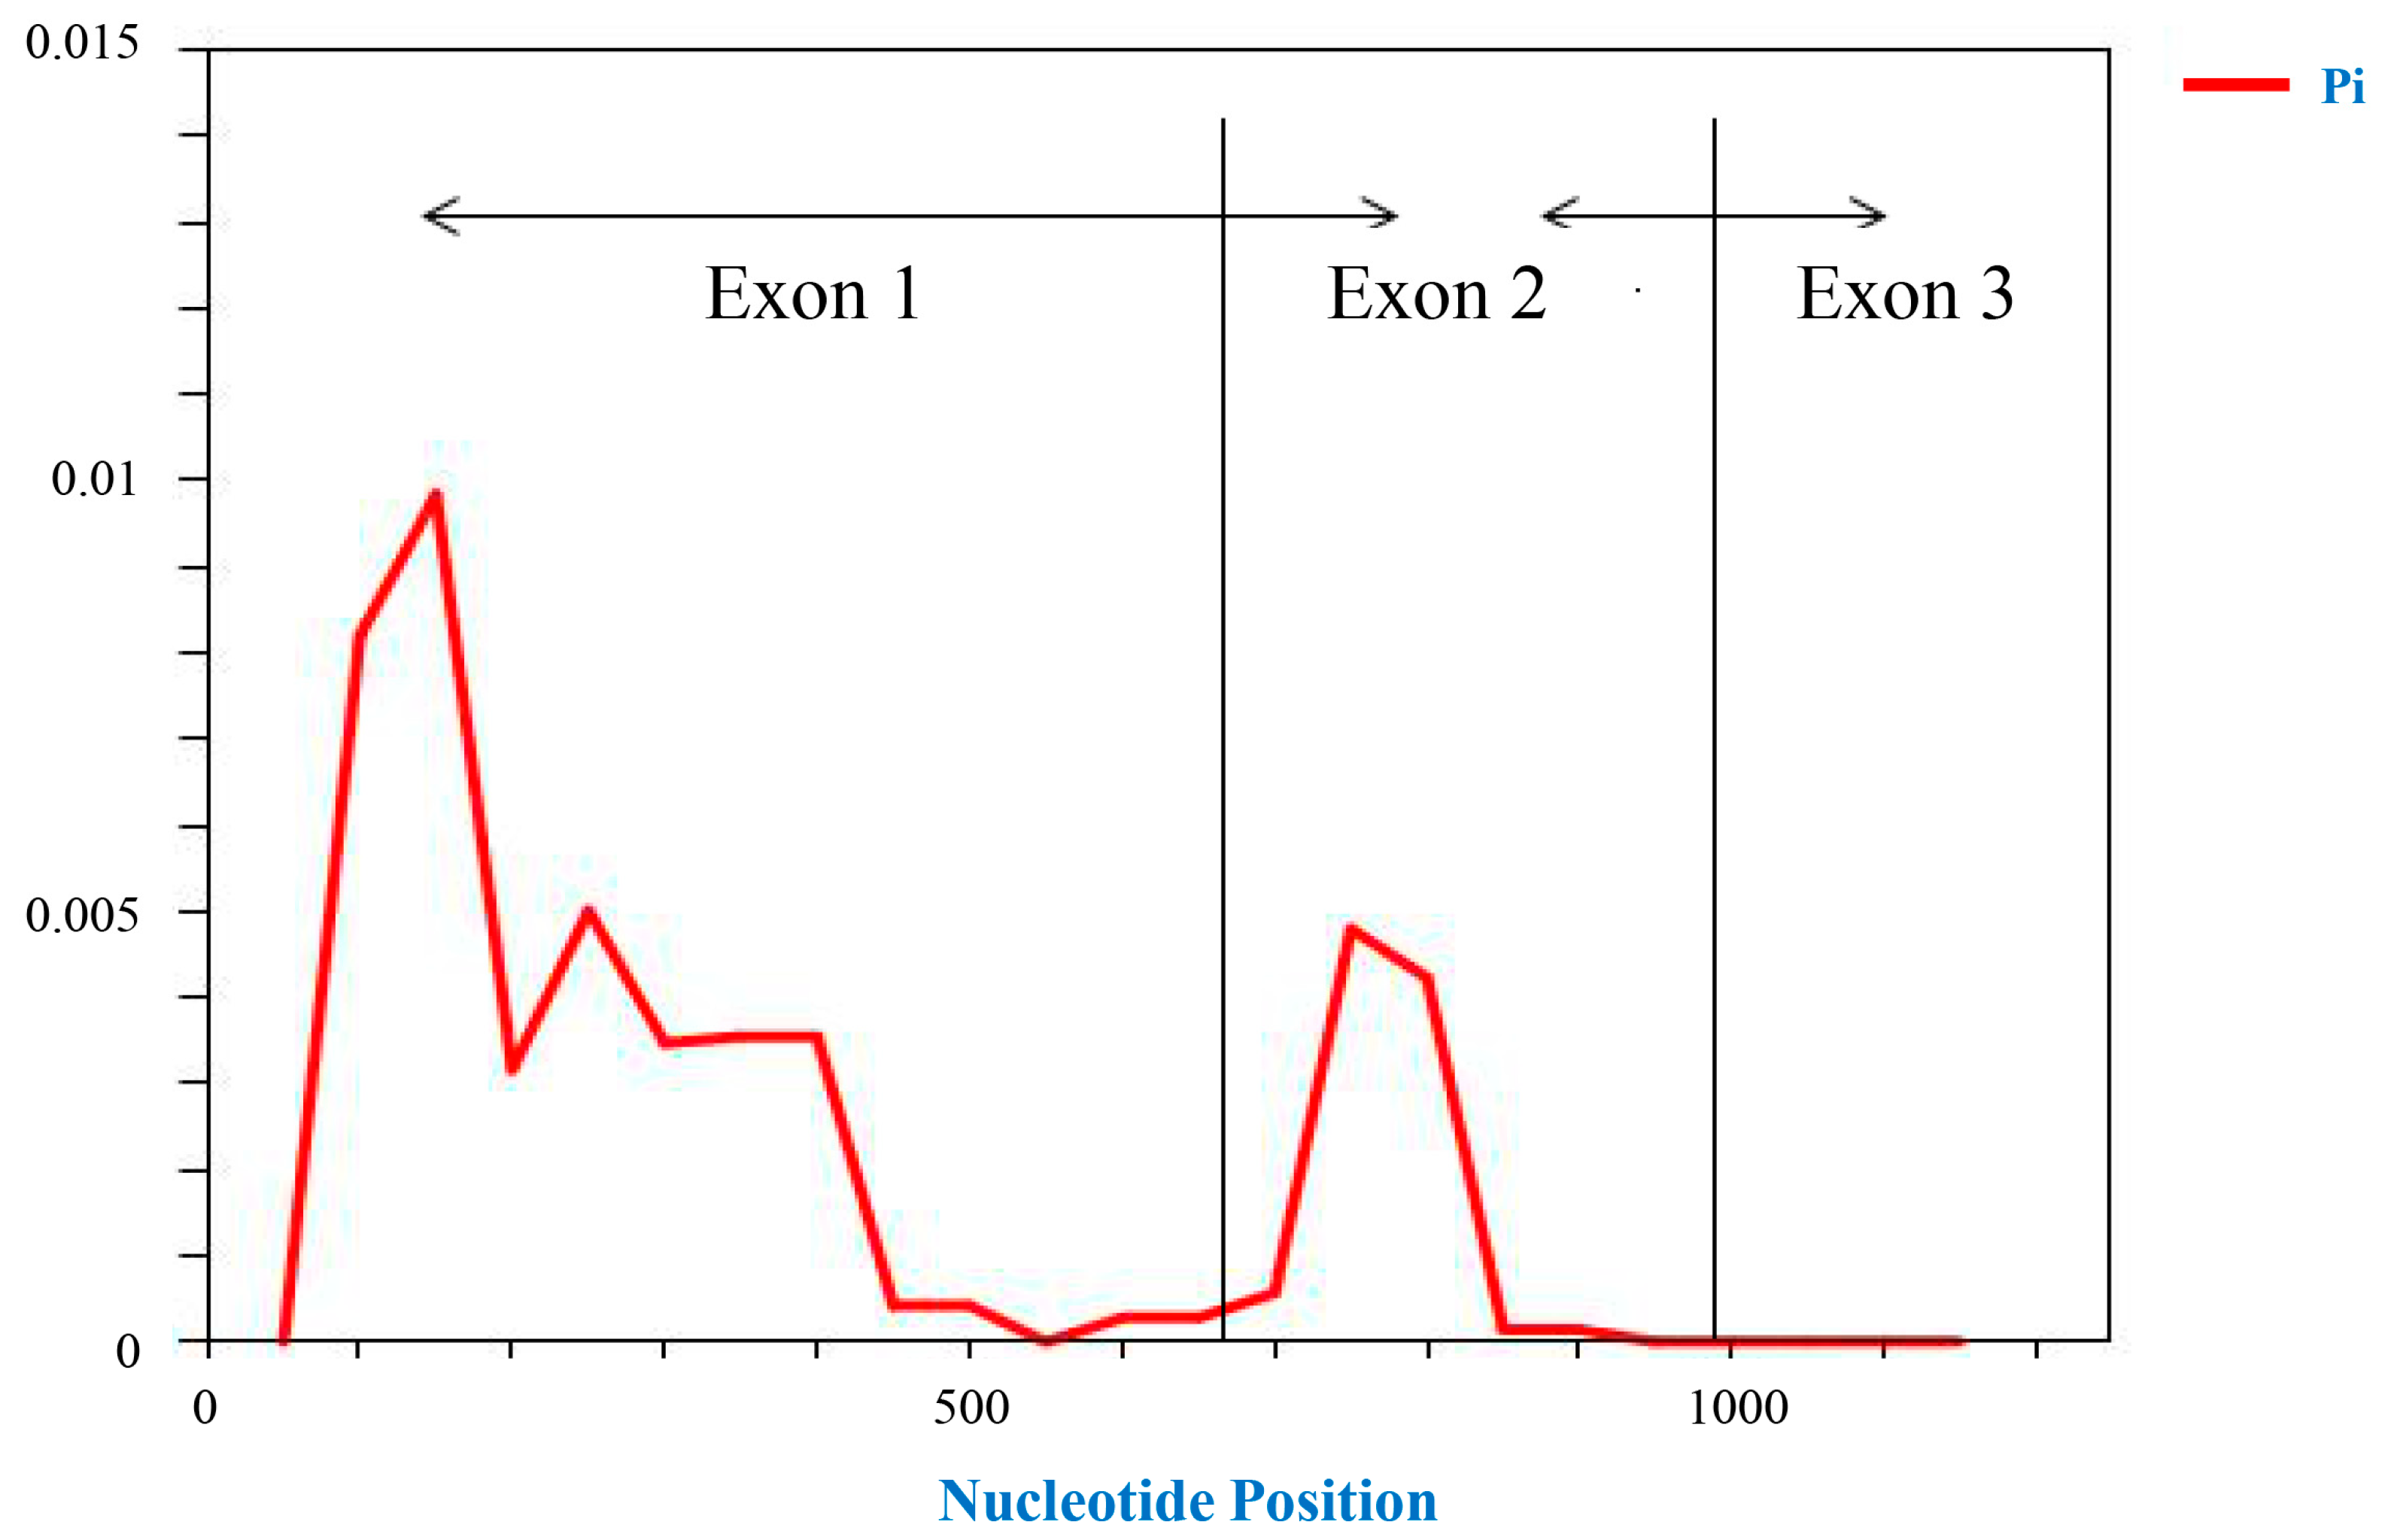
The sequence alignment of the
ZmNAC89 gene-coding region in 140 maize inbred lines showed that the sequence similarity of the
ZmNAC89 gene-coding region in different inbred lines was 99.87%, indicating that the coding region was relatively conservative. The polymorphic sites in this region were analyzed using 100 bp as the sliding frame and 25 bp as the step size. We found approximately 1–500 bp in the first exon region, indicating that there are abundant variations in this region and that polymorphism is significantly higher than in the other two exon regions. The maximum π value of nucleotide polymorphism in the second exon region reached 0.005, and there was no sequence variation in the third exon. This indicates that these two parts are relatively conservative (
Figure 10).
A total of 16 SNP sites were detected in the coding region of the
ZmNAC89 gene of the tested maize inbred lines. The polymorphic sites were typed according to the mutation type and the number of nucleotides (
Table S4A). The SNPs could be divided into six types: base C/G, G/A, G/T, T/C, A/G and C/T. DNA SPV6.0 software analysis was used to detect 20 haplotypes, with a polymorphism of 0.74. The main haplotypes were HAP1, HAP2 and HAP20, which collectively accounted for 82.14% of the tested materials. There were few other haplotypes, most of which belonged to rare variations. There were 40 Hap1 haplotype inbred lines, primarily including Han21, shen3336 and huotanghuang, and other saline–alkali-sensitive materials; the HAP2 haplotype contained 21 inbred lines, mainly guan17, 31 and Luyuan 133, and other moderately saline–alkali-tolerant materials; the HAP20 haplotype contained 54 inbred lines, mainly salt- and alkali-resistant materials such as Shen 118 and Dan 3130. The six SNP sites were synonymous mutations, which did not affect the amino acid sequence. The 10 SNP loci were non-synonymous mutations, which could change the structure and physiological function of proteins and affect resistance (
Table S4B). According to the classification of salt- and alkali-resistant inbred lines, the HAP20 haplotype was preliminarily identified as an excellent haplotype.
Combined with the previous NaCl and NA
2CO
3 stress treatment, the identification of saline–alkali-tolerance-related traits at the seedling stage and comprehensive evaluation via the membership function method obtained clustering results, and the minimum allele frequency in DNAMAN comparison results was 5%. DNA SPV6.0 software was used for SNP nucleotide diversity analysis and haplotype diversity analysis. The results are shown in
Table 3.
Under Na2CO3 stress, nucleotide diversity π = 0.00291 and Tajima’s D value was −1.10181 in 51 medium-resistance materials. Nucleotide diversity π = 0.00205 and Tajima’s D value was −0.06472, or nucleotide diversity π = 0.00286 and Tajima’s D value was −0.52477, in 23 resistant materials. Nucleotide diversity π = 0.00127 and Tajima’s D value was −0.53609 in 17 sensitive materials. Nucleotide diversity π = 0.00266 and Tajima’s D value was −0.15008 in 16 highly sensitive materials.
Under NaCl stress, nucleotide diversity π = 0.0024 and Tajima’s D value was 0.01116 in 45 resistant materials. Nucleotide diversity π = 0.00216 and Tajima’s D value was −1.03859 in 30 sensitive materials. Nucleotide diversity π = 0.00307 and Tajima’s D value was −0.82036 in 27 highly sensitive materials. Nucleotide diversity π = 0.00245 and Tajima’s D value was −0.38437 in 20 medium-resistance materials. Nucleotide diversity π = 0.00222 and Tajima’s D value was −0.67509 in 18 high-resistance materials.
Under Na2CO3 and NaCl stress, the nucleotide diversity π in maize inbred lines with different salt and alkali tolerance was relatively small, indicating that changes in the coding region of the ZmNAC89 gene in maize inbred lines were relatively conservative. Tajima’s D value, Fu and Li’s D * value and Fu and Li’s F * value did not reach significant levels, indicating that the gene follows neutral evolution in the maize inbred line population.
3. Discussion
Maize salt–alkali tolerance is a complex trait, including different mechanisms of osmosis, ions, oxidation and others, so it is difficult to identify various genes that regulate it [
35,
42,
43]. The NAC transcription factor is involved in abiotic stress responses in plants, including those to salinity, drought and low temperatures. Based on previous transcriptome data [
36], we found that the
ZmNAC89 gene was significantly induced by alkaline–salt Na
2CO
3 stress. In this study, we identified
ZmNAC89 as a transcription factor with transcriptional activation activity and localization in the nucleus. The expression of
ZmNAC89 was strongly upregulated under saline–alkaline, drought and ABA treatments. This indicates that NAC transcription factor genes are involved in plant responses to abiotic stresses.
Overexpression of the
ZmNAC89 gene in transgenic
Arabidopsis and maize enhanced salt tolerance at the germination and seedling stages. The rice
OsNAC5 and
OsNAC6 genes can improve salt and drought tolerance of rice by expanding root diameter and enhancing root development, and they regulate the expression of peroxidase genes and genes related to various drought tolerance pathways [
15,
16]. Under saline–alkali stress, the root length, average root diameter, root surface area and root volume of overexpressing lines were significantly higher than those of wild-type lines, indicating that
ZmNAC89 gene may improve salt–alkali tolerance by enhancing root development of plants.
Optimal haplotypes are typically mined based on gene sequence, genome sequence and phenotype screening. Haplotypes can be used to classify germplasm resources [
44,
45]. Based on the sequence variation analysis of the coding region of the
ZmNAC89 gene of 140 maize inbred lines, 20 haplotypes were identified, including 10 non-synonymous mutation sites. The results of the association analysis demonstrated that HAP20 was an excellent haplotype for salt and alkali tolerance. There is the potential to use the excellent saline–alkali-resistance inbred lines in HAP20 for breeding work, to use the information about excellent haplotypes to quickly identify the saline–alkali resistance of unknown resistant materials and to use this information to improve the speed of breeding applications. Maize inbred lines with this haplotype were identified, which is important when breeding salt and alkali tolerance.
Different cis-acting elements in the promoter region can regulate the expression of NAC transcription factors. The
OsNAC045 gene is related to drought resistance and salt tolerance in rice and is partially regulated by MYB and MYC elements [
46].
PbeNAC1 could increase the expression of some stress-related genes by interacting with
PbeDREB1 and
PbeDREB2A to improve stress resistance in pears [
47]. In this study,
Zm00001d014364 and
Zm00001d044546 genes as candidate interaction genes for ZmNAC89 protein were the MYB transcription factor and bZIP transcription factor, respectively. qRT-PCR was performed on
Zm00001d014364 and
Zm00001d044546 genes, which preliminarily demonstrated that their expression was positively correlated with
ZmNAC89. The gene promoter region contained elements regulating abscisic acid, methyl jasmonate, gibberellin and auxin and the light response. However, further experiments are needed to determine the interaction protein of ZmNAC89.
Generally, abiotic stress is polytropic.
GmNF-YC14 can be significantly induced and upregulated under drought, salt stress and ABA treatment at the same time, and
GmNF-YC14 can form complexes with
GmNF-YB2 and
GmNF-YA16 in soybean plants [
48]. In this study, the expression of
ZmNAC89 was upregulated under salt, alkali, drought and ABA stress, and the contents of proline and chlorophyll of transgenic lines under salt and alkali stress were increased. In addition, proline is a plant cytoplasmic osmotic regulator. It also plays an important role in stabilizing the structure of biological macromolecules, reducing cell acidity, detoxifying ammonia and regulating cell REDOX potential as an energy reservoir. The results in the transcriptome showed that differentially expressed genes were enriched into REDOX-related pathways and contained multiple ABA-signaling-related genes. Salt, alkali, drought and ABA can be generally classified as hypoxia and osmotic pressure imbalance-related stresses. We speculate that the
ZmNAC89 gene may regulate maize salt–alkali tolerance through the REDOX and ABA pathways, and that it may respond to drought and ABA stress as a transcription factor binding to downstream proline- or REDOX-related genes.
Abscisic acid, stress and maturation induction (ASR) genes are a class of plant-specific transcription factors, which play an important role in plant development, growth and abiotic stress response [
49]. Whole-genome identification has been conducted in wheat and maize, and some genes in the family were found to be upregulated under stress treatment.
ZmNAC89 is also upregulated under ABA stress, which may act on the NAC family binding sites in
ZmASRs promoters. The
ERECTA gene is a candidate gene with a potential role in drought stress tolerance in soybean [
50], and the
ERECTA gene may also be activated by NAC family genes in maize. ZmNAC89 protein candidate interaction genes
Zm00001d014364 and
Zm00001d044546 are MYB transcription factors and bZIP transcription factors, respectively, and many MYB and bZIP transcription factors have been previously reported to improve the plant response to saline-based stress by regulating ABA pathways.
4. Materials and Methods
4.1. Plant Materials and Vector Plasmid
A. thaliana seeds (wild-type Col-0 (WT)) were provided by Pro. Shuzhen Zhang of the Soybean Research Institute of Northeastern Agricultural University. The maize inbred line C01 used as a transgenic receptor was provided by the Life Science and Technology Center of China Seed Group Co., Ltd. (Beijing, China). The binary vector pTF101 was provided by Pro. Kan Wang (Iowa State University, Ames, IA, USA).
4.2. Bioinformatics Analysis of ZmNAC89 Gene
The
ZmNAC89 gene was predicted with the online prediction software FGENESH (2023) (
http://www.softberry.com/ accessed on 20 April 2023), using the genome-wide sequence of the maize inbred line B73 RefGen_v4 in the MaizeGDB database (
http://www.maizegdb.org/ accessed on 20 April 2023). The neighbor-joining (NJ) method was used to build a phylogenetic tree of the aligned protein sequences in MEGA (X) (bootstrap value of 1000). The cis-acting elements of the
ZmNAC89 gene flanking sequence were deduced using PlantCARE (
http://bioinformatics.psb.ugent.be/webtools/plantcare/html/ accessed on 20 April 2023).
4.3. Cloning of the Full-Length cDNA
Total RNA was extracted from seedlings of maize inbred line K10 treated with 150 mM NaCl for 3 h using TRIzol reagent (TransGen, Beijing, China). First-strand cDNA was synthesized from 1 μg of total RNA with 1 μL (200 U) TransScript
TM RT/RI Enzyme Mix (TransGen), according to the manufacturer’s instructions. The primers for
ZmNAC89 were performed using KOD-Plus-Neo (TOYOBO, Osaka, Japan) under the following conditions: 94 °C for 3 min, followed by 30 cycles of 94 °C for 45 s, 58.3 °C for 30 s, 72 °C for 1 min and 72 °C for 10 min. The resulting amplification product was subjected to gel purification and cloned to the pEASY-T1 Simple vector (TransGen), after which it was sequenced. The primers are listed in
Supplementary Table S5.
4.4. Transactivation Assay
The ZmNAC89 coding sequence was cloned into the pGBKT7 vector. The pGBKT7-ZmNAC89 constructs and the empty vector pGADT7-T were co-transformed into Y2HGlod yeast cells. The empty vector pGADT7-T and pGBKT7-53 were co-transformed as positive controls. The empty vector pGADT7-T and pGBKT7-Lam were co-transformed as negative controls. Transcriptional activation activity was determined on synthetically defined (SD)/-Ade/-His/-Leu/-Trp/X-ɑ-Gal/AbA medium.
4.5. Subcellular Location of ZmNAC89
The ZmNAC89 coding sequence fused with GFP was cloned into the pCAMBIA1302 vector, and then pCAMBIA1302-ZmNAC89-GFP and pCAMBIA1302-GFP were transformed into Arabidopsis protoplasts. After 16 h incubation at 25 °C, the GFP fluorescent signal of the transfected Arabidopsis protoplasts cells was examined with a TCS SP2 confocal spectral microscope imaging system (Leica, Wetzlar, Germany).
4.6. Analysis of Inducible Expression Using Real-Time Quantitative PCR
For qRT–PCR, total RNA was extracted from third-leaf-stage K10 seedlings treated with 15 mM Na
2CO
3, 150 mM NaCl, 20% (
w/
v) PEG6000 and 100 μM ABA for 0 h, 1 h, 3 h, 6 h, 9 h, 12 h, 24 h, 2 d and 4 d using TRIzol reagent (TransGen). cDNA was synthesized using TransScriptTM RT/RI Enzyme Mix (TransGen), and qRT–PCR analyses were conducted using TransStart
® Tip Green qPCR SuperMix (TransGen) on a Chromo4
TM Real-Time Detector (Bio-Rad, Hercules, CA, USA). The maize
Actin1 gene (Gene ID: 100282267) was used as an internal standard. The 2
−ΔΔCt method was used to analyze relative expression. The primers are listed in
Supplementary Table S5.
4.7. Construction and Transformation of Binary Plant Expression Vector
To generate transgenic lines overexpressing
ZmNAC89, the coding sequence of
ZmNAC89 was cloned into the pTF101 vector and transformed into the
Agrobacterium tumefaciens strain EHA105 to infect
Arabidopsis through the floral dip method [
51] and maize through the embryo infection method. T
0- and T
1-generation transgenic lines were screened with phosphinothricin (PPT) because the vector contains a screening marker gene
Bar. The T
2-generation positive transgenic plants were verified using PCR and a Bar protein test strip, and the expression levels of
ZmNAC89 in transgenic plants were confirmed through qRT–PCR.
All experiments were performed at the Molecular Breeding Experimental Base of Northeast Agricultural University located in Harbin City, Heilongjiang Province of China. The plants were stored in a specific room, and the locations where the plants were grown were burned once the experiments were concluded.
4.8. PCR and RT-PCR Analysis of Transgenic Plants
Genomic DNA was extracted from maize plants using the CTAB procedure. Due to the
ZmNAC89 gene being an endogenous gene in maize, primers were designed with the sequences of the promotor and the terminator of the plant expression vector. For PCR assays of
the ZmNAC89 gene, a 1758 bp fragment was amplified using the primers Pro-ZmNAC89-F/ZmNAC89-Ter-R (
Supplementary Table S5). The
Bar gene was assayed by using the primers of Bar transgenic plants.
TRIzol reagent (Tiangen, Beijing, China) was used to extract total RNA from 100 mg of maize seedling leaves or roots. The RT Reagent Kit (Transgene, Beijing, China) was used to perform reverse transcription on 500 ng DNase-treated RNA. Five-fold diluted cDNA was then used for PCR. A 430 bp ZmNAC89 fragment was amplified with gene-specific primers from the promotor and the conserved region of the target gene. A 429 bp fragment was amplified using the Bar gene primer in the same manner described above. RT-PCR used the β-Actin gene as an internal control. Three replicates were performed.
4.9. Salt and Alkalinity Stress Treatment of Arabidopsis and Maize during Seedling Growth
For the salt and alkalinity tolerance assays of Arabidopsis, T2-generation transgenic seeds and the wild-type (WT) seeds were plated on MS agarose medium (0.8%). After 4 days of vernalization at 4 °C, plates were vertically cultured for 5 days in the incubator. The seedlings with consistent growth were selected and placed in an MS medium with various levels of NaHCO3 (0.5 and 1 mM) and NaCl (100 and 150 mM). After 14 days of vertical culture, the Epson Perfection V800 root scanner was used to analyze root parameters, including total root length (cm), root surface area (cm2) and root volume (cm3). Seven-day-old seedlings were placed in pots with a mix of vermiculite and nutrient soil in a greenhouse (22 °C, humidity 70%, 16 h light/8 h dark), grown for three weeks and irrigated at the same volume of 300 mM NaCl and 60 mM NaHCO3 solution every two days for two weeks.
For the salt and alkalinity tolerance assays of maize, T2-generation transgenic seeds and non-transgenic seeds were soaked for 6 h in 160 mmol/L NaCl solution, 25 mmol/L Na2CO3 solution and a saline–alkali mixed solution with a Na+ concentration of 100 mmol/L made up of NaCl, Na2SO4, NaHCO3 and Na2CO3 at a ratio of 1:9:9:1, and then germinated on filter paper in a culture dish. The germination potential was measured on the 4th day, and the fresh weight, root length, germination rate, dry weight and bud length were measured on the 7th day. T2-generation transgenic seeds, as well as non-transgenic seeds, were placed in 15 cm diameter pots with sand, with 5 seedlings in each pot, 30 seedlings per treatment and 3 replicates. The third-leaf-stage maize seedlings were irrigated with 160 mmol/L NaCl solution, 25 mmol/L Na2CO3 solution and a saline–alkali mixed solution with a Na+ concentration of 100 mmol/L made up of NaCl, Na2SO4, NaHCO3 and Na2CO3 at a ratio of 1:9:9:1, once every two days. All plants were irrigated with 1/2 Hoagland solution before treatment to prevent excessive salt accumulation in the sand.
4.10. Identifying Biochemical and Physiological Characteristics and Changes in Phenotype Associated with Alkalinity and Salt Tolerance
The relative conductivity, chlorophyll and proline content of Arabidopsis and maize ZmNAC89-overexpressed transgenic lines were then determined. The leaves of 0.05 g seedlings were immersed in 5 mL of deionized water. A conductivity meter (DDS-307) was used to detect the relative conductivity, which is the ratio of the electrical conductivity of exudates after soaking for 24 h at room temperature to the electrical conductivity of exudates after removal from a boiling water bath for 10 min until cooled.
Chlorophyll content was estimated according to the method used by Arnon et al. [
52]. The plant leaf chlorophyll was extracted with 95% ethanol solution. The extraction absorbance was measured at wavelengths of 645 and 663 nm with a 754 UV-visible spectrophotometer (Shanghai Jinghua Company). The chlorophyll content was calculated according to the following formulas:
Proline content was measured according to the method of Bates et al. [
53]. In brief, 5 mL of 3% sulfosalicylic acid was ground into 0.2 g plant leaves to extract proline. It was then placed in boiling water for 10 min, cooled, filtered and diluted to 5 mL. Then, 2 mL of acid ninhydrin and 2 mL of glacial acetic acid solution were added, followed by boiling for another 30 min. Next, 4 mL of toluene was added after it cooled, and the solution was gently vortexed. The toluene layer absorbance was measured at thebwavelength of 520 nm using a 754 UV-visible spectrophotometer (Shanghai Jinghua Company, Shanghai, China). The proline content was calculated from the standard curve.
4.11. RNA Extraction, Transcriptome Library Construction, and Sequencing
WT and transgenic maize seeds of the same size were selected, 75% were disinfected for 15 min and then they were washed with distilled water 3 times. Seeds were germinated via the sprouting paper method for 48 h, and seeds with the same budding potential were selected and cultured in a plastic bowl with a diameter of 15 cm until the three-leaf single stage. They were treated with 160 mmol/L NaCl solution and 25 mmol/L Na2CO3 solution, respectively. Before stress treatment, 1/2 Hoagland solution was irrigated once to prevent excessive accumulation of NaCl and Na2CO3 in the sand. After 3 h of stress, the aggregate tissues of 3 three-leaf maize seedlings were collected for RNA-seq analysis. Total RNA was isolated using TRIzol (Invitrogen, Carlsbad, CA, USA). The concentration and integrity of the RNA were evaluated using a NanoDrop ND-1000 (NanoDrop, Wilmington, DE, USA) and Bioanalyzer 2100 (Agilent, Santa Clara, CA, USA). The construction and sequencing of the transcriptome library were performed by Lianchuan Biotechnology Co., Ltd. in Guangzhou, China. The mRNA was enriched with magnetic beads connected with Oligo(dT) and then fragmented. Double-stranded cDNAs were synthesized using RNaseH, DNA Polymerase I and random hexamer primers. The cDNA fragments were purified using AMPure XP beads. The poly (A) addition was repaired and enriched via PCR to construct the cDNA library. The cDNA library was sequenced on the Illumina Novaseq™ 6000, and the reading length of sequencing was double-ended 2 × 150 bp (PE150).
The differentially expressed genes (DEGs) were identified with |log2foldchange| ≥ 1, p < 0.05. The DEG levels were normalized by calculating the fragments per kilobase of transcript per million mapped reads (FPKM). Gene Ontology (GO) analysis was performed for functional gene classification, while KEGG enrichment analysis was performed to understand the metabolic pathways involved in DEGs.
4.12. Sequence Variation Analysis of ZmNAC89
The genome-wide sequence of the maize inbred line B73 RefGen_v4 was checked in the MaizeGDB database (
http://www.maizegdb.org/ accessed on 15 March 2023). Specific primers were designed for the candidate gene
ZmNAC89 using primer 5.0 software and amplified in 140 maize inbred lines. DNAMAN and DNA SPV6.0 software was used for the multi-sequence alignment of the
ZmNAC89 gene-coding region in different inbred lines, SNP nucleotide diversity analysis and haplotype diversity analysis. The primers are listed in
Table S5.


 ,
, 


