Article

The polyHIS Tract of Yeast AMPK Coordinates Carbon Metabolism with Iron Availability

by
Kobi J. Simpson-Lavy
and
Martin Kupiec
*
The Shmunis School of Biomedicine and Cancer Research, The George S. Wise Faculty of Life Sciences, Tel Aviv University, Tel Aviv 69978, Israel
*
Author to whom correspondence should be addressed.
Int. J. Mol. Sci. 2023, 24(2), 1368; https://doi.org/10.3390/ijms24021368
Submission received: 13 December 2022 / Revised: 6 January 2023 / Accepted: 7 January 2023 / Published: 10 January 2023
(This article belongs to the Special Issue AMP-Activated Protein Kinases in Health and Disease)

Abstract

:
Energy status in all eukaryotic cells is sensed by AMP-kinases. We have previously found that the poly-histidine tract at the N-terminus of S. cerevisiae AMPK (Snf1) inhibits its function in the presence of glucose via a pH-regulated mechanism. We show here that in the absence of glucose, the poly-histidine tract has a second function, linking together carbon and iron metabolism. Under conditions of iron deprivation, when different iron-intense cellular systems compete for this scarce resource, Snf1 is inhibited. The inhibition is via an interaction of the poly-histidine tract with the low-iron transcription factor Aft1. Aft1 inhibition of Snf1 occurs in the nucleus at the nuclear membrane, and only inhibits nuclear Snf1, without affecting cytosolic Snf1 activities. Thus, the temporal and spatial regulation of Snf1 activity enables a differential response to iron depending upon the type of carbon source. The linkage of nuclear Snf1 activity to iron sufficiency ensures that sufficient clusters are available to support respiratory enzymatic activity and tests mitochondrial competency prior to activation of nuclear Snf1.

Graphical Abstract

1. Introduction

Iron is an essential element for life; however, Fe2+ is reactive and generates free radicals via the Fenton reaction. Therefore, iron levels and availability are tightly regulated [1]. In yeast cells, free Fe2+ is incorporated into the porphyrin ring of haem, whose functions include oxygen sensing [2], cytochrome function (both for lipid biosynthesis, e.g., ergosterol [3], and the electron-transport-chain of respiration [4]), as well as elimination of hydrogen peroxide by catalases [5]. Fe2+ is also utilized as iron–sulfur clusters, which are incorporated as co-factors in a variety of proteins. Iron–sulfur-containing proteins can be found in DNA metabolism (e.g.: DNA polymerases, the ribonucleotide reductase (RNR) subunit Rnr2 (the RNR catalyzes the limiting step in dNTP synthesis)) [6], carbon metabolism (e.g., Aco1, Sdh4) [7], and the ribosome cycle [8]. Thus, under conditions of iron scarcity, cells must prioritize which class of protein receives iron.
The bioavailability of iron is tightly regulated. Under iron-replete conditions, the Yap5 transcription factor (TF) induces expression of genes, such as those encoding the vacuolar iron-importer Ccc1, to sequester excess iron [9,10]. Ccc1 imports Fe2+ into the vacuole, where it is oxidized and stored as Fe3+ [11]. Upon iron starvation, iron is restored from the vacuole back to the cytoplasm [12].
Under low-iron conditions, yeasts express a set of genes known as the (low) iron regulon, which govern iron uptake and homeostasis. The expression of these genes is controlled by the Aft1 and Aft2 transcription factors (TFs). Aft1 and Aft2 show partial redundancy, but Aft1 is more involved in the expression of iron transporters (such as FET3), whereas Aft2 regulates the expression of genes, such as SMF3 (vacuole exporter) and MRS4 (mitochondrial importer) which are involved in intracellular iron distribution [13]. Aft1 also upregulates expression of the ribonucleotide reductase subunit RNR1 [14] and CTH1/2, which degrades select mRNAs that are mainly associated with carbon respiration and amino acid biosynthesis [7,15]. Thus, the low-iron response regulates the apportioning of iron to different processes.
Iron–sulfur complexes are exported from the mitochondria, and under conditions of sufficient iron–sulfur cluster provision are recognized by the glutaredoxins Grx3 and Grx4 (either one; deletion of both is lethal), which form a sandwich, comprising two Grx3/4 moieties, both binding a single iron–sulfur cluster. Following replacement of one of the glutaredoxins by Fra1 or Fra2 (Bol2), this complex binds to Aft1 or Aft2, inhibiting the DNA binding ability of these TFs [16,17,18,19]. Thus, under conditions where iron–sulfur clusters are available, the iron regulon is inactive.
Although Aft1 and Aft2 share a core, Fe–S cluster-regulated DNA binding domain, Aft1 has extended sequences at both the N and C termini that are absent from Aft2 [20]. In addition to activating the iron regulon, Aft1 plays central roles in seemingly unrelated processes: it interacts with the kinetochore protein Iml3 to promote peri-centromeric cohesion [21], with Sit1 (Arn3) to regulate ferroxamine B uptake [22], and with the DNA damage checkpoint protein Rad9 to monitor fragile genomic sites [23].
The yeast Snf1 kinase (AMPK in mammals) promotes the switch from fermentation of hexoses (e.g., glucose or fructose) to produce ethanol, to the respiration of poor carbon sources (such as glycerol, lactate, ethanol, etc.) [24]. Genes involved in gluconeogenesis or in the respiration of alternative carbon are regulated by Snf1 via the activation of transcription factors. Examples of upregulated factors are Adr1, which regulates genes such as ADH2 (utilized in this paper as a reporter for Snf1 activity) [25] and Cat8 (to express, e.g., FBP1, PCK1) [26]. Snf1 also inhibits repressors, such as Mig1 and Nrg1 (to derepress SUC2, GAL1 [27,28]). In addition, Snf1 inhibits Acetyl-CoA carboxylase (Acc1) to downregulate fatty acid synthesis [29], Psk1 to direct glucose-6-phosphate to cell wall construction [30], and inhibits adenylate cyclase (Cyr1) [31]. Snf1 also phosphorylates and inhibits the arrestins Rod1 and Rog3 to regulate the stability of plasma membrane carbon transporters [32].
Snf1 is activated by phosphorylation at T210 upon glucose deprivation [33]; this site becomes dephosphorylated when glucose is available [34]. When glucose is absent, a gamma-protein activator (Snf4) associates with Snf1, and the localization of the SNF1/AMPK complex within the cell (to the vacuolar membrane, plasma membrane and nucleus, respectively) is determined by one of three beta-localizing proteins: Sip1, Sip2, or Gal83 [35]. Localization of Snf1 to the nucleus is inhibited by glucose [36]. Glucose also contributes to inhibition of Snf1 via PKA activation of Mms21 which SUMOylates Snf1at lysine 549 [37].
The Snf1 protein comprises a kinase domain (aa 54–391) (KD) and a regulatory domain (aa 392–633) (RD) [38] (Figure S1A). In the presence of glucose, the kinase domain (KD) is inhibited by interaction with the regulatory domain (RD). Upon phosphorylation of Snf1 at T210, Snf4 interacts with aa 460–498 of Snf1 (RD-γ), preventing the interaction of the kinase and regulatory domain, and disinhibiting Snf1 kinase activity [38,39]. The beta proteins (Sip1, Sip2, Gal83) interact with aa 515–633 of Snf1(RD-β) [40]. Snf1 associates with Snf4 and one of the beta proteins to produce a stable, active SNF1/AMPK complex [35]. The pre-kinase region (PKR) comprises the amino acids from the N-terminus until the kinase domain. In S. cerevisiae, the PKR comprises amino acids 1–53 and contains a polyhistidine tract comprising 13 contiguous histidines (followed by glycine and one more histidine) [41] that interact with RD-β in response to deprotonation caused by the glucose activation of Pma1. This functions as a progressive pH-sensing module (PSM) that controls Snf1 activity in response to glucose deprivation [42]. In this work, we show that the protonated form of the PSM also integrates iron deprivation signals to inhibit Snf1 activity.

2. Results

2.1. The PSM Receives a Signal Transmitted by Iron Deprivation

Histidine has been reported to form ligands with transition metal ions, such as Ni2+ and, in combination with cysteines, Fe2+ [43]. Although we have already shown that the polyhistidine tract in the PSM of Snf1 is a pH sensor [42], we wondered whether it might also have a role in metal abundance sensing. We found that EDTA, a chelator mainly of Mg2+ and Ca2+, did not affect ADH2 expression in a polyHIS-dependent manner (Figure S1B). However, addition of the iron chelator BPS (0.1 mM) lowered ADH2 expression by approximately 50% whilst the addition of Mohr’s salt (ferrous ammonium sulfate, 5 mM) increased ADH2 expression (Figure 1A). The effects of iron supplementation or chelation upon ADH2 expression are dependent upon the polyHIS tract of Snf1, since deletion of these amino acids (ΔH), or their replacement by alanine (A), increased ADH2 expression and uncoupled ADH2 expression from iron availability (Figure 1A). Iron supplementation did not rescue ADH2 expression when the polyHIS tract was substituted with aromatic amino acids that have previously been shown to be inactive [42], such as the Snf1W or Snf1Y mutant proteins (Figure 1A). In our previous work, we found that decreasing the number of histidines in the PSM progressively increases Snf1 activity by decreasing the interaction between the NTD and the CTD [42]. We therefore measured the response to BPS in Snf14H and Snf18H cells (PSM with only four or eight histidines) and found that the inhibition of Snf1 (as determined by ADH2 expression) by iron deprivation increased when more histidines were present (Figure 1B). It is possible that iron deprivation could exert its effects by diminishing phosphorylation of threonine 210 at the active site, which is also needed for Snf1 activity. However, iron chelation with BPS did not affect T210 phosphorylation, neither in WT cells nor in cells expressing Snf1ΔH (Figure 1C and Figure S1C,D). Although Snf1ΔH was much less abundant than Snf1WT (Figure 1C and Figure S1C), it is three times more phosphorylated at T210 (Figure 1C and Figure S1D)—Snf1 abundance was not affected by iron deprivation (Figure 1C and Figure S1C). In response to lack of glucose, Snf1 activity results in the activation of Adr1 by dephosphorylation at S230 [25]. Indeed, Adr1S230A cells, unable to undergo phosphorylation, do not require Snf1 for ADH2 expression [25]. Expression of Adr1S230A resulted in the suppression of the lowered ADH2 expression due to BPS treatment (Figure 1D), suggesting that iron deficiency is sensed upstream of Adr1.
Since the polyHIS tract within the pre-kinase region is crucial for mediating the inhibition of Snf1 in response to iron–sulfur cluster deficiency, we considered whether overexpressing this region alone might affect ADH2 expression. The PKR was overexpressed in a 2μ plasmid from an ADH1 promoter; we created a nuclear version of this region by fusing it to the Gal4 binding domain (GBD), or left it intact, thus directing it to the cytoplasm. An overexpression of nuclear Snf1PKR increased ADH2 expression and rendered ADH2 expression insensitive to iron chelation (Figure 1E). This was dependent upon the polyHIS tract, since an overexpression of Snf1PKRΔH or Snf1PKR-A did not affect ADH2 expression. Interestingly, an overexpression of cytoplasmic Snf1PKR also did not affect ADH2 expression (Figure 1E). Therefore, it seems that the overexpression of nuclear Snf1PKR saturates a binding site in an inhibitor protein via the polyHIS tract, and that this inhibitor protein is nuclear. Since overexpression of the positively charged Snf1PKR-R allele, where the polyHIStidines are replaced by poly-arginine, also increased ADH2 expression (Figure 1E), the binding site of the inhibitory protein with Snf1PKR is likely to be negatively charged.

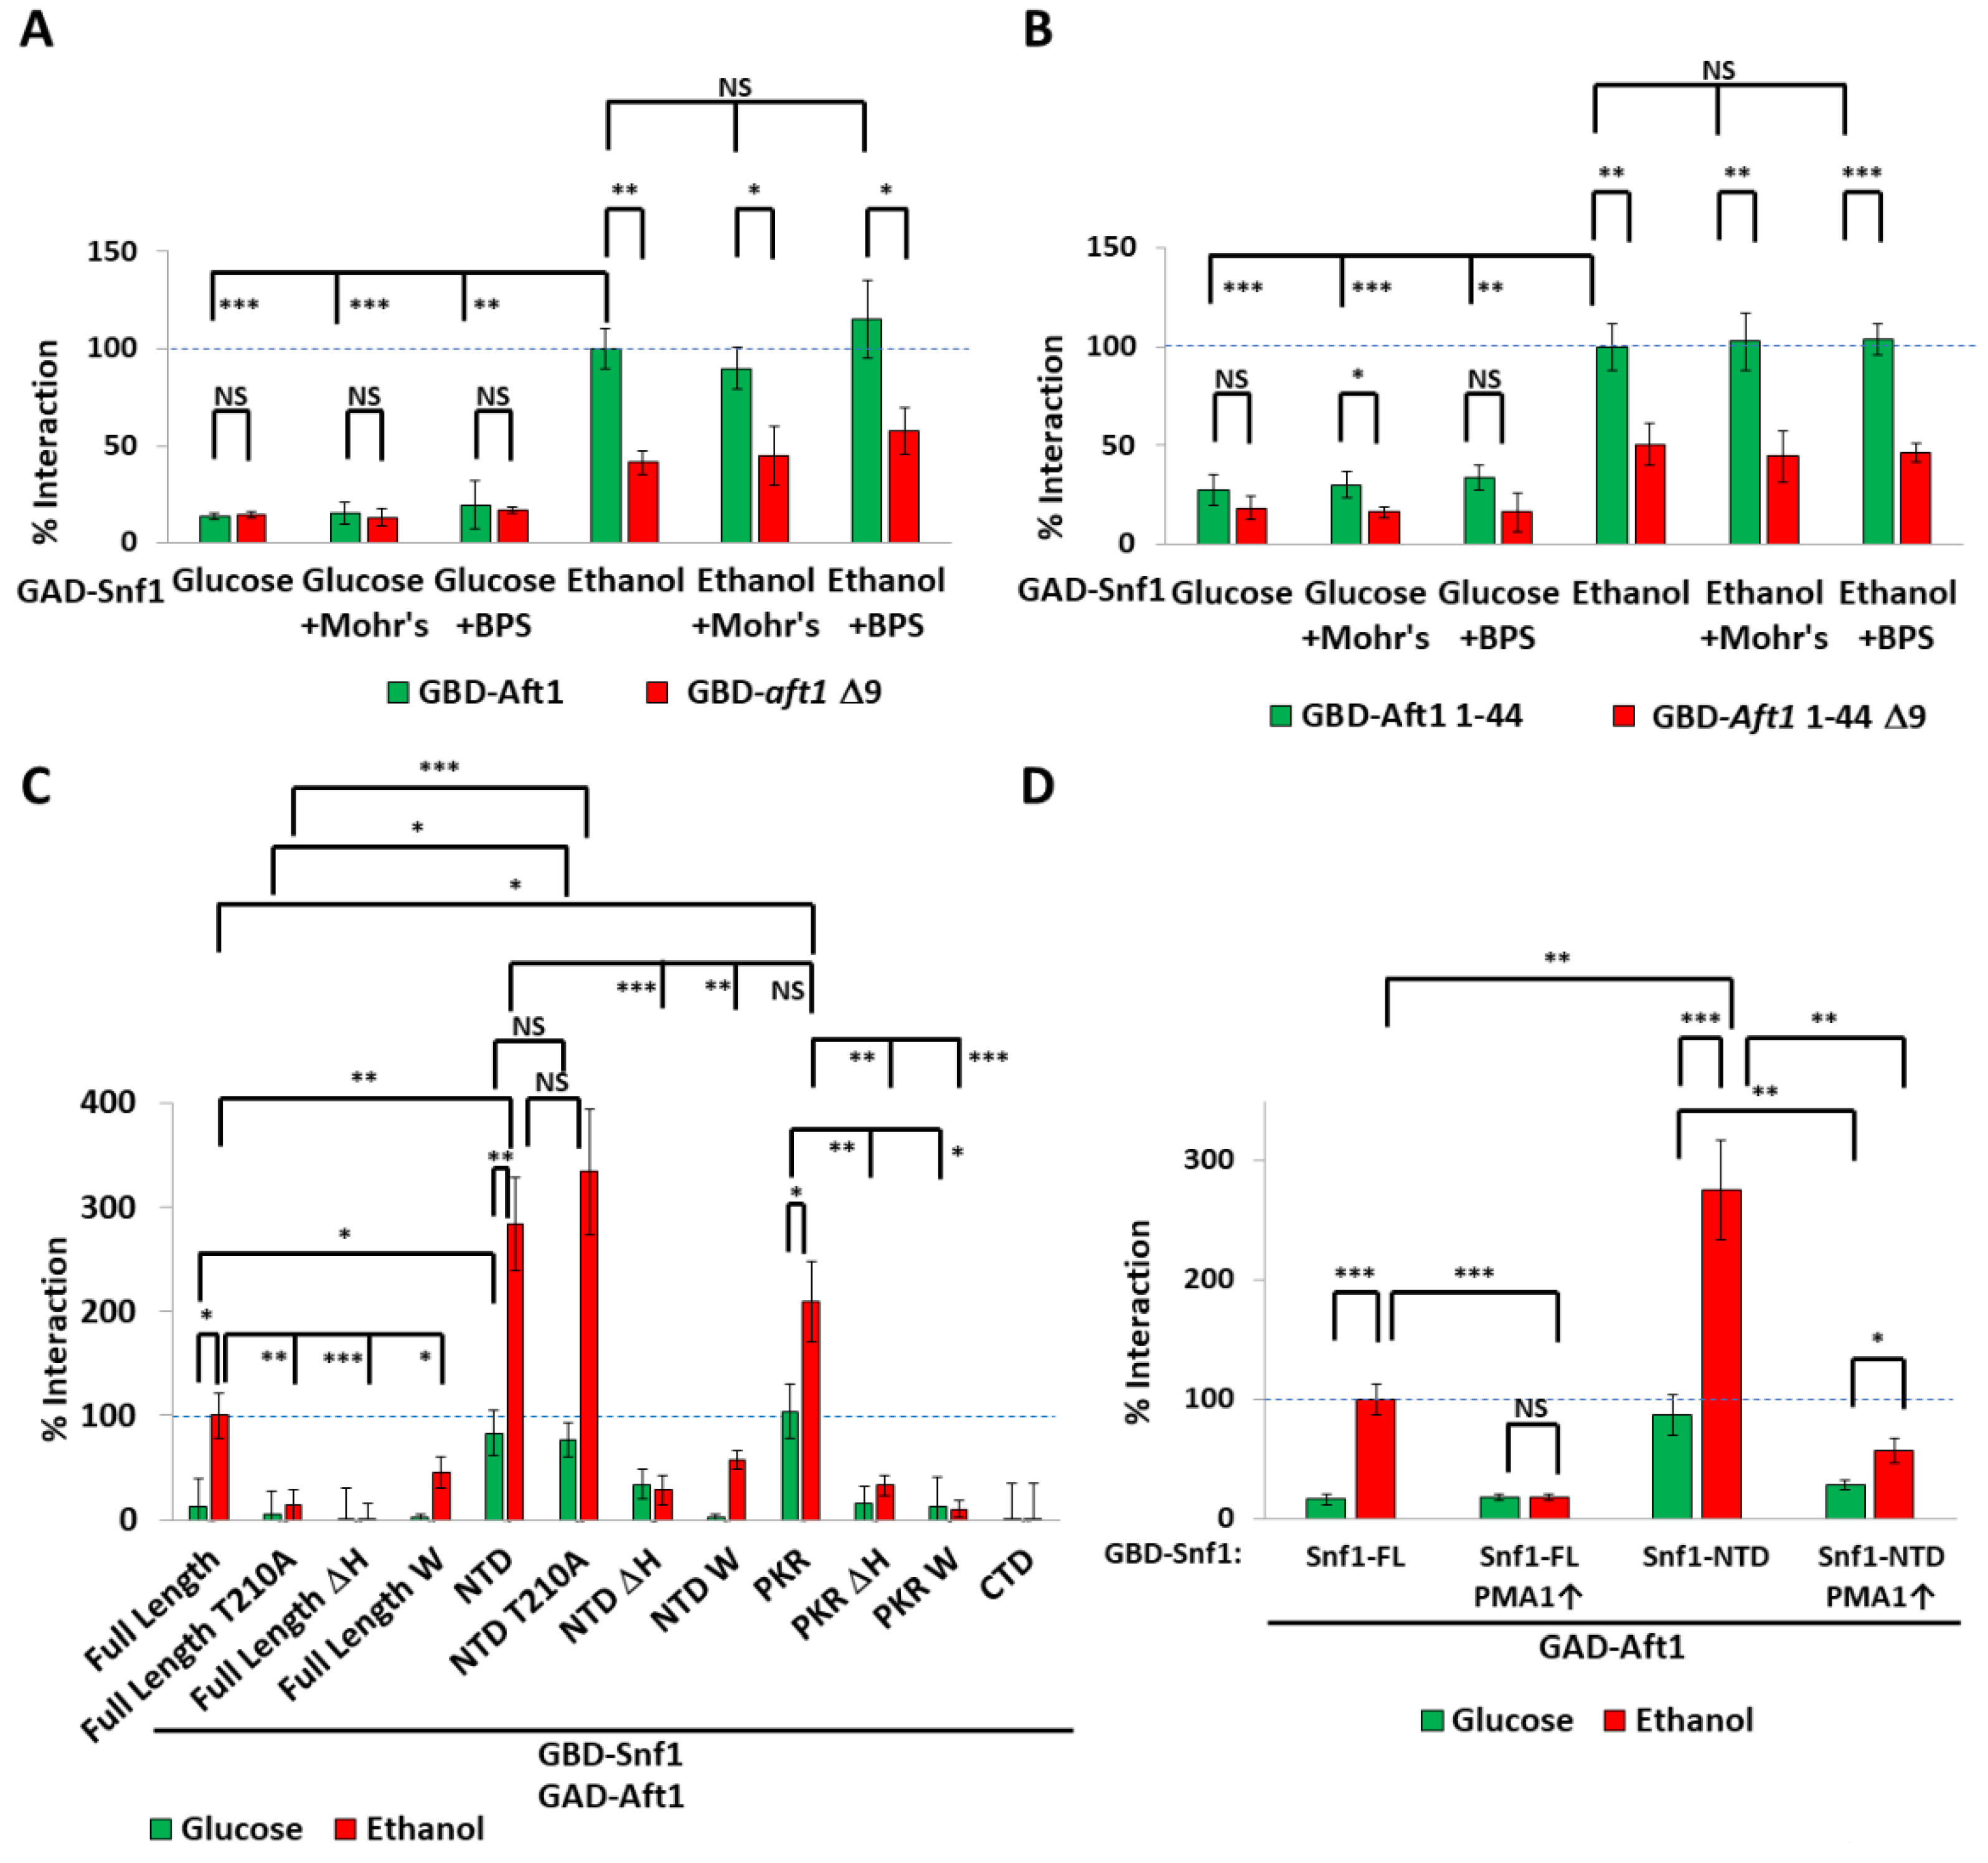
2.2. The Transcription Factor Aft1 Transmits a Low-Iron Signal to Snf1

Under conditions of sufficient iron–sulfur cluster production, iron–sulfur clusters are bound by two Grx3 or Grx4 proteins, and then one is swapped for Bol2. The Grx3/4-FeS cluster-Bol2 sandwich serves as an inhibitor of the Aft1 and Aft2 TFs [16,18,19,20,43] by causing dissociation from DNA [44], phosphorylation, and Msn5-mediated export from the nucleus [45]. We therefore examined the effects of deletion of the Aft TFs on ADH2 expression. The iron-sensing and DNA-binding parts of Aft2 are also present in Aft1, but Aft1 also possesses extended acidic, basic, and polyQ regions (Figure S2A). Deletion of AFT1, but not its paralogue AFT2, increased ADH2 expression in WT cells to the level seen in Snf1ΔH or Snf1A cells, whereas expression of the hyperactive and constitutively nuclear Aft11up allele as the sole copy of Aft1 diminished ADH2 expression but was suppressed by Snf1ΔH or Snf1A (Figure 2A). Deletion of AFT1 did not affect the interaction of Snf1 and Gal83 for Snf1WT, nor for hyperactive Snf1ΔH or Snf1A, and nor for Snf1W or Snf1Y which have attenuated activity and interaction (Figure 2B). This suggests that Aft1 (but not Aft2) transmits the low-iron signal to regulate of Snf1 activity (rather than direct iron–polyHIS interaction) but does not regulate the interaction between Snf1 and the β-subunits of the AMPK complex.
Ethanol is oxidized by Adh2 to acetylaldehyde, which is then oxidized by Ald2-6 to produce acetate (and either NADH or NADPH), which then is conjugated to coenzyme A (producing cytoplasmic acetyl-CoA) by Acs1 and Acs2. Even when cells are respiring ethanol, more acetate is produced than is consumed by conversion to acetyl-CoA [46]. Acetate is toxic and directly activates the Haa1 transcription factor [47] to induce expression of genes, such as YRO2 [48]. Haa1 localization has been used as a biosensor for external acetate [49] and we utilized the expression of YRO2 as a biosensor for both external and internal acetate [46] and thus also for ethanol catabolism [46]. As reported previously, wild-type cells produced and accumulated acetate (as measured by YRO2 expression) from both glucose and ethanol catabolism (both metabolic pathways produce acetylaldehyde), but not from oleate catabolism, which directly produces acetyl-CoA [46] (Figure 2C). Iron deprivation, as expected, clearly lowered YRO2 expression in wild-type cells. However, this was not observed in Snf1ΔH or aft1Δ cells (Figure 2C). This demonstrates that the lowering of the rate of ethanol catabolism by iron deprivation is regulated by Aft1 and the polyHIS tract of Snf1.
Since Aft1, but not Aft2, regulates Snf1 activity, we compared the protein sequences for different features (Figure S2A). We considered that the polyHIS tract, which is protonated in the absence of glucose [42], might interact with a cluster of negative polar or acidic residues. This hypothesis is supported by the increased ADH2 expression when Snf1PKR-R is overexpressed (Figure 1E), which could chelate an inhibitory negatively charged protein. Such a region is found between aa 16 and 24 (inclusive) of Aft1 (deleted in Aft1Δ9), with a more extended region stretching from aa 16 to 36 (inclusive) (deleted in Aft1Δ24). Both Aft1Δ9 and Aft1Δ24 are more active than wild-type Aft1, as determined by FET3 expression upon iron chelation by BPS (Figure S2B). This experiment was conducted in glucose medium since glucose starvation inhibits FET3 expression (Figure S2C). Overexpression of Aft1 decreased Snf1 activity (in a polyHIS-dependent manner), whereas deletion of the 9aa serine/threonine/acid stretch of Aft1 (AFT1Δ9) not only suppressed the overexpression of Aft1 but further increased Snf1 activity to that seen in snf1ΔH or aft1Δ cells (Figure 2D). Deletion of aa16–36 of Aft1 (AFT1Δ21) did not further increase Snf1 activity.
Yeast two-hybrid assay (whereby both proteins are constitutively nuclear) showed an ethanol-dependent interaction between Snf1 and Aft1, which was lowered (but not abolished) in Aft1Δ9 cells (Figure 3A). Aft11–44 was sufficient for interaction with Snf1, and this was diminished by deletion of amino-acids 16–24 (Aft11–44Δ9) (Figure 3B). Therefore, this negatively polar region of Aft1 is necessary and sufficient for interaction with Snf1. Elevated iron concentration or iron deprivation did not affect these interactions, suggesting that once Aft1 has entered the nucleus, iron no longer regulates the interaction of Aft1 and Snf1. Thus, the role of iron is to regulate the localization of Aft1. In contrast, the interaction of nuclear Aft1 and nuclear Snf1 is still regulated by carbon source.
Next, we determined which parts of Snf1 regulate the interaction with Aft1. The full-length Snf1 protein interacted with Aft1 in an ethanol-containing medium. The interaction required the polyHIS tract, since it was abolished by its deletion, and also required T210 phosphorylation (Figure 3C). The interaction of full-length Snf1 in glucose was about 15% of that in ethanol. Substitution of the 14 histidines for non-protonatable tryptophan likewise impeded Snf1/Aft1 interaction (Figure 3C).
Aft1 did not interact with the regulatory (CTD) domain of Snf1. Truncation of Snf1 to leave only the N-terminal domain (NTD) elevated the interaction levels in glucose and even more so in ethanol media. This was probably due to a loss of the competing β-subunit binding site in the regulatory domain of Snf1. This interaction was polyHIS-dependent, and substitution of the 14 histidines for non-protonatable tryptophan still impeded the Snf1NTD/Aft1 interaction. Interestingly, this interaction did not require T210 phosphorylation, indicating that once Snf1 is in the open conformation under respiratory conditions, T210 phosphorylation is not required (Figure 3C). The PKR alone was sufficient to interact with Aft1. This interaction was also elevated in ethanol media and required the polyHIS. Substitution of the 14 histidines for non-protonatable tryptophan still impeded the Snf1NTD/Aft1 interaction. Ethanol still resulted in greater Snf1/Aft1 interaction than glucose media, even when the CTD was absent, or when just amino acids 1–53 (the PKR) were present, and the interaction between Snf1 and Aft1 did not occur when the histidines were substituted with tryptophan (Figure 3C); protonation of the polyHIS to give it a positive charge is involved in the interaction of Snf1 with Aft1.
To determine whether intracellular pH regulation by Pma1 is involved in the interaction of Snf1 with Aft1, we hyper-activated Pma1 by deleting HSP30 and by truncating Pma1 (Pma1-Δ901) [42] to mimic the glucose state (which deprotonates the polyHIS tract). Hyper-activation of Pma1 lowered the Snf1FL/Aft1 interaction (Figure 3D). Since the polyHIS of Snf1FL interacts with the β-subunit binding site in the regulatory domain of Snf1 [42], we also used Snf1NTD, which does not have a β-subunit binding site to compete with Aft1 for polyHIS interaction. Hyper-activation of Pma1 dramatically lowered the Snf1NTD/Aft1 interaction (Figure 3D). Thus, it seems that not only does polyHIS protonation release the polyHIS tract from the β-subunit binding site in the regulatory domain of Snf1 [42], but the same protonation also enables the interaction of the polyHIS tract with Aft1.

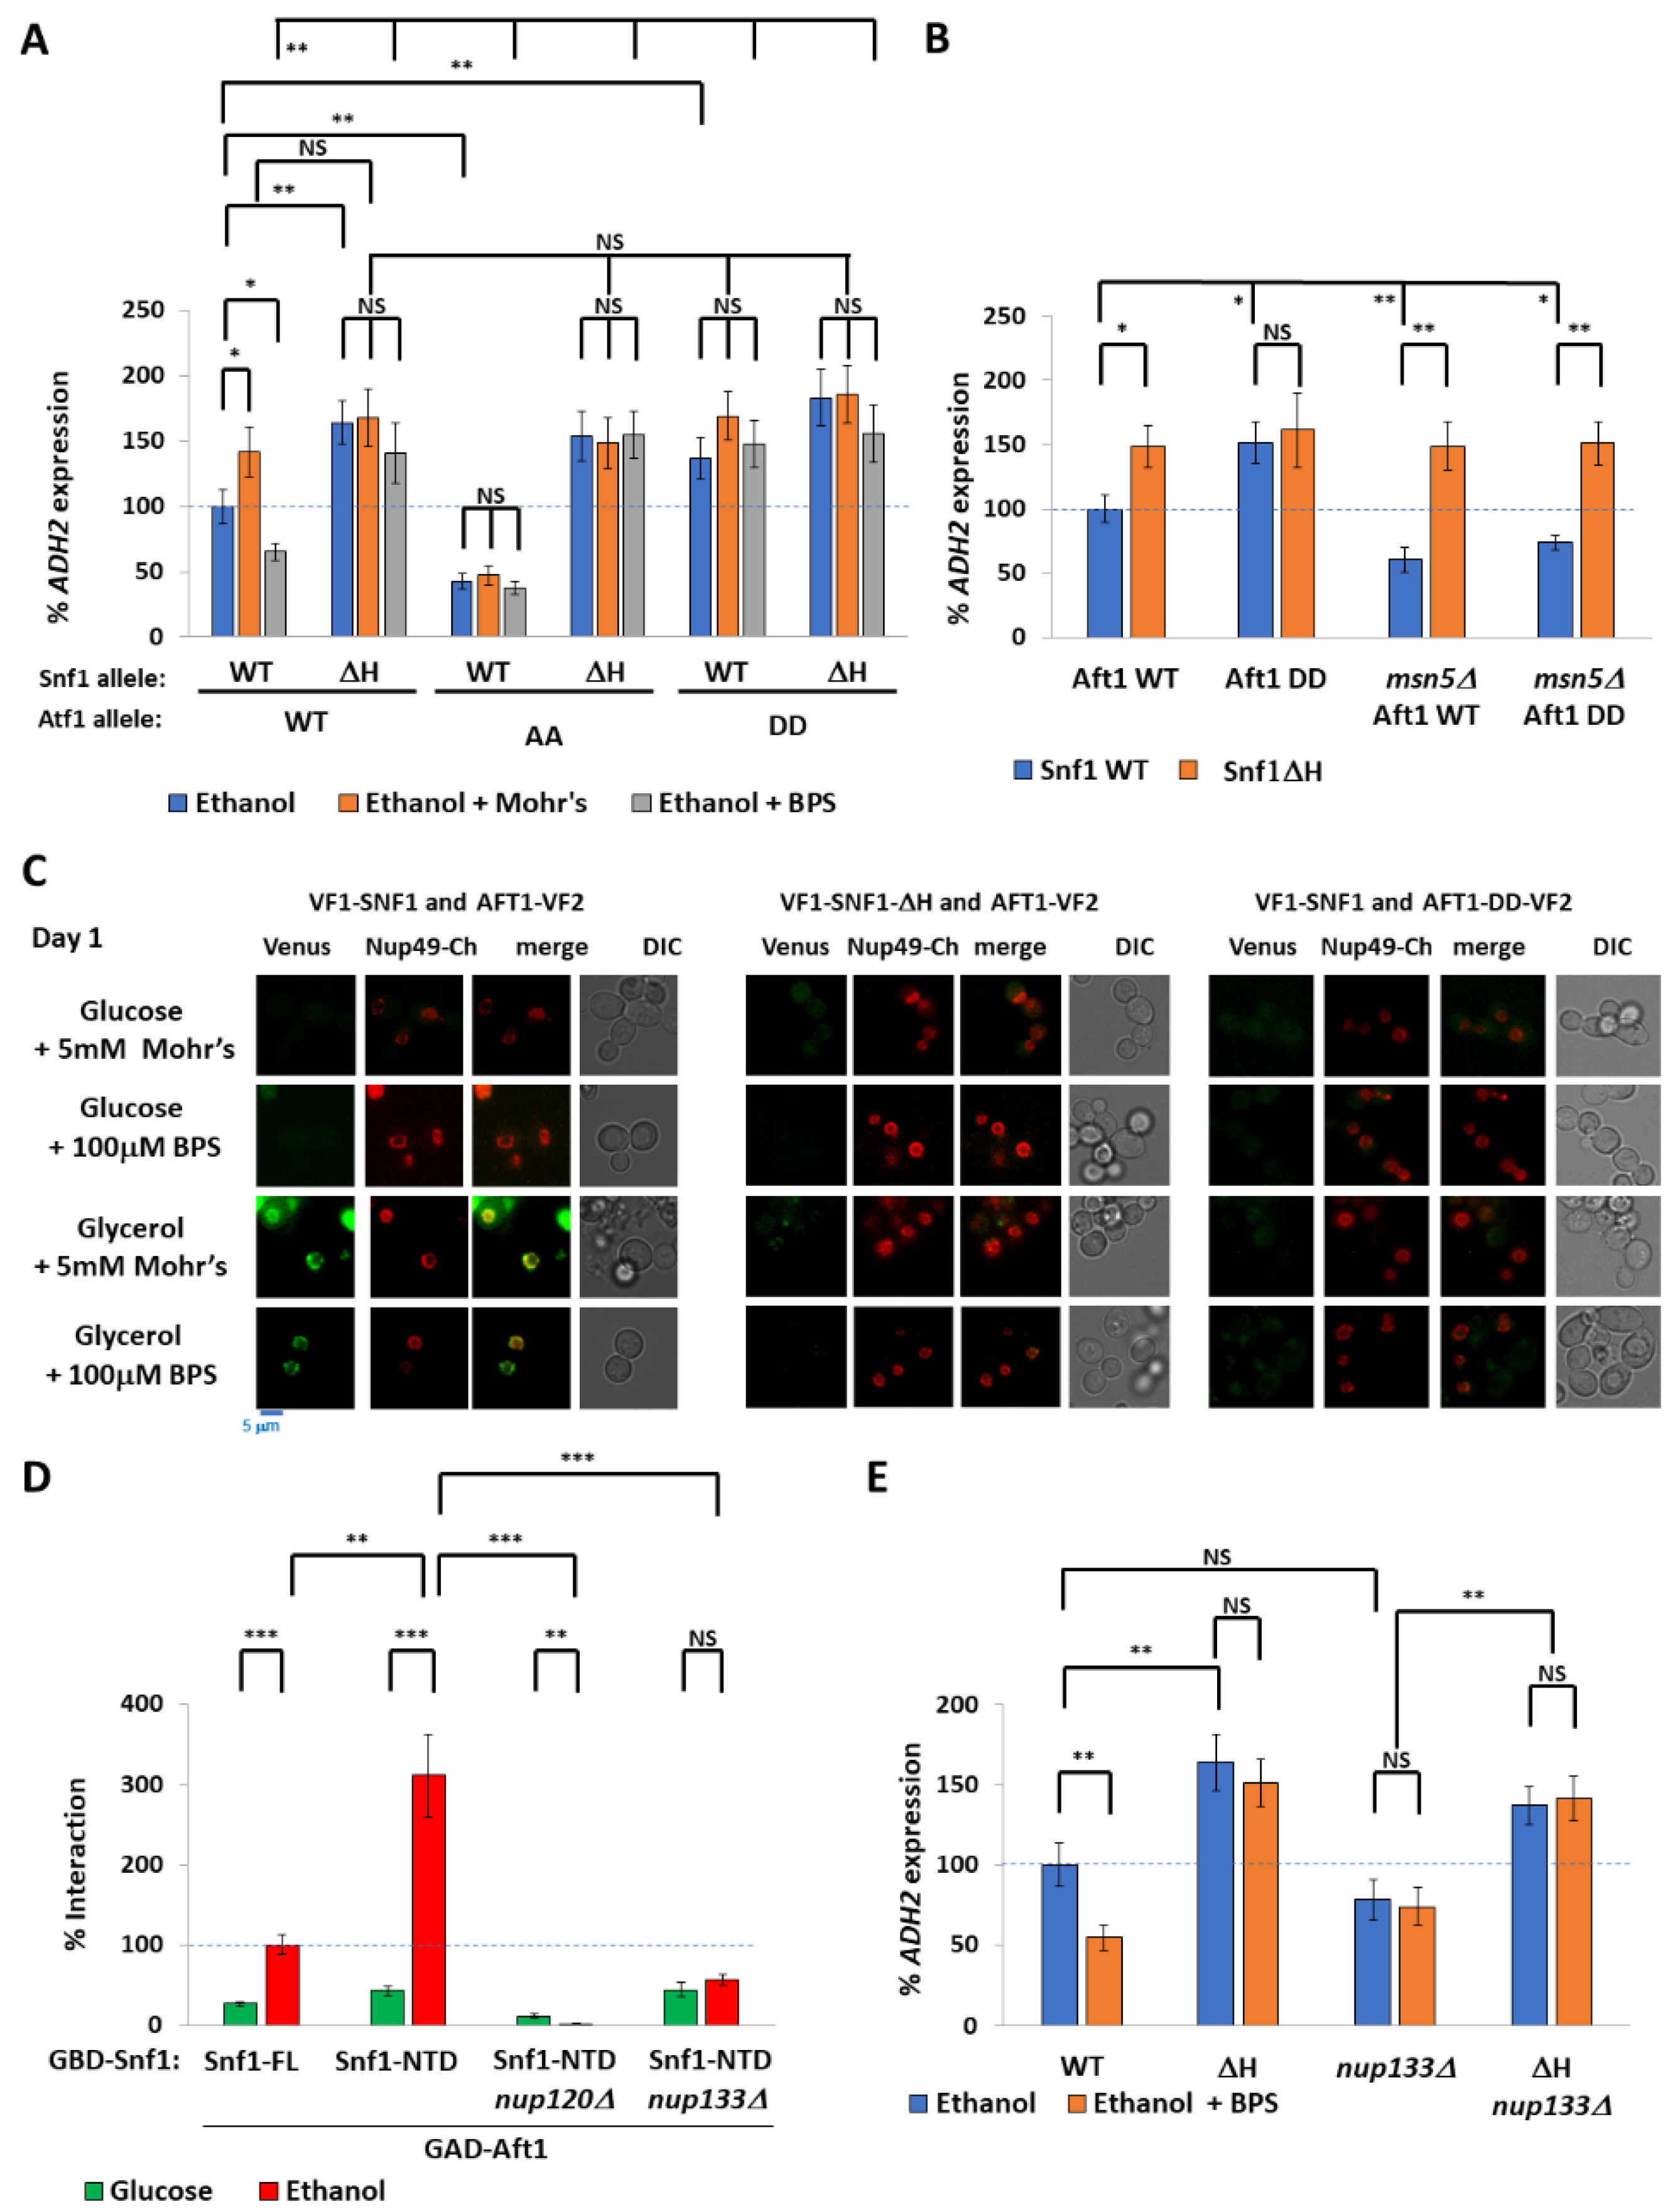
2.3. Nuclear Aft1 Inhibits Snf1

We have established that iron deprivation inhibits Snf1 (in a polyHIS-tract-dependent manner) and that the agent is the Aft1 transcription factor. The Hog1 kinase phosphorylates Aft1 at S210 and S224 to export Aft1 from the nucleus. This activity does not seem to be linked to the canonical Hog1 response to hyperosmolarity [50]. These sites were previously demonstrated to be dephosphorylated upon iron depletion, causing Aft1 relocalization into the nucleus [45]. We used a phospho-mimicking aspartate Aft1 mutant (Aft1SS210,224DD (hereafter referred to as Aft1DD) [45]) to determine the effects of excluding Aft1 from the nucleus upon ADH2 expression. Aft1DD increased ADH2 expression (Figure 4A) and is not additive with Snf1ΔH. Aft1DD also uncoupled ADH2 expression from iron concentrations (Figure 4A). Conversely, the nucleus-retained phospho-null Aft1S210A,S224A mutant (Aft1AA) decreased ADH2 expression. ADH2 expression in cells expressing aft1AA was not further diminished by BPS (Figure 4A). This suggests that it is nuclear Aft1 that inhibits Snf1, as opposed to the iron deficiency per se. As expected, the nuclear-retained Aft1AA shows increased FET3 expression, and the nuclear-excluded Aft1DD shows decreased FET3 expression (Figure S3A).
When sufficient iron is available, Aft1 dissociates from DNA [44] and undergoes phosphorylation and Msn5-mediated export from the nucleus [45]. We deleted MSN5 to determine whether phosphorylation of Aft1 suffices to prevent inhibition of Snf1, or whether the export of Aft1 from the nucleus is required. Deletion of MSN5 suppressed the increased ADH2 expression in Snf1WT cells but not Snf1ΔH cells (Figure 4B), showing that nuclear export of Aft1, rather than phosphorylation, lowers the inhibition of Aft1. This suggests that nuclear Aft1 inhibits Snf1.
Since both Snf1 and Aft1 are present throughout the cytoplasm (and the nucleus under appropriate conditions), we used a PCA Venus assay [51] to determine whether these proteins interact, under which conditions, and where this interaction occurs (Figure 4C). In this assay, interacting proteins tagged with two halves of a Venus fluorescent protein (VF1 and VF2) reconstitute an active Venus protein in an irreversible fashion, provided they are close enough [51]. snf1Δ aft1Δ cells expressing VF1-Snf1 and Aft1-VF2 were grown overnight in either glucose or glycerol with either 5 mM Mohr’s salt or 100 μM BPS and diluted the following morning in the same conditions. On the first day, glucose-grown cells did not show any interaction, whereas glycerol-grown cells showed a distinct interaction that colocalized with the nuclear pore marker Nup49-Cherry. This interaction occurred both in iron-rich and iron-limited media. On the second day, by which time glucose was exhausted, BPS-grown cells showed several foci of interaction (not at the nuclear membrane) but this did not occur in the presence of Mohr’s salt (Figure 4C and Figure S3B,C). In contrast, VF1-Snf1ΔH did not interact with Aft1-VF2 at the nuclear membrane in glycerol-grown cells; rather, under these conditions, cells had some cytoplasmic puncta similar to wild-type VF1-Snf1 interacting with Aft1-VF2 in glucose + BPS, and no interaction at all in glucose. Likewise, forcing Aft1-VF2 into the cytoplasm by using the Aft1DD-VF2 mutant also prevented interaction at the nuclear membrane with VF1-Snf1 (Figure 4C). Thus, the interaction between Aft1 and Snf1 is restricted to the nuclear membrane despite the proteins being both either cytoplasmic or nuclear (depending upon the conditions) and requires the polyHIS motif of the pre-kinase region of Snf1. Moreover, Aft1 must enter the nucleus (implying that the interaction occurs on the nucleoplasm side of the nuclear membrane), and the interaction is regulated by carbon source. This is somewhat reminiscent of Mig1 repressor activity requiring interaction with the nuclear pore complex components Nup120 and Nup133 [52]. Indeed, deletion of either Nup120 or Nup133 abolished the Snf1PKR/Aft1 interaction (we used Snf1NTD to prevent interference from the regulatory domain) (Figure 4D) and suppressed the reduction in ADH2 expression caused by iron deprivation (Figure 4E) showing that the Aft1/Snf1 interaction and inhibition of Snf1 requires intact nuclear pores.

2.4. Spatiotemporal Regulation of Snf1 by Iron

Some transcription factors regulated by Snf1 are nuclear (such as Adr1, irrespective of glucose status) [53] while others shuttle between the nucleus and cytoplasm, with nuclear distribution increasing in the absence of glucose (such as Mig1) [54]. The former require nuclear Snf1 for their regulation, whereas the latter can be regulated by Snf1 irrespective of the location of Snf1.
The beta subunits of the SNF1 complex regulate its localization [36], with Sip1 directing Snf1 to the vacuolar membrane, Sip2 to the plasma membrane, and Gal83 to the nucleus. We used this to control the localization of active Snf1, creating gal83Δ and sip1Δ sip2Δ strains whose active SNF1 is either excluded from the nucleus or nucleus-enriched [36], respectively. ADH2 expression in the absence of Gal83 was about one-quarter that of wild-type cells (note that this is sufficient for growth on poor carbon sources), and deletion of GAL83 suppressed the increased ADH2 expression of snf1ΔH cells, showing that nuclear Snf1 is indeed required for ADH2 expression. However, the remaining 25% of ADH2 expression in gal83Δ cells was independent of iron status (Figure 5A), suggesting that non-nuclear Snf1 is not iron-regulated. ADH2 expression was surprisingly decreased in sip1Δsip2Δ cells; the low ADH2 expression in these cells was still further decreased by iron deprivation and this was suppressed by Snf1ΔH (Figure 5A).
Expression of genes required for the metabolism of mono- and di-hexoses other than glucose or fructose, such as maltose (MAL), sucrose (SUC), and galactose (GAL), are repressed by Mig1 under glucose conditions. Indeed, SUC2 (invertase) can be considered the classic Snf1 and Mig1 target gene [52,55]. SUC2 expression was markedly higher in ethanol media compared with sucrose, but was not affected by deletion of GAL83, nor was it increased in Snf1ΔH. Depletion of iron did not affect SUC2 expression (Figure 5B). Indeed, when active Snf1 was restricted to the nucleus (sip1Δsip2Δ cells), SUC2 expression was increased and became iron- and polyHIS-regulated (Figure 5B,C). SUC2 expression in ethanol media was twice the level of the SUC2 expression in sucrose; however, the same expression pattern was observed. Thus, the enrichment of active Snf1 into the nucleus renders Mig1-regulated genes iron-regulated.

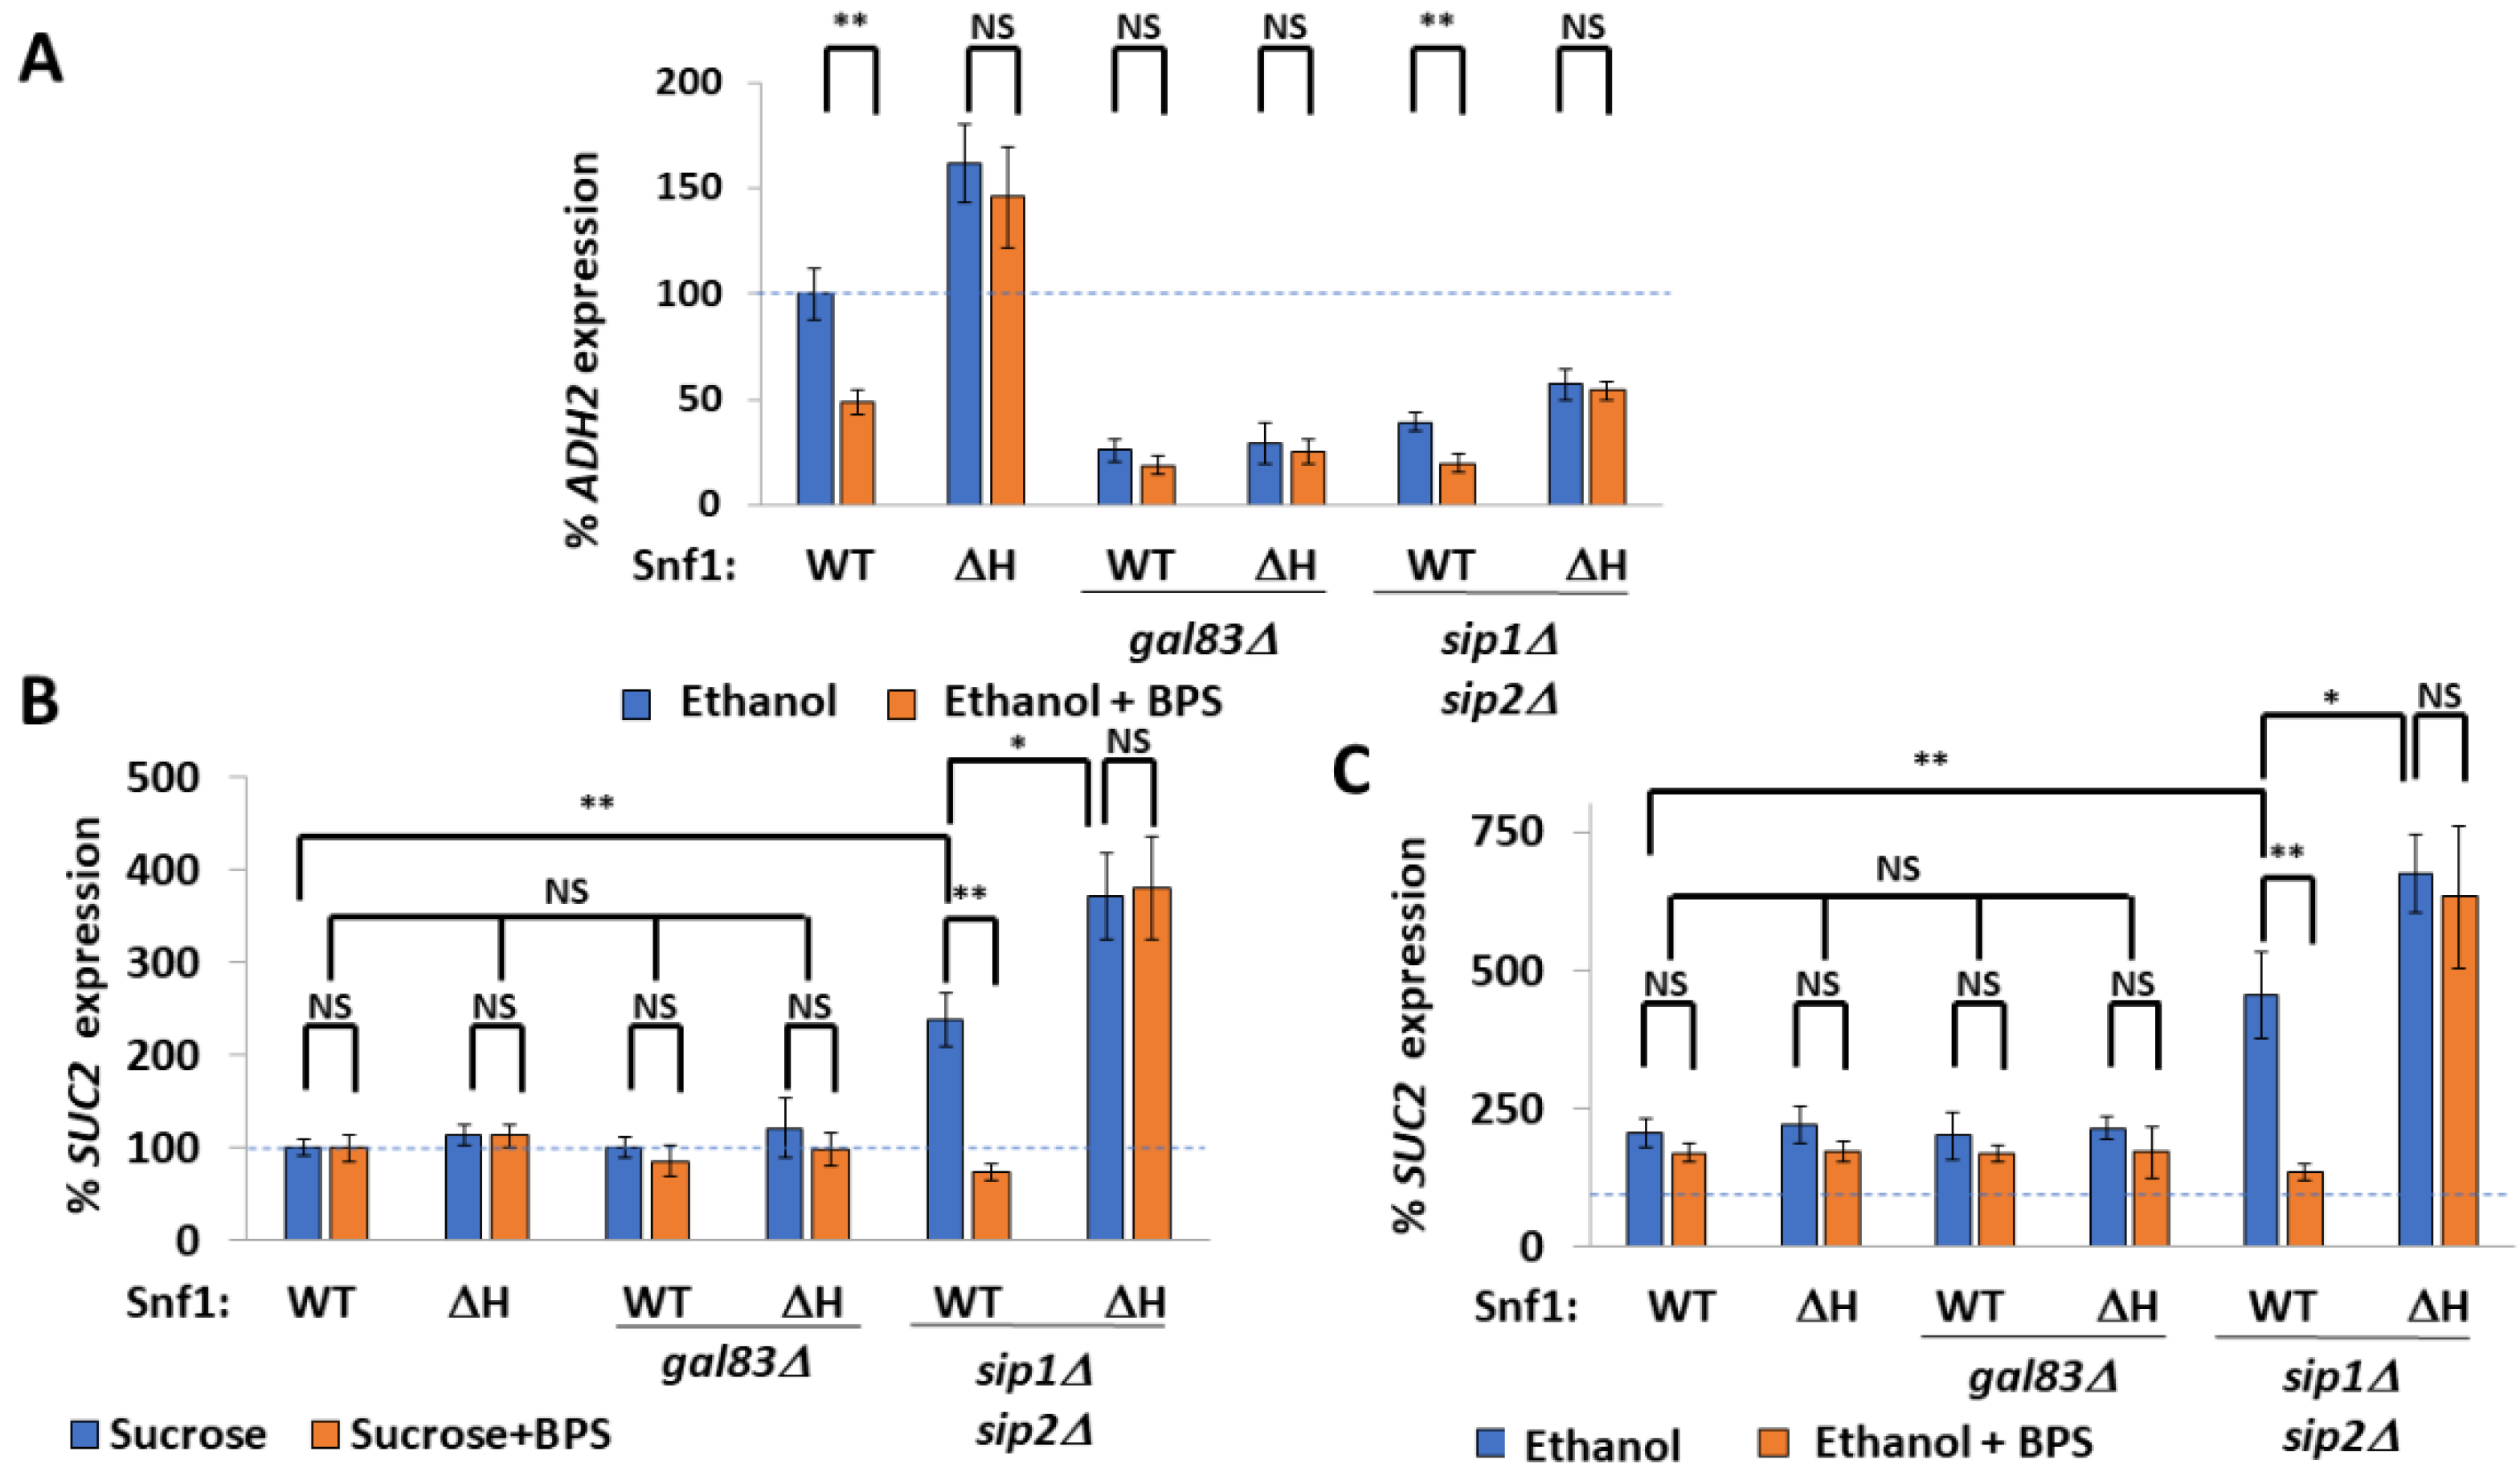
2.5. Non-Nuclear Snf1 Substrates Are Not Regulated by Iron Deprivation

In addition to regulating gene expression, cytoplasmic Snf1 also regulates metabolic enzymes (such as inhibiting Acc1—the first step of fatty acid synthesis [56]) and the stability of carbon transporters (such as inhibiting Jen1 (lactate/acetate importer) degradation in the vacuole [32,57]).
Cytoplasmic Snf1 phosphorylates the arrestin Rod1, preventing it from playing its role in the ubiquitylation of plasma membrane proteins, such as Jen1 by Rsp5 and their subsequent endocytosis and degradation in the vacuole [57]. Iron deprivation did not affect the phosphorylation of Rod1 upon transfer of cells from the glucose media to the ethanol media (Figure 6A), nor did the hyperactive alleles of Aft1—Aft1Δ9 (Figure 6A), Aft1AA (Figure 6B), the less-active Aft1DD (Figure 6C), or even the deletion of AFT1 (Figure 6D). Snf1ΔH did not affect the phosphorylation of Rod1 upon glucose deprivation either alone or in combination with the Aft1 mutants (Figure 6A–E).
Aft1 mutants that increase (Aft1AA) (Figure 6B) or decrease (Aft1DD) (Figure 6C) Aft1 activity by changing Aft1 localization did not affect Snf1 abundance. However, the Aft1Δ9 mutant (Figure 6A,E) which has reduced interaction with Snf1 (Figure 3A), or absence of Aft1 (Figure 6D), resulted in a decrease in Snf1 abundance. Similarly, Snf1ΔH was also expressed at lower levels than Snf1WT. Combining Snf1ΔH with Aft1 mutations did not further increase Snf1 instability (Figure 6B–E). This suggests that the interaction between Snf1 and Aft1 stabilizes Snf1.
We monitored the localization of Jen1-GFP (expressed from a GAL1 promoter). Whilst glucose addition caused the disappearance of Jen1-GFP from the plasma membrane, iron depletion did not affect Jen1-GFP localization (Figure 6F and Figure S4B). As expected, increasing Snf1 activity by deletion of REG1 or the deletion of the arrestin ROD1 stabilized Jen1 even in the presence of glucose (Figure 6F). Together, these results suggest that iron–sulfur cluster depletion only inhibits nuclear Snf1 activities while cytoplasmic Snf1 is not regulated by iron.

3. Discussion

We have discovered a mechanism by which carbon and iron metabolism are jointly coordinated. Under respiration conditions, the polyHIS tract in the progressive pH-sensing module (PSM) at the N-terminus of Snf1 is protonated and interacts with the N-terminus of nuclear Aft1.
Under conditions of iron–sulfur cluster limitation, Snf1-regulated genes involved in respiration can be considered as a competitor for scarce iron–sulfur clusters with other enzymatic processes (such as DNA replication and repair). It has previously been reported that low iron correlates with a downregulation of respiratory gene expression. Furthermore, reducing iron–sulfur cluster production by mutation of ISU1 increases the fermentation of xylose [58,59], and isu1 mutation shifts cells from respiration to fermentation [60]. The results in this paper provide evidence for the mechanism by which low iron causes the downregulation of respiration gene expression and ethanol catabolism via the interaction of Aft1 with the polyHIS tract of Snf1 (Figure 7).

3.1. The polyHIS Tract Has Different Interactions Depending upon Carbon Source and pH

We have previously identified an internal interaction of the deprotonated polyHIS tract with the β-subunit binding site in the regulatory domain of Snf1. This interaction inhibits Snf1 in response to cytoplasmic alkalization due to Pma1 activity in the presence of glucose [42]. We have now demonstrated that the protonated polyHIS tract (caused by cytoplasmic acidification following Pma1 downregulation due to glucose withdrawal) interacts with Aft1 (Figure 3C,D). The interaction between Snf1 and Aft1 requires the polyHIS tract to be freed from interaction with the regulatory domain, either by phosphorylation at T210 or by truncation of the regulatory domain (Figure 3C). However, the interaction between polyHIS and Aft1 can still be inhibited by Pma1 hyper-activation (Figure 3D). This multitasking of the polyHIS tract allows Snf1 to integrate diverse metabolic signals to effect an appropriate response to suboptimal environmental conditions

3.2. The polyHIS Tract Links Mitochondrial Status to Nuclear Gene Expression

Iron–sulfur cluster insufficiency results in Aft1 nuclear localization, and this same condition also lowers nuclear Snf1 activity (Figure 1A,B,D,E). Furthermore, cells expressing the constitutively active Aft1up allele fail to grow on respiratory media (glycerol) [61]. Under this dual condition of growth on poor carbon sources and iron deprivation, a nine amino acid negative polar motif of Aft1 interacts with the exposed polyHIS tract of Snf1 and thereby inhibits Snf1 activity (Figure 2D–F), thus linking the mitochondrial process of iron–sulfur cluster production to Snf1 activity. This interaction of Aft1 and Snf1 can only occur with active Snf1 in the nucleus since contact of the regulatory domain (aa 392-633) of Snf1 with the PSM (as occurs in inactive Snf1) downregulates the interaction with Aft1 (Figure 3C). Phosphorylation at T210 serves to activate and disengage the PSM from RD-β. If Snf1 is truncated so it lacks the RD (so only Snf1NTD is present), then phosphorylation at T210 is no longer required for the interaction of Aft1 with Snf1 (Figure 3C). Aft1 and RD-β are competitors for interaction with the PSM—but these interactions are also regulated by pH. Hence, unprotonated PSM (e.g., in high Pma1 activity, glucose) and Snf1W interact with RD-β [42], but protonated PSM (low Pma1 activity, ethanol) but not Snf1W interacts with Aft1 (Figure 3C,D). Thus, a single motif (polyHIS) engages in different interactions to integrate carbon and iron status.
This linkage of nuclear Snf1 activity to iron–sulfur cluster sufficiency serves at least two purposes: (1) to ensure that sufficient iron–sulfur clusters are available to support respiratory enzymatic activity and (2) to determine mitochondrial competency prior to activation of nuclear Snf1 by having the iron signal be a product of a mitochondrial process.

3.3. Restricted Localization of the Snf1-Aft1 Interaction

How does iron deprivation cause inhibition of Snf1? It is possible that free Aft1 is an inhibitor of Snf1, regardless of its localization. We forced Aft1 to be nuclear via three different mechanisms: Aft1AA (Figure 4A), deletion of MSN5 (Figure 4B), or GBD-Aft1 (Figure 1E)]. In all three cases the interaction with, and inhibition of, Snf1, occurs independently of the iron availability. Furthermore, Aft1DD still inhibited Snf1 in msn5Δ cells (Figure 4B), showing that it is the export of Aft1 from the nucleus, as opposed to its phosphorylation, that prevents Aft1 from inhibiting Snf1.
The nuclear pore complex is increasingly seen as an organizing center for protein–protein and protein–DNA interactions. For example, double-strand break repair takes place at the inner nuclear membrane side of the nuclear pore [62,63]. The repair of sub-telomeric double-strand breaks is also dependent on both Nup120 and Nup133 by anchoring telomeres to the nuclear membrane [64]. The interaction of Mig1 with its targets also requires Nup120 and Nup133 [52]. Although (in respiration with low-iron conditions) both Aft1 and Snf1 are found throughout the cell, the interaction between them occurs at the nuclear membrane (Figure 4C), requiring Nup120 and Nup133 (Figure 4D), and the absence of NUP133 uncouples the regulation of ADH2 expression by iron (Figure 4E). The interaction between Aft1 and Snf1 occurs at the nuclear membrane and is regulated by carbon source, but not by iron availability (Figure 4C). However, nuclear import of Aft1 is required for the inhibition of Snf1 activity.

3.4. Spatial Regulation of Snf1 by Iron

Although ADH2 expression is inhibited by iron deprivation in a PSM-dependent manner (Figure 1A) and requires Gal83 (nuclear Snf1) (Figure 5A), SUC2 expression is iron-independent and polyHIS-tract-independent (Figure 5B,C). This also confirms prior results [41] using invertase (Suc2) activity as a reporter for Snf1, which stated that deletion of the polyHIS tracts does not decrease invertase activity. SUC2 expression is also Gal83-independent (Figure 5B,C).
The remaining 25% of ADH2 expression observed in gal83 cells is also polyHIS- and iron-independent (Figure 5A); therefore, exclusion of Snf1 from the nucleus prevents low-iron-induced inhibition of Snf1. In contrast, SUC2 expression in the cytoplasm is normally neither iron- nor polyHIS-regulated, but upon deletion of both SIP1 and SIP2, SUC2 expression is elevated and becomes both low-iron- and polyHIS-regulated (Figure 5B,C).
While Adr1 and Cat8, which regulate ADH2 expression, are nuclear, Mig1, which regulates SUC2 expression, is both nuclear and cytoplasmic. Indeed, Gal83 remains cytoplasmic during the growth of cells on sucrose (or galactose) [36]. In the discussion from Vincent et al. 2001 [36], there is speculation as to whether differential localization of Snf1 might allow a difference in response under different environmental conditions. Our results show that only nuclear Snf1 is inhibited by iron deprivation via Aft1, whereas Mig1-regulated genes are iron-independent. Other cytoplasmic roles of Snf1, such as the inhibition of Rod1 (Figure 6A–E) and thus retention of the Rod1 target Jen1 at the plasma membrane (Figure 6F), are also unaffected by iron deprivation. This temporal–spatial mechanism of Snf1 inhibition by iron deprivation permits the Snf1-dependent fermentation of carbon sources, such as galactose, sucrose, and maltose, even under low-iron conditions, while inhibiting the iron-intense respiration of poor carbon sources, such as glycerol, lactate, or ethanol.

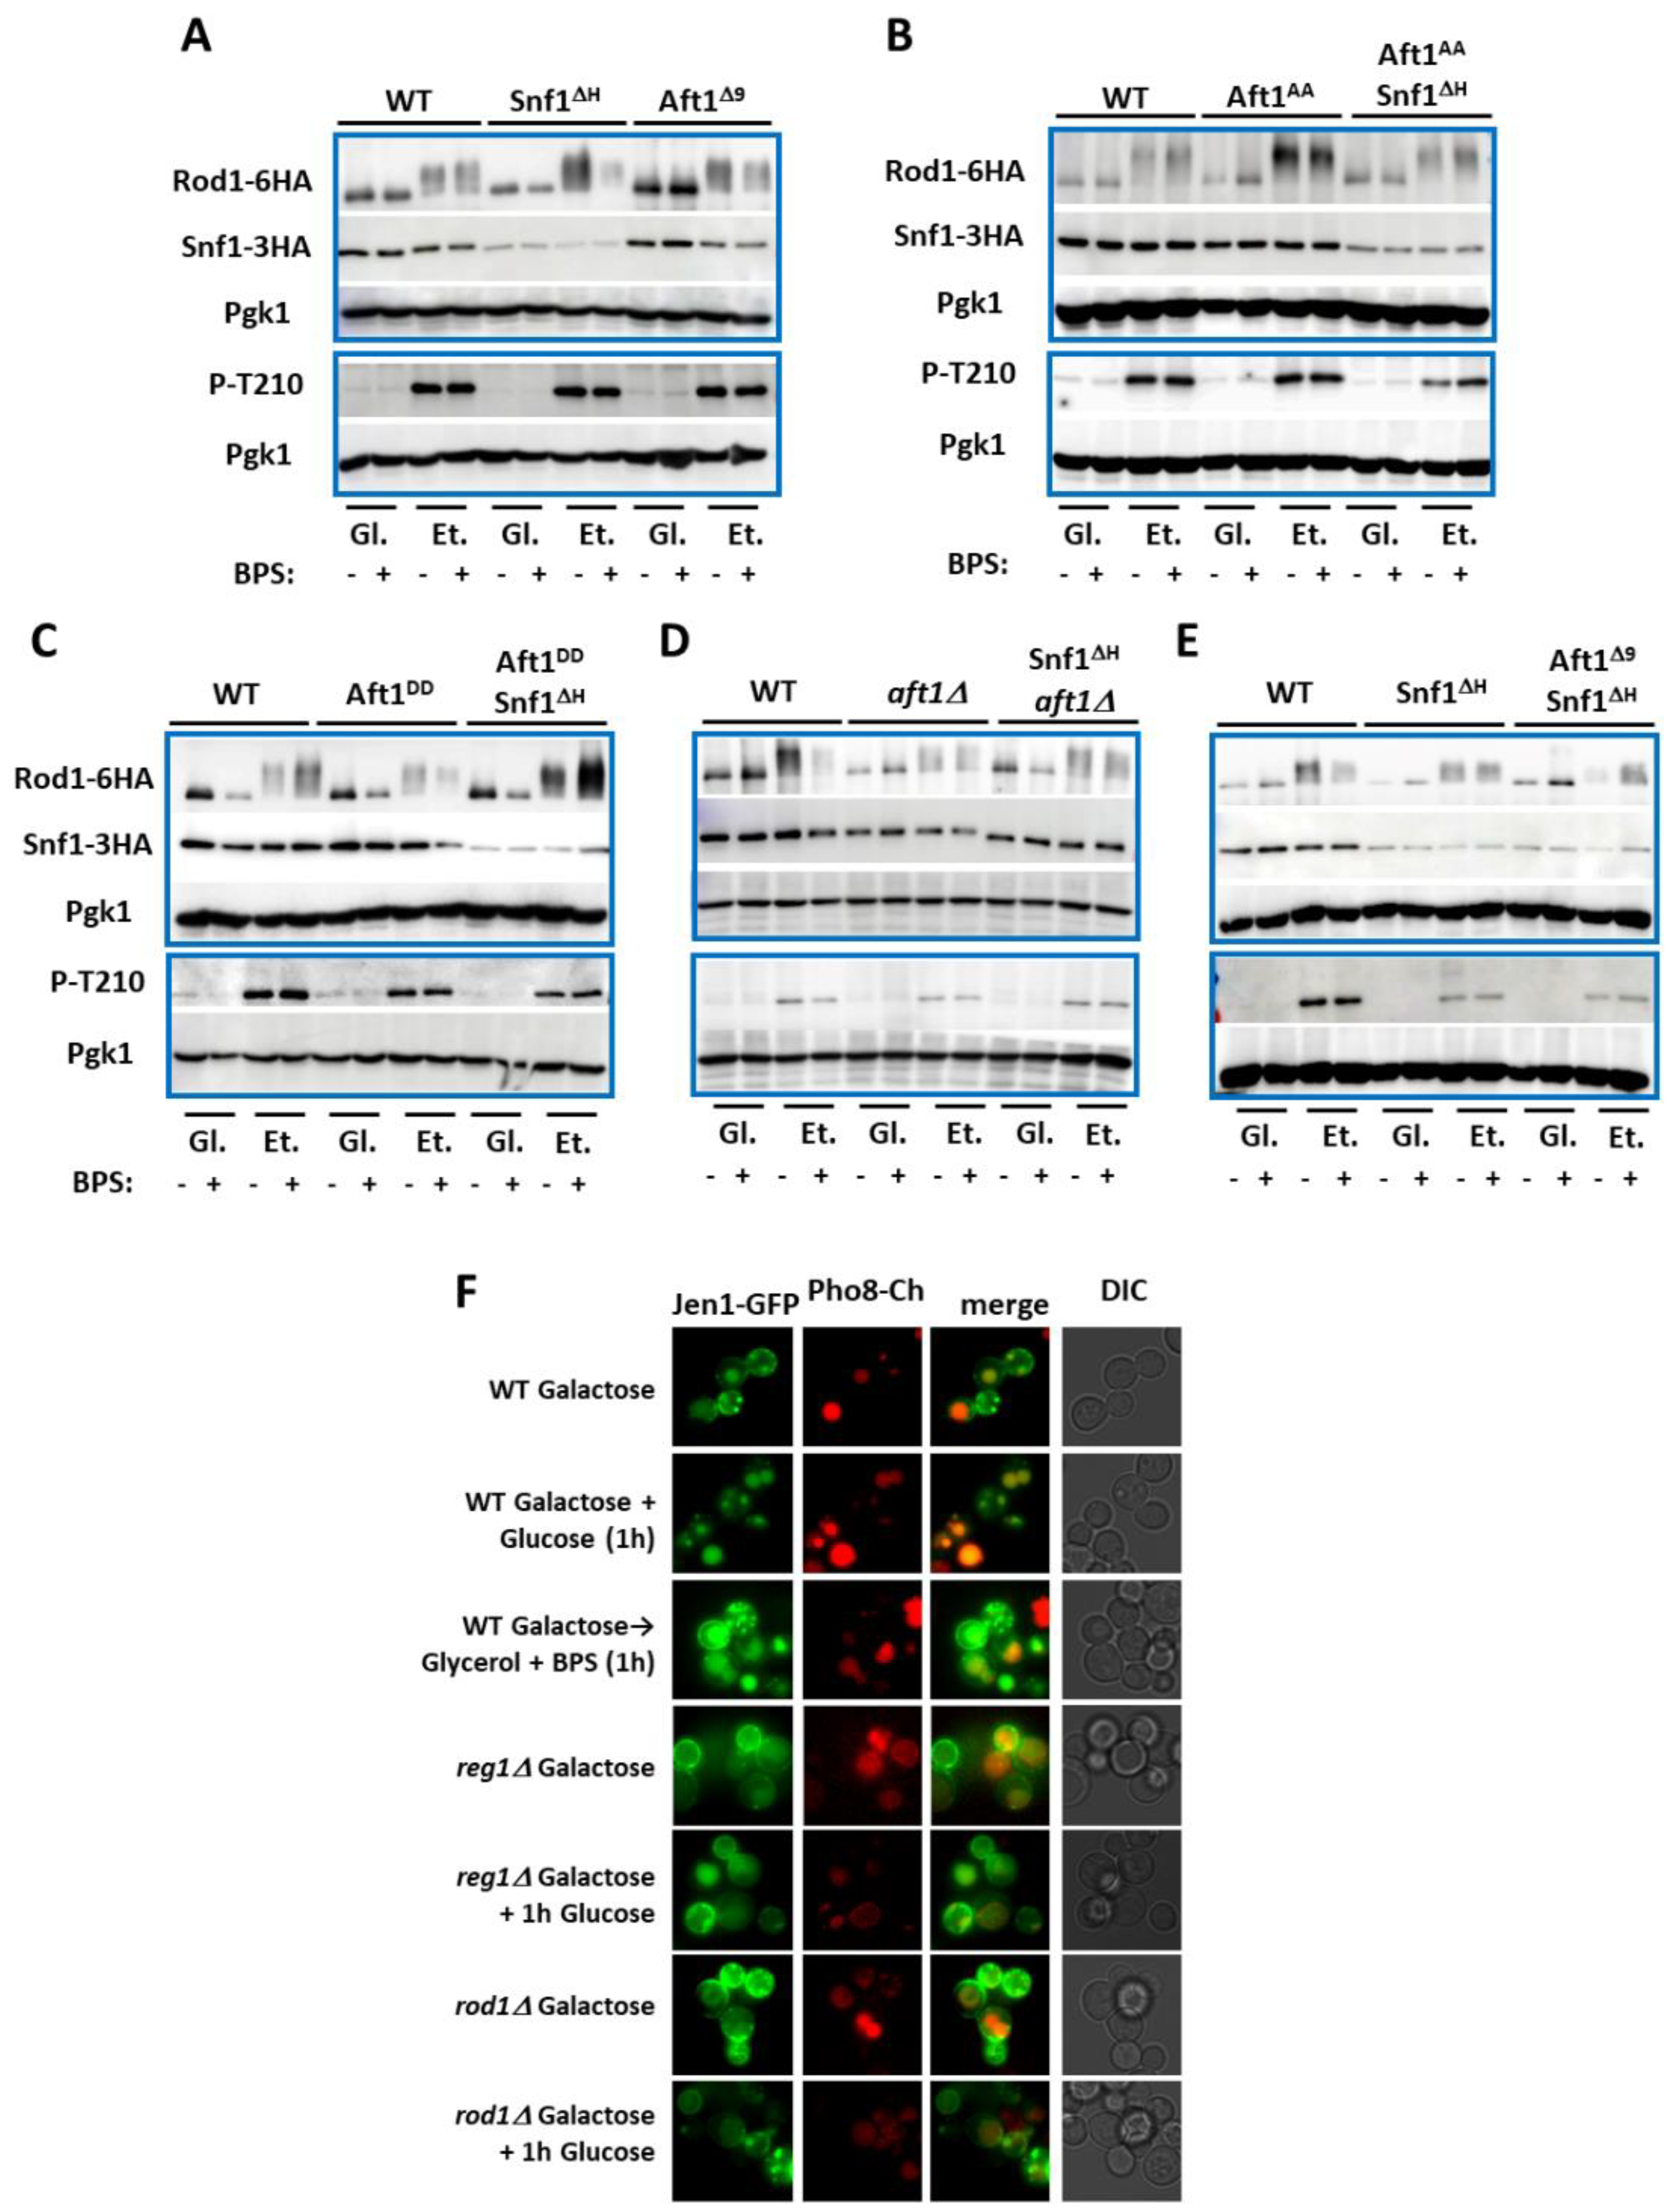
3.5. Atf1 Regulates Snf1 Stability

Snf1 is unstable in the absence of Ubp8 in the presence of cycloheximide due to ubiquitylation of SUMOylated Snf1 [65]. Here, we observe that Snf1ΔH is found at 25% of the levels of Snf1WT (Figure 1C, Figure 6A,E, and Figure S1B) and yet is three times more phosphorylated at T210 (Figure 1C, Figure 6A,E, and Figure S1D). This instability is due to a lack of interaction with Aft1, since Snf1 abundance is lowered in aft1Δ or Aft1Δ9 (in ethanol) cells but not Aft1AA or Aft1DD cells. Deletion of both the polyHIS tract and the 9 amino acid Snf1-interacting motif of Aft1 does not further destabilize Snf1. Indeed, the transfer of Aft1Δ9 cells from glucose to ethanol media rapidly results in Snf1 destabilization (within 30 min) (Figure 6A). This instability of Snf1 is iron-independent. Thus, Aft1 regulates Snf1 protein levels (iron independent) and activity (iron dependent). Excessive Snf1 activity is toxic—the lethality of deletion of two phosphatase components that inactivate Snf1 (Reg1 and Sit4) is rescued by a further deletion of SNF1 [66]. Our results suggest that Aft1 is also involved in the control of Snf1 toxicity, and this mechanism provides a safety brake whereby excessive Snf1 activity (toxicity) is countered by decreased Snf1 stability.

3.6. Iron and the Diauxic Shift

Glucose exhaustion (diauxy) has been reported to activate Aft1 to induce expression of five iron-regulon genes (FET3, FTR1, TIS11, SIT1, and FIT2) [67]. This requires Snf1, but SNF1 is not responsible for Aft1 phosphorylation under these conditions [67,68]. Although growing cells ab initio in glycerol results in an interaction of Snf1 and Aft1 and the inhibition of Aft1, this interaction does not occur under conditions of glucose exhaustion (Figure 4C and Figure S3B,C). This may be due to other metabolites or metabolic signaling taking place during glucose exhaustion. Indeed, glycerol-grown cells failed to express FET3 following iron depletion (Figure S2C). Furthermore, iron sufficiency has also been reported for passage through the diauxic shift [69] and inhibition of iron-cluster production promotes fermentation over respiration [58,59,60]. Iron deficiency also impairs mitochondrial function through Cth2, which targets specific mRNAs involved in respiration for degradation [61]. Iron deficiency lowers the rate of conversion of ethanol to acetate (Figure 2C). Thus, this work demonstrates that iron and Snf1 signaling are tightly coordinated to reduce futile adverse communication.

3.7. Comparison with Other Species

The pathogenic yeast Candida glabrata possess a low-iron Aft1/2 transcription response system similar to that of S. cerevisiae, albeit with additional pathways also found in other Candida species [70]. Since CgSnf1 also contains a polyHIS tract in its PKR of 12 contiguous histidines [42], and CgAft1 has an acidic region at aa61–67 (EELTEEE), a similar regulation of CgSnf1 by CgAft1 would be expected. More broadly, iron and carbon metabolism are linked throughout all kingdoms, with iron deprivation leading to an inhibition of the Krebs cycle enzyme synthesis by the sRNA RyhB in E. coli, forcing cells to ferment rather than respire [71,72]. Similarly, iron deprivation leads to a shutdown of the Krebs cycle in Mycobacterium tuberculosis [73].
Iron overload results in reactive oxygen species generation due to the Fenton reaction. Iron in the bound form of ferritin is elevated in the brains of Huntington’s Chorea patients, especially in the basal ganglia, where it is associated with disease progression [74]. Excessive iron has been mechanistically implicated in the deleterious biochemistry of neurons in Parkinson’s disease, where it not only generates ROS but also induces α-synuclein accumulation [75] and dopamine oxidation [76]. Iron overload is also a driving cause of metabolic syndrome and Type II Diabetes [77]. Mice fed a high-iron diet exhibit increased AMPK T172 phosphorylation (equivalent to T210 in S. cerevisiae Snf1) and increased phosphorylation of the Snf1 target Acc1 both in skeletal muscle and liver [78]. Iron overload activates the LKB1 kinase (which phosphorylates Snf1 at T172) by increasing SIRT1 activity, resulting in de-acetylation of LKB1 [78]. Thus, lowered protein acetylation (indicative of low acetyl-CoA levels) stimulates AMPK to increase acetyl-CoA production, and iron overload locks this feedback loop as active. Elevated activation of AMPK by excess iron (determined both by T172 phosphorylation and Acc1 phosphorylation) has also been reported in mesenchymal stromal cells and is implicated in Myelodysplastic Syndrome. High, dysregulated AMPK activity in these cells results in mitochondrial fragmentation and apoptosis [79]. On the other hand, iron deprivation inhibits isoproterenol-induced lipolysis in 3T3-L1 adipocytes [80]. Thus, in both mammals and yeast, iron is an activator of AMPK/Snf1, whereas in mammalian cells iron overload indirectly activates the activating kinase of AMPK, in yeast iron prevents the inhibition of Snf1 by the Aft1 transcription factor. Furthermore, in bacteria, yeasts, and mammals, iron deprivation leads to an inhibition of respiratory processes.

4. Materials and Methods

4.1. Resource Availability

4.1.1. Lead Contact

Further information and requests for strains and plasmids should be directed to and will be fulfilled by the lead contact Martin Kupiec (martin.kupiec@gmail.com).

4.1.2. Materials Availability

All materials generated in this study are available on request to the lead contact.

4.1.3. Data and Code Availability

Any additional information required to reanalyze the data reported in this paper is available from the lead contact upon request. This paper does not report original code.

4.2. Experimental Model and Subject Details

Yeasts, Plasmids, and Growth Conditions

Experiments were conducted using S. cerevisiae. DH5a bacteria were used for plasmid propagation and standard procedures. Strains used are listed in Table 1; plasmids used are listed in Table 2. Oligonucleotides used for mutagenesis of Snf1, Aft1, and Pma1 are listed in Table 3. All strains are related to W303a, except for PJ694, which was used for yeast 2-hybrid assays. Yeasts were transformed with DNA using the frozen lithium acetate method [81]. The construction of poly-amino acid substitutions in Snf1 and the exchange of selective markers in plasmids was by gap repair [82] and PCR.
All yeast strains are in the W303 background, except PJ694 (for yeast 2-hybrid assays).
All oligonucleotides were ordered from Sigma. Desalted, no purification. Upon receipt they were resuspended to 100 μM in 5 mM Tris (pH 8.5). Primers marked with an asterisk were phosphorylated using phosphonucleotide kinase before use.
PMA1 (from −934 of promoter to +834 of 3′UTR) was inserted into the multiple cloning site of pRS313 and pRS314. The final 18 codons were truncated using Phusion PCR. Four or eight histidines were inserted into plasmid 847 using Phusion PCR. Primers were phosphorylated before use with polynucleotide kinase.
Standard sugar concentrations were 4% for glucose (to ensure complete repression of the ADH2 promoter), 3% for glycerol, and 2% for ethanol, unless stated differently. For ADH2 and SUC2 expression assays, cells were grown in 4% glucose to ensure complete repression of expression, washed 3× with water, and resuspended in media containing 2% ethanol or 2% sucrose as indicated. Cells were grown at 30 °C. Bathophenanthrolinedisulfonate (BPS) was added at 100 μM (from 100 mM stock); Mohr’s salt (ferrous ammonium sulphate) was added at 5 mM concentration (from 0.5M stock).

4.3. Method Details

4.3.1. β-Galactosidase Assays for Gene Expression

β-galactosidase assays were performed using log phase cells. Cells containing prADH2 or SUC2::LacZ plasmids were grown overnight in 4% glucose synthetic defined medium, diluted in the morning, and grown for an additional 3 h. A sample was taken for measuring (t = 0) and cells were washed 3× with 25 mL water before resuspension in the indicated medium. After 3 h, β-galactosidase activity was measured. For YRO2 expression experiments, cells were grown for 18 h with the indicated carbon source (and 100 μM BPS where indicated). Cell concentration was determined by reading 100 μL of cells at 595 nm. An amount of 20 μL of cells was added to the β-galactosidase reaction mix (40 μL YPER (Pierce 78990), 80 μL Z-buffer (120 mM Na2HPO4, 80 mM NaH2PO4, 20 mM KCl, 2 mM MgSO4), 24 μL ONPG (4 mg/mL), 0.4 μL β-mercaptoethanol) and incubated at 30 °C for 15 min. Reactions were stopped by the addition of 54 μL 1M Na2CO3. The Eppendorf tubes were centrifuged for 1 min at full speed to pellet the cell debris, and 200 μL supernatant was removed, and absorbance was read at 415 nm using a microplate reader. Miller Units were calculated by the equation Miller Units = (1000 × A415)/(time × volume of cells × A595 − 0.055, where the A415 and A595 has been corrected for blanking and path length (final path length = 1 cm). The expression was calculated as a rate of Miller Unit increase per hour and normalized as a percentage of the expression rate in WT cells (=100). For prFET3::LacZ experiments, this is in glucose medium with 100 μM BPS, for prADH2::LacZ experiments, this is in ethanol medium. Typically, in wild-type cells, ADH2 is expressed at 1000 Miller Units per hour in ethanol medium and barely expressed in glucose medium, SUC2 at 50 Miller Units/hour in sucrose and at 100 Miller Units/hour in ethanol medium. FET3 is typically expressed at 20 Miller Units per hour in glucose media, increasing to 200 Miller Units per hour upon addition of 100 μM BPS. Three biological replicates were measured. Error bars are mean ±1 standard deviation. t-tests were performed using GraphPad t-test calculator. NS = not significant, * = p ≤ 0.05, ** = p ≤ 0.01, *** = p ≤ 0.001.

4.3.2. Yeast 2-Hybrid Experiments

S. cerevisiae strain PJ694 or PJ694 hsp30Δ was transformed with the indicated plasmids expressing proteins or protein fragments fused to either GAD or GBD and PMA1-Δ901 where indicated. Cells were grown overnight in indicated medium and diluted in the morning with the same medium for an additional 3 h before β-galactosidase activity was determined as above. Error bars are mean ±1 standard deviation. t-tests were performed using GraphPad t-test calculator. NS = not significant, * = p ≤ 0.05, ** = p ≤ 0.01, *** = p ≤ 0.001.

4.3.3. Western Blots

Cells were grown overnight in 4% glucose, diluted in the morning to 20 mL, and grown for an additional three hours. Two 5 mL samples of glucose grown cells were removed—to one 5 μM BPS was added. The remaining 10 mL was centrifuged (4000 rpm, 1 min) and cells were washed 2× with 25 mL water and resuspended in 10 mL of 2% ethanol medium. This was also divided into two and one sample treated with 5 μM BPS. After 30 min, cells were harvested and protein-solubilized in sample buffer by the method developed by the Kuchin group to prevent activation of Snf1 by centrifugation [88]. Cells were boiled for 5 min before resuspension in 1× TE and treatment with 0.2M NaOH. Sample buffer volume was adjusted to give equal OD for all samples (30 μL/OD) and cells were boiled for 5 min. After running samples on 8% polyacrylamide gels, the proteins were wet-transferred to nitrocellulose membranes. Antibodies used were mouse α-pgk1 (Abcam, Cambridge, UK) for a loading control, mouse α-HA (Santa Cruz, Dallas, TX, USA), and rabbit α-phospo-T172 (AMPK) (Cell Signalling Technology, Danvers MA, USA), all at 1/1000 dilution. Secondary antibodies were conjugated to HRP. Images were minimally processed using ImageJ. Snf1 abundance and phosphorylation was quantified using data from Figure 1C and Figure 6A,E. Both Snf1 abundance and T210 phosphorylation was normalized to WT cells in Ethanol (set W303a00%). t-tests were performed using GraphPad t-test calculator. NS = not significant, * = p ≤ 0.05, ** = p ≤ 0.01, *** = p ≤ 0.001.

4.3.4. Microscopy

An amount of 5 μL of log phase cells was imaged using an EVOS microscope (60× objective) with the GFP filter for GFP, YFP filter for Venus/YFP, and the Texas Red filter for Cherry. The dimensions of each panel correspond to 20 μm × 20 μm. Cells were not concentrated before imaging to prevent perturbations to Snf1 activity [89]. Images were processed using the brightness/contrast function of Image J, to give a black background. For statistics, over 300 cells were counted. Experiments were repeated at least three times on different days. All figures shown in the manuscript are of identical magnification, a size bar is provided in Figure 3C.

4.3.5. Jen1-GFP Visualization

Cells were grown overnight in glycerol medium and Jen1-GFP expression was induced by the addition of 2% galactose for 4 h. Cells were washed 3× and resuspended in either 2% glucose or 3% glycerol + 0.1 mM BPS medium to determine whether iron chelation causes internalization of Jen-GFP in the same way as glucose. Whilst glucose can be added to galactose to repress GAL promoters (and thus prevent Jen1-GFP expression), when cells were treated with Glycerol + 0.1 mM BPS the galactose had to be washed away (indicated by an arrow) to prevent further Jen1-GFP expression. Rod1Δ and reg1Δ are included as known controls that do not internalize Jen-GFP in glucose media.

Supplementary Materials

The following supporting information can be downloaded at https://www.mdpi.com/article/10.3390/ijms24021368/s1.

Author Contributions

Conceptualization, K.J.S.-L. and M.K.; formal analysis, K.J.S.-L. and M.K.; investigation, K.J.S.-L.; writing—original draft preparation, K.J.S.-L.; writing—review and editing, K.J.S.-L. and M.K.; visualization, K.J.S.-L.; supervision, M.K.; project administration, M.K.; funding acquisition, M.K. All authors have read and agreed to the published version of the manuscript.

Funding

This research was funded by the Israel Science Foundation, grant number 140/18, the Israel Cancer Research Fund, grant 458, the Minerva Stiftung, grant #238.

Institutional Review Board Statement

Not applicable.

Informed Consent Statement

Not applicable.

Data Availability Statement

Not applicable.

Acknowledgments

We thank all members of the Kupiec lab for support and ideas. We thank Marion Carlson, Elton Young, Michael Lisby, Sergei Kuchin, Daniel Markgraf, Sebastien Leon, Tom Stevens, and Vitor Costa for strains and plasmids.

Conflicts of Interest

The authors declare no conflict of interest.

References

  1. Askwith, C.C.; de Silva, D.; Kaplan, J. Molecular biology of iron acquisition in Saccharomyces cerevisiae. Mol. Microbiol. 1996, 20, 27–34. [Google Scholar] [CrossRef] [PubMed]
  2. Kwast, K.E.; Burke, P.V.; Poyton, R.O. Oxygen sensing and the transcriptional regulation of oxygen-responsive genes in yeast. J. Exp. Biol. 1998, 201, 1177–1195. [Google Scholar] [CrossRef] [PubMed]
  3. Craven, R.J.; Mallory, J.C.; Hand, R.A. Regulation of iron homeostasis mediated by the heme-binding protein Dap1 (damage resistance protein 1) via the P450 protein Erg11/Cyp51. J. Biol. Chem. 2007, 282, 36543–36551. [Google Scholar] [CrossRef] [PubMed] [Green Version]
  4. Deng, Y.; Zhong, F.; Alden, S.L.; Hoke, K.R.; Pletneva, E.V. The K79G Mutation Reshapes the Heme Crevice and Alters Redox Properties of Cytochrome c. Biochemistry 2018, 57, 5827–5840. [Google Scholar] [CrossRef]
  5. Hansberg, W.; Salas-Lizana, R.; Domínguez, L. Fungal catalases: Function, phylogenetic origin and structure. Arch. Biochem. Biophys. 2012, 525, 170–180. [Google Scholar] [CrossRef]
  6. Puig, S.; Ramos-Alonso, L.; Romero, A.M.; Martínez-Pastor, M.T. The elemental role of iron in DNA synthesis and repair. Metallomics 2017, 9, 1483–1500. [Google Scholar] [CrossRef] [Green Version]
  7. Martínez-Pastor, M.T.; de Llanos, R.; Romero, A.M.; Puig, S. Post-Transcriptional Regulation of Iron Homeostasis in Saccharomyces cerevisiae. Int. J. Mol. Sci. 2013, 14, 15785–15809. [Google Scholar] [CrossRef]
  8. Becker, T.; Franckenberg, S.; Wickles, S.; Shoemaker, C.J.; Anger, A.M.; Armache, J.-P.; Sieber, H.; Ungewickell, C.; Berninghausen, O.; Daberkow, I.; et al. Structural basis of highly conserved ribosome recycling in eukaryotes and archaea. Nature 2012, 482, 501–506. [Google Scholar] [CrossRef]
  9. Li, L.; Jia, X.; Ward, D.M.; Kaplan, J. Yap5 protein-regulated transcription of the TYW1 gene protects yeast from high iron toxicity. J. Biol. Chem. 2011, 286, 38488–38497. [Google Scholar] [CrossRef] [Green Version]
  10. Li, L.; Kaplan, J.; Ward, D.M. The glucose sensor Snf1 and the transcription factors Msn2 and Msn4 regulate transcription of the vacuolar iron importer gene CCC1 and iron resistance in yeast. J. Biol. Chem. 2017, 292, 15577–15586. [Google Scholar] [CrossRef]
  11. Raguzzi, F.; Lesuisse, E.; Crichton, R.R. Iron storage in Saccharomyces cerevisiae. FEBS Lett. 1988, 231, 253–258. [Google Scholar] [CrossRef] [PubMed] [Green Version]
  12. Portnoy, M.E.; Liu, X.F.; Culotta, V.C. Saccharomyces cerevisiae expresses three functionally distinct homologues of the nramp family of metal transporters. Mol. Cell. Biol. 2000, 20, 7893–7902. [Google Scholar] [CrossRef]
  13. Courel, M.; Lallet, S.; Camadro, J.-M.; Blaiseau, P.-L. Direct activation of genes involved in intracellular iron use by the yeast iron-responsive transcription factor Aft2 without its paralog Aft1. Mol. Cell. Biol. 2005, 25, 6760–6771. [Google Scholar] [CrossRef] [PubMed] [Green Version]
  14. Ros-Carrero, C.; Ramos-Alonso, L.; Romero, A.M.; Bañó, M.C.; Martínez-Pastor, M.T.; Puig, S. The yeast Aft1 transcription factor activates ribonucleotide reductase catalytic subunit RNR1 in response to iron deficiency. Biochim. Biophys. Acta Gene Regul. Mech. 2020, 1863, 194522. [Google Scholar] [CrossRef] [PubMed]
  15. Puig, S.; Askeland, E.; Thiele, D.J. Coordinated remodeling of cellular metabolism during iron deficiency through targeted mRNA degradation. Cell 2005, 120, 99–110. [Google Scholar] [CrossRef] [PubMed] [Green Version]
  16. Ojeda, L.; Keller, G.; Muhlenhoff, U.; Rutherford, J.C.; Lill, R.; Winge, D.R. Role of glutaredoxin-3 and glutaredoxin-4 in the iron regulation of the Aft1 transcriptional activator in Saccharomyces cerevisiae. J. Biol. Chem. 2006, 281, 17661–17669. [Google Scholar] [CrossRef] [PubMed] [Green Version]
  17. Li, H.; Mapolelo, D.T.; Dingra, N.N.; Naik, S.G.; Lees, N.S.; Hoffman, B.M.; Riggs-Gelasco, P.J.; Huynh, B.H.; Johnson, M.K.; Outten, C.E. The yeast iron regulatory proteins Grx3/4 and Fra2 form heterodimeric complexes containing a 2Fe-2S cluster with cysteinyl and histidyl ligation. Biochemistry 2009, 48, 9569–9581. [Google Scholar] [CrossRef] [Green Version]
  18. Kumánovics, A.; Chen, O.S.; Li, L.; Bagley, D.; Adkins, E.M.; Lin, H.; Dingra, N.N.; Outten, C.E.; Keller, G.; Winge, D.; et al. Identification of FRA1 and FRA2 as genes involved in regulating the yeast iron regulon in response to decreased mitochondrial iron-sulfur cluster synthesis. J. Biol. Chem. 2008, 283, 10276–10286. [Google Scholar] [CrossRef] [Green Version]
  19. Martínez-Pastor, M.T.; Perea-García, A.; Puig, S. Mechanisms of iron sensing and regulation in the yeast Saccharomyces cerevisiae. World J. Microbiol. Biotechnol. 2017, 33, 75. [Google Scholar] [CrossRef] [Green Version]
  20. Poor, C.B.; Wegner, S.V.; Li, H.; Dlouhy, A.C.; Schuermann, J.P.; Sanishvili, R.; Hinshaw, J.R.; Riggs-Gelasco, P.J.; Outten, C.E.; He, C. Molecular mechanism and structure of the Saccharomyces cerevisiae iron regulator Aft2. Proc. Natl. Acad. Sci. USA 2014, 111, 4043–4048. [Google Scholar] [CrossRef]
  21. Hamza, A.; Baetz, K. Iron-responsive transcription factor Aft1 interacts with kinetochore protein Iml3 and promotes pericentromeric cohesin. J. Biol. Chem. 2012, 287, 4139–4147. [Google Scholar] [CrossRef] [PubMed] [Green Version]
  22. Kang, C.-M.; Kang, S.; Park, Y.-S.; Yun, C.-W. Physical interaction between Sit1 and Aft1 upregulates FOB uptake activity by inhibiting protein degradation of Sit1 in Saccharomyces cerevisiae. FEMS Yeast Res. 2015, 15, fov080. [Google Scholar] [CrossRef] [PubMed] [Green Version]
  23. Andreadis, C.; Nikolaou, C.; Fragiadakis, G.S.; Tsiliki, G.; Alexandraki, D. Rad9 interacts with Aft1 to facilitate genome surveillance in fragile genomic sites under non-DNA damage-inducing conditions in S. cerevisiae. Nucleic Acids Res. 2014, 42, 12650–12667. [Google Scholar] [CrossRef] [PubMed] [Green Version]
  24. Ghillebert, R.; Swinnen, E.; Wen, J.; Vandesteene, L.; Ramon, M.; Norga, K.; Rolland, F.; Winderickx, J. The AMPK/SNF1/SnRK1 fuel gauge and energy regulator: Structure, function and regulation. FEBS J. 2011, 278, 3978–3990. [Google Scholar] [CrossRef] [PubMed]
  25. Ratnakumar, S.; Kacherovsky, N.; Arms, E.; Young, E.T. Snf1 controls the activity of adr1 through dephosphorylation of Ser230. Genetics 2009, 182, 735–745. [Google Scholar] [CrossRef] [Green Version]
  26. Charbon, G.; Breunig, K.D.; Wattiez, R.; Vandenhaute, J.; Noël-Georis, I. Key Role of Ser562/661 in Snf1-Dependent Regulation of Cat8p in Saccharomyces cerevisiae and Kluyveromyces lactis. Mol. Cell. Biol. 2004, 24, 4083–4091. [Google Scholar] [CrossRef] [Green Version]
  27. Zhou, H.; Winston, F. NRG1 is required for glucose repression of the SUC2 and GAL genes of Saccharomyces cerevisiae. BMC Genet. 2001, 2, 5. [Google Scholar] [CrossRef]
  28. Treitel, M.A.; Kuchin, S.; Carlson, M. Snf1 protein kinase regulates phosphorylation of the Mig1 repressor in Saccharomyces cerevisiae. Mol. Cell. Biol. 1998, 18, 6273–6280. [Google Scholar] [CrossRef] [Green Version]
  29. Woods, A.; Munday, M.R.; Scott, J.; Yang, X.; Carlson, M.; Carling, D. Yeast SNF1 is functionally related to mammalian AMP-activated protein kinase and regulates acetyl-CoA carboxylase in vivo. J. Biol. Chem. 1994, 269, 19509–19515. [Google Scholar] [CrossRef]
  30. DeMille, D.; Badal, B.D.; Evans, J.B.; Mathis, A.D.; Anderson, J.F.; Grose, J.H. PAS kinase is activated by direct SNF1-dependent phosphorylation and mediates inhibition of TORC1 through the phosphorylation and activation of Pbp1. Mol. Biol. Cell 2015, 26, 569–582. [Google Scholar] [CrossRef]
  31. Nicastro, R.; Tripodi, F.; Gaggini, M.; Castoldi, A.; Reghellin, V.; Nonnis, S.; Tedeschi, G.; Coccetti, P. Snf1 Phosphorylates Adenylate Cyclase and Negatively Regulates Protein Kinase A-dependent Transcription in Saccharomyces cerevisiae. J. Biol. Chem. 2015, 290, 24715–24726. [Google Scholar] [CrossRef] [PubMed] [Green Version]
  32. Llopis-Torregrosa, V.; Ferri-Blázquez, A.; Adam-Artigues, A.; Deffontaines, E.; van Heusden, G.P.H.; Yenush, L. Regulation of the Yeast Hxt6 Hexose Transporter by the Rod1 α-Arrestin, the Snf1 Protein Kinase, and the Bmh2 14-3-3 Protein. J. Biol. Chem. 2016, 291, 14973–14985. [Google Scholar] [CrossRef] [PubMed] [Green Version]
  33. Hong, S.-P.; Leiper, F.C.; Woods, A.; Carling, D.; Carlson, M. Activation of yeast Snf1 and mammalian AMP-activated protein kinase by upstream kinases. Proc. Natl. Acad. Sci. USA 2003, 100, 8839–8843. [Google Scholar] [CrossRef] [PubMed] [Green Version]
  34. Ruiz, A.; Xu, X.; Carlson, M. Ptc1 protein phosphatase 2C contributes to glucose regulation of SNF1/AMP-activated protein kinase (AMPK) in Saccharomyces cerevisiae. J. Biol. Chem. 2013, 288, 31052–31058. [Google Scholar] [CrossRef] [Green Version]
  35. Elbing, K.; Rubenstein, E.M.; McCartney, R.R.; Schmidt, M.C. Subunits of the Snf1 kinase heterotrimer show interdependence for association and activity. J. Biol. Chem. 2006, 281, 26170–26180. [Google Scholar] [CrossRef] [Green Version]
  36. Vincent, O.; Townley, R.; Kuchin, S.; Carlson, M. Subcellular localization of the Snf1 kinase is regulated by specific beta subunits and a novel glucose signaling mechanism. Genes Dev. 2001, 15, 1104–1114. [Google Scholar] [CrossRef] [Green Version]
  37. Simpson-Lavy, K.J.; Bronstein, A.; Kupiec, M.; Johnston, M. Cross-Talk between Carbon Metabolism and the DNA Damage Response in S. cerevisiae. Cell Rep. 2015, 12, 1865–1875. [Google Scholar] [CrossRef] [Green Version]
  38. Jiang, R.; Carlson, M. Glucose regulates protein interactions within the yeast SNF1 protein kinase complex. Genes Dev. 1996, 10, 3105–3115. [Google Scholar] [CrossRef] [Green Version]
  39. Amodeo, G.A.; Rudolph, M.J.; Tong, L. Crystal structure of the heterotrimer core of Saccharomyces cerevisiae AMPK homologue SNF1. Nature 2007, 449, 492–495. [Google Scholar] [CrossRef]
  40. Jiang, R.; Carlson, M. The Snf1 protein kinase and its activating subunit, Snf4, interact with distinct domains of the Sip1/Sip2/Gal83 component in the kinase complex. Mol. Cell. Biol. 1997, 17, 2099–2106. [Google Scholar] [CrossRef]
  41. Celenza, J.L.; Carlson, M. Mutational analysis of the Saccharomyces cerevisiae SNF1 protein kinase and evidence for functional interaction with the SNF4 protein. Mol. Cell. Biol. 1989, 9, 5034–5044. [Google Scholar] [CrossRef] [PubMed] [Green Version]
  42. Simpson-Lavy, K.J.; Kupiec, M. Regulation of yeast Snf1 (AMPK) by a polyhistidine containing pH sensing module. iScience 2022, 25, 105083. [Google Scholar] [CrossRef] [PubMed]
  43. Li, H.; Mapolelo, D.T.; Dingra, N.N.; Keller, G.; Riggs-Gelasco, P.J.; Winge, D.R.; Johnson, M.K.; Outten, C.E. Histidine 103 in Fra2 is an iron-sulfur cluster ligand in the 2Fe-2S Fra2-Grx3 complex and is required for in vivo iron signaling in yeast. J. Biol. Chem. 2011, 286, 867–876. [Google Scholar] [CrossRef] [PubMed] [Green Version]
  44. Ueta, R.; Fujiwara, N.; Iwai, K.; Yamaguchi-Iwai, Y. Iron-induced dissociation of the Aft1p transcriptional regulator from target gene promoters is an initial event in iron-dependent gene suppression. Mol. Cell. Biol. 2012, 32, 4998–5008. [Google Scholar] [CrossRef] [Green Version]
  45. Ueta, R.; Fujiwara, N.; Iwai, K.; Yamaguchi-Iwai, Y. Mechanism Underlying the Iron-dependent Nuclear Export of the Iron-responsive Transcription Factor Aft1p in Saccharomyces cerevisiae. Mol. Biol. Cell 2007, 18, 2980–2990. [Google Scholar] [CrossRef] [Green Version]
  46. Simpson-Lavy, K.; Kupiec, M. Carbon Catabolite Repression in Yeast is Not Limited to Glucose. Sci. Rep. 2019, 9, 6491. [Google Scholar] [CrossRef] [Green Version]
  47. Kim, M.S.; Cho, K.H.; Park, K.H.; Jang, J.; Hahn, J.-S. Activation of Haa1 and War1 transcription factors by differential binding of weak acid anions in Saccharomyces cerevisiae. Nucleic Acids Res. 2019, 47, 1211–1224. [Google Scholar] [CrossRef] [Green Version]
  48. Collins, M.E.; Black, J.J.; Liu, Z. Casein Kinase I Isoform Hrr25 Is a Negative Regulator of Haa1 in the Weak Acid Stress Response Pathway in Saccharomyces cerevisiae. Appl. Environ. Microbiol. 2017, 83, e00672-17. [Google Scholar] [CrossRef] [Green Version]
  49. Mormino, M.; Siewers, V.; Nygård, Y. Development of an Haa1-based biosensor for acetic acid sensing in Saccharomyces cerevisiae. FEMS Yeast Res. 2021, 21, foab049. [Google Scholar] [CrossRef]
  50. Martins, T.S.; Pereira, C.; Canadell, D.; Vilaça, R.; Teixeira, V.; Moradas-Ferreira, P.; de Nadal, E.; Posas, F.; Costa, V. The Hog1p kinase regulates Aft1p transcription factor to control iron accumulation. Biochim. Biophys. Acta (BBA)-Mol. Cell Biol. Lipids 2018, 1863, 61–70. [Google Scholar] [CrossRef]
  51. Malleshaiah, M.; Tchekanda, E.; Michnick, S.W. Real-Time Protein-Fragment Complementation Assays for Studying Temporal, Spatial, and Spatiotemporal Dynamics of Protein-Protein Interactions in Living Cells. Cold Spring Harb. Protoc. 2016, 2016. [Google Scholar] [CrossRef] [PubMed]
  52. Sarma, N.J.; Buford, T.D.; Haley, T.; Barbara-Haley, K.; Santangelo, G.M.; Willis, K.A. The nuclear pore complex mediates binding of the Mig1 repressor to target promoters. PLoS ONE 2011, 6, e27117. [Google Scholar] [CrossRef] [Green Version]
  53. Sloan, J.S.; Dombek, K.M.; Young, E.T. Post-translational regulation of Adr1 activity is mediated by its DNA binding domain. J. Biol. Chem. 1999, 274, 37575–37582. [Google Scholar] [CrossRef] [PubMed] [Green Version]
  54. Schmidt, G.W.; Welkenhuysen, N.; Ye, T.; Cvijovic, M.; Hohmann, S. Mig1 localization exhibits biphasic behavior which is controlled by both metabolic and regulatory roles of the sugar kinases. Mol. Genet. Genom. 2020, 295, 1489–1500. [Google Scholar] [CrossRef]
  55. Carlson, M. Glucose repression in yeast. Curr. Opin. Microbiol. 1999, 2, 202–207. [Google Scholar] [CrossRef] [PubMed]
  56. Zhang, M.; Galdieri, L.; Vancura, A. The yeast AMPK homolog SNF1 regulates acetyl coenzyme A homeostasis and histone acetylation. Mol. Cell. Biol. 2013, 33, 4701–4717. [Google Scholar] [CrossRef] [PubMed] [Green Version]
  57. Becuwe, M.; Vieira, N.; Lara, D.; Gomes-Rezende, J.; Soares-Cunha, C.; Casal, M.; Haguenauer-Tsapis, R.; Vincent, O.; Paiva, S.; Léon, S. A molecular switch on an arrestin-like protein relays glucose signaling to transporter endocytosis. J. Cell Biol. 2012, 196, 247–259. [Google Scholar] [CrossRef] [PubMed] [Green Version]
  58. Osiro, K.O.; Borgstrom, C.; Brink, D.P.; Fjolnisdottir, B.L.; Gorwa-Grauslund, M.F. Exploring the xylose paradox in Saccharomyces cerevisiae through in vivo sugar signalomics of targeted deletants. Microb. Cell Fact. 2019, 18, 88. [Google Scholar] [CrossRef] [Green Version]
  59. Sato, T.K.; Tremaine, M.; Parreiras, L.S.; Hebert, A.S.; Myers, K.S.; Higbee, A.J.; Sardi, M.; McIlwain, S.J.; Ong, I.M.; Breuer, R.J.; et al. Directed Evolution Reveals Unexpected Epistatic Interactions that Alter Metabolic Regulation and Enable Anaerobic Xylose Use by Saccharomyces cerevisiae. PLoS Genet. 2016, 12, e1006372. [Google Scholar] [CrossRef] [Green Version]
  60. Lee, S.-B.; Tremaine, M.; Place, M.; Liu, L.; Pier, A.; Krause, D.J.; Xie, D.; Zhang, Y.; Landick, R.; Gasch, A.P.; et al. Crabtree/Warburg-like aerobic xylose fermentation by engineered Saccharomyces cerevisiae. Metab. Eng. 2021, 68, 119–130. [Google Scholar] [CrossRef]
  61. Patnaik, P.K.; Beaupere, C.; Barlit, H.; Romero, A.M.; Tsuchiya, M.; Muir, M.; Martínez-Pastor, M.T.; Puig, S.; Kaeberlein, M.; Labunskyy, V.M. Deficiency of the RNA-binding protein Cth2 extends yeast replicative lifespan by alleviating its repressive effects on mitochondrial function. Cell Rep. 2022, 40, 111113. [Google Scholar] [CrossRef] [PubMed]
  62. Fontana, G.A.; Hess, D.; Reinert, J.K.; Mattarocci, S.; Falquet, B.; Klein, D.; Shore, D.; Thomä, N.H.; Rass, U. Rif1 S-acylation mediates DNA double-strand break repair at the inner nuclear membrane. Nat. Commun. 2019, 10, 2535. [Google Scholar] [CrossRef] [PubMed] [Green Version]
  63. Gaillard, H.; Santos-Pereira, J.M.; Aguilera, A. The Nup84 complex coordinates the DNA damage response to warrant genome integrity. Nucleic Acids Res. 2019, 47, 4054–4067. [Google Scholar] [CrossRef] [PubMed] [Green Version]
  64. Therizols, P.; Fairhead, C.; Cabal, G.G.; Genovesio, A.; Olivo-Marin, J.-C.; Dujon, B.; Fabre, E. Telomere tethering at the nuclear periphery is essential for efficient DNA double strand break repair in subtelomeric region. J. Cell Biol. 2006, 172, 189–199. [Google Scholar] [CrossRef] [PubMed]
  65. Simpson-Lavy, K.J.; Johnston, M. SUMOylation regulates the SNF1 protein kinase. Proc. Natl. Acad. Sci. USA 2013, 110, 17432–17437. [Google Scholar] [CrossRef] [Green Version]
  66. Ruiz, A.; Xu, X.; Carlson, M. Roles of two protein phosphatases, Reg1-Glc7 and Sit4, and glycogen synthesis in regulation of SNF1 protein kinase. Proc. Natl. Acad. Sci. USA 2011, 108, 6349–6354. [Google Scholar] [CrossRef] [Green Version]
  67. Haurie, V.; Boucherie, H.; Sagliocco, F. The Snf1 protein kinase controls the induction of genes of the iron uptake pathway at the diauxic shift in Saccharomyces cerevisiae. J. Biol. Chem. 2003, 278, 45391–45396. [Google Scholar] [CrossRef] [Green Version]
  68. Pujol-Carrion, N.; Pavón-Vergés, M.; Arroyo, J.; de la Torre-Ruiz, M.A. The MAPK Slt2/Mpk1 plays a role in iron homeostasis through direct regulation of the transcription factor Aft1. Biochim. Biophys. Acta Mol. Cell Res. 2021, 1868, 118974. [Google Scholar] [CrossRef]
  69. Horie, T.; Kawamata, T.; Matsunami, M.; Ohsumi, Y. Recycling of iron via autophagy is critical for the transition from glycolytic to respiratory growth. J. Biol. Chem. 2017, 292, 8533–8543. [Google Scholar] [CrossRef] [Green Version]
  70. Gerwien, F.; Safyan, A.; Wisgott, S.; Hille, F.; Kaemmer, P.; Linde, J.; Brunke, S.; Kasper, L.; Hube, B. A Novel Hybrid Iron Regulation Network Combines Features from Pathogenic and Nonpathogenic Yeasts. mBio 2016, 7, e01782-16. [Google Scholar] [CrossRef]
  71. Massé, E.; Gottesman, S. A small RNA regulates the expression of genes involved in iron metabolism in Escherichia coli. Proc. Natl. Acad. Sci. USA 2002, 99, 4620–4625. [Google Scholar] [CrossRef] [PubMed] [Green Version]
  72. Seo, S.W.; Kim, D.; Latif, H.; O’Brien, E.J.; Szubin, R.; Palsson, B.O. Deciphering Fur transcriptional regulatory network highlights its complex role beyond iron metabolism in Escherichia coli. Nat. Commun. 2014, 5, 4910. [Google Scholar] [CrossRef] [PubMed] [Green Version]
  73. Serafini, A. Interplay between central carbon metabolism and metal homeostasis in mycobacteria and other human pathogens. Microbiology 2021, 167, 001060. [Google Scholar] [CrossRef]
  74. Rosas, H.D.; Chen, Y.I.; Doros, G.; Salat, D.H.; Chen, N.; Kwong, K.K.; Bush, A.; Fox, J.; Hersch, S.M. Alterations in brain transition metals in Huntington disease: An evolving and intricate story. Arch. Neurol. 2012, 69, 887–893. [Google Scholar] [CrossRef] [PubMed]
  75. Lan, A.P.; Chen, J.; Chai, Z.F.; Hu, Y. The neurotoxicity of iron, copper and cobalt in Parkinson’s disease through ROS-mediated mechanisms. Biometals 2016, 29, 665–678. [Google Scholar] [CrossRef]
  76. Sun, Y.; Pham, A.N.; Waite, T.D. Elucidation of the interplay between Fe(II), Fe(III), and dopamine with relevance to iron solubilization and reactive oxygen species generation by catecholamines. J. Neurochem. 2016, 137, 955–968. [Google Scholar] [CrossRef]
  77. Fernández-Real, J.M.; López-Bermejo, A.; Ricart, W. Cross-talk between iron metabolism and diabetes. Diabetes 2002, 51, 2348–2354. [Google Scholar] [CrossRef] [Green Version]
  78. Huang, J.; Simcox, J.; Mitchell, T.C.; Jones, D.; Cox, J.; Luo, B.; Cooksey, R.C.; Boros, L.G.; McClain, D.A. Iron regulates glucose homeostasis in liver and muscle via AMP-activated protein kinase in mice. FASEB J. 2013, 27, 2845–2854. [Google Scholar] [CrossRef] [Green Version]
  79. Zheng, Q.; Zhao, Y.; Guo, J.; Zhao, S.; Fei, C.; Xiao, C.; Wu, D.; Wu, L.; Li, X.; Chang, C. Iron overload promotes mitochondrial fragmentation in mesenchymal stromal cells from myelodysplastic syndrome patients through activation of the AMPK/MFF/Drp1 pathway. Cell Death Dis. 2018, 9, 515. [Google Scholar] [CrossRef] [Green Version]
  80. Higashida, K.; Takeuchi, N.; Inoue, S.; Hashimoto, T.; Nakai, N. Iron deficiency attenuates catecholamine-stimulated lipolysis via downregulation of lipolysis-related proteins and glucose utilization in 3T3-L1 adipocytes. Mol. Med. Rep. 2020, 21, 1383–1389. [Google Scholar] [CrossRef]
  81. Knop, M.; Siegers, K.; Pereira, G.; Zachariae, W.; Winsor, B.; Nasmyth, K.; Schiebel, E. Epitope tagging of yeast genes using a PCR-based strategy: More tags and improved practical routines. Yeast 1999, 15, 963–972. [Google Scholar] [CrossRef]
  82. Ma, H.; Kunes, S.; Schatz, P.J.; Botstein, D. Plasmid construction by homologous recombination in yeast. Gene 1987, 58, 201–216. [Google Scholar] [CrossRef] [PubMed]
  83. Liu, Y.; Xu, X.; Carlson, M. Interaction of SNF1 protein kinase with its activating kinase Sak1. Eukaryot. Cell 2011, 10, 313–319. [Google Scholar] [CrossRef] [PubMed] [Green Version]
  84. Germann, S.M.; Schramke, V.; Pedersen, R.T.; Gallina, I.; Eckert-Boulet, N.; Oestergaard, V.H.; Lisby, M. TopBP1/Dpb11 binds DNA anaphase bridges to prevent genome instability. J. Cell Biol. 2014, 204, 45–59. [Google Scholar] [CrossRef] [PubMed] [Green Version]
  85. Barrett, L.; Orlova, M.; Maziarz, M.; Kuchin, S. Protein kinase A contributes to the negative control of Snf1 protein kinase in Saccharomyces cerevisiae. Eukaryot. Cell 2012, 11, 119–128. [Google Scholar] [CrossRef] [Green Version]
  86. Coonrod, E.M.; Graham, L.A.; Carpp, L.N.; Carr, T.M.; Stirrat, L.; Bowers, K.; Bryant, N.J.; Stevens, T.H. Homotypic vacuole fusion in yeast requires organelle acidification and not the V-ATPase membrane domain. Dev. Cell 2013, 27, 462–468. [Google Scholar] [CrossRef] [Green Version]
  87. Remy, I.; Michnick, S.W. Mapping Biochemical Networks with Protein-Fragment Complementation Assays. In Protein-Protein Interactions; Fu, H., Ed.; Humana Press: Totowa, NJ, USA, 2004; pp. 411–426. ISBN 1-59259-762-9. [Google Scholar]
  88. Orlova, M.; Barrett, L.; Kuchin, S. Detection of endogenous Snf1 and its activation state: Application to Saccharomyces and Candida species. Yeast 2008, 25, 745–754. [Google Scholar] [CrossRef]
  89. Wilson, W.A.; Hawley, S.A.; Hardie, D. Glucose repression/derepression in budding yeast: SNF1 protein kinase is activated by phosphorylation under derepressing conditions, and this correlates with a high AMP:ATP ratio. Curr. Biol. 1996, 6, 1426–1434. [Google Scholar] [CrossRef]
Figure 1. Snf1 is inhibited by iron chelation. (A,B) Rate of prADH2::LacZ expression in snf1Δ cells expressing prSNF1::Snf1-GFP from plasmids with the indicated mutations (deletion of polyHIS (ΔH), substitution to polyA (A), substitution to polyW (W), substitution to polyY (Y), four histidines (4H), eight histidines (8H)). Snf1WT has 14 histidines in its polyHIS tract. An amount of 0.1 mM BPS or 5 mM Mohr’s salt was added as indicated. N = 3. Error bars are mean ±1 standard deviation. t-tests were performed as indicated. NS = not significant, * = p ≤ 0.05, ** = p ≤ 0.01, *** = p ≤ 0.001. (C) Western blot showing phosphorylation of Snf1 under indicated conditions. Gl.: glucose; Et.: ethanol. Snf1 abundance and phosphorylation at T210 are quantified in Figure S1C and Figure S1D, respectively. (D) Rate of prADH2::LacZ expression in adr1Δ cells expressing ADR1 or ADR1S230A or empty vector as indicated. An amount of 0.1 mM BPS was added as indicated. N = 3. Error bars are mean ±1 standard deviation. t-tests were performed as indicated. NS = not significant, * = p ≤ 0.05, ** = p ≤ 0.01, *** = p ≤ 0.001. (E) Rate of prADH2::LacZ expression in WT W303a cells overexpressing the PKR of Snf1 (aa1-53) with indicated mutations (deletion of polyHIS (ΔH), substitution to polyA (A), substitution to polyR (R)) or empty vector. The PKR was fused to the Gal Binding Domain (GBD) to send it to the nucleus, or expressed without the GBD to keep it cytoplasmic. N = 3. Error bars are mean ±1 standard deviation. t-tests were performed as indicated. NS = not significant, * = p ≤ 0.05, ** = p ≤ 0.01, *** = p ≤ 0.001.
Ijms 24 01368 g001
Figure 2. Aft1 inhibits Snf1. (A) Rate of prADH2::LacZ expression of indicated cells (in a snf1Δ background) cells expressing prSNF1::Snf1-GFP from plasmids with the indicated mutations (deletion of polyHIS (ΔH), substitution to polyA (A), substitution to polyW (W), substitution to polyY (Y)). An amount of 100 μM BPS or 5 mM Mohr’s salt was added as indicated. N = 3. Error bars are mean ±1 standard deviation. t-tests were performed as indicated. NS = not significant, * = p ≤ 0.05, ** = p ≤ 0.01, *** = p ≤ 0.001. (B) Yeast two-hybrid experiment showing interaction between GAD-Gal83 and GBD-Snf1 (with indicated mutations (deletion of polyHIS (ΔH), substitution to polyA (A) substitution to polyW (W), substitution to polyY (Y))) in either wild-type or aft1Δ cells, where 100% interaction is defined as GBD-Snf1 interacting with GAD-Gal83 in ethanol media. N = 3. Error bars are mean ±1 standard deviation. t-tests were performed as indicated. NS = not significant, * = p ≤ 0.05, ** = p ≤ 0.01, *** = p ≤ 0.001. (C) YRO2 expression in snf1Δ and snf1Δaft1Δ cells bearing the indicated prSNF1::Snf1-GFP plasmids. Cells were grown with the indicated carbon source and prYRO2::LacZ expression measured after 18 h. N = 3. Error bars are mean ±1 standard deviation. t-tests were performed as indicated. NS = not significant, * = p ≤ 0.05, ** = p ≤ 0.01, *** = p ≤ 0.001. (D) Rate of prADH2::LacZ expression in snf1Δ aft1Δ cells bearing the indicated prSNF1::Snf1-GFP plasmids and the indicated Aft1 plasmids (or empty vector) grown in ethanol medium. N = 3. Error bars are mean ±1 standard deviation. t-tests were performed as indicated. NS = not significant, * = p ≤ 0.05, ** = p ≤ 0.01, *** = p ≤ 0.001.
Ijms 24 01368 g002
Figure 3. Interactions between Aft1 and Snf1 (A,B). Yeast two-hybrid experiment showing interaction between GAD-Snf1 and GBD-Aft1 (A) or GBD-Aft11-44 (B) under the indicated conditions. An amount of 100 μM BPS or 5 mM Mohr’s salt was added as indicated, and 100% interaction is defined as GAD-Snf1 with GBD-Aft1 (A) or GBD-Aft11-44 (B). N = 3. Error bars are mean ±1 standard deviation. t-tests were performed as indicated. NS = not significant, * = p ≤ 0.05, ** = p ≤ 0.01, *** = p ≤ 0.001. (C) Yeast two-hybrid experiment showing interaction between GAD-Aft1 and GBD-Snf1 fragments as described in Figure S1A, and 100% interaction is defined as GAD-Aft1 with GBD-Snf1-FL in ethanol. N = 3. Error bars are mean ±1 standard deviation. t-tests were performed as indicated. NS = not significant, * = p ≤ 0.05, ** = p ≤ 0.01, *** = p ≤ 0.001. (D) Yeast two-hybrid experiment showing interaction between GAD-Aft1 and GBD-Snf1. FL = full length Snf1 (aa 1-633). NTD = aa1-391. Pma1 was hyperactivated (Pma1↑) by simultaneously truncating the final 18 amino acids of Pma1 (Pma1-Δ901) and deleting HSP30 [42]. 100% interaction is defined as GAD-Aft1 with GBD-Snf1-FL in ethanol. N = 3. Error bars are mean ±1 standard deviation. t-tests were performed as indicated. NS = not significant, * = p ≤ 0.05, ** = p ≤ 0.01, *** = p ≤ 0.001.
Ijms 24 01368 g003
Figure 4. Nuclear Aft1 inhibits Snf1. (A,B) Rate of prADH2::LacZ expression of snf1Δaft1Δ cells (and snf1Δaft1Δmsn5Δ cells (B)) expressing indicated Snf1 and Aft1 mutants from plasmids. Aft1AA is Aft1 –S210A S224A. Aft1DD is Aft1-S210D S224D. An amount of 100 μM BPS or 5 mM Mohr’s salt was added as indicated. N = 3. Error bars are mean ±1 standard deviation. t-tests were performed as indicated. NS = not significant, * = p ≤ 0.05, ** = p ≤ 0.01, *** = p ≤ 0.001. (C) Protein complementation assay by split Venus to show interaction between VF1-Snf1 and Aft1-VF2. Cells were grown under indicated conditions overnight, with dilution before imaging two hours later. Aft1-DD is Aft1-S210D S224D. Nup49-Cherry was used to mark the nuclear membrane. (D) Yeast two-hybrid experiment to show interaction between GAD-Aft1 and GBD-Snf1 in the absence of either nup120 or nup133. FL = full length Snf1 aa1-633. NTD = Snf11-391. The 100% interaction is defined as GAD-Aft1 with GBD-Snf1-FL in ethanol. N = 3. Error bars are mean ±1 standard deviation. t-tests were performed as indicated. NS = not significant, * = p ≤ 0.05, ** = p ≤ 0.01, *** = p ≤ 0.001. (E) Rate of prADH2::LacZ expression of snf1Δ and snf1Δnup133Δ cells expressing either Snf1WT or Snf1ΔH from plasmids. An amount of 0.1 mM BPS was added as indicated. N = 3. Error bars are mean ±1 standard deviation. t-tests were performed as indicated. NS = not significant, * = p ≤ 0.05, ** = p ≤ 0.01, *** = p ≤ 0.001.
Ijms 24 01368 g004
Figure 5. Temporal–spatial regulation of Snf1 by iron. (A) Rate of prADH2::LacZ expression when Snf1 is restricted to the cytoplasm (gal83Δ) or to the nucleus (sip1Δsip2Δ) upon iron chelation by 100 μM BPS. N = 3. Error bars are mean ±1 standard deviation. t-tests were performed as indicated. NS = not significant, * = p ≤ 0.05, ** = p ≤ 0.01. (B,C) Rate of prSUC2::LacZ expression when Snf1 is restricted to the cytoplasm (gal83Δ) or to the nucleus (sip1Δsip2Δ) upon iron chelation by 100 μM BPS: (B) is with sucrose as the carbon source, (C) is with ethanol (and is normalized to WT sucrose. N = 3. Error bars are mean ±1 standard deviation. t-tests were performed as indicated. NS = not significant, * = p ≤ 0.05, ** = p ≤ 0.01.
Ijms 24 01368 g005
Figure 6. Non-nuclear substrates of Snf1 are not regulated by iron deprivation. (AE) Western blots showing phosphorylation of Rod1-6HA, Snf1-3HA protein levels, and phosphorylation of Snf1 at T210 following transfer of indicated cells from glucose (Gl) media to ethanol (Et) media (and adding 0.1 mM BPS as indicated) for 30 min. (F) Internalization of Jen1-GFP. Jen1-GFP was expressed from a GAL promoter overnight. Either glucose at 2% was added to internalize Jen1-GFP (vacuoles are marked with Pho8-Cherry) or the galactose was washed out and replaced by glycerol + 100 μM BPS to determine if iron deprivation leads to Jen1-GFP internalization.
Ijms 24 01368 g006
Figure 7. Model. (A) In the presence of glucose, the PSM is deprotonated and interacts with RD-γ, T210 is not phosphorylated and Snf1 is inactive. (B) In the absence of glucose, T210 is phosphorylated and the PSM is protonated and disengages from RD-γ. Snf4 and a γ-subunit interact with the RD. Snf1/Snf4/Gal83 localize to the nucleus and genes, such as ADH2, are expressed. Iron is imported and iron–sulfur clusters are manufactured in the mitochondria. These interact with Grx3/4 and Bol2 to sequester Aft1 in the cytoplasm. Aft1 is also phosphorylated by Hog1 at S210 and S224 and this leads to its export from the nucleus by Msn5. (C) In the absence of iron or glucose, Aft1 enters the nucleus and interacts at the nuclear membrane with the protonated PSM of Snf1, thereby inhibiting Snf1.
Ijms 24 01368 g007
Table 1. Yeast Strains.
NumberNameGenotypeFrom
1WTW303 MATa ade2-1 his3-11,15 trp1-1 leu2-3,112 ura3-1 rad5-535 bud4Lab collection
2snf1W303a snf1::HYGE. Young [25]
3reg1W303a MATα reg1::NATE. Young [25]
4snf1 reg1W303a snf1:: HYG reg1::NATE. Young [25]
5snf1 hsp30W303a snf1:: HYG hsp30::KAN[42]
6PJ694trp1-901 leu2-3,112, ura3-52, his3Δ200, gal4Δ, gal80Δ, prGAL2:ADE2 lys2::prGAL1::HIS3 met2::prGAL7-LacZLab collection
7adr1W303a adr1::NATE. Young [25]
11snf1 aft1W303a snf1::HYG aft1::NATThis study
12snf1 aft1 Rod1-6HAW303a snf1::HYG Rod1-6HA::NAT aft1::KANThis study
13snf1 aft2W303a snf1::HYG aft2::NATThis study
14snf1 aft1 msn5W303a snf1::HYG aft1::KAN msn5::NATThis study
15snf1 msn5W303a snf1::HYG msn5::NATThis study
16snf1 sip1 sip2W303a snf1::HYG sip1::NAT sip2::KANThis study
17gal83W303a gal83::NATThis study
18snf1 gal83W303a snf1::HYG gal83::NATThis study
19rod1W303a rod1::NATThis study
20snf1 nup133W303a snf1::HYG nup133::NATThis study
21PJ694 hsp30PJ694 hsp30::NAT[42]
22PJ694 nup120PJ694nup120::NATThis study
23PJ694 nup133PJ694nup133::NATThis study
Table 2. Plasmids.
Table 2. Plasmids.
NumberGenotypeBackboneSource/Notes
152Snf1-GFPpPRS313M. Carlson [36]
728Snf1-GFPpRS315Marker switch of 152
847Snf1-ΔH-GFPpRS315polyHIS of 728 deleted
742Snf1-A-GFPpRS315Alanine substituted for histidine in PKR of 728
745Snf1-W -GFPpRS315Tryptophan substituted for histidine in PKR of 728
731Snf1-Y-GFPpRS315Tyrosine substituted for histidine in PKR of 728
1244Snf1-4H -GFPpRS315Four histidines inserted into 847
1248Snf1-8H-GFPpRS315Eight histidines inserted into 847
816Snf1-3HApRS313M. Carlson [83]
819Snf1-ΔH-3HApRS313polyHIS of 816 deleted
1 or 919prADH2::LacZpRS316E. Young [25]
63prADH2::LacZpRS313Marker switch of 1
164prADH2::LacZpRS315Marker switch of 1
526Nup49-CherrypRS314M. Lisby [84]
589Nup49-CherrypRS316Marker switch of 526
590Nup49-CherrypRS315Marker switch of 526
1020Adr1-3HA2μ TRP1 KanMXE. Young [25]
1021Adr1S230A-3HA2μ TRP1 KanMXE. Young [25]
1081Aft1-1uppRS416D. Winge [16]
1160Aft1-1uppRS413Marker switch of 1081
935prFET3::LacZYep354 (2μ URA3)V. Costa [50]
931Aft1-HApRS416V. Costa [50]
932Aft1-S210D S224D-HApRS416V. Costa [50]
933GFP-Aft1pRS426V. Costa
9344t-2GST-Aft1-S210A S224ApGEXV. Costa [50]
1208Aft1-S210A S224A-HApRS416Fragment from 934 replacing fragment in 931
1206Aft1-HApRSs415Marker switch of 931
1202Aft1-S210D S224D-HApRS415Marker switch of 932
1174GFP-Aft1pRS425Marker switch of 933
1212Aft1-S210A S224-HApRS415Marker switch of 1208
1172GFP-Aft1 Δ9pRS426Aa16-24 deleted in 933
1173GFP-Aft1 Δ9pRS425Marker switch of 1172
1195GFP-Aft1 Δ24pRS426Aa16-36 deleted in 933
1199GFP-Aft1 Δ24pRS425Marker switch of 1195
1204GFP-Aft1 S210A, S224ApRS426S210A S224A mutations in 933
1205GFP-Aft1 S210D, S224DpRS426S210D S224D mutations in 933
1234Pma1pRS314Pma1 inserted into prs314
1238Pma1-Δ901pRS314Final 18aa of Pma1 deleted
216prSUC2::LacZYep354 (2μ URA3)S. Kuchin [85]
722prYRO2::LacZpRS416Z. Liu [48]
771prGAL1::Jen1-GFPpRS316S. Leon [57]
230prVph1::Cherry-Pho8pRS315T. Stevens [86]
Yeast 2-hybrid plasmids
153prADH1::GADLEU2, 2μpACT2 yeast 2-hybrid empty vector
154prADH1::GBDTRP1, 2μpGBT9 yeast 2-hybrid empty vector
155prADH1::GBDURA3, 2μpGBU9 yeast 2-hybrid empty vector
757GAD-Gal83LEU2, 2μGal83 in 153
762GBD-Snf1URA3, 2μSnf1 in 155
764GBD-Snf1 T210AURA3, 2μSnf1 T210A in 155
789GBD-Snf1 ΔHURA3, 2μpolyHIS deletion of 762
780GBD-Snf1 WURA3, 2μTryptophan substituted for polyHIS in 762
781GBD-Snf1 1-391URA3, 2μSnf1 1-391 in 155
849GBD-Snf1 1-391 T210AURA3, 2μSnf1 1-391 T210A in 155
795GBD-Snf1 1-391 ΔHURA3, 2μSnf1 1-391 ΔH in 155
785GBD-Snf1 1-391 WURA3, 2μSnf1 1-391 W in 155
828GBD-Snf1 1-53URA3, 2μSnf1 1-53 in 155
836GBD-Snf1 1-53 ΔHURA3, 2μSnf1 1-53 ΔH in 155
829GBD-Snf1 1-53 AURA3, 2μSnf1 1-53 A in 155
831GBD-Snf1 1-53 RURA3, 2μSnf1 1-53 R in 155
837GBD-Snf1 1-53 WURA3, 2μSnf1 1-53 W in 155
786GBD-Snf1 392-633URA3, 2μSnf1 392-633 in 155
991GBD-Snf1 1-53TRP1, 2μSnf1 1-53 in 154
993GBD-Snf1 1-53 ΔHTRP1, 2μSnf1 1-53 ΔH in 154
1013GBD-Snf1 1-53 ATRP1, 2μSnf1 1-53 A in 154
1261GBD-Snf1 1-53 RTRP1, 2μSnf1 1-53 R in 154
1012prADH1::Snf1 1-53TRP1, 2μSnf1 1-53 in 154 (no GBD)
1004prADH1::Snf1 1-53 ΔHTRP1, 2μSnf1 1-53 ΔH in 154 (no GBD)
1019prADH1::Snf1 1-53 ATRP1, 2μSnf1 1-53 A in 154 (no GBD)
1267prADH1::Snf1 1-53 RTRP1, 2μSnf1 1-53 R in 154 (no GBD)
857GAD-Snf1LEU2, 2μSnf1 1-633 in 153
1210GBD-Aft1TRP1, 2μAft1 in 154
1217GBD-Aft1 1-44TRP1, 2μAft1 1-44 in 154
1211GBD-Aft1 Δ9TRP1, 2μAft1 Δ9 in 154
1218GBD-Aft1 1-44 Δ9TRP1, 2μAft1 1-44 Δ9 in 154
1229GAD-Aft1LEU2, 2μAft1 in 153
Venus Constructs
4prADH1::VF1pRS413P. Chartrand [87]
8prADH1::VF2pRS415P. Chartrand [87]
1168prSNF1::VF1-Snf1-3HApRS413VF1 inserted at N-terminus of 816
1170prSNF1::VF1-Snf1 ΔH-3HApRS413VF1 inserted at N-terminus of 819
1149prADH1::Aft1-VF2pRS415Aft1 inserted into 8
1150prADH1::Aft1 S210D S224D-VF2pRS415Aft1 S210D S224D inserted into 8
Table 3. Oligonucleotides for Mutagenesis of Snf1.
NameDescription Sequence
Gap Repair Mutagenesis of polyHIS
C54Y-5CTACTATTATTACTATTATTACTACTATTACTATTATGGATATggcggaagcaactcgacg
C53Y-3cataatagtaatagtagtaataatagtaataatagtagtaGCTAGAATTTGCATTGGCAGGTG
C57A-5GCAGCTGCCGCAGCAGCCGCTGCCGCAGCAGCTGCAGCAGGAGCCggcggaagcaactcgacg
C58A-3ggctcctgctgcagctgctgcggcagcggctgctgcggcagctgcGCTAGAATTTGCATTGGCAGGTG
C74F-5CTTTTTCTTCTTCTTTTTCTTCTTCTTCTTCTTCTTTGGATTTggcggaagcaactcgacg
C73F-3caaagaagaagaagaagaagaaaaagaagaagaaaaagaaGCTAGAATTTGCATTGGCAGGTG
C107K-5aaaaagaaaaagaaaaagaagaaaaaaaagaaaaaaaaaggtaagGGCGGAAGCAACTCGACG
C106K-3cttacctttttttttcttttttttcttctttttctttttctttttGCTAGAATTTGCATTGGCAGGTG
C115R-5cgtagaaggagacgtcgtaggagaagacgtaggcgtaggggtaggGGCGGAAGCAACTCGACG
C114R-3cctacccctacgcctacgtcttctcctacgacgtctccttctacgGCTAGAATTTGCATTGGCAGGTG
C104W-5tggtggtggtggtggtggtggtggtggtggtggtggtggggttggGGCGGAAGCAACTCGACG
C103W-3ccaaccccaccaccaccaccaccaccaccaccaccaccaccaccaGCTAGAATTTGCATTGGCAGGTG
C117Delta-5GGCGGAAGCAACTCGACG
C116Delta-3caccatccgctaaggacgacttgggattgtttagcgtcgagttgcttccgccGCTAGAATTTGCATTGGCAG
Mutagenesis of Aft1
C271I15-revAATCGGTGACGCATGTTCTATG
C272Δ9-fwdGAAGGCTTCAATCCGGCTGACATAGAACATGCGTCACCGATTTTTGTATATGCTCTACCCAAAAGTGC
C275Δ21-fwdGTAGTCAACCATAATGAGGGTCG
Mutagenesis of Snf1
M69 *4H-3ATGGTGATGGTGGCTAGAATTTGCATTGGCAGGTGCTGTG
M70 *8H-3ATGGTGGTGATGGTGGTGGTGGTGGCTAGAATTTGCATTGGCAGGTGCTGTG
Pma1 Truncation
C292PMA1-5gaattgtaatacgactcactatagggcgaattggagctccgcttcctgaaacggagaaac
C293PMA1-3cctcactcattaggcaccccaggctttacactttatgcttccggctccgtaaaggtatttcgcggagg
C294 *Pma1-trunc5TAAtcctgttgaagtagcatttaatc
C295 *Pma1-trunc3GACACTTCTGGTAGACTTCTTTTC
Disclaimer/Publisher’s Note: The statements, opinions and data contained in all publications are solely those of the individual author(s) and contributor(s) and not of MDPI and/or the editor(s). MDPI and/or the editor(s) disclaim responsibility for any injury to people or property resulting from any ideas, methods, instructions or products referred to in the content.

