

Chemotherapeutic Drug Resistance Associated with Differential miRNA Expression of miR-375 and miR-27 among Oral Cancer Cell Lines
 and
and
Abstract
:1. Introduction
2. Results
3. Discussion
4. Materials and Methods
4.1. Experimental Cell Lines
| SCC-4 (CRL-1624) | SCC-9 (CRL-1629) | SCC-15 (CRL-1623) | SCC-25 (CRL-1628) | CAL-27 (CRL-2095) | |
| STR profile analysis | Amelogenin: X, Y CSF1PO: 11 D13S317: 11,13 D16S539: 12 D5S818: 13 D7S820: 9,11 THO1: 9.3 TPOX: 8 vWA: 15,17 | Amelogenin: X, Y CSF1PO: 11 D13S317: 9 D16S539: 10,11 D5S818: 12 D7S820: 8 THO1: 8,9 TPOX: 9,11 vWA: 17 | Amelogenin: X, Y CSF1PO: 10,13 D13S317: 9,14 D16S539: 12,15 D5S818: 12 D7S820: 10,11 THO1: 9,9.3 TPOX: 8 vWA: 15,17 | Amelogenin: X CSF1PO: 10 D13S317: 13 D16S539: 11,12 D5S818: 12 D7S820: 12 THO1: 8 TPOX: 8,12 vWA: 17,19 | Amelogenin: X CSF1PO: 10,12 D13S317: 10,11 D16S539: 11,12 D5S818: 11,12 D7S820: 10 THO1: 6,9.3 TPOX: 8 vWA: 14,17 |
| STR% match | 92% | 100% | 94% | 100% | 93% |
| Cell type | Oral squamous cell carcinoma | Oral squamous cell carcinoma | Oral squamous cell carcinoma | Oral squamous cell carcinoma | Oral squamous cell carcinoma |
4.2. Experimental Agents
4.3. Proliferation Assays
4.4. RNA Isolation
4.5. cDNA Synthesis and qPCR Screening
- GAPDH (metabolic) control primers
- GAPDH forward: 5′ATCTTCCAGGAGCGAGATCC-3′; 20 nt, 55% GC, Tm: 66 °C
- GAPDH reverse: 5′ACCACTGACACGTTGGCAGT-3′; 20 nt, 55% GC, Tm: 70 °C
- Beta-actin (structural) control primers
- Beta-actin forward: 5′-GTGGGGTCCTGTGGTGTG-3′; 18 nt, 67% GC, Tm: 69 °C
- Beta-actin reverse: 5′-GAAGGGGACAGGCAGTGA-3′, 18 nt, 61% GC, Tm: 67 °C
- miR-16
- miR-16 forward: 5′-TAGCAGCACGTAAATATTGGCG-3′; 22 nt, 45% GC, Tm: 65 °C
- miR-16 reverse: 5′-TGCGTGTCGTGGAGTC-3′; 16 nt, 63% GC, Tm: 65 °C
- miR-21
- miR-21 forward: 5′-GCCACCACACCAGCTAATTT-3′; 20 nt, 50% GC, Tm: 66 °C
- miR-21 reverse: 5′-CTGAAGTCGCCATGCAGATA-3′; 20 nt, 50% GC, Tm: 65 °C
- miR-27
- miR-27 forward: 5′-ATATGAGAAAAGAGCTTCCCTGTG-3′; 24 nt, 42% GC, Tm: 61 °C
- miR-27 reverse: 5′-CAAGGCCAGAGGAGGTGAG-’3′; 18 nt, 61% GC, Tm: 67 °C
- miR-124
- miR-124 forward: 5′-TTCACAGCGGACCTTGA-3′; 17 nt, 53% GC, Tm: 64 °C
- miR-124 reverse: 5′-GAACATGTCTGCGTATCTC-3′; 19 nt, 47% GC, Tm: 60 °C
- miR-125
- miR-125 forward: 5′-GCCCTCCCTGAGACCTCAA-3′; 19 nt, 63% GC, Tm: 69 °C
- miR-125 reverse: 5′-GTGCAGGGTCCGAGGT-3′; 16 nt, 69% GC, Tm: 68 °C
- miR-133
- miR-133 forward: 5′-CCGGTTAACTCGAGCTCTGTGAGAG-3′; 25 nt, 56% GC, Tm: 71 °C
- miR-133 reverse: 5′-CTAGCTAGGAATTCTGTGACCTGTG-’3′; 25 nt, 48% GC, Tm: 66 °C
- miR-135
- miR-135 forward: 5′-CGATATGGCTTTTTATTCCTA -3′; 21 nt, 33% GC, Tm: 56 °C
- miR-135 reverse: 5′-GAGCAGGGTCCGAGGT -3′; 16 nt, 69% GC, Tm: 67 °C
- miR-140
- miR-140 forward: 5′-GGGCAGTGGTTTTACCCTA -3′; 19 nt, 53% GC, Tm: 64 °C
- miR-140 reverse: 5′-CAGTGCGTGTCGTGGAGT -3′; 18 nt, 61% GC, Tm: 68 °C
- miR-143
- miR-143 forward: 5′-AGTGCGTGTCGTGGAGTC-3′; 18 nt, 61% GC, Tm: 68 °C
- miR-143 reverse: 5′-GCCTGAGATGAAGCACTGT-3′; 19 nt, 53% GC, Tm: 65 °C
- miR-145
- miR-145 forward: 5′-AGAGAACTCCAGCTG-3′; 15 nt, 53% GC, Tm: 56 °C
- miR-145 reverse: 5′-GGCAACTGTGGGGTG-3′; 15 nt, 67% GC, Tm: 64 °C
- miR-152
- miR-152 forward: 5′-GGTTCAAGACAGTACGTGACT-3′; 21 nt, 48% GC, Tm: 64 °C
- miR-152 reverse: 5′-CCAAGTTCTGTATGCACTGA-3′; 20 nt, 45% GC, Tm: 62 °C
- miR-155
- miR-155 forward: 5′-TTAATGCTAATTGTGATAGGGGT-3′; 23 nt, 35% GC, Tm: 61 °C
- miR-155 reverse: 5′-CCTATCACAATTAGCATTAATT-3′; 22 nt, 27% GC, Tm: 55 °C
- miR-210
- miR-210 forward: 5′-CATAGATAGCCACTGCCCACA-3′; 21 nt, 52% GC, Tm: 67 °C
- miR-210 reverse: 5′-GTGCAGGGTCCGAGGTATTC-3′; 20 nt, 60% GC, Tm: 68 °C
- miR-218
- miR-218 forward: 5′-TCGGGCTTGTGCTTGATC T-3′; 18 nt, 56% GC, Tm: 65 °C
- miR-218 reverse: 5′-GTGCAGGGTCCGAGTG-3′’; 16 nt, 69% GC, Tm: 66 °C
- miR-221
- miR-221 forward: 5′-CCCAGCATTTCTGACTGTTG-3′; 20 nt, 50% GC, Tm: 64 °C
- miR-221 reverse: 5′-TGTGAGACCATTTGGGTGAA-3′; 20 nt, 45% GC, Tm: 64 °C
- miR-222
- miR-222 forward: 5′-CGCAGCTACATCTGGCTACTG-3′; 21 nt, 57% GC, Tm: 68 °C
- miR-222 reverse: 5′-GTGCAGGGTCCGAGGT-3′; 16 nt, 69% GC, Tm: 68 °C
- miR-224
- miR-224 forward: 5′-GCGAGGTCAAGTCACTAGTGGT-3′; 22 nt, 55% GC, Tm: 69 °C
- miR-224 reverse: 5′-CGAGAAGCTTGCATCACCAGAGAA CG-3′; 26 nt, 54% GC, Tm: 72 °C
- miR-320
- miR-320 forward: 5′-AACGGAGAGTTGGGTCGAAA-3′; 20 nt, 50% GC, Tm: 66 °C
- miR-320 reverse: 5′-TTGCCTCTCAACCCAGCTTT-3′; 20 nt, 50% GC, Tm: 67 °C
- miR-365
- miR-365 forward: 5′-ATAGGATCCTGAGGTCCCTTTCGTG-3′; 25 nt, 52% GC, Tm: 70 °C
- miR-365 reverse: 5′-GCGAAGCTTAAAAACAGCGGAAGAGTTTGG-3′; 30 nt, 47% GC, Tm: 72 °C
- miR-375
- miR-375 forward: 5′-GGCTCTAGAGGGGACGAAGC-3′; 20 nt, 65% GC, Tm: 70 °C
- miR-375 reverse: 5′-GGCAAGCTTTTTCCACACCTCAGCCTTG-3′; 28 nt, 54% GC, Tm: 74 °C
- miR-424
- miR-424 forward: 5′-AGGACGAAACACCCCCTATTCCTTGC-3′; 26 nt, 54% GC, Tm: 73 °C
- miR-424 reverse: 5′-TAATGGATCCGAATACCTGCTCCTGA-3′; 26 nt, 46% GC, Tm: 69 °C
- miR-494
- miR-494 forward: 5′-GAAGATCTACGTCTGGTCTACCCAGTGC-3′; 28 nt, 54% GC, Tm: 72 °C
- miR-494 reverse: 5′-GGGGTACCACCGAGAGTGGAGCCGGCAA-3′; 28 nt, 68% GC, Tm: 82 °C
- miR-654
- miR-654 forward: 5′-GGGATGTCTGCTGACCA-3′; 17 nt, 59% GC, Tm: 64 °C
- miR-654 reverse: 5′-CAGTGCGTGTCGTGGA-3′; 16 nt, 63% GC, Tm: 65 °C
- miR-720
- miR-720 forward: 5′-GCGTGCTCTCGCTGGGG-3′; 17 nt, 76% GC, Tm: 73 °C
- miR-720 reverse: 5′-GTGCAGGGTCCGAGGT-3′; 16 nt, 69% GC, Tm: 68 °C
- miR-1246
- miR-1246 forward: 5′-TGAAGTAGGACTGGGCAGAGA-3′; 21 nt, 52% GC, Tm: 67 °C
- miR-1246 reverse: 5′-TTTGGGTCAGGTGTCCACTC-3′; 20 nt, 55% GC, Tm: 67 °C
- Downstream miR-27 targets:
- Riboflavin kinase (RFK)
- RFK forward: 5′-CACCTGCCTTACTTCTGCCG-3′; 20 nt, 60% GC, Tm: 69 °C
- RFK reverse: 5′-CCAACACTGGCCCAACCATAG-3′; 21 nt, 57% GC, Tm: 69 °C
- Latent Transforming Growth Factor Beta Binding Protein 1 (LTBP1)
- LTBP1 forward: 5′-CTGACGGCCACGAACTTCC-3′; 19 nt, 63% GC, Tm: 69 °C
- LTBP1 reverse: 5′-GCACTGACATTTGTCCCTTGA-3′; 21 nt, 48% GC, Tm: 65 °C
- INO80 complex subunit D (INO80D)
- INO80D forward: 5′-ATAAGCCCTTGTGCTCATATAGC-3′; 23 nt, 43% GC, Tm: 64 °C
- INO80D reverse: 5′-AGCGTTGGCTGTTATACTTGG-3′; 21 nt, 48% GC, Tm: 65 °C
- Basic transcription factor 3 (BTF3)
- BTF3 forward: 5′-CCAAGGAACAGTGATCCACTTT-3′; 22 nt, 45% GC, Tm: 65 °C
- BTF3 reverse: 5′-AGCTGCTTTGTCTCAGCATGG-3′; 21 nt, 52% GC, Tm: 68 °C
- Lysosomal thiol reductase (IFI30)
- IFI30 forward: 5′-CCCCTCTGCAAGCGTTAGAC-3′; 20 nt, 60% GC, Tm: 68 °C
- IFI30 reverse: 5′-CCCGCAGGTATAGATTGCCT-3′; 20 nt, 55% GC, Tm: 67 °C
- Homologous to the E6-AP Carboxyl Terminus (HECT) ubiquitin protein ligase 2 (HECW2)
- HECW2 forward: 5′-AAATCCCCAGATGCGGTACAC-3′; 21 nt, 52% GC, Tm: 67 °C
- HECW2 reverse: 5′-CGGCTCTCAGAAGTCACCA-3′; 19 nt, 58% GC, Tm: 67 °C
- Interleukin 2 (IL2)
- IL2 forward: 5′-TACAAGAACCCGAAACTGACTCG-3′; 23 nt, 48% GC, Tm: 66 °C
- IL2 reverse: 5′-ACATGAAGGTAGTCTCACTGCC-3′; 22 nt, 50% GC, Tm: 66 °C
- Adenylate cyclase 1 (ADCY1)
- ADCY1 forward: 5′-AGGCACGACAATGTGAGCATC-3′; 21 nt, 52% GC, Tm: 68 °C
- ADCY1 reverse: 5′-TTCATCGAACTTGCCGAAGAG-3′; 21 nt, 48% GC, Tm: 65 °C
- Eukaryotic translation initiation factor 5 (EIF5)
- EIF5 forward: 5′- AGCGTGTCAGACCAGTTCTAT-3′; 21 nt, 48% GC, Tm: 65 °C
- EIF5 reverse: 5′-CTGTCTTGATTCCATTGCCTTTG-3′; 23 nt, 43% GC, Tm: 64 °C
- Nucleophosmin 1 (NPM1)
- NPM1 forward: 5′-GGAGGTGGTAGCAAGGTTCC-3′; 20 nt, 60% GC, Tm: 68 °C
- NPM1 reverse: 5′-TTCACTGGCGCTTTTTCTTCA-3′; 21 nt, 43% GC, Tm: 65 °C
- Anthrax Toxin Receptor (ANTXR) cell adhesion molecule 1
- ANTXR1 forward: 5′-ACAGTTGGCTCACAAATTCATCA-3′; 23 nt, 39% GC, Tm: 65 °C
- ANTXR1 reverse: 5′-TCACTGGCCCTTTCAAATCCT-3′; 21 nt, 48% GC, Tm: 66 °C
- Solute carrier family 23 member 2 (SLC23A2)
- SLC23A2 forward: 5′-CTTCACTCTTCCGGTGGTGAT-3′; 21 nt, 52% GC, Tm: 67 °C
- SLC23A2 reverse: 5′-TTTCCGTAGTGTAGATCGCCA-3′; 21 nt, 48% GC, Tm: 65 °C
- Downstream miR-375 targets:
- Rearranged L-myc fusion (RLF)
- RLF forward: 5′-GTCATCGCCCCGTATCTCC-3′; 19 nt, 63% GC, Tm: 68 °C
- RLF reverse: 5′-TGGCAAGTCGATATACCTCCA-3′; 21 nt, 48% GC, Tm: 65 °C
- POC1 centriolar protein B (POC1)
- POC1 forward: 5′-TTGTAACCAGCGTGCAGTTTT-3′; 21 nt, 43% GC, Tm: 65 °C
- POC1 reverse: 5′-CAGAGTCTCACGGTTCTGTCT-3′; 21 nt, 52% GC, Tm: 66 °C
- Embryonic lethal abnormal vision (ELAV)-like RNA binding protein 4
- ELAVL4 forward: 5′-AACCTCTATGTTAGCGGCCTT-3′; 21 nt, 48% GC, Tm: 66 °C
- ELAVL4 reverse: 5′-TGGACACTCCTGTGACTTGAT-3′; 21 nt, 48% GC, Tm: 65 °C
- Colorectal cancer associated 2 (COLCA2)
- COLCA2 forward: 5′-CCGGAGCCTTTGCTCAATTC-3′; 20 nt, 55% GC, Tm: 67 °C
- COLA2 reverse: 5′-ACTGGCGAGTAACTGTAGTT-3′; 20 nt, 45% GC, Tm: 63 °C
- Sperm associated antigen 9 (SPAG9)
- SPAG9 forward: 5′-CAAGGCGGATCTAAAGCTACC-3′; 21 nt, 52% GC, Tm: 65 °C
- SPAG9 reverse: 5′-TTGGCGCATCTGTAACCTTCA-3′; 21 nt, 48% GC, Tm: 67 °C
- Centromere protein M (CENPM)
- CENPM forward: 5′-GCGGACTCGATGCTCAAAGA-3′; 20 nt, 55% GC, Tm: 67 °C
- CENPM reverse: 5′-TTCTGGAGACTGTATTTGCTGTG-3′; 23 nt, 43% GC, Tm: 64 °C
- Recombination signal binding protein for immunoglobulin kappa J region (RBPJ)
- RBPJ forward: 5′-CGGCCTCCACCTAAACGAC-3′; 19 nt, 63% GC, Tm: 68 °C
- RBPJ reverse: 5′-TCCATCCACTGCCCATAAGAT-3′; 21 nt, 48% GC, Tm: 66 °C
4.6. Statistical Analysis
5. Conclusions
Author Contributions
Funding
Institutional Review Board Statement
Informed Consent Statement
Data Availability Statement
Acknowledgments
Conflicts of Interest
References
- Sha, J.; Bai, Y.; Ngo, H.X.; Okui, T.; Kanno, T. Overview of Evidence-Based Chemotherapy for Oral Cancer: Focus on Drug Resistance Related to the Epithelial-Mesenchymal Transition. Biomolecules 2021, 11, 893. [Google Scholar] [CrossRef] [PubMed]
- Kaidar-Person, O.; Gil, Z.; Billan, S. Precision medicine in head and neck cancer. Drug Resist. Updat. 2018, 40, 13–16. [Google Scholar] [CrossRef] [PubMed]
- Usman, S.; Jamal, A.; Teh, M.T.; Waseem, A. Major Molecular Signaling Pathways in Oral Cancer Associated with Therapeutic Resistance. Front. Oral Health 2021, 1, 603160. [Google Scholar] [CrossRef] [PubMed]
- Han, G.; Xu, C.; Yu, D. Mechanisms correlated with chemotherapy resistance in tongue cancers. J. Cancer Res. Ther. 2018, 14, 1–5. [Google Scholar] [CrossRef] [PubMed]
- Meng, X.; Lou, Q.Y.; Yang, W.Y.; Wang, Y.R.; Chen, R.; Wang, L.; Xu, T.; Zhang, L. The role of non-coding RNAs in drug resistance of oral squamous cell carcinoma and therapeutic potential. Cancer Commun. 2021, 41, 981–1006. [Google Scholar] [CrossRef]
- Xin, C.; Huang, F.; Wang, J.; Li, J.; Chen, Q. Roles of circRNAs in cancer chemoresistance (Review). Oncol. Rep. 2021, 46, 225. [Google Scholar] [CrossRef] [PubMed]
- Yamaguchi, K.; Yamamoto, T.; Chikuda, J.; Shirota, T.; Yamamoto, Y. Impact of Non-Coding RNAs on Chemotherapeutic Resistance in Oral Cancer. Biomolecules 2022, 12, 284. [Google Scholar] [CrossRef]
- Vahabi, M.; Blandino, G.; Di Agostino, S. MicroRNAs in head and neck squamous cell carcinoma: A possible challenge as biomarkers, determinants for the choice of therapy and targets for personalized molecular therapies. Transl. Cancer Res. 2021, 10, 3090–3110. [Google Scholar] [CrossRef]
- Shaw, P.; Raymond, G.; Senthilnathan, R.; Kumarasamy, C.; Baxi, S.; Suresh, D.; Shetty, S.; Ram, M.R.; Chandramoorthy, H.C.; Sivanandy, P.; et al. Clinical Theragnostic Relationship between Chemotherapeutic Resistance, and Sensitivity and miRNA Expressions in Head and Neck Cancers: A Systematic Review and Meta-Analysis Protocol. Genes 2021, 12, 2029. [Google Scholar] [CrossRef]
- Dai, F.; Dai, L.; Zheng, X.; Guo, Y.; Zhang, Y.; Niu, M.; Lu, Y.; Li, H.; Hou, R.; Zhang, Y.; et al. Non-coding RNAs in drug resistance of head and neck cancers: A review. Biomed. Pharm. 2020, 127, 110231. [Google Scholar] [CrossRef]
- Taheri, M.; Shoorei, H.; Tondro Anamag, F.; Ghafouri-Fard, S.; Dinger, M.E. LncRNAs and miRNAs participate in determination of sensitivity of cancer cells to cisplatin. Exp. Mol. Pathol. 2021, 123, 104602. [Google Scholar] [CrossRef] [PubMed]
- Castilho, R.M.; Squarize, C.H.; Almeida, L.O. Epigenetic Modifications and Head and Neck Cancer: Implications for Tumor Progression and Resistance to Therapy. Int. J. Mol. Sci. 2017, 18, 1506. [Google Scholar] [CrossRef] [PubMed] [Green Version]
- Huang, W.C.; Jang, T.H.; Tung, S.L.; Yen, T.C.; Chan, S.H.; Wang, L.H. A novel miR-365-3p/EHF/keratin 16 axis promotes oral squamous cell carcinoma metastasis, cancer stemness and drug resistance via enhancing β5-integrin/c-met signaling pathway. J. Exp. Clin. Cancer Res. 2019, 38, 89. [Google Scholar] [CrossRef] [Green Version]
- Coon, J.; Kingsley, K.; Howard, K.M. miR-365 (microRNA): Potential Biomarker in Oral Squamous Cell Carcinoma Exosomes and Extracellular Vesicles. Int. J. Mol. Sci. 2020, 21, 5317. [Google Scholar] [CrossRef]
- Coon, J.; Kingsley, K. Assessment of MicroRNA (miR)-365 Effects on Oral Squamous Carcinoma Cell Line Phenotypes. Biomolecules 2021, 11, 874. [Google Scholar] [CrossRef] [PubMed]
- Xing, L.; Feng, Z.; Nie, H.; Liu, M.; Liu, Y.; Zhang, X.; Zhou, H. Research progress and clinical application prospects of miRNAs in oral cancer. Mol. Biol. Rep. 2022, 49, 10653–10665. [Google Scholar] [CrossRef]
- Yang, H.; Qi, C.; Li, B.; Cheng, L. Non-coding RNAs as Novel Biomarkers in Cancer Drug Resistance. Curr. Med. Chem. 2022, 29, 837–848. [Google Scholar] [CrossRef] [PubMed]
- Tanaka, K.; Miyata, H.; Sugimura, K.; Fukuda, S.; Kanemura, T.; Yamashita, K.; Miyazaki, Y.; Takahashi, T.; Kurokawa, Y.; Yamasaki, M.; et al. miR-27 is associated with chemoresistance in esophageal cancer through transformation of normal fibroblasts to cancer-associated fibroblasts. Carcinogenesis 2015, 36, 894–903. [Google Scholar] [CrossRef] [Green Version]
- Liu, B.; Cao, G.; Dong, Z.; Guo, T. Effect of microRNA-27b on cisplatin chemotherapy sensitivity of oral squamous cell carcinoma via FZD7 signaling pathway. Oncol. Lett. 2019, 18, 667–673. [Google Scholar] [CrossRef] [PubMed] [Green Version]
- Mazumder, S.; Datta, S.; Ray, J.G.; Chaudhuri, K.; Chatterjee, R. Liquid biopsy: miRNA as a potential biomarker in oral cancer. Cancer Epidemiol. 2019, 58, 137–145. [Google Scholar] [CrossRef] [PubMed]
- Kong, F.; He, S.; Shen, X.; Li, L.; Fang, J.; Lian, M. Integrated analysis of different mRNA and miRNA profiles in human hypopharyngeal squamous cell carcinoma sensitive and resistant to chemotherapy. Neoplasma 2020, 67, 473–483. [Google Scholar] [CrossRef] [PubMed] [Green Version]
- Mayne, G.C.; Hussey, D.J.; Watson, D.I. MicroRNAs and esophageal cancer—Implications for pathogenesis and therapy. Curr. Pharm. Des. 2013, 19, 1211–1226. [Google Scholar] [CrossRef]
- Si, W.; Shen, J.; Zheng, H.; Fan, W. The role and mechanisms of action of microRNAs in cancer drug resistance. Clin. Epigenet. 2019, 11, 25. [Google Scholar] [CrossRef]
- Marima, R.; Francies, F.Z.; Hull, R.; Molefi, T.; Oyomno, M.; Khanyile, R.; Mbatha, S.; Mabongo, M.; Owen Bates, D.; Dlamini, Z. MicroRNA and Alternative mRNA Splicing Events in Cancer Drug Response/Resistance: Potent Therapeutic Targets. Biomedicines 2021, 9, 1818. [Google Scholar] [CrossRef]
- Abu, N.; Hon, K.W.; Jeyaraman, S.; Jamal, R. Long noncoding RNAs as biotargets in cisplatin-based drug resistance. Future Oncol. 2018, 14, 3085–3095. [Google Scholar] [CrossRef] [PubMed]
- Aali, M.; Mesgarzadeh, A.H.; Najjary, S.; Abdolahi, H.M.; Kojabad, A.B.; Baradaran, B. Evaluating the role of microRNAs alterations in oral squamous cell carcinoma. Gene 2020, 757, 144936. [Google Scholar] [CrossRef] [PubMed]
- Hunsaker, M.; Barba, G.; Kingsley, K.; Howard, K.M. Differential MicroRNA Expression of miR-21 and miR-155 within Oral Cancer Extracellular Vesicles in Response to Melatonin. Dent. J. 2019, 7, 48. [Google Scholar] [CrossRef] [Green Version]
- Petersen, B.; Yu, C.; Hutchings, S.; Lemmon, C.; Howard, K.M.; Kingsley, K. Differential Expression of Cellular and Exosomal MicroRNA Isolated from Oral Cancer Cells and their Resistance to Chemotherapy. Curr. Res. Dent. 2022, 13, 11–22. [Google Scholar] [CrossRef]
- Tavares, M.O.; Milan, T.M.; Bighetti-Trevisan, R.L.; Leopoldino, A.M.; de Almeida, L.O. Pharmacological inhibition of HDAC6 overcomes cisplatin chemoresistance by targeting cancer stem cells in oral squamous cell carcinoma. J. Oral Pathol. Med. 2022, 51, 529–537. [Google Scholar] [CrossRef]
- Han, L.; Li, L.; Wu, G. Induction of ferroptosis by carnosic acid-mediated inactivation of Nrf2/HO-1 potentiates cisplatin responsiveness in OSCC cells. Mol. Cell. Probes 2022, 64, 101821. [Google Scholar] [CrossRef]
- Tjioe, K.C.; Cardoso, D.M.; Oliveira, S.H.P.; Bernabé, D.G. Stress hormone norepinephrine incites resistance of oral cancer cells to chemotherapy. Endocr.-Relat. Cancer 2022, 29, 201–212. [Google Scholar] [CrossRef] [PubMed]
- de Bem Prunes, B.; Nunes, J.S.; da Silva, V.P.; Laureano, N.K.; Gonçalves, D.R.; Machado, I.S.; Barbosa, S.; Lamers, M.L.; Rados, P.V.; Kurth, I.; et al. The role of tumor acidification in aggressiveness, cell dissemination and treatment resistance of oral squamous cell carcinoma. Life Sci. 2022, 288, 120163. [Google Scholar] [CrossRef] [PubMed]
- Kumari, P.; Kumar, S.; Sethy, M.; Bhue, S.; Mohanta, B.K.; Dixit, A. Identification of therapeutically potential targets and their ligands for the treatment of OSCC. Front. Oncol. 2022, 12, 910494. [Google Scholar] [CrossRef]
- Dai, H.T.; Wang, S.T.; Chen, B.; Tang, K.Y.; Li, N.; Wen, C.Y.; Wan, Y.; Zhang, G.Y.; Huang, Y.H.; Geng, Z.J. microRNA-375 inhibits the malignant behaviors of hepatic carcinoma cells by targeting NCAPG2. Neoplasma 2022, 69, 16–27. [Google Scholar] [CrossRef] [PubMed]
- Yu, K.; Li, H.; Jiang, Z.; Hsu, H.J.; Hsu, H.C.; Zhang, Y.; Wang, K. miR-375/Yes-associated protein axis regulates IL-6 and TGF-β expression, which is involved in the cisplatin-induced resistance of liver cancer cells. Oncol. Rep. 2021, 46, 1–9. [Google Scholar] [CrossRef]
- Gao, S.; Wang, K.; Wang, X. miR-375 targeting autophagy-related 2B (ATG2B) suppresses autophagy and tumorigenesis in cisplatin-resistant osteosarcoma cells. Neoplasma 2020, 67, 724–734. [Google Scholar] [CrossRef]
- Liu, A.S.; Yu, H.Y.; Yang, Y.L.; Xue, F.Y.; Chen, X.; Zhang, Y.; Zhou, Z.Y.; Zhang, B.; Li, L.; Sun, C.Z.; et al. A Chemotherapy-Driven Increase in Mcl-1 Mediates the Effect of miR-375 on Cisplatin Resistance in Osteosarcoma Cells. OncoTargets Ther. 2019, 12, 11667–11677. [Google Scholar] [CrossRef] [Green Version]
- Xu, X.; Chen, X.; Xu, M.; Liu, X.; Pan, B.; Qin, J.; Xu, T.; Zeng, K.; Pan, Y.; He, B.; et al. miR-375-3p suppresses tumorigenesis and partially reverses chemoresistance by targeting YAP1 and SP1 in colorectal cancer cells. Aging 2019, 11, 7357–7385. [Google Scholar] [CrossRef]
- Wang, Y.; Lieberman, R.; Pan, J.; Zhang, Q.; Du, M.; Zhang, P.; Nevalainen, M.; Kohli, M.; Shenoy, N.K.; Meng, H.; et al. miR-375 induces docetaxel resistance in prostate cancer by targeting SEC23A and YAP1. Mol. Cancer 2016, 15, 70. [Google Scholar] [CrossRef] [Green Version]
- Guo, J.; Liu, X.; Yang, Y.; Liang, M.; Bai, C.; Zhao, Z.; Sun, B. miR-375 down-regulation of the rearranged L-myc fusion and hypoxia-induced gene domain protein 1A genes and effects on Sertoli cell proliferation. Asian-Australas. J. Anim. Sci. 2018, 31, 1103–1109. [Google Scholar] [CrossRef]
- Loftus, S.K.; Baxter, L.L.; Cronin, J.C.; Fufa, T.D.; NISC Comparative Sequencing Program; Pavan, W.J. Hypoxia-induced HIF1α targets in melanocytes reveal a molecular profile associated with poor melanoma prognosis. Pigment. Cell Melanoma Res. 2017, 30, 339–352. [Google Scholar] [CrossRef] [PubMed] [Green Version]
- Wolthuis, R.M.; de Ruiter, N.D.; Cool, R.H.; Bos, J.L. Stimulation of gene induction and cell growth by the Ras effector Rlf. EMBO J. 1997, 16, 6748–6761. [Google Scholar] [CrossRef] [PubMed] [Green Version]
- Gomes Pereira, S.; Sousa, A.L.; Nabais, C.; Paixão, T.; Holmes, A.J.; Schorb, M.; Goshima, G.; Tranfield, E.M.; Becker, J.D.; Bettencourt-Dias, M. The 3D architecture and molecular foundations of de novo centriole assembly via bicentrioles. Curr. Biol. 2021, 31, 4340–4353.e7. [Google Scholar] [CrossRef] [PubMed]
- Venoux, M.; Tait, X.; Hames, R.S.; Straatman, K.R.; Woodland, H.R.; Fry, A.M. Poc1A and Poc1B act together in human cells to ensure centriole integrity. J. Cell Sci. 2013, 126 Pt 1, 163–175. [Google Scholar] [CrossRef] [Green Version]
- Karimi Dermani, F.; Gholamzadeh Khoei, S.; Afshar, S.; Amini, R. The potential role of nucleophosmin (NPM1) in the development of cancer. J. Cell. Physiol. 2021, 236, 7832–7852. [Google Scholar] [CrossRef]
- López, D.J.; Rodríguez, J.A.; Bañuelos, S. Nucleophosmin, a multifunctional nucleolar organizer with a role in DNA repair. Biochim. Biophys Acta Proteins Proteom 2020, 1868, 140532. [Google Scholar] [CrossRef] [PubMed]
- Senapati, P.; Bhattacharya, A.; Das, S.; Dey, S.; Sudarshan, D.; Vishwakarma, J.; Sudevan, S.; Ramachandran, R.; Maliekal, T.T.; Kundu, T.K. Histone Chaperone Nucleophosmin Regulates Transcription of Key Genes Involved in Oral Tumorigenesis. Mol. Cell. Biol. 2022, 42, e0066920. [Google Scholar] [CrossRef] [PubMed]
- Peng, H.H.; Ko, H.H.; Chi, N.C.; Wang, Y.P.; Lee, H.C.; Pan, P.Y.; Kuo, M.Y.; Cheng, S.J. Upregulated NPM1 is an independent biomarker to predict progression and prognosis of oral squamous cell carcinomas in Taiwan. Head Neck 2020, 42, 5–13. [Google Scholar] [CrossRef] [PubMed]
- Werner, M.T.; Zhao, C.; Zhang, Q.; Wasik, M.A. Nucleophosmin-anaplastic lymphoma kinase: The ultimate oncogene and therapeutic target. Blood 2017, 129, 823–831. [Google Scholar] [CrossRef] [Green Version]
- Law, Z.J.; Khoo, X.H.; Lim, P.T.; Goh, B.H.; Ming, L.C.; Lee, W.L.; Goh, H.P. Extracellular Vesicle-Mediated Chemoresistance in Oral Squamous Cell Carcinoma. Front. Mol. Biosci. 2021, 8, 629888. [Google Scholar] [CrossRef]
- Cristaldi, M.; Mauceri, R.; Di Fede, O.; Giuliana, G.; Campisi, G.; Panzarella, V. Salivary Biomarkers for Oral Squamous Cell Carcinoma Diagnosis and Follow-up: Current Status and Perspectives. Front. Physiol. 2019, 10, 1476. [Google Scholar] [CrossRef] [PubMed]
- Dar, G.M.; Agarwal, S.; Kumar, A.; Nimisha Apurva Sharma, A.K.; Verma, R.; Sattar, R.S.A.; Ahmad, E.; Ali, A.; Mahajan, B.; Saluja, S.S.; et al. A non-invasive miRNA-based approach in early diagnosis and therapeutics of oral cancer. Crit. Rev. Oncol. 2022, 180, 103850. [Google Scholar] [CrossRef] [PubMed]
- Holjencin, C.; Jakymiw, A. MicroRNAs and Their Big Therapeutic Impacts: Delivery Strategies for Cancer Intervention. Cells 2022, 11, 2332. [Google Scholar] [CrossRef] [PubMed]


| Cell Line | RNA Concentration [ng/uL] | RNA Purity A260:A280 Ratio | Secondary Purity A260:A230 |
|---|---|---|---|
| SCC4 | 515.3 +/− 29.2 | 1.81 | 2.02 |
| SCC9 | 488.1 +/− 35.1 | 1.74 | 2.06 |
| SCC15 | 492.3 +/− 43.2 | 1.71 | 2.11 |
| SCC25 | 501.2 +/− 55.4 | 1.76 | 2.08 |
| CAL27 | 511.2 +/− 51.2 | 1.83 | 2.14 |
| Average | 501.6 +/− 42.8 | 1.77 | 2.08 |
| Range | 488.1–511.2 | 1.71–1.83 | 2.02–2.14 |
| Cell Line | cDNA Concentration [ng/uL] | DNA Purity A260:A180 Ratio |
|---|---|---|
| SCC4 | 1566.2 +/− 101.3 | 1.81 |
| SCC9 | 1455.2 +/− 94.1 | 1.84 |
| SCC15 | 1501.3 +/− 99.8 | 1.84 |
| SCC25 | 1438.4 +/− 83.3 | 1.88 |
| CAL27 | 1522.1 +/− 98.2 | 1.82 |
| Average | 1496.6 +/− 95.3 | 1.84 |
| Range | 1438.4–1566.2 | 1.81–1.88 |
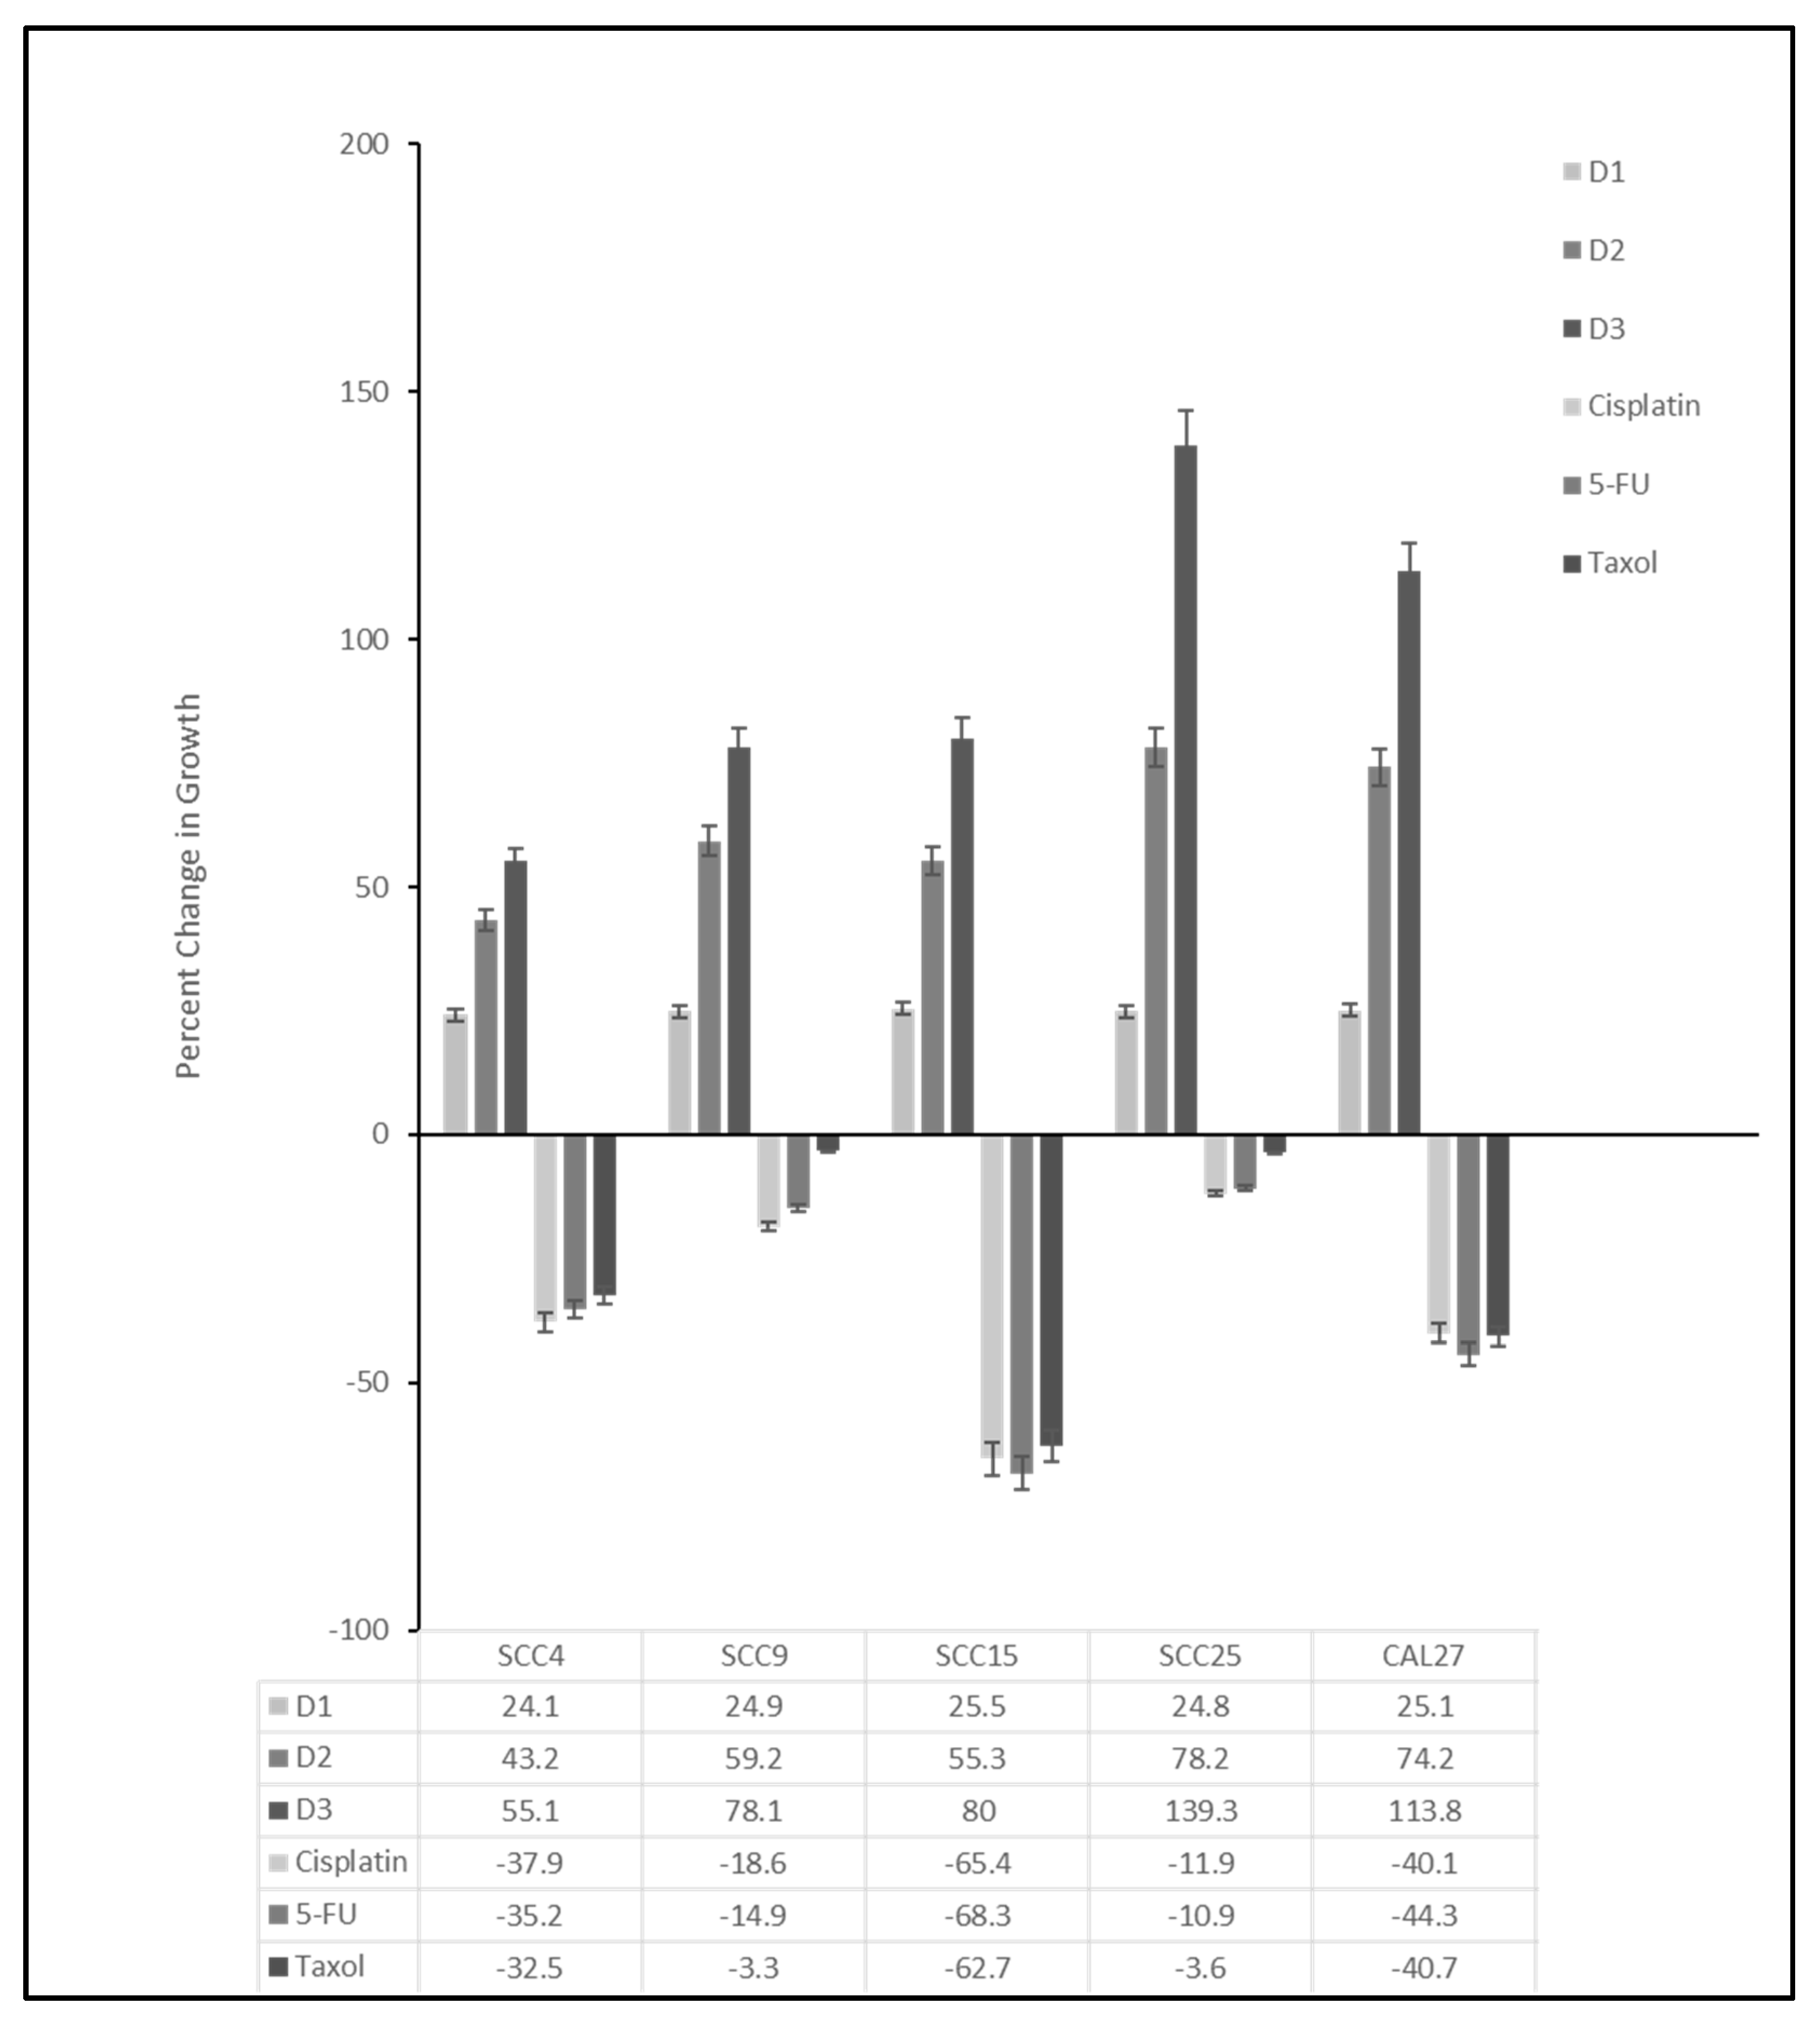
| SCC9 Resistance Range: −3.3% to −18.6% Average: −12.3% | SCC25 Resistance Range: −3.6% to −11.9% Average: −8.8% | SCC4 Resistance Range: −32.5% to −37.9% Average −35.2% | CAL27 Resistance Range: −40.1% to −44.3% Average −41.7% | SCC15 Resistance Range: −62.7% to −68.3% Average −65.5% | |
|---|---|---|---|---|---|
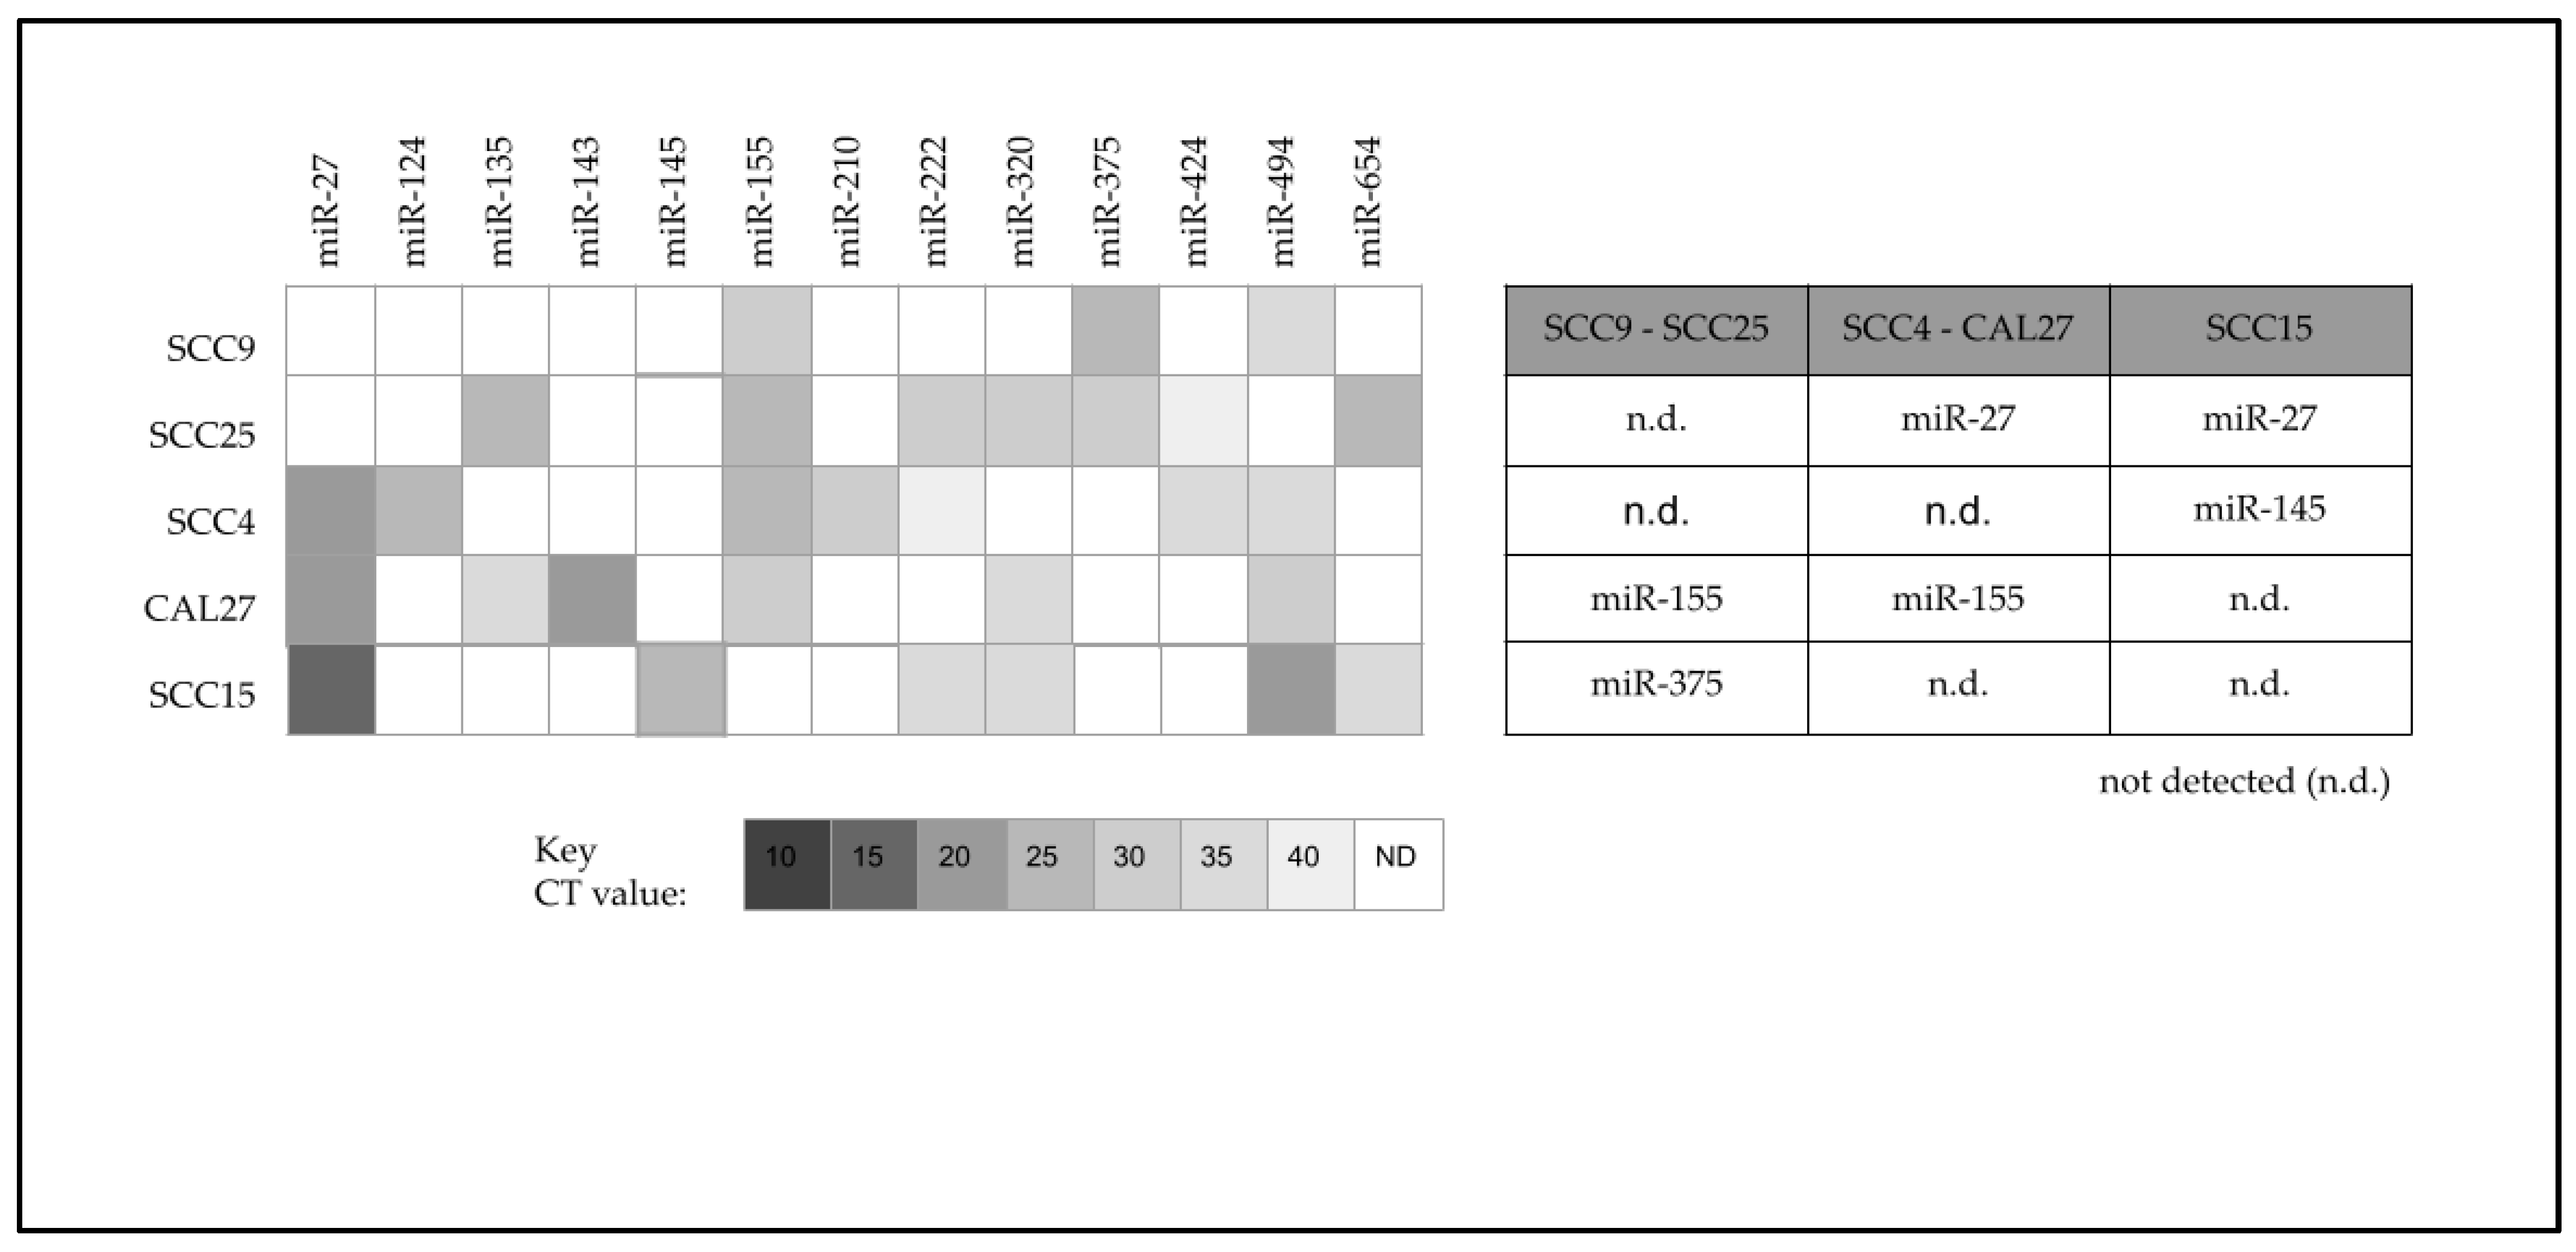
| miR-27 | n.d. | n.d. | miR-27 CT value: 20 | miR-27 CT value: 20 | miR-27 CT value: 15 |
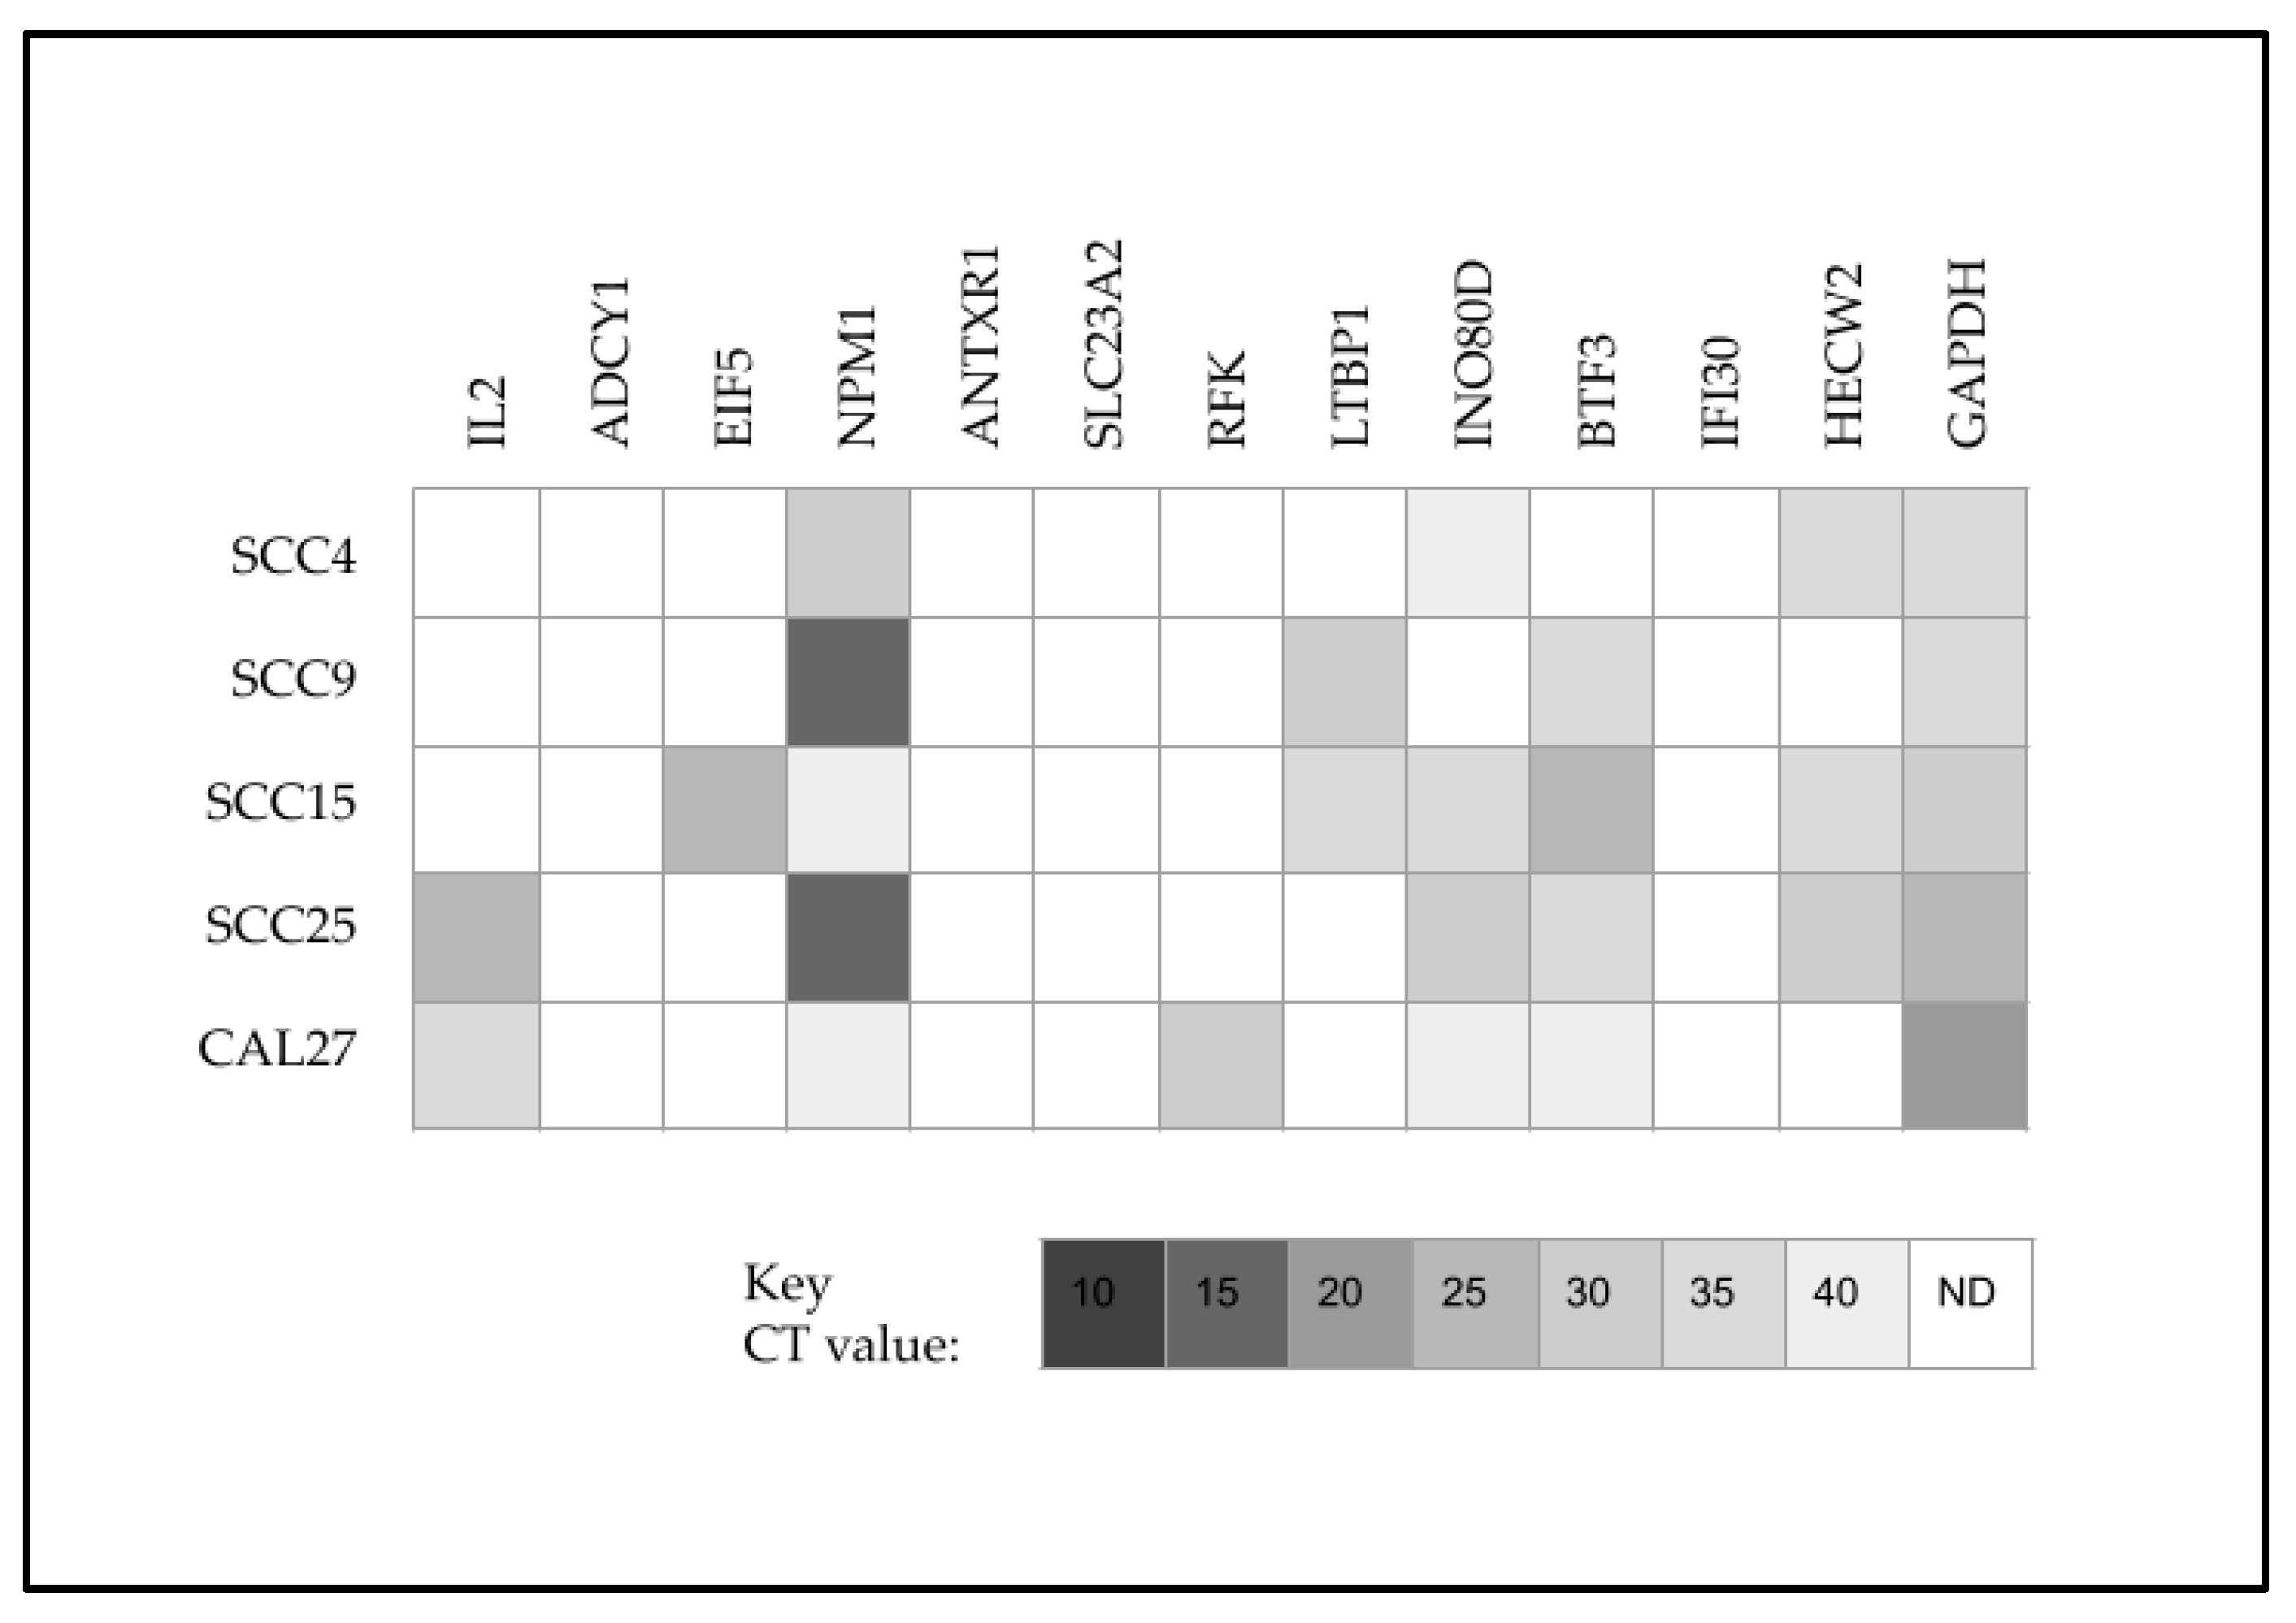
| miR-27 target | NPM1 CT value: 10 | NPM1 CT value: 10 | n.d. | n.d. | n.d. |
| miR-375 | miR-375 CT value: 25 | miR-375 CT value: 30 | n.d. | n.d. | n.d. |
| miR-375 target | RLF CT value: 20 | RLF CT value: 15 | n.d. | n.d. | n.d. |
| miR-375 target | n.d. | n.d. | POC1 CT value: 35 | POC1 CT value: 35 | POC1 CT value: 35 |
Disclaimer/Publisher’s Note: The statements, opinions and data contained in all publications are solely those of the individual author(s) and contributor(s) and not of MDPI and/or the editor(s). MDPI and/or the editor(s) disclaim responsibility for any injury to people or property resulting from any ideas, methods, instructions or products referred to in the content. |
© 2023 by the authors. Licensee MDPI, Basel, Switzerland. This article is an open access article distributed under the terms and conditions of the Creative Commons Attribution (CC BY) license (https://creativecommons.org/licenses/by/4.0/).
Share and Cite
Huni, K.C.; Cheung, J.; Sullivan, M.; Robison, W.T.; Howard, K.M.; Kingsley, K. Chemotherapeutic Drug Resistance Associated with Differential miRNA Expression of miR-375 and miR-27 among Oral Cancer Cell Lines. Int. J. Mol. Sci. 2023, 24, 1244. https://doi.org/10.3390/ijms24021244
Huni KC, Cheung J, Sullivan M, Robison WT, Howard KM, Kingsley K. Chemotherapeutic Drug Resistance Associated with Differential miRNA Expression of miR-375 and miR-27 among Oral Cancer Cell Lines. International Journal of Molecular Sciences. 2023; 24(2):1244. https://doi.org/10.3390/ijms24021244
Chicago/Turabian StyleHuni, Kieran Caberto, Jacky Cheung, Madeline Sullivan, William Taylor Robison, Katherine M. Howard, and Karl Kingsley. 2023. "Chemotherapeutic Drug Resistance Associated with Differential miRNA Expression of miR-375 and miR-27 among Oral Cancer Cell Lines" International Journal of Molecular Sciences 24, no. 2: 1244. https://doi.org/10.3390/ijms24021244