
Mitochondrial Metabolism in the Spotlight: Maintaining Balanced RNAP III Activity Ensures Cellular Homeostasis
 and
and 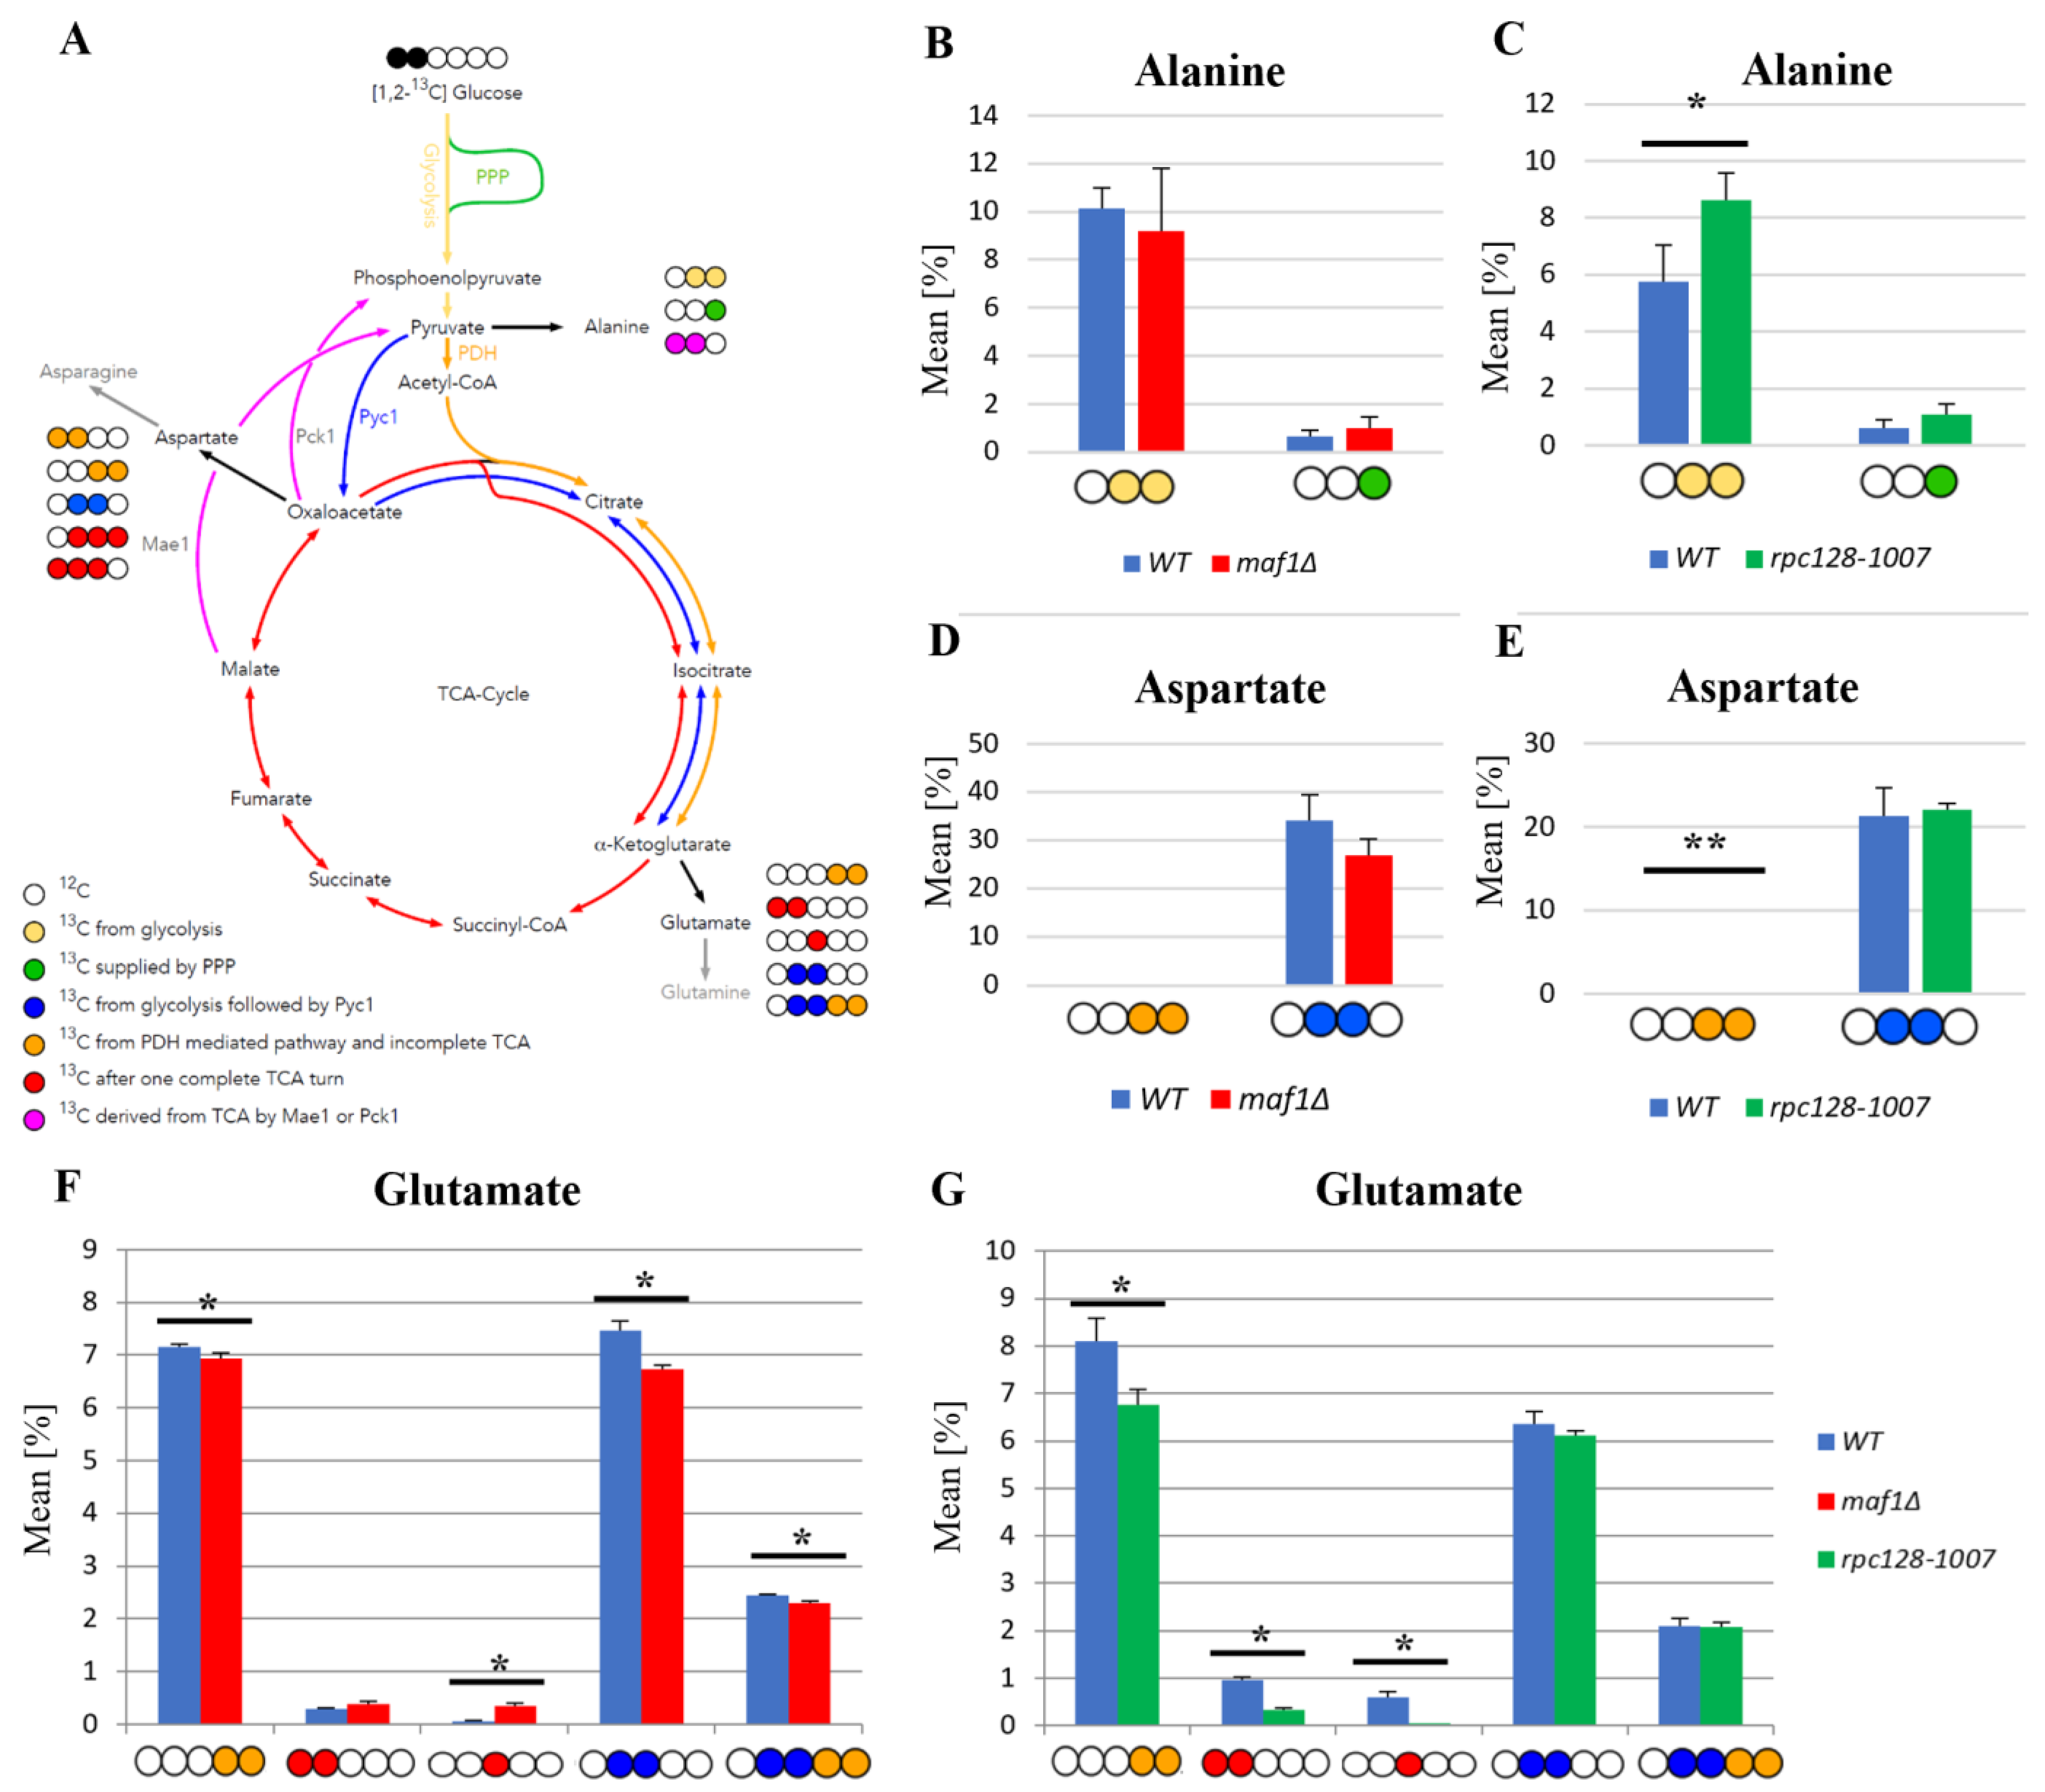
Abstract
:1. Introduction
2. Results
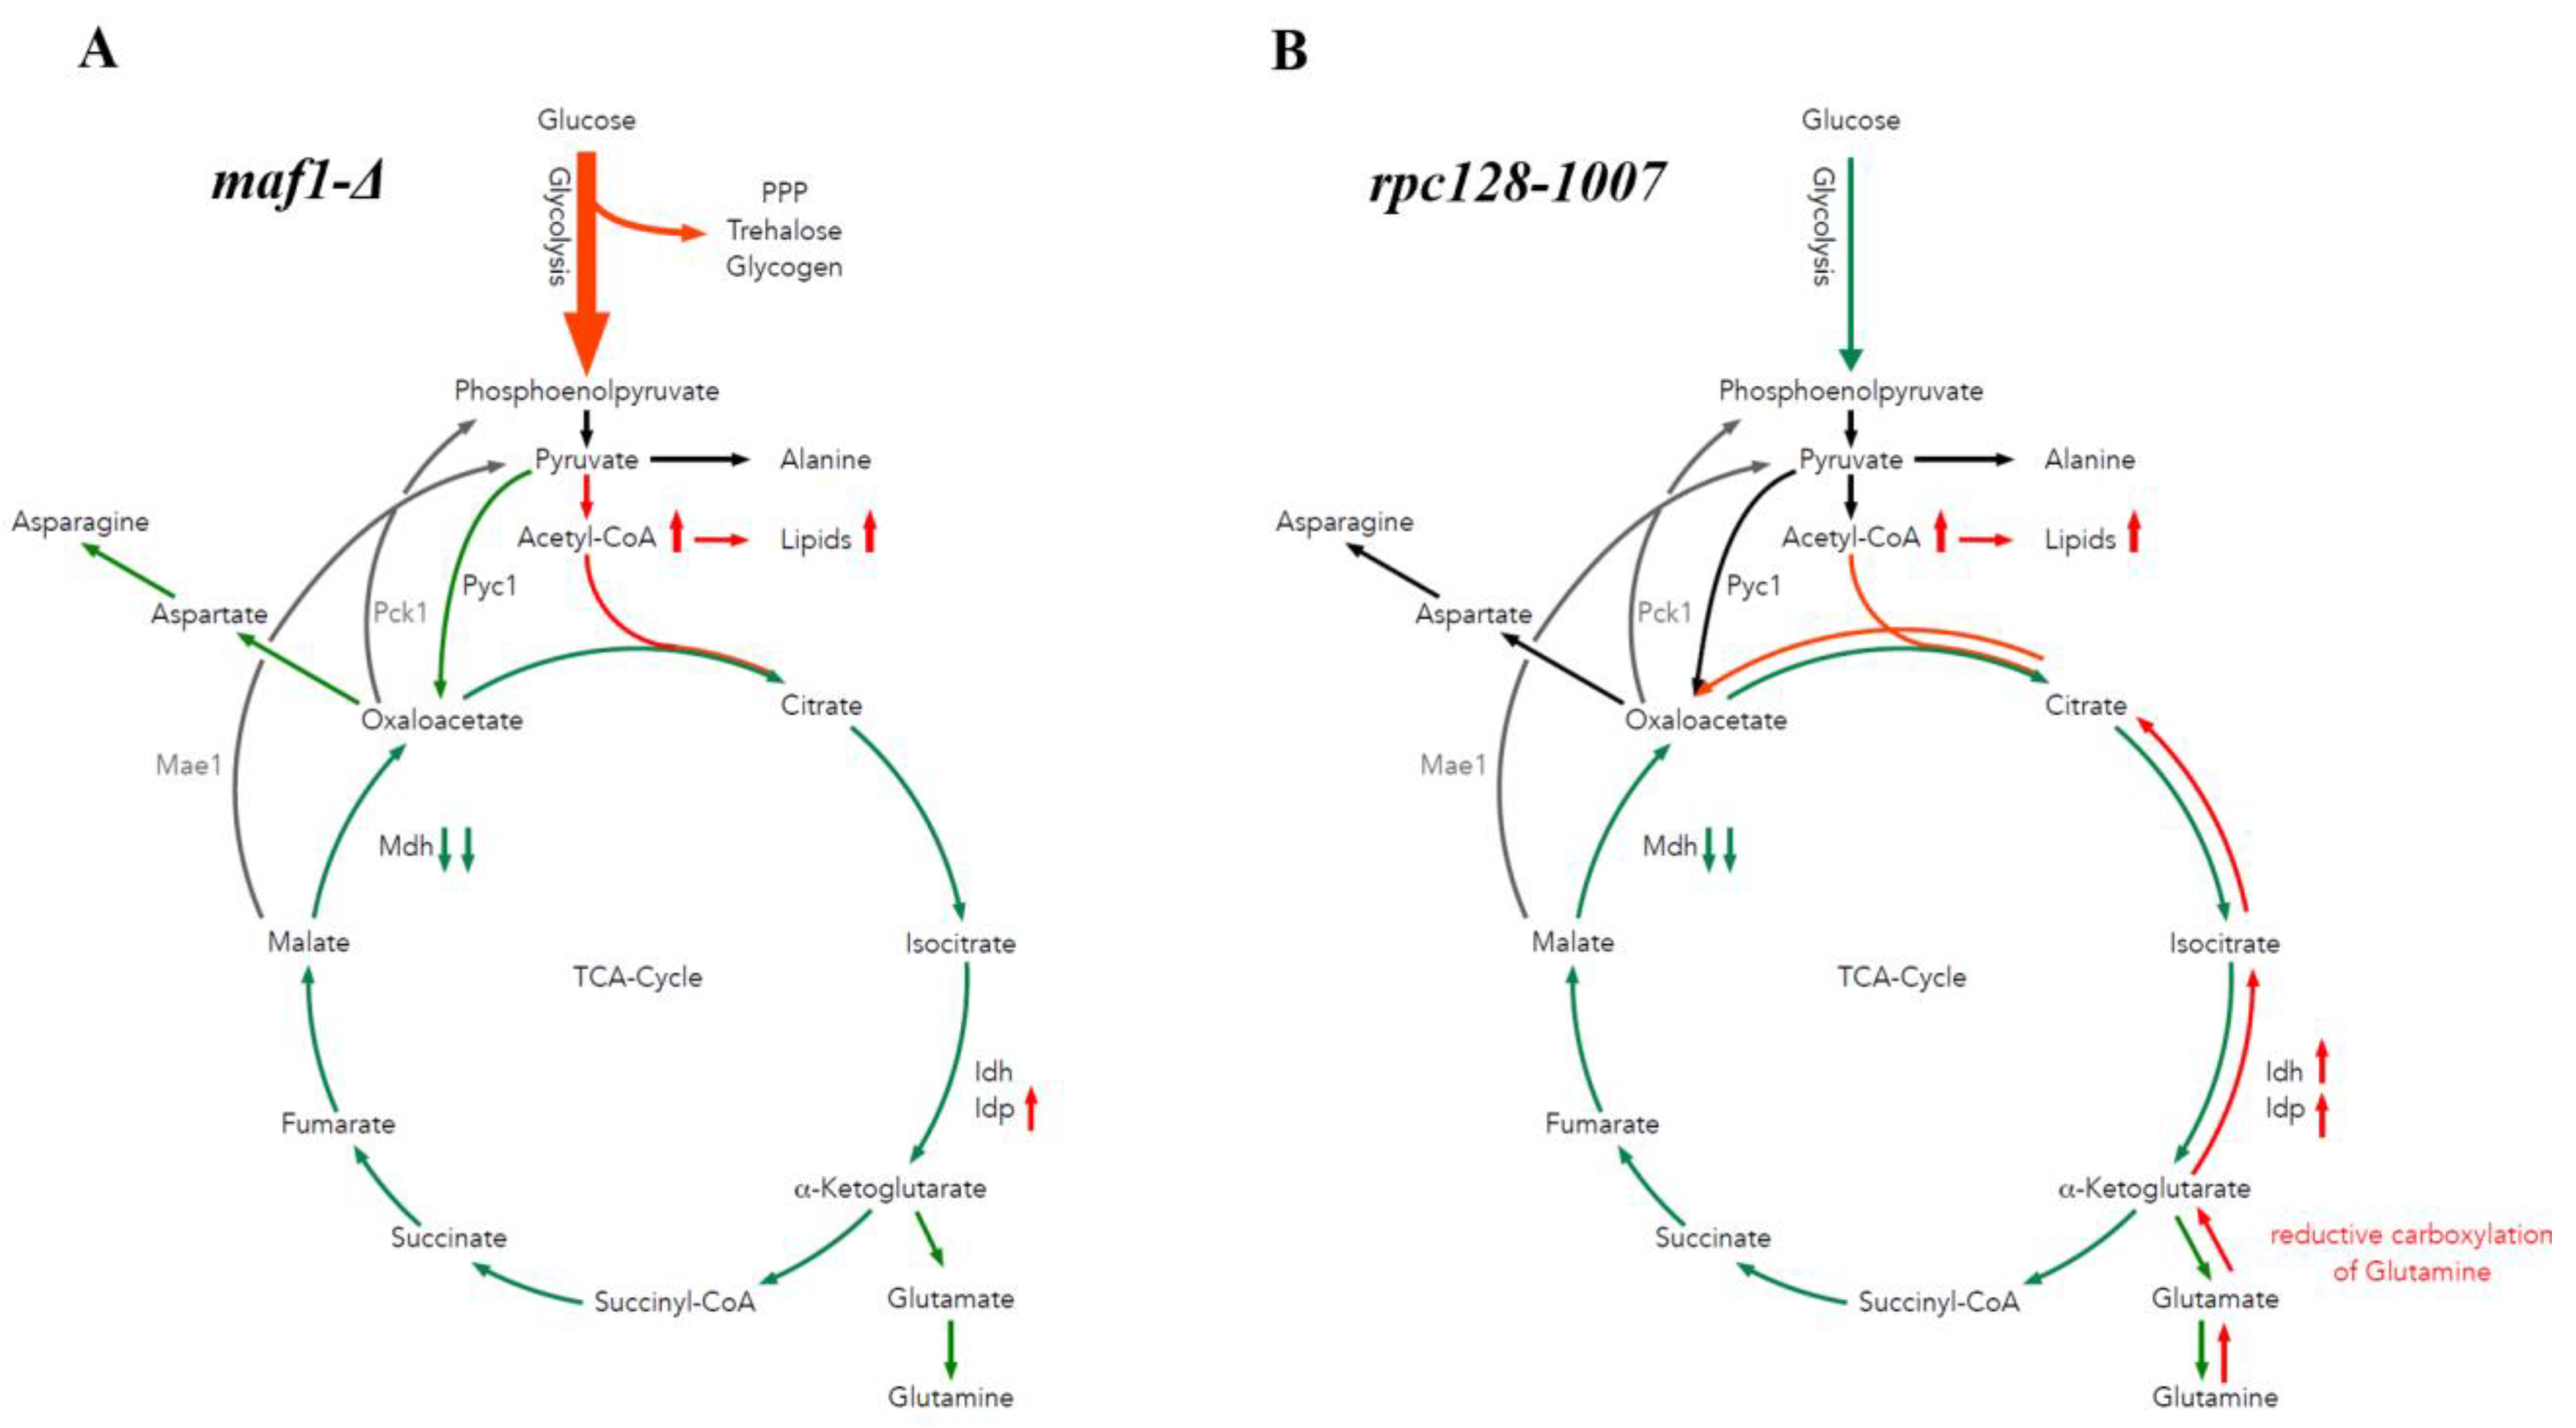
2.1. 13C Flux through the TCA Cycle Is Affected Indirectly by RNAP III Activity on Glucose
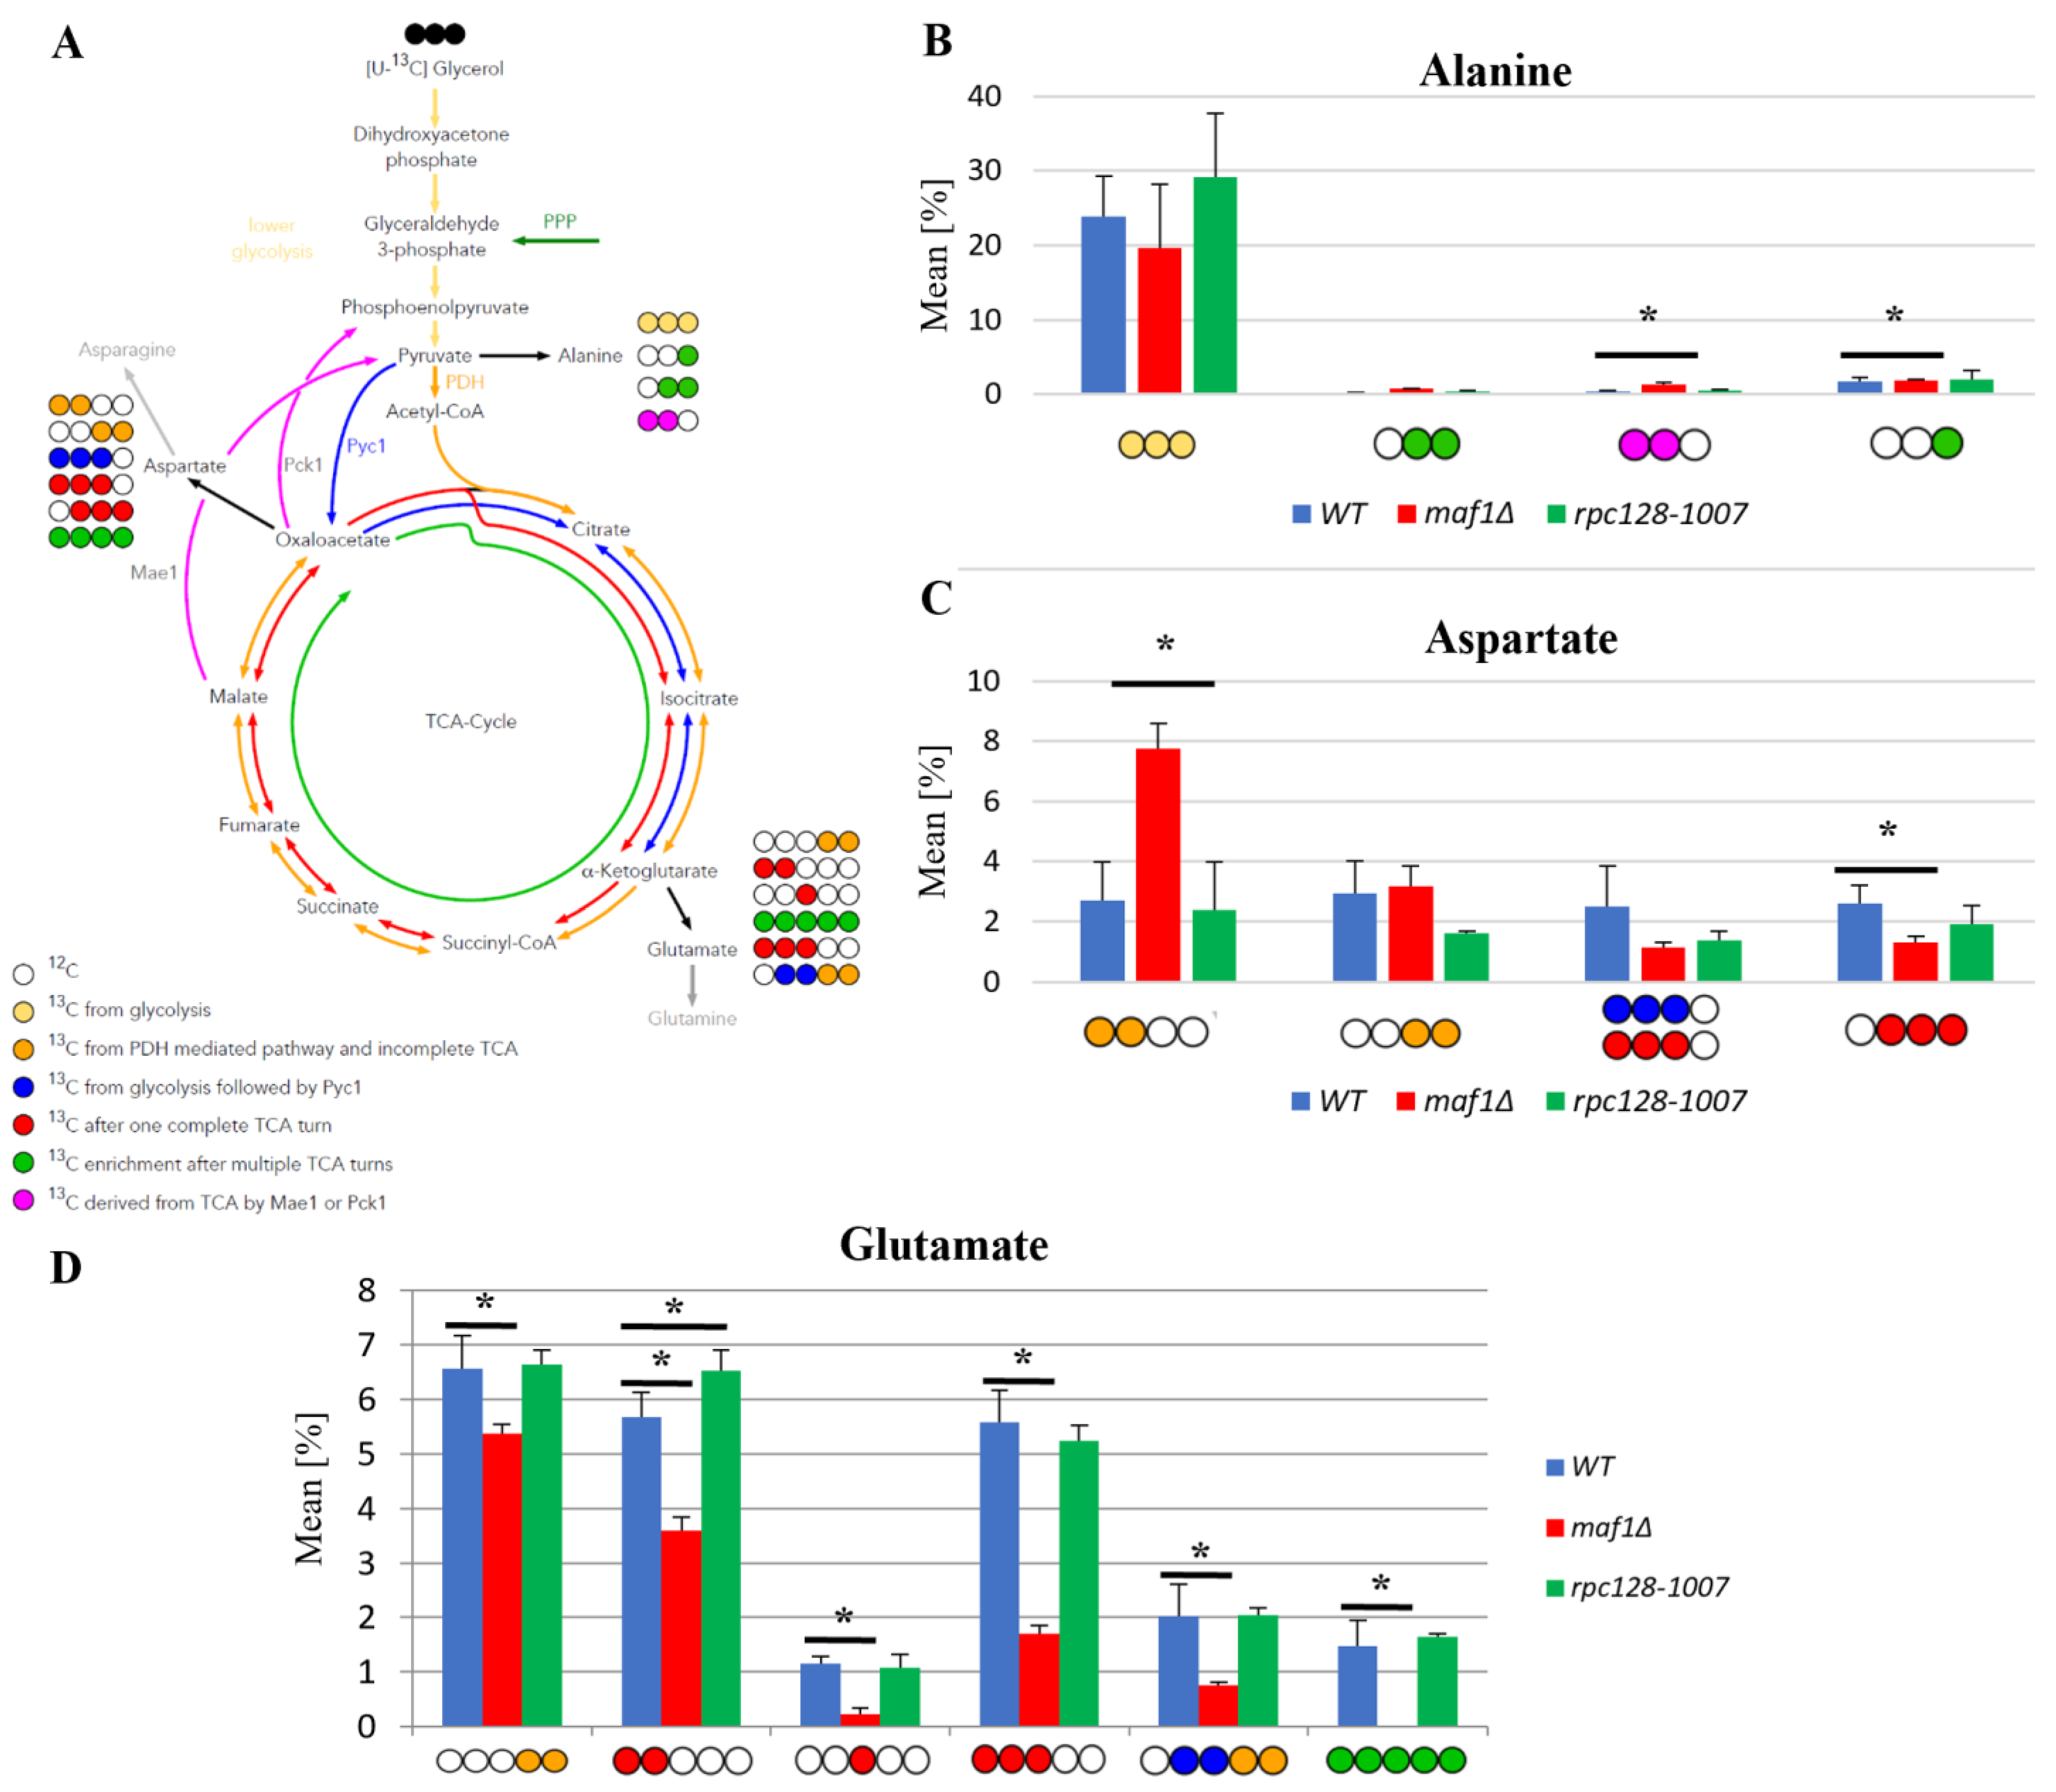
2.2. Lower Flux toward Glutamate in the MAF1-Deficient Mutant Can Be Compensated by Its Suppressor’s High Metabolic Activity in Glutamate Synthesis
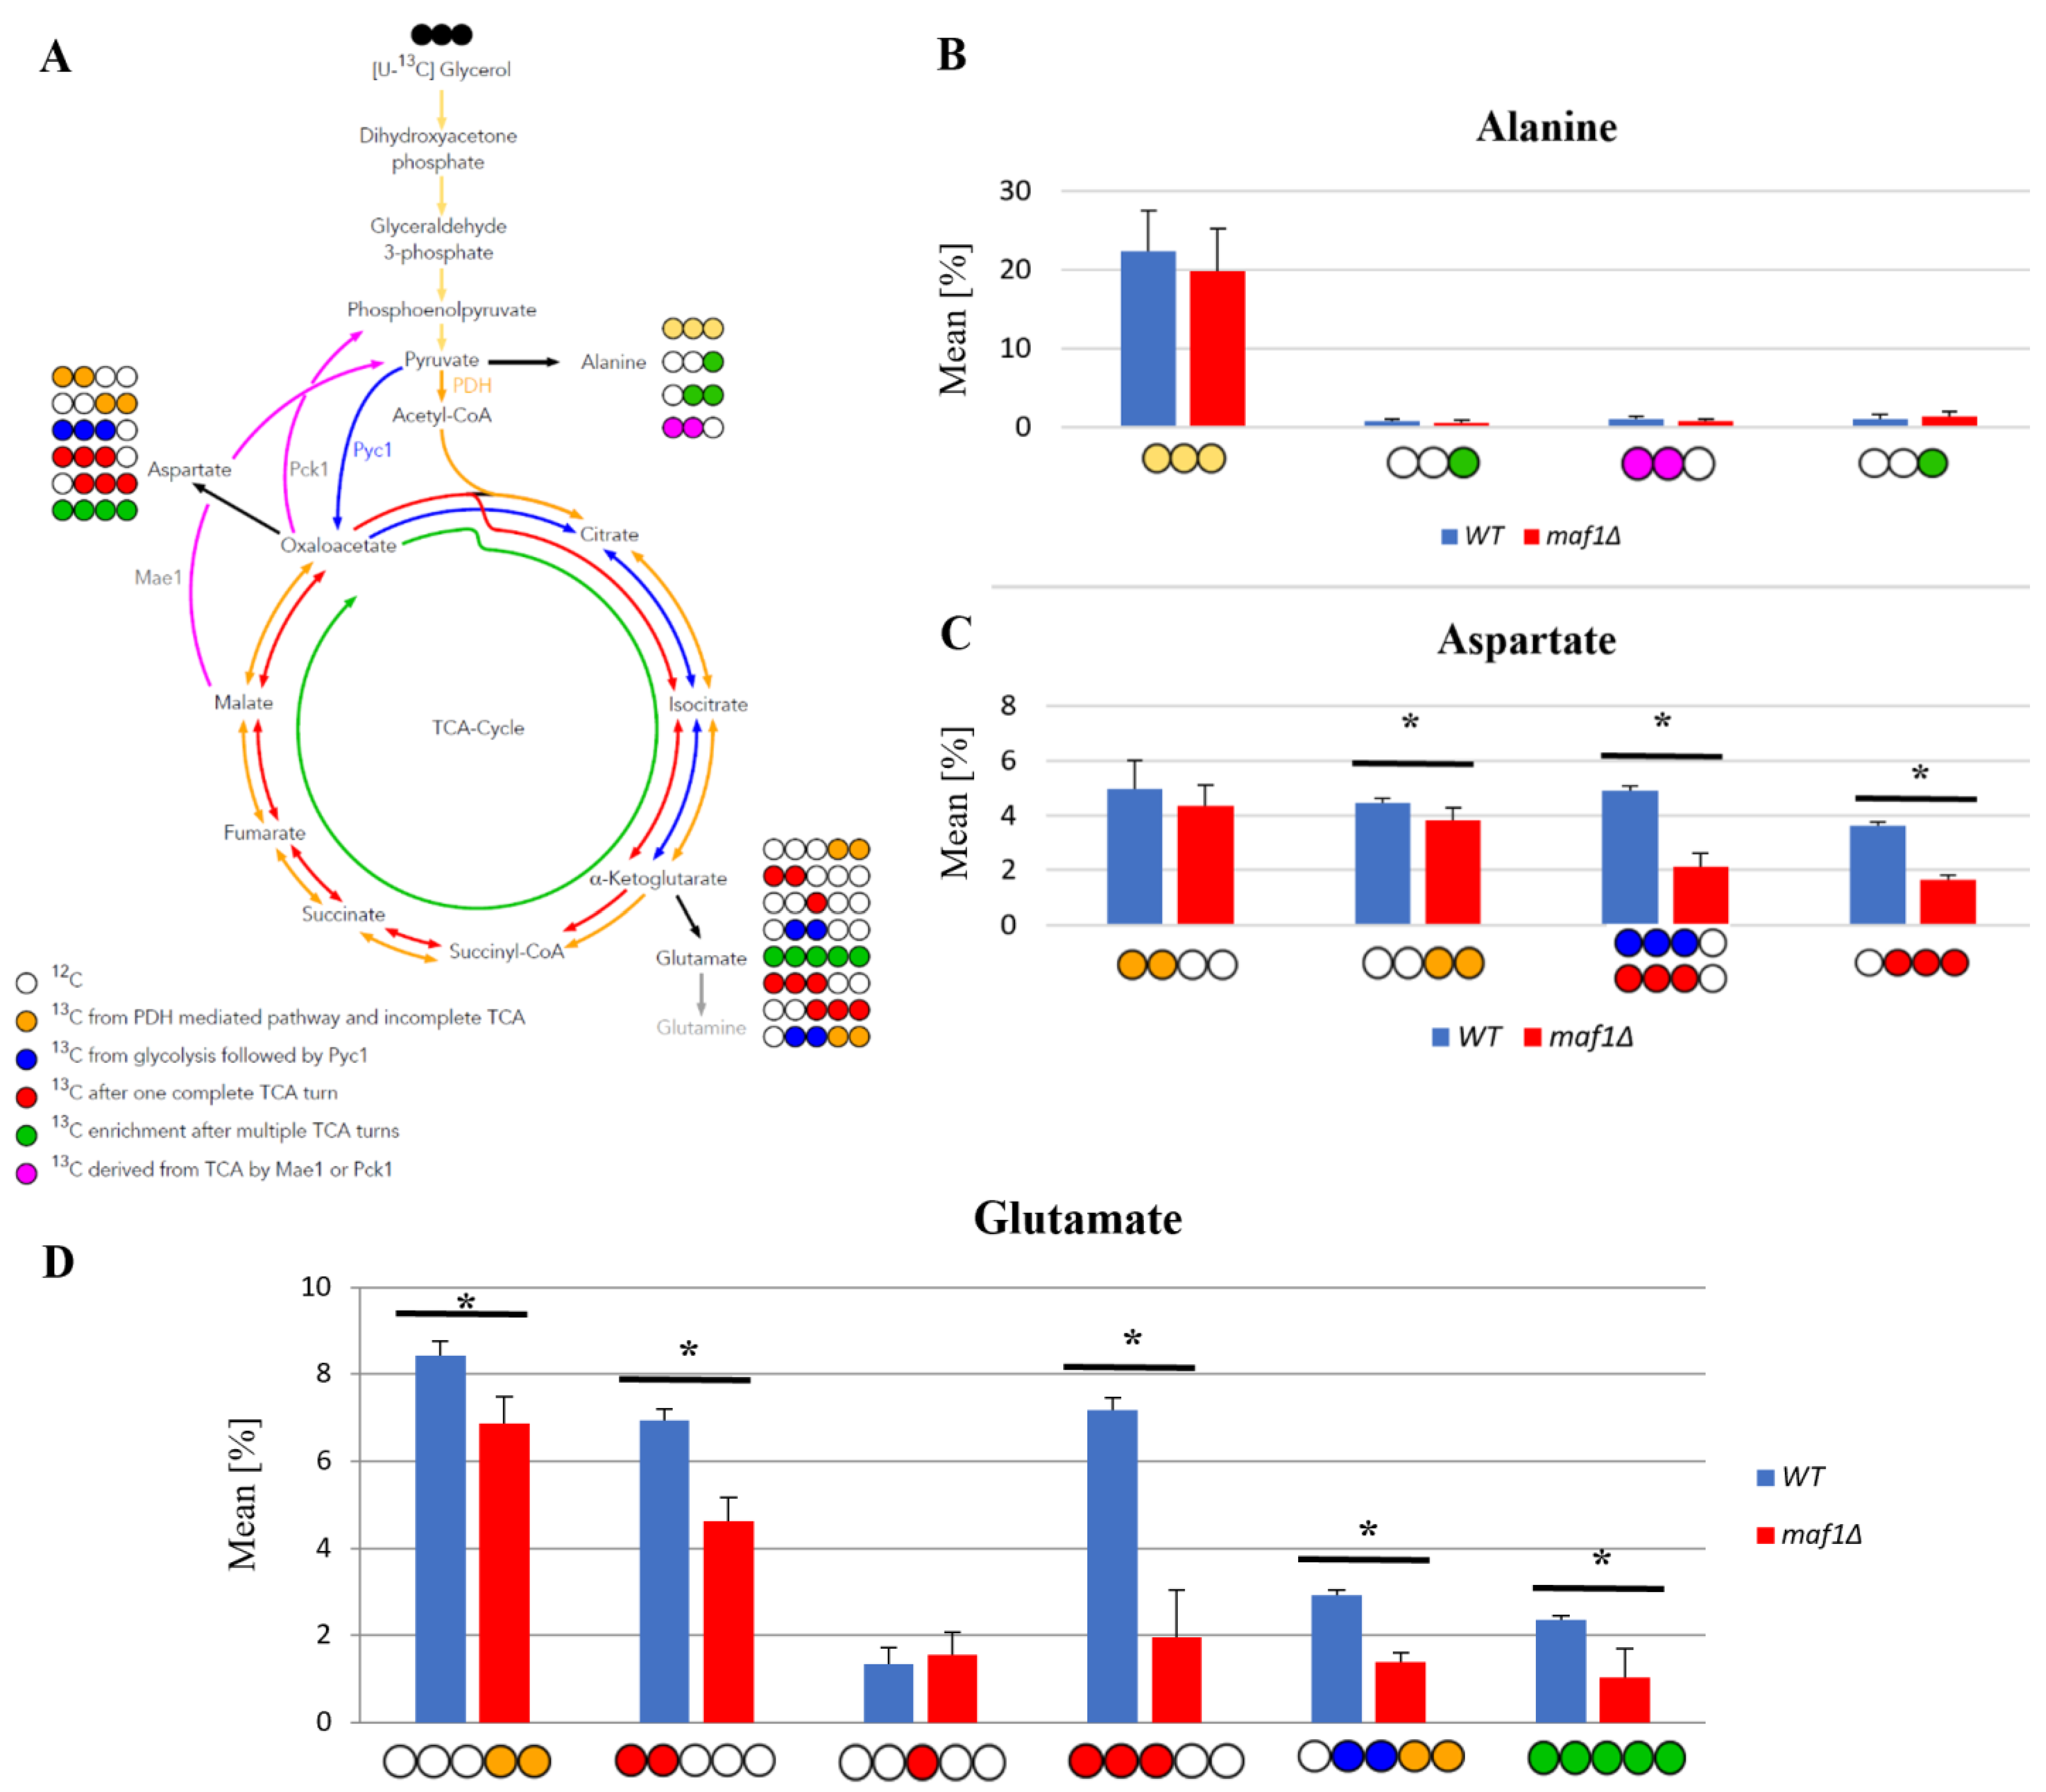
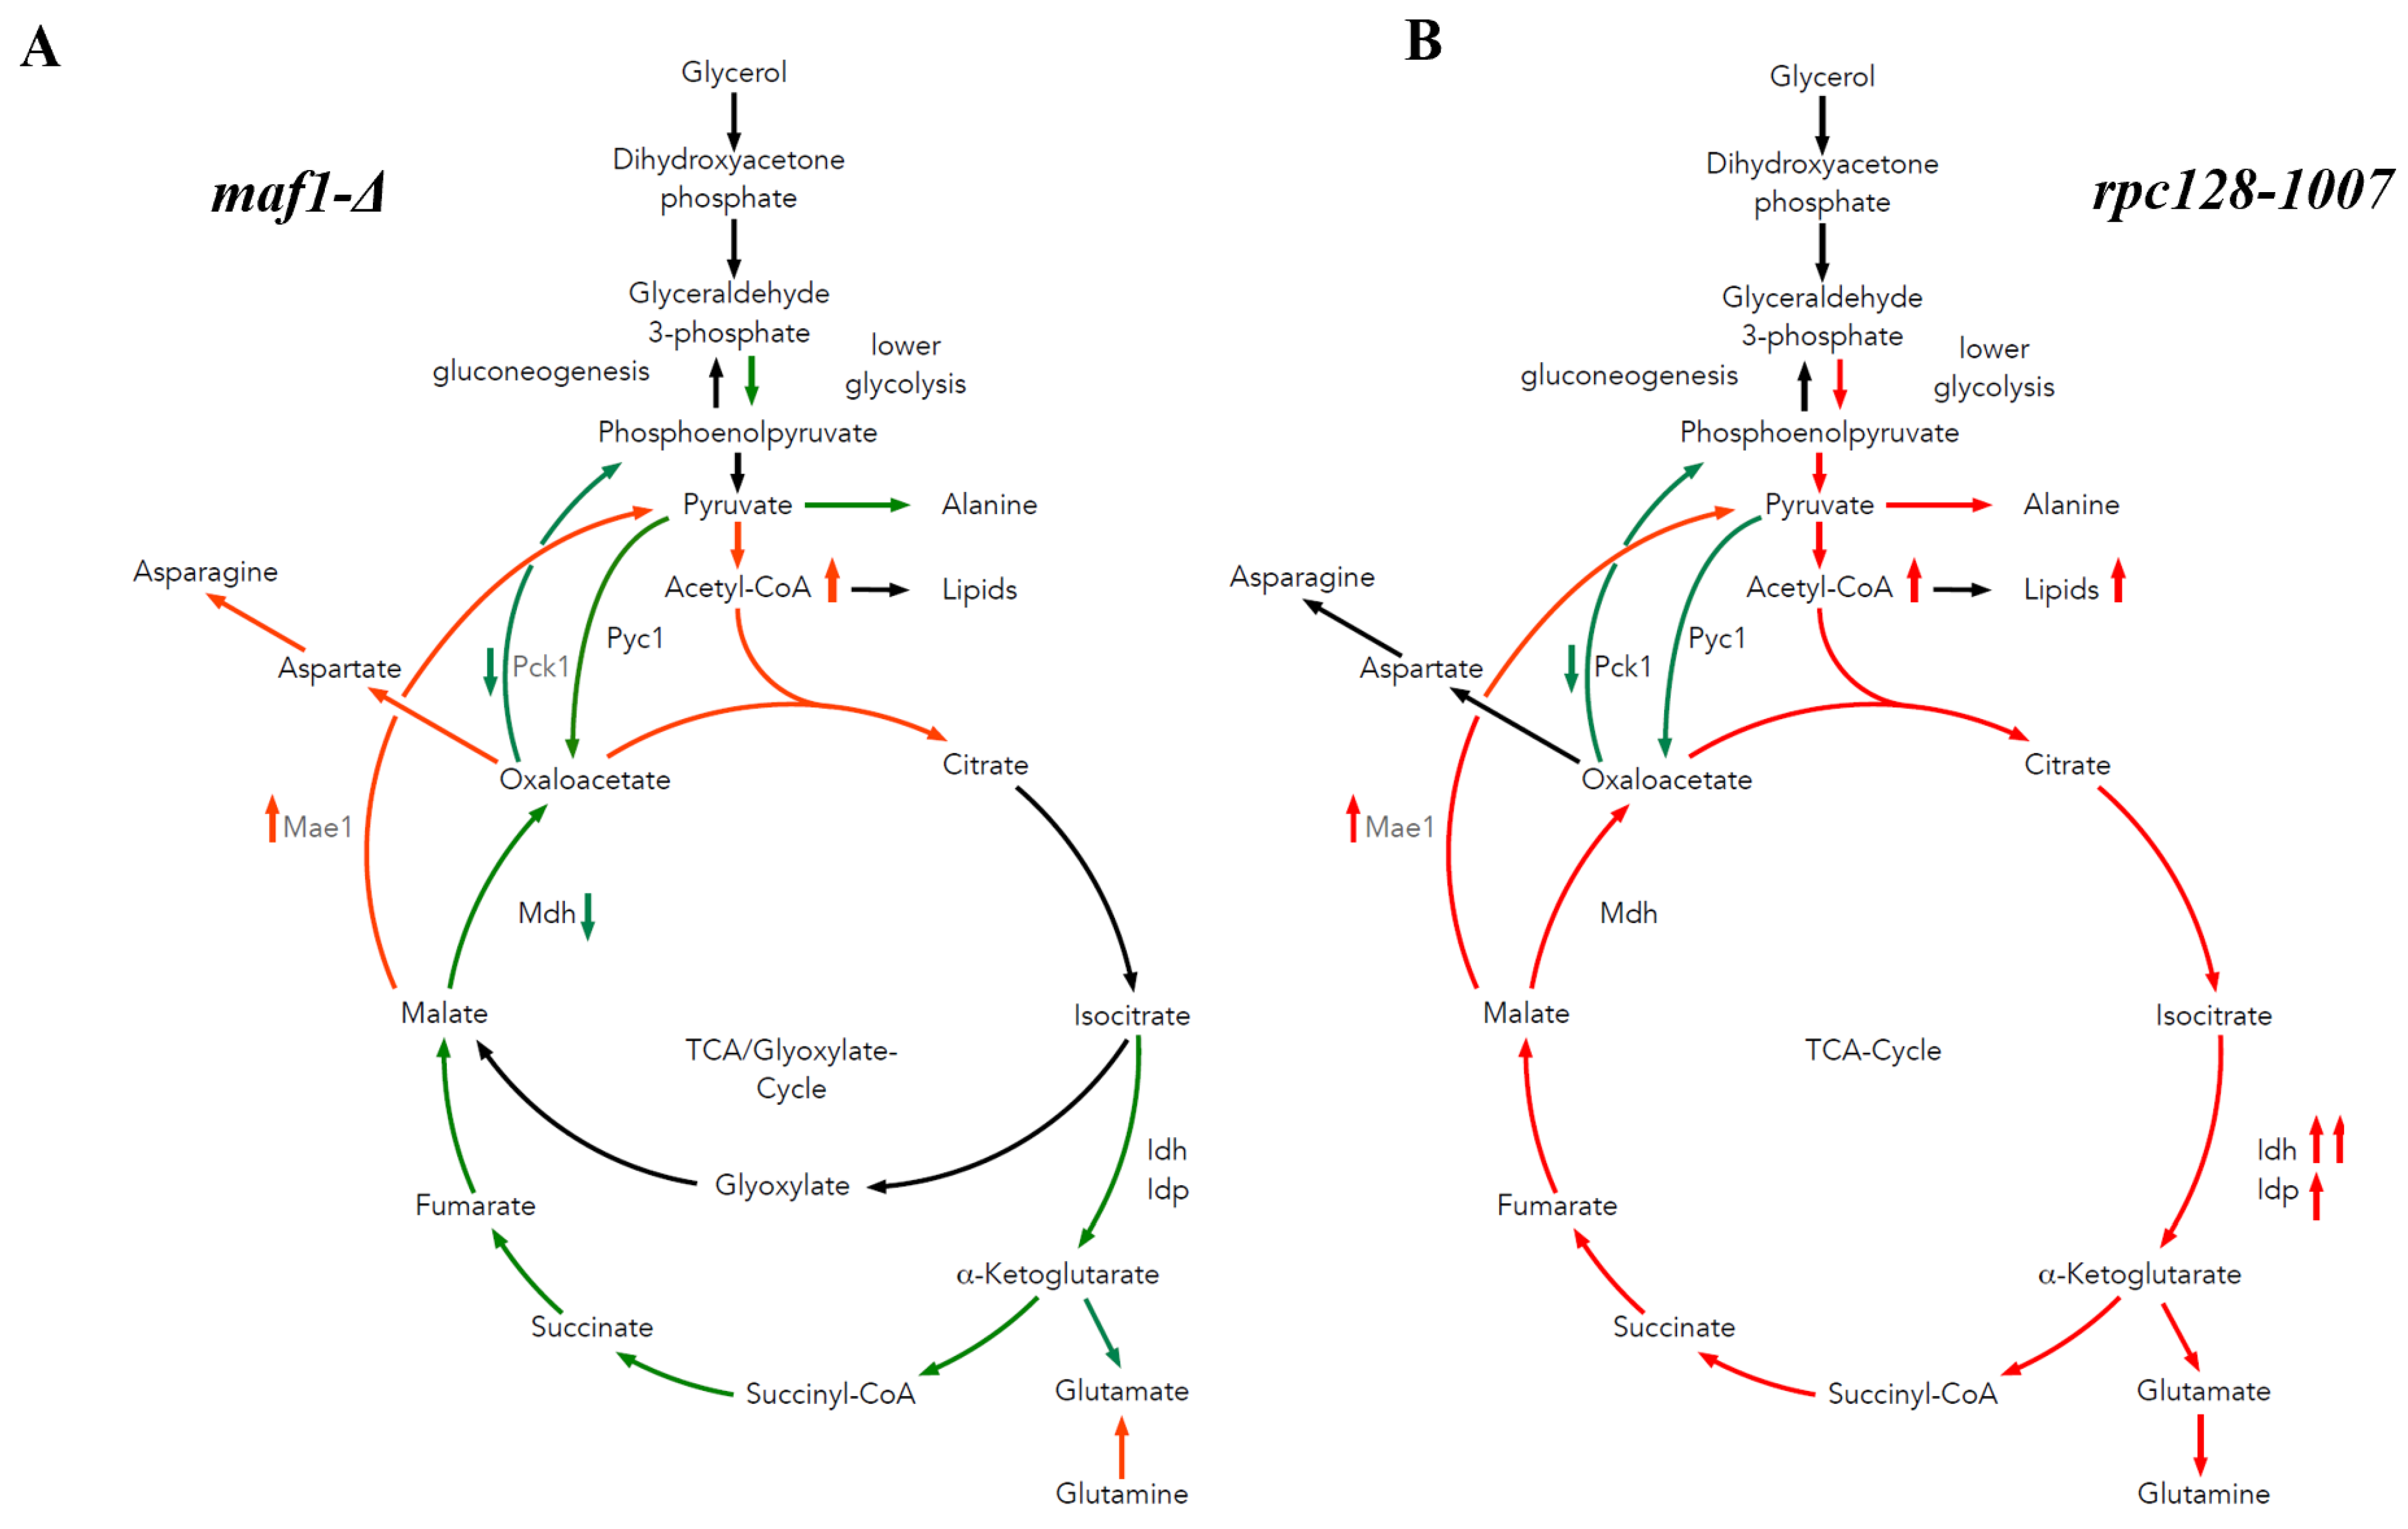
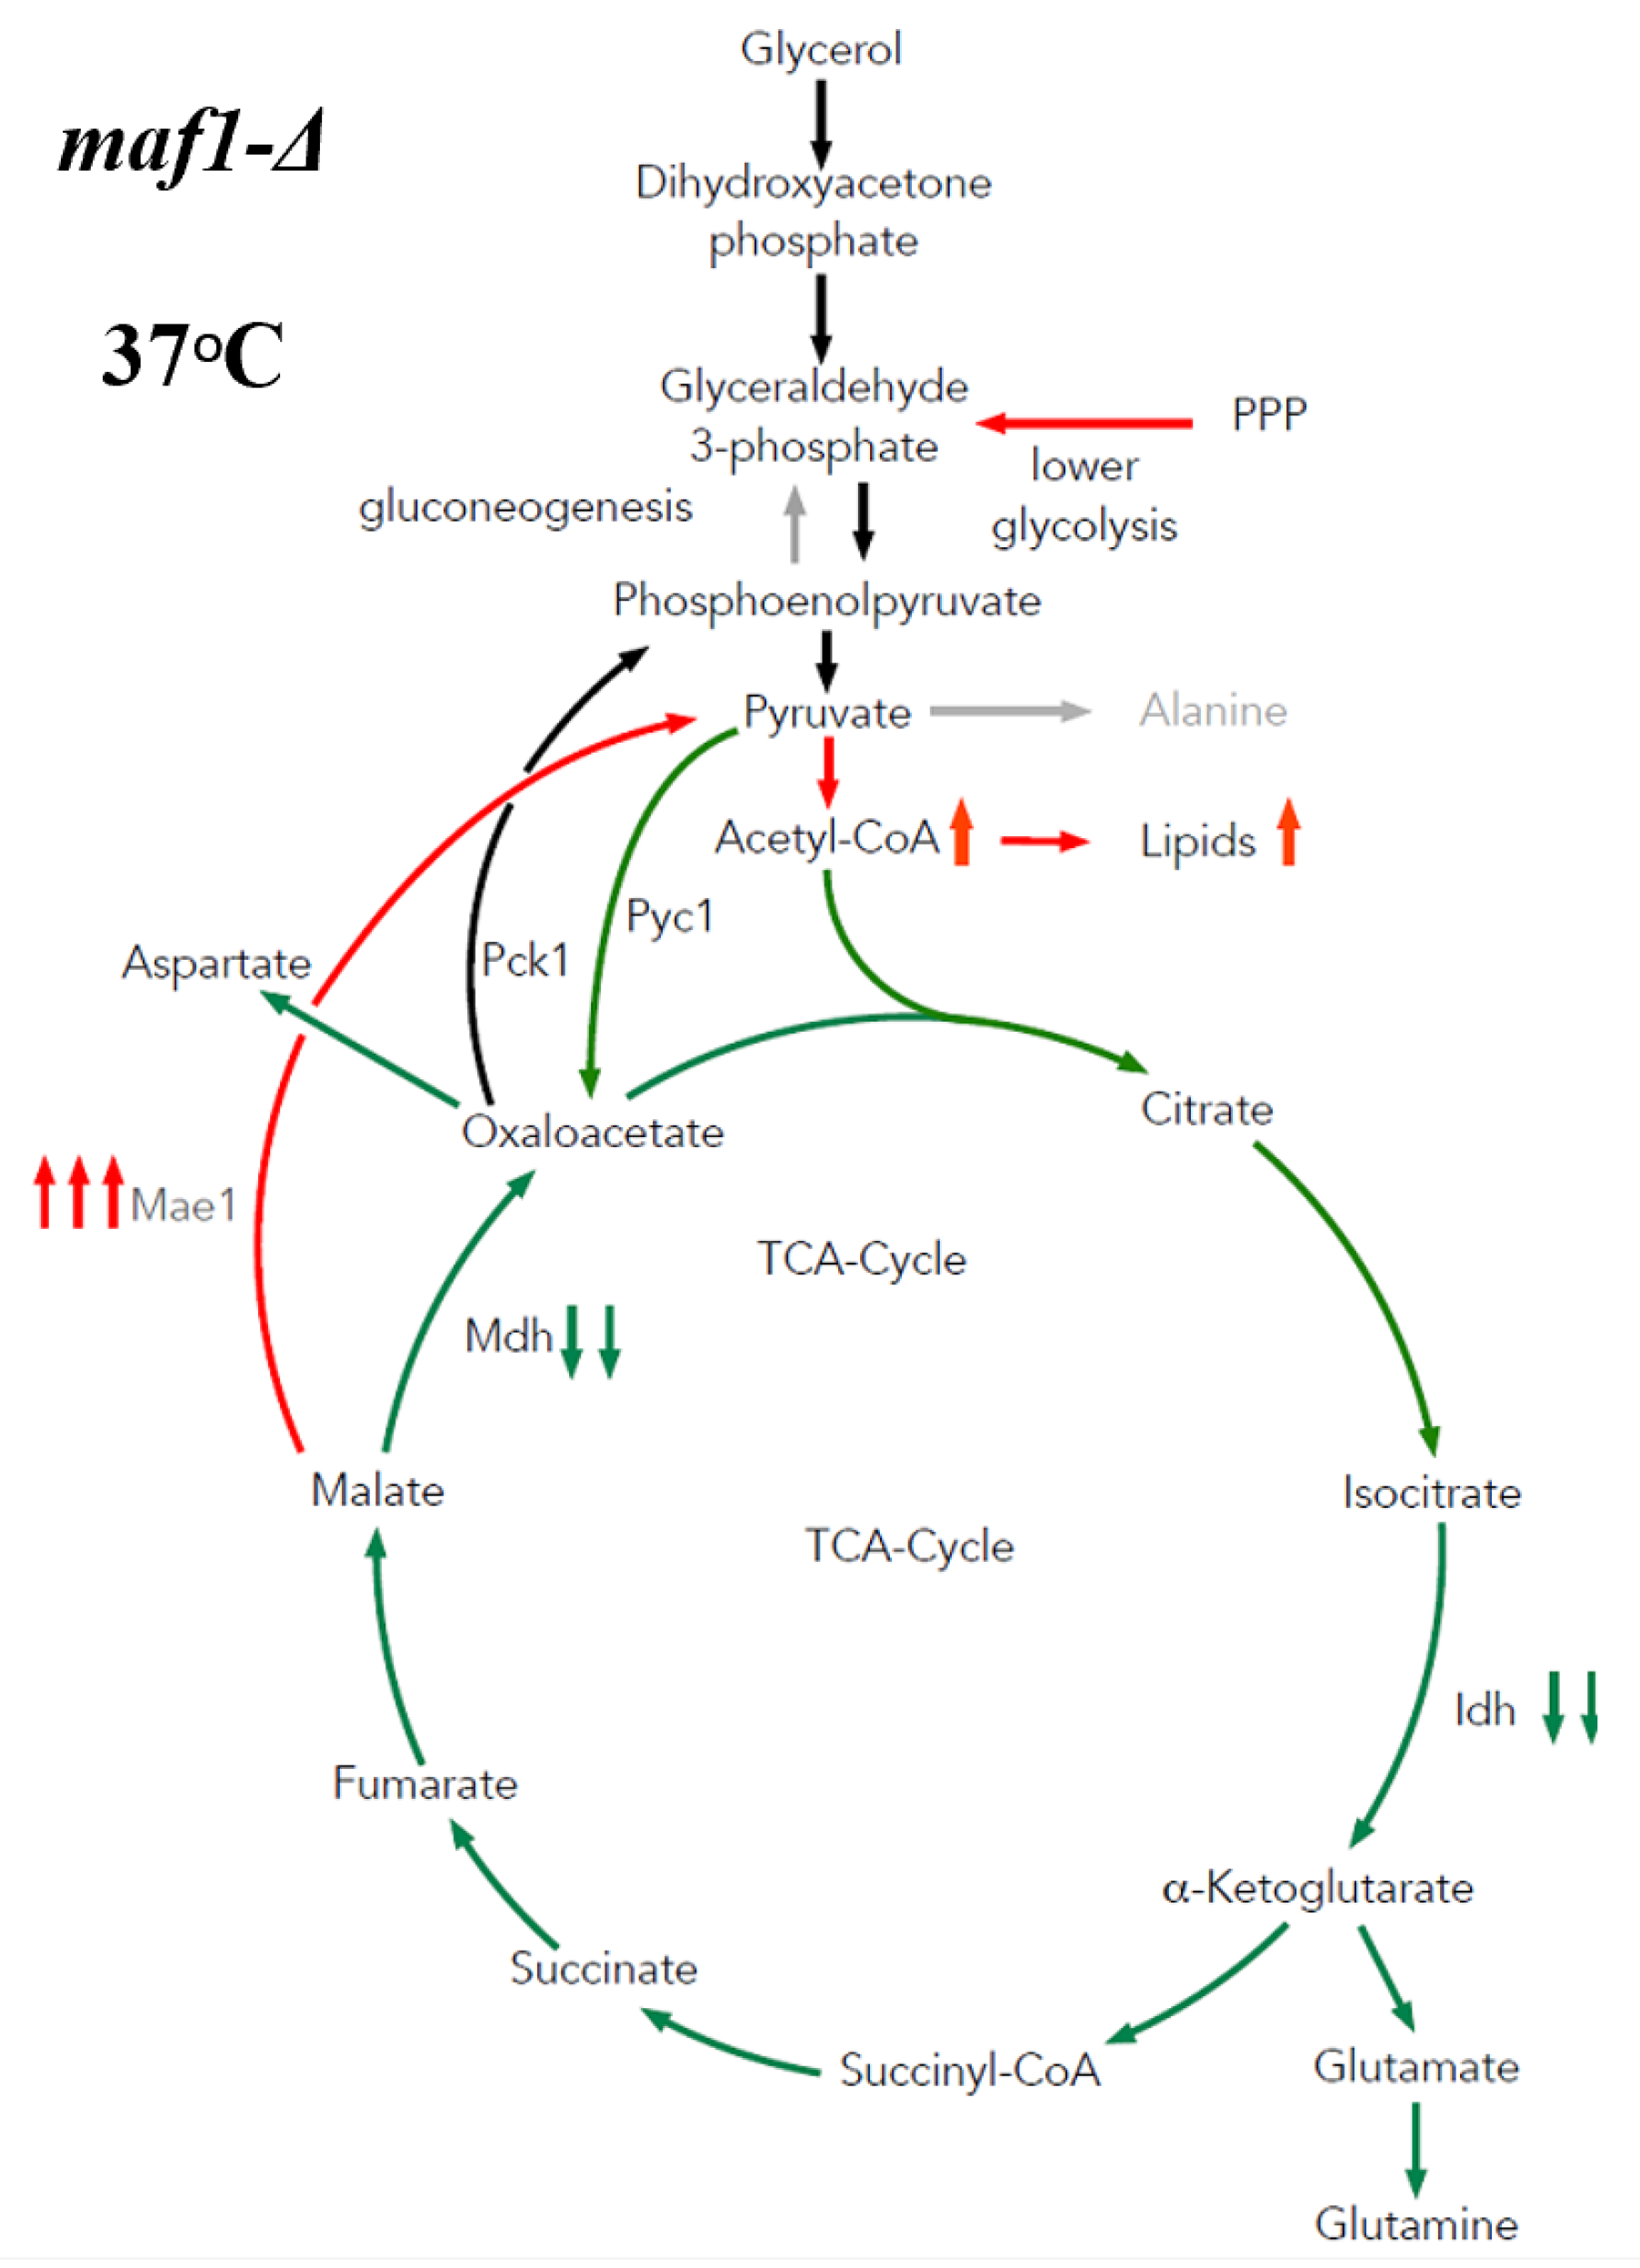
2.3. Elevated Temperature along with Non-Fermentative Glycerol Further Abolishes TCA Cycle Activity in maf1∆
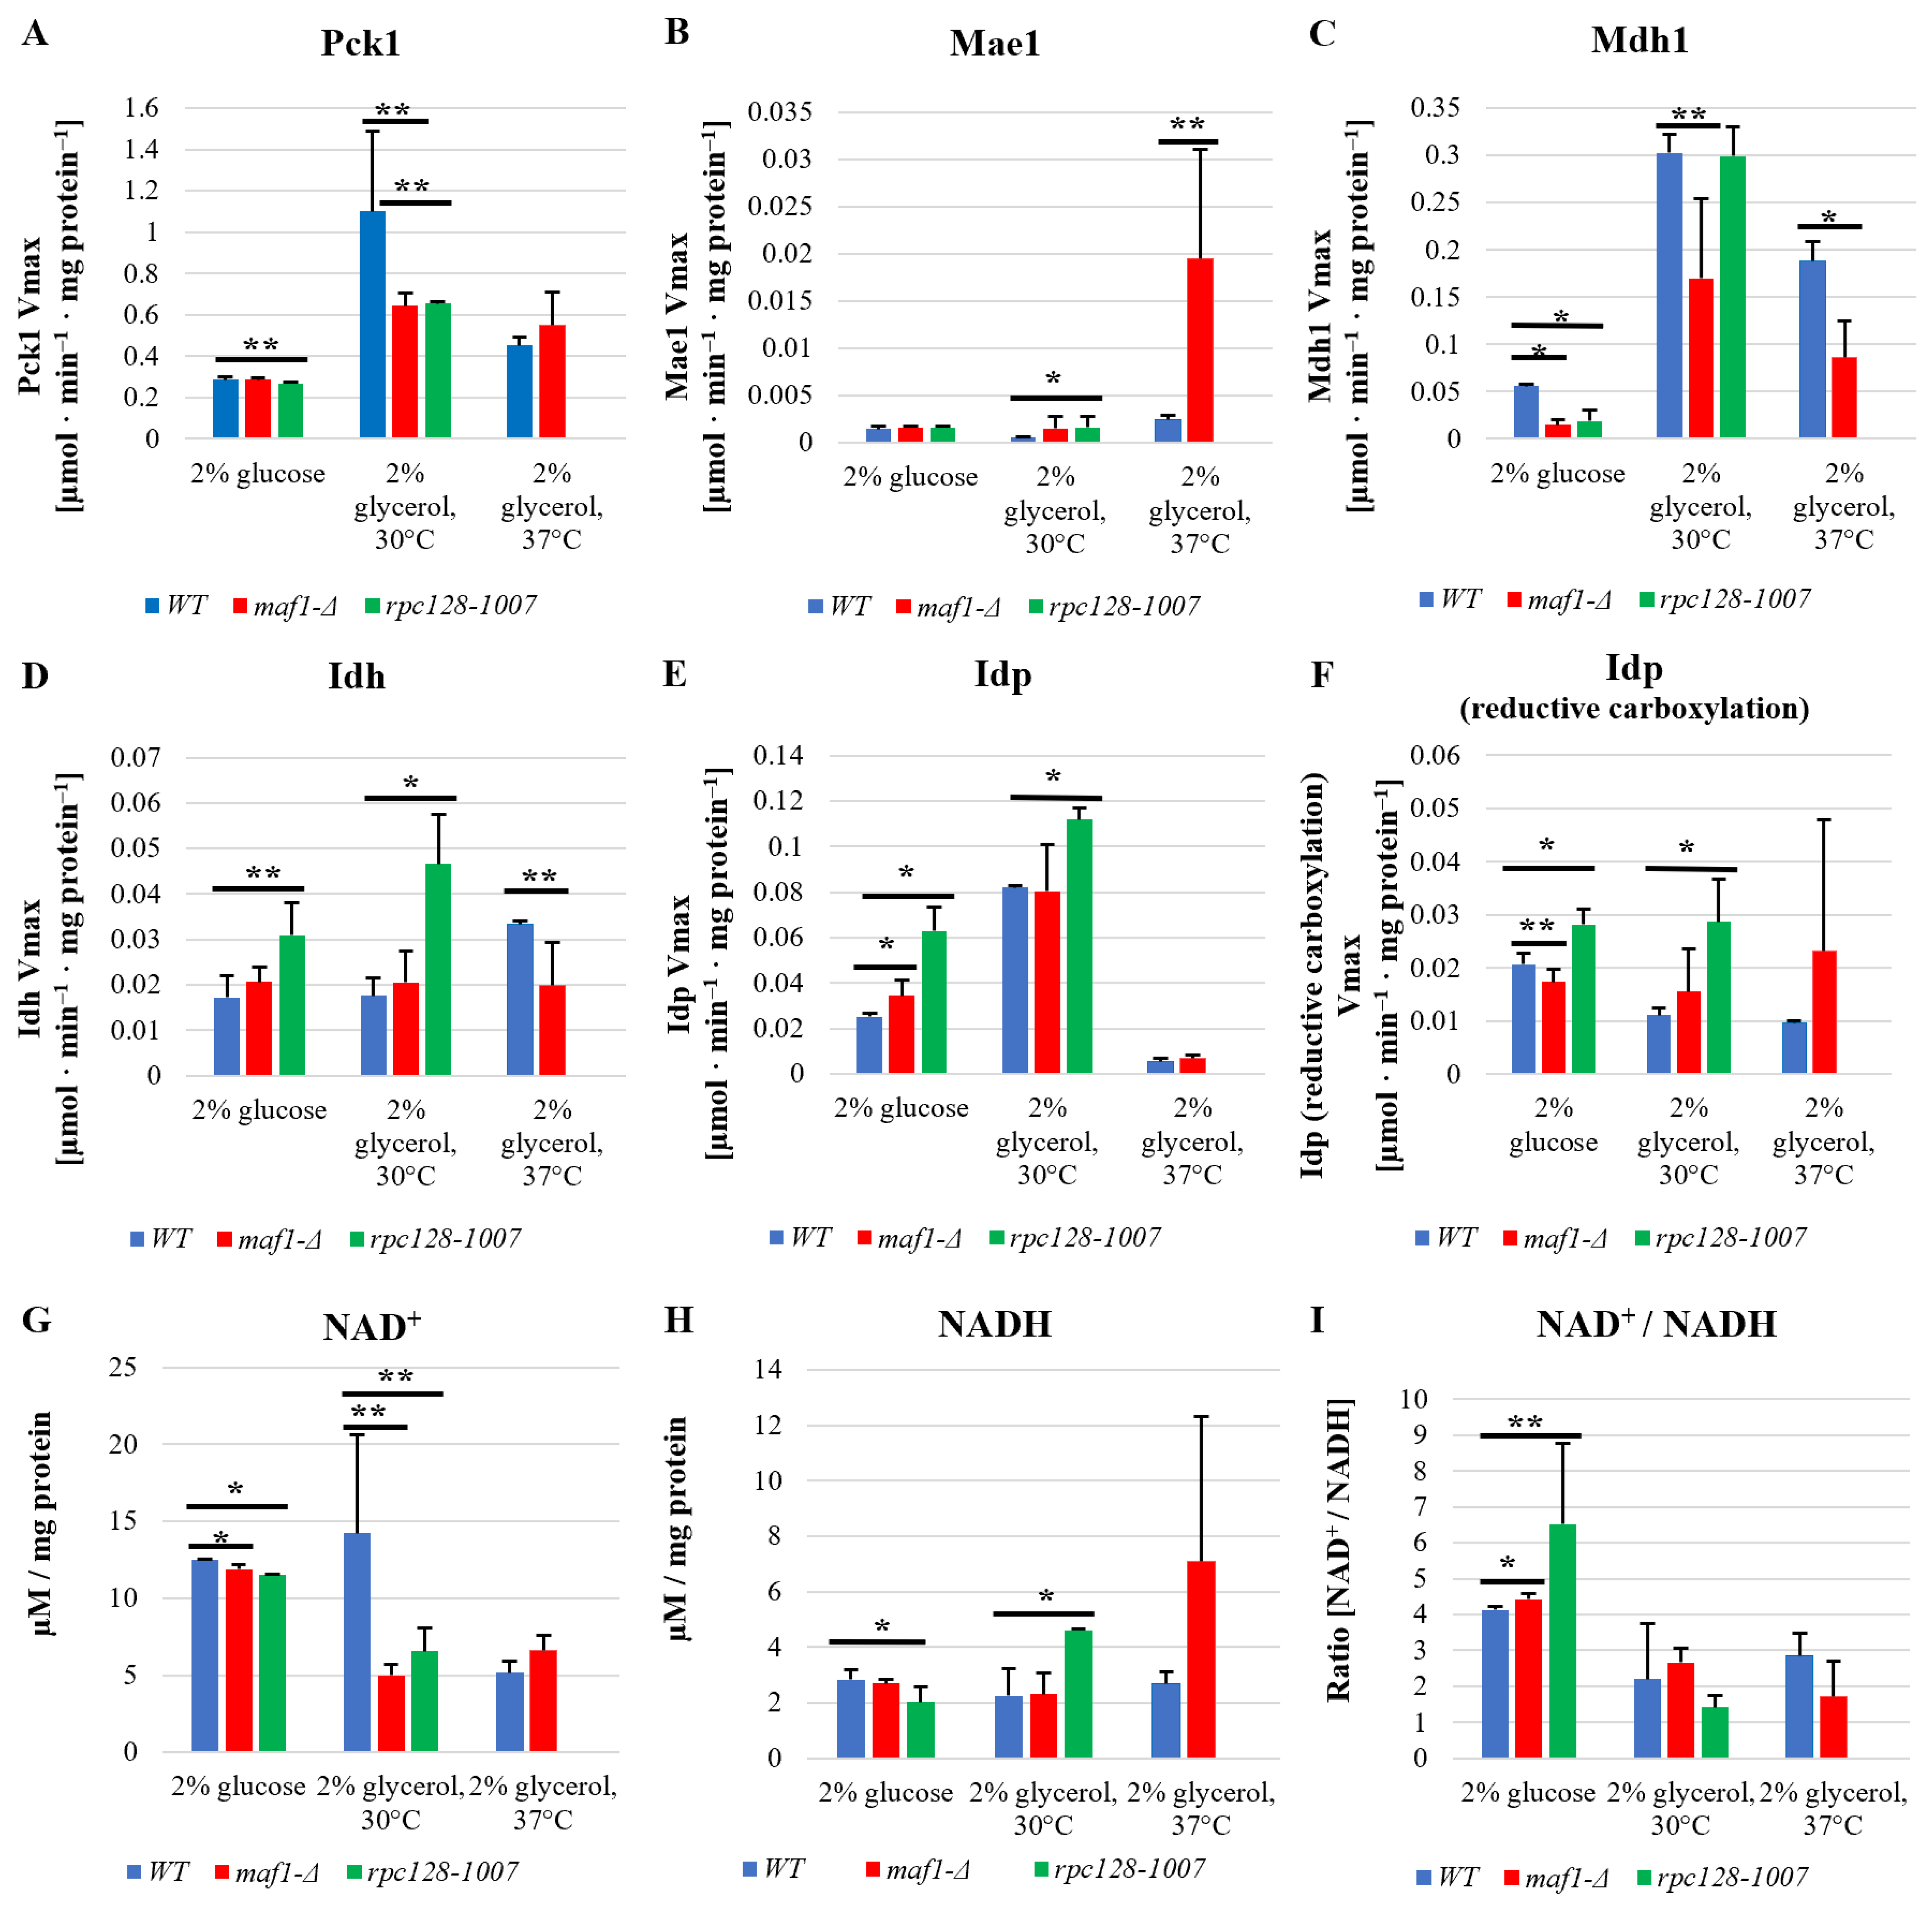
2.4. Malic Enzyme Is the Key Enzyme Responsible for Cataplerosis in maf1∆ Affecting the Mutant Viability
2.5. Reductive Carboxylation of Glutamine Is the Survival Strategy of rpc128-1007 Grown on Glucose
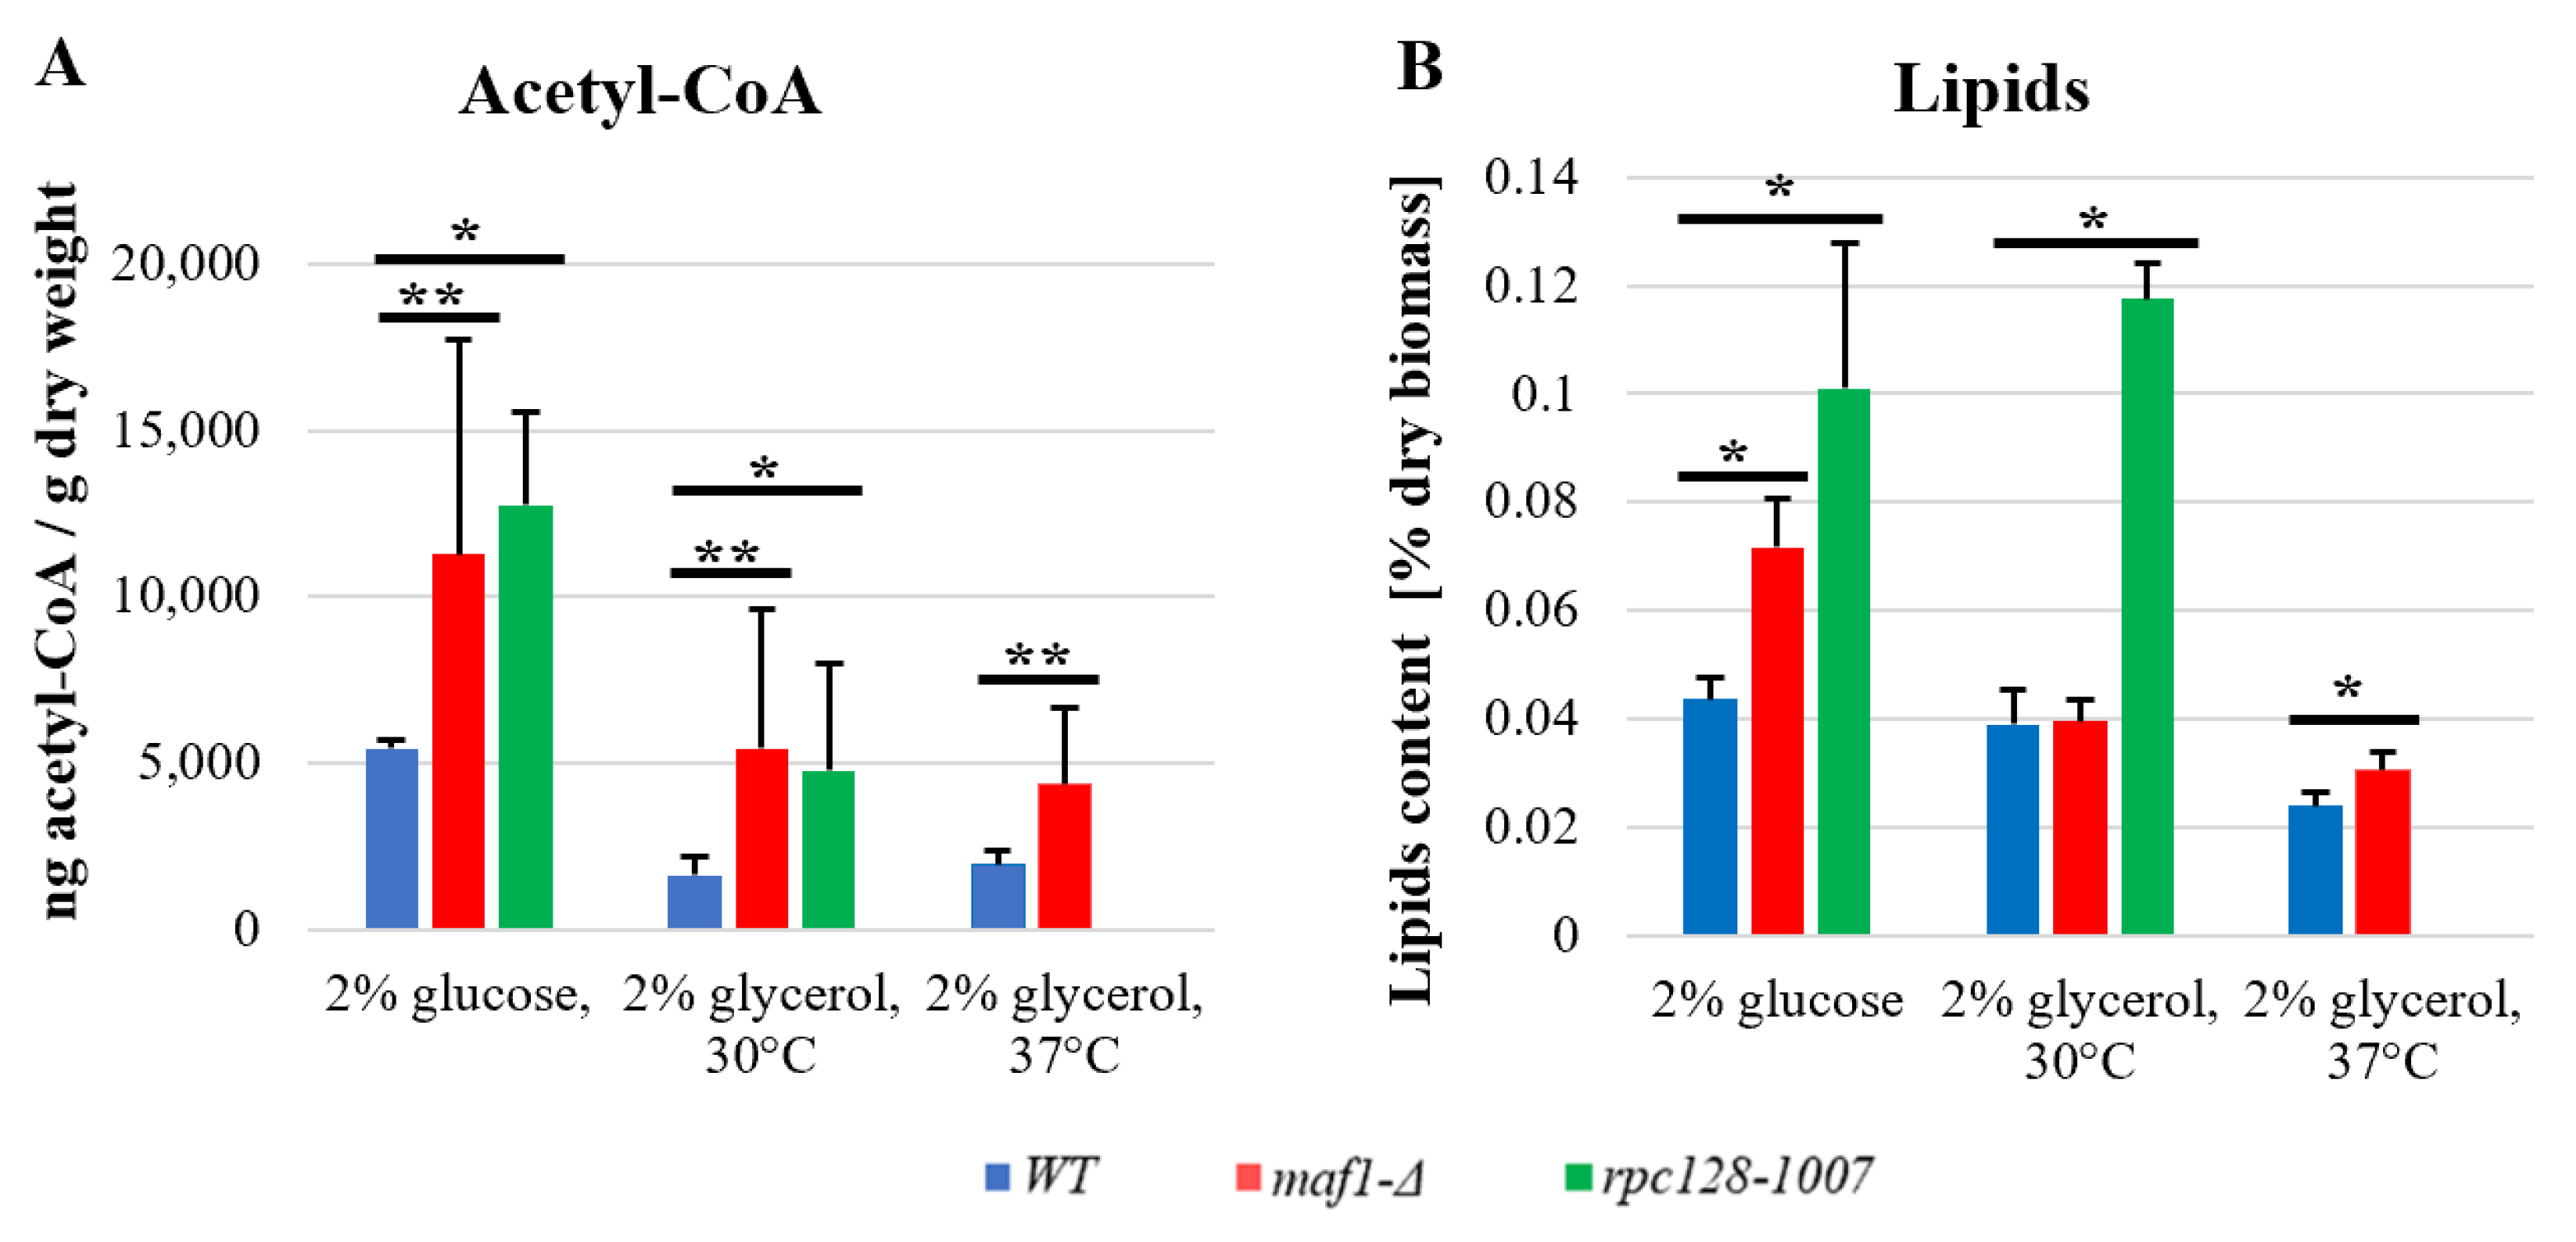
2.6. maf1∆ and rpc128-1007 Show Enhanced acetyl-CoA and Lipids Content
3. Discussion
3.1. RNAP III Non-Optimal Activity Affects the TCA Flux and TCA Enzymes Activities
3.2. The Difference in Growth of the Mutants with Altered RNAP III Activity on a Non-Fermentable Carbon Source Results from Flux Rerouting
4. Materials and Methods
4.1. Yeast Culturing and Metabolites Extraction for 13C Flux Analysis by Nuclear Magnetic Resonance (NMR) Spectroscopy
4.2. NMR Spectroscopy
4.3. Metabolism Modelling
4.4. NADH-Linked Enzymatic Assays
4.5. Acetyl-CoA, NAD+ and NADH Measurement
4.6. Lipid Extraction and Staining
5. Conclusions
Supplementary Materials
Author Contributions
Funding
Institutional Review Board Statement
Informed Consent Statement
Data Availability Statement
Acknowledgments
Conflicts of Interest
References
- Shen, K.; Pender, C.L.; Bar-Ziv, R.; Zhang, H.; Wickham, K.; Willey, E.; Durieux, J.; Ahmad, Q.; Dillin, A. Mitochondria as Cellular and Organismal Signaling Hubs. Annu. Rev. Cell Dev. Biol. 2022, 38, 179–218. [Google Scholar] [CrossRef] [PubMed]
- Willis, I.M.; Moir, R.D.; Hernandez, N. Metabolic programming a lean phenotype by deregulation of RNA polymerase III. Proc. Natl. Acad. Sci. USA 2018, 115, 12182–12187. [Google Scholar] [CrossRef] [PubMed]
- Percudani, R.; Pavesi, A.; Ottonello, S. Transfer RNA gene redundancy and translational selection in Saccharomyces cerevisiae. J. Mol. Biol. 1997, 268, 322–330. [Google Scholar] [CrossRef] [PubMed]
- Dieci, G.; Fiorino, G.; Castelnuovo, M.; Teichmann, M.; Pagano, A. The expanding RNA polymerase III transcriptome. Trends Genet. 2007, 23, 614–622. [Google Scholar] [CrossRef] [PubMed]
- Dieci, G.; Conti, A.; Pagano, A.; Carnevali, D. Identification of RNA polymerase III-transcribed genes in eukaryotic genomes. Biochim. Biophys. Acta 2013, 1829, 296–305. [Google Scholar] [CrossRef]
- Pluta, K.; Lefebvre, O.; Martin, N.C.; Smagowicz, W.J.; Stanford, D.R.; Ellis, S.R.; Hopper, A.K.; Sentenac, A.; Boguta, M. Maf1p, a Negative Effector of RNA Polymerase III in Saccharomyces cerevisiae. Mol. Cell Biol. 2001, 21, 5031–5040. [Google Scholar] [CrossRef]
- Upadhya, R.; Lee, J.; Willis, I.M. Maf1 Is an Essential Mediator of Diverse Signals that Repress RNA Polymerase III Transcription. Mol. Cell 2002, 10, 1489–1494. [Google Scholar] [CrossRef]
- Roberts, D.N.; Wilson, B.; Huff, J.T.; Stewart, A.J.; Cairns, B.R. Dephosphorylation and genome-wide association of Maf1 with Pol III-transcribed genes during repression. Mol. Cell 2006, 22, 633–644. [Google Scholar] [CrossRef]
- Vannini, A.; Ringel, R.; Kusser, A.G.; Berninghausen, O.; Kassavetis, G.A.; Cramer, P. Molecular Basis of RNA Polymerase III Transcription Repression by Maf1. Cell 2010, 143, 59–70. [Google Scholar] [CrossRef]
- Wei, Y.; Tsang, C.K.; Zheng, X.F.S. Mechanisms of regulation of RNA polymerase III-dependent transcription by TORC1. EMBO J. 2009, 28, 2220–2230. [Google Scholar] [CrossRef]
- Graczyk, D.; Debski, J.; Muszyńska, G.; Bretner, M.; Lefebvre, O.; Boguta, M. Casein kinase II-mediated phosphorylation of general repressor Maf1 triggers RNA polymerase III activation. Proc. Natl. Acad. Sci. USA 2011, 108, 4926–4931. [Google Scholar] [CrossRef] [PubMed]
- Cai, Y.; Wei, Y.-H. Distinct regulation of Maf1 for lifespan extension by Protein kinase A and Sch9. Aging 2015, 7, 133–143. [Google Scholar] [CrossRef] [PubMed]
- Cieśla, M.; Towpik, J.; Graczyk, D.; Oficjalska-Pham, D.; Harismendy, O.; Suleau, A.; Balicki, K.; Conesa, C.; Lefebvre, O.; Boguta, M. Maf1 Is Involved in Coupling Carbon Metabolism to RNA Polymerase III Transcription. Mol. Cell Biol. 2007, 27, 7693–7702. [Google Scholar] [CrossRef] [PubMed]
- Turowski, T.W.; Leśniewska, E.; Delan-Forino, C.; Sayou, C.; Boguta, M.; Tollervey, D. Global analysis of transcriptionally engaged yeast RNA polymerase III reveals extended tRNA transcripts. Genome Res. 2016, 26, 933–944. [Google Scholar] [CrossRef]
- Adamczyk, M.; Szatkowska, R. Low RNA Polymerase III activity results in up regulation of HXT2 glucose transporter independently of glucose signaling and despite changing environment. PLoS ONE 2017, 12, e0185516. [Google Scholar] [CrossRef]
- Szatkowska, R.; Garcia-Albornoz, M.; Roszkowska, K.; Holman, S.W.; Furmanek, E.; Hubbard, S.J.; Beynon, R.J.; Adamczyk, M. Glycolytic flux in Saccharomyces cerevisiae is dependent on RNA polymerase III and its negative regulator Maf1. Biochem. J. 2019, 476, 1053–1082. [Google Scholar] [CrossRef]
- Boguta, M.; Czerska, K.; Zoładek, T. Mutation in a new gene MAF1 affects tRNA suppressor efficiency in Saccharomyces cerevisiae. Gene 1997, 185, 291–296. [Google Scholar] [CrossRef]
- Przybyla-Zawislak, B.; Gadde, D.M.; Ducharme, K.; McCammon, M.T. Genetic and biochemical interactions involving tricarboxylic acid cycle (TCA) function using a collection of mutants defective in all TCA cycle genes. Genetics 1999, 152, 153–166. [Google Scholar] [CrossRef]
- Martínez-Reyes, I.; Chandel, N.S. Mitochondrial TCA cycle metabolites control physiology and disease. Nat. Commun. 2020, 11, 102. [Google Scholar] [CrossRef]
- Morawiec, E.; Wichtowska, D.; Graczyk, D.; Conesa, C.; Lefebvre, O.; Boguta, M. Maf1, repressor of tRNA transcription, is involved in the control of gluconeogenetic genes in Saccharomyces cerevisiae. Gene 2013, 526, 16–22. [Google Scholar] [CrossRef]
- Yang, C.; Ko, B.; Hensley, C.T.; Jiang, L.; Wasti, A.T.; Kim, J.; Sudderth, J.; Calvaruso, M.A.; Lumata, L.; Mitsche, M.; et al. Glutamine oxidation maintains the TCA cycle and cell survival during impaired mitochondrial pyruvate transport. Mol. Cell 2014, 56, 414–424. [Google Scholar] [CrossRef] [PubMed]
- Vemuri, G.N.; Eiteman, M.A.; McEwen, J.E.; Olsson, L.; Nielsen, J. Increasing NADH oxidation reduces overflow metabolism in Saccharomyces cerevisiae. Proc. Natl. Acad. Sci. USA 2007, 104, 2402–2407. [Google Scholar] [CrossRef] [PubMed]
- Gaude, E.; Schmidt, C.; Gammage, P.A.; Dugourd, A.; Blacker, T.; Chew, S.P.; Saez-Rodriguez, J.; O’Neill, J.S.; Szabadkai, G.; Minczuk, M.; et al. NADH Shuttling Couples Cytosolic Reductive Carboxylation of Glutamine with Glycolysis in Cells with Mitochondrial Dysfunction. Mol. Cell 2018, 69, 581–593. [Google Scholar] [CrossRef]
- Schwartz, J.P.; Passonneau, J.V.; Johnson, G.S.; Pastan, I. The effect of growth conditions on NAD+ and NADH concentrations and the NAD+:NADH ratio in normal and transformed fibroblasts. J. Biol. Chem. 1974, 249, 4138–4143. [Google Scholar] [CrossRef]
- Galdieri, L.; Zhang, T.; Rogerson, D.; Lleshi, R.; Vancura, A. Protein acetylation and acetyl coenzyme a metabolism in budding yeast. Eukaryot. Cell 2014, 13, 1472–1483. [Google Scholar] [CrossRef] [PubMed]
- Kuang, Z.; Pinglay, S.; Ji, H.; Boeke, J.D. Msn2/4 regulate expression of glycolytic enzymes and control transition from quiescence to growth. Elife 2017, 6, e29938. [Google Scholar] [CrossRef]
- Khanna, A.; Johnson, D.L.; Curran, S.P. Physiological roles for mafr-1 in reproduction and lipid homeostasis. Cell Rep. 2014, 9, 2180–2191. [Google Scholar] [CrossRef]
- Mierzejewska, J.; Chreptowicz, K. Lack of Maf1 enhances pyruvate kinase activity and fermentative metabolism while influencing lipid homeostasis in Saccharomyces cerevisiae. FEBS Lett. 2016, 590, 93–100. [Google Scholar] [CrossRef]
- Hammerquist, A.M.; Escorcia, W.; Curran, S.P. Maf1 regulates intracellular lipid homeostasis in response to DNA damage response activation. Mol. Biol. Cell 2021, 32, 1086–1093. [Google Scholar] [CrossRef]
- Amorim, J.A.; Coppotelli, G.; Rolo, A.P.; Palmeira, C.M.; Ross, J.M.; Sinclair, D.A. Mitochondrial and metabolic dysfunction in ageing and age-related diseases. Nat. Rev. Endocrinol. 2022, 18, 243–258. [Google Scholar] [CrossRef]
- Yeganeh, M.; Praz, V.; Carmeli, C.; Villeneuve, D.; Rib, L.; Guex, N.; Herr, W.; Delorenzi, M.; Hernandez, N. CycliX consortium Differential regulation of RNA polymerase III genes during liver regeneration. Nucleic Acids Res. 2019, 47, 1786–1796. [Google Scholar] [CrossRef] [PubMed]
- Han, L.; Guy, M.P.; Kon, Y.; Phizicky, E.M. Lack of 2′-O-methylation in the tRNA anticodon loop of two phylogenetically distant yeast species activates the general amino acid control pathway. PLoS Genet. 2018, 14, e1007288. [Google Scholar] [CrossRef]
- Lyons, S.M.; Fay, M.M.; Ivanov, P. The role of RNA modifications in the regulation of tRNA cleavage. FEBS Lett. 2018, 592, 2828–2844. [Google Scholar] [CrossRef] [PubMed]
- Bąkowska-Żywicka, K.; Mleczko, A.M.; Kasprzyk, M.; Machtel, P.; Żywicki, M.; Twardowski, T. The widespread occurrence of tRNA-derived fragments in Saccharomyces cerevisiae. FEBS Open Bio 2016, 6, 1186–1200. [Google Scholar] [CrossRef] [PubMed]
- Gebetsberger, J.; Polacek, N. Slicing tRNAs to boost functional ncRNA diversity. RNA Biol. 2013, 10, 1798–1806. [Google Scholar] [CrossRef]
- Mleczko, A.M.; Celichowski, P.; Bąkowska-Żywicka, K. Transfer RNA-derived fragments target and regulate ribosome-associated aminoacyl-transfer RNA synthetases. Biochim. Biophys. Acta Gene Regul. Mech. 2018, 1861, 647–656. [Google Scholar] [CrossRef] [PubMed]
- Asencio, C.; Schwarzl, T.; Sahadevan, S.; Hentze, M.W. Small noncoding RNA interactome capture reveals pervasive, carbon source-dependent tRNA engagement of yeast glycolytic enzymes. RNA 2023, 29, 330–345. [Google Scholar] [CrossRef]
- Ryazanov, A.G. Glyceraldehyde-3-phosphate dehydrogenase is one of the three major RNA-binding proteins of rabbit reticulocytes. FEBS Lett. 1985, 192, 131–134. [Google Scholar] [CrossRef]
- Entelis, N.; Brandina, I.; Kamenski, P.; Krasheninnikov, I.A.; Martin, R.P.; Tarassov, I. A glycolytic enzyme, enolase, is recruited as a cofactor of tRNA targeting toward mitochondria in Saccharomyces cerevisiae. Genes. Dev. 2006, 20, 1609–1620. [Google Scholar] [CrossRef]
- Camarasa, C.; Grivet, J.-P.; Dequin, S. Investigation by 13C-NMR and tricarboxylic acid (TCA) deletion mutant analysis of pathways for succinate formation in Saccharomyces cerevisiae during anaerobic fermentation. Microbiology 2003, 149, 2669–2678. [Google Scholar] [CrossRef]
- Piskur, J.; Compagno, C. (Eds.) Molecular Mechanisms in Yeast Carbon Metabolism; Springer: Berlin/Heidelberg, Germany, 2014; ISBN 978-3-642-55012-6. [Google Scholar]
- DeRisi, J.L.; Iyer, V.R.; Brown, P.O. Exploring the metabolic and genetic control of gene expression on a genomic scale. Science 1997, 278, 680–686. [Google Scholar] [CrossRef]
- Blank, L.M.; Sauer, U. TCA cycle activity in Saccharomyces cerevisiae is a function of the environmentally determined specific growth and glucose uptake rates. Microbiology 2004, 150, 1085–1093. [Google Scholar] [CrossRef]
- Lateef, O.M.; Akintubosun, M.O.; Olaoba, O.T.; Samson, S.O.; Adamczyk, M. Making Sense of “Nonsense” and More: Challenges and Opportunities in the Genetic Code Expansion, in the World of tRNA Modifications. Int. J. Mol. Sci. 2022, 23, 938. [Google Scholar] [CrossRef] [PubMed]
- Pietrocola, F.; Galluzzi, L.; Bravo-San Pedro, J.M.; Madeo, F.; Kroemer, G. Acetyl coenzyme A: A central metabolite and second messenger. Cell Metab. 2015, 21, 805–821. [Google Scholar] [CrossRef] [PubMed]
- Palian, B.M.; Rohira, A.D.; Johnson, S.A.S.; He, L.; Zheng, N.; Dubeau, L.; Stiles, B.L.; Johnson, D.L. Maf1 Is a Novel Target of PTEN and PI3K Signaling That Negatively Regulates Oncogenesis and Lipid Metabolism. PLOS Genet. 2014, 10, e1004789. [Google Scholar] [CrossRef]
- Wise, D.R.; Thompson, C.B. Glutamine addiction: A new therapeutic target in cancer. Trends Biochem. Sci. 2010, 35, 427–433. [Google Scholar] [CrossRef] [PubMed]
- DeBerardinis, R.J.; Lum, J.J.; Hatzivassiliou, G.; Thompson, C.B. The biology of cancer: Metabolic reprogramming fuels cell growth and proliferation. Cell Metab. 2008, 7, 11–20. [Google Scholar] [CrossRef]
- Metallo, C.M.; Gameiro, P.A.; Bell, E.L.; Mattaini, K.R.; Yang, J.; Hiller, K.; Jewell, C.M.; Johnson, Z.R.; Irvine, D.J.; Guarente, L.; et al. Reductive glutamine metabolism by IDH1 mediates lipogenesis under hypoxia. Nature 2011, 481, 380–384. [Google Scholar] [CrossRef]
- Yoo, H.; Antoniewicz, M.R.; Stephanopoulos, G.; Kelleher, J.K. Quantifying reductive carboxylation flux of glutamine to lipid in a brown adipocyte cell line. J. Biol. Chem. 2008, 283, 20621–20627. [Google Scholar] [CrossRef]
- Katz, A.; Elgamal, S.; Rajkovic, A.; Ibba, M. Non-canonical roles of tRNAs and tRNA mimics in bacterial cell biology. Mol. Microbiol. 2016, 101, 545–558. [Google Scholar] [CrossRef]
- Michanek, A.; Kristen, N.; Höök, F.; Nylander, T.; Sparr, E. RNA and DNA interactions with zwitterionic and charged lipid membranes—A DSC and QCM-D study. Biochim. Biophys. Acta 2010, 1798, 829–838. [Google Scholar] [CrossRef] [PubMed]
- Czerniak, T.; Saenz, J.P. Lipid membranes modulate the activity of RNA through sequence-dependent interactions. Proc. Natl. Acad. Sci. USA 2022, 119, e2119235119. [Google Scholar] [CrossRef] [PubMed]
- Gombert, A.K.; Moreira dos Santos, M.; Christensen, B.; Nielsen, J. Network Identification and Flux Quantification in the Central Metabolism of Saccharomyces cerevisiae under Different Conditions of Glucose Repression. J. Bacteriol. 2001, 183, 1441–1451. [Google Scholar] [CrossRef] [PubMed]
- Fernandez-de-Cossio-Diaz, J.; Vazquez, A. Limits of aerobic metabolism in cancer cells. Sci. Rep. 2017, 7, 13488. [Google Scholar] [CrossRef]
- Al-Dwairi, A.; Pabona, J.M.P.; Simmen, R.C.M.; Simmen, F.A. Cytosolic malic enzyme 1 (ME1) mediates high fat diet-induced adiposity, endocrine profile, and gastrointestinal tract proliferation-associated biomarkers in male mice. PLoS ONE 2012, 7, e46716. [Google Scholar] [CrossRef]
- Simmen, F.A.; Alhallak, I.; Simmen, R.C.M. Malic enzyme 1 (ME1) in the biology of cancer: It is not just intermediary metabolism. J. Mol. Endocrinol. 2020, 65, R77–R90. [Google Scholar] [CrossRef]
- Fan, J.; Ye, J.; Kamphorst, J.J.; Shlomi, T.; Thompson, C.B.; Rabinowitz, J.D. Quantitative flux analysis reveals folate-dependent NADPH production. Nature 2014, 510, 298–302. [Google Scholar] [CrossRef]
- Nakashima, C.; Kirita, T.; Yamamoto, K.; Mori, S.; Luo, Y.; Sasaki, T.; Fujii, K.; Ohmori, H.; Kawahara, I.; Mori, T.; et al. Malic Enzyme 1 Is Associated with Tumor Budding in Oral Squamous Cell Carcinomas. Int. J. Mol. Sci. 2020, 21, 7149. [Google Scholar] [CrossRef]
- Heyland, J.; Fu, J.; Blank, L.M. Correlation between TCA cycle flux and glucose uptake rate during respiro-fermentative growth of Saccharomyces cerevisiae. Microbiology 2009, 155, 3827–3837. [Google Scholar] [CrossRef]
- Blank, L.M.; Kuepfer, L.; Sauer, U. Large-scale 13C-flux analysis reveals mechanistic principles of metabolic network robustness to null mutations in yeast. Genome Biol. 2005, 6, R49. [Google Scholar] [CrossRef]
- Orekhov, V.Y.; Jaravine, V.A. Analysis of non-uniformly sampled spectra with multi-dimensional decomposition. Prog. Nucl. Magn. Reson. Spectrosc. 2011, 59, 271–292. [Google Scholar] [CrossRef] [PubMed]
- Kazimierczuk, K.; Orekhov, V.Y. Accelerated NMR spectroscopy by using compressed sensing. Angew. Chem. Int. Ed. Engl. 2011, 50, 5556–5559. [Google Scholar] [CrossRef] [PubMed]
- Delaglio, F.; Grzesiek, S.; Vuister, G.W.; Zhu, G.; Pfeifer, J.; Bax, A. NMRPipe: A multidimensional spectral processing system based on UNIX pipes. J. Biomol. NMR 1995, 6, 277–293. [Google Scholar] [CrossRef] [PubMed]
- Ludwig, C.; Günther, U.L. MetaboLab--advanced NMR data processing and analysis for metabolomics. BMC Bioinform. 2011, 12, 366. [Google Scholar] [CrossRef] [PubMed]
- Chong, M.; Jayaraman, A.; Marin, S.; Selivanov, V.; de Atauri Carulla, P.R.; Tennant, D.A.; Cascante, M.; Günther, U.L.; Ludwig, C. Combined Analysis of NMR and MS Spectra (CANMS). Angew. Chem. Int. Ed. 2017, 56, 4140–4144. [Google Scholar] [CrossRef] [PubMed]
- Heavner, B.D.; Price, N.D. Comparative Analysis of Yeast Metabolic Network Models Highlights Progress, Opportunities for Metabolic Reconstruction. PLoS Comput. Biol. 2015, 11, e1004530. [Google Scholar] [CrossRef]
- Gevorgyan, A.; Bushell, M.E.; Avignone-Rossa, C.; Kierzek, A.M. SurreyFBA: A command line tool and graphics user interface for constraint-based modeling of genome-scale metabolic reaction networks. Bioinformatics 2011, 27, 433–434. [Google Scholar] [CrossRef]
- Adamczyk, M.; van Eunen, K.; Bakker, B.M.; Westerhoff, H.V. Enzyme Kinetics for Systems Biology. Methods Enzymol. 2011, 500, 233–257. [Google Scholar] [CrossRef]
- Lin, A.-P.; Demeler, B.; Minard, K.I.; Anderson, S.L.; Schirf, V.; Galaleldeen, A.; McAlister-Henn, L. Construction and analyses of tetrameric forms of yeast NAD+-specific isocitrate dehydrogenase. Biochemistry 2011, 50, 230–239. [Google Scholar] [CrossRef]
- Contreras-Shannon, V.; Lin, A.-P.; McCammon, M.T.; McAlister-Henn, L. Kinetic properties and metabolic contributions of yeast mitochondrial and cytosolic NADP+-specific isocitrate dehydrogenases. J. Biol. Chem. 2005, 280, 4469–4475. [Google Scholar] [CrossRef]
- Rojas, B.E.; Hartman, M.D.; Figueroa, C.M.; Leaden, L.; Podestá, F.E.; Iglesias, A.A. Biochemical characterization of phosphoenolpyruvate carboxykinases from Arabidopsis thaliana. Biochem. J. 2019, 476, 2939–2952. [Google Scholar] [CrossRef] [PubMed]
- Lee, S.M.; Kim, J.H.; Cho, E.J.; Youn, H.D. A nucleocytoplasmic malate dehydrogenase regulates p53 transcriptional activity in response to metabolic stress. Cell Death Differ. 2009, 16, 738–748. [Google Scholar] [CrossRef]
- Boles, E.; de Jong-Gubbels, P.; Pronk, J.T. Identification and characterization of MAE1, the Saccharomyces cerevisiae structural gene encoding mitochondrial malic enzyme. J. Bacteriol. 1998, 180, 2875–2882. [Google Scholar] [CrossRef]
- Liu, W.; Zhang, B.; Jiang, R. Improving acetyl-CoA biosynthesis in Saccharomyces cerevisiae via the overexpression of pantothenate kinase and PDH bypass. Biotechnol. Biofuels 2017, 10, 41. [Google Scholar] [CrossRef] [PubMed]
- Wolinski, H.; Kohlwein, S.D. Microscopic analysis of lipid droplet metabolism and dynamics in yeast. Methods Mol. Biol. 2008, 457, 151–163. [Google Scholar] [CrossRef] [PubMed]
- Bligh, E.G.; Dyer, W.J. A rapid method of total lipid extraction and purification. Can. J. Biochem. Physiol. 1959, 37, 911–917. [Google Scholar] [CrossRef]
- Easlon, E.; Tsang, F.; Skinner, C.; Wang, C.; Lin, S.-J. The malate-aspartate NADH shuttle components are novel metabolic longevity regulators required for calorie restriction-mediated life span extension in yeast. Genes. Dev. 2008, 22, 931–944. [Google Scholar] [CrossRef]


Disclaimer/Publisher’s Note: The statements, opinions and data contained in all publications are solely those of the individual author(s) and contributor(s) and not of MDPI and/or the editor(s). MDPI and/or the editor(s) disclaim responsibility for any injury to people or property resulting from any ideas, methods, instructions or products referred to in the content. |
© 2023 by the authors. Licensee MDPI, Basel, Switzerland. This article is an open access article distributed under the terms and conditions of the Creative Commons Attribution (CC BY) license (https://creativecommons.org/licenses/by/4.0/).
Share and Cite
Szatkowska, R.; Furmanek, E.; Kierzek, A.M.; Ludwig, C.; Adamczyk, M. Mitochondrial Metabolism in the Spotlight: Maintaining Balanced RNAP III Activity Ensures Cellular Homeostasis. Int. J. Mol. Sci. 2023, 24, 14763. https://doi.org/10.3390/ijms241914763
Szatkowska R, Furmanek E, Kierzek AM, Ludwig C, Adamczyk M. Mitochondrial Metabolism in the Spotlight: Maintaining Balanced RNAP III Activity Ensures Cellular Homeostasis. International Journal of Molecular Sciences. 2023; 24(19):14763. https://doi.org/10.3390/ijms241914763
Chicago/Turabian StyleSzatkowska, Roza, Emil Furmanek, Andrzej M. Kierzek, Christian Ludwig, and Malgorzata Adamczyk. 2023. "Mitochondrial Metabolism in the Spotlight: Maintaining Balanced RNAP III Activity Ensures Cellular Homeostasis" International Journal of Molecular Sciences 24, no. 19: 14763. https://doi.org/10.3390/ijms241914763