
The Influence of Race/Ethnicity on the Transcriptomic Landscape of Uterine Fibroids
 ,
,
Abstract
:1. Introduction
2. Results
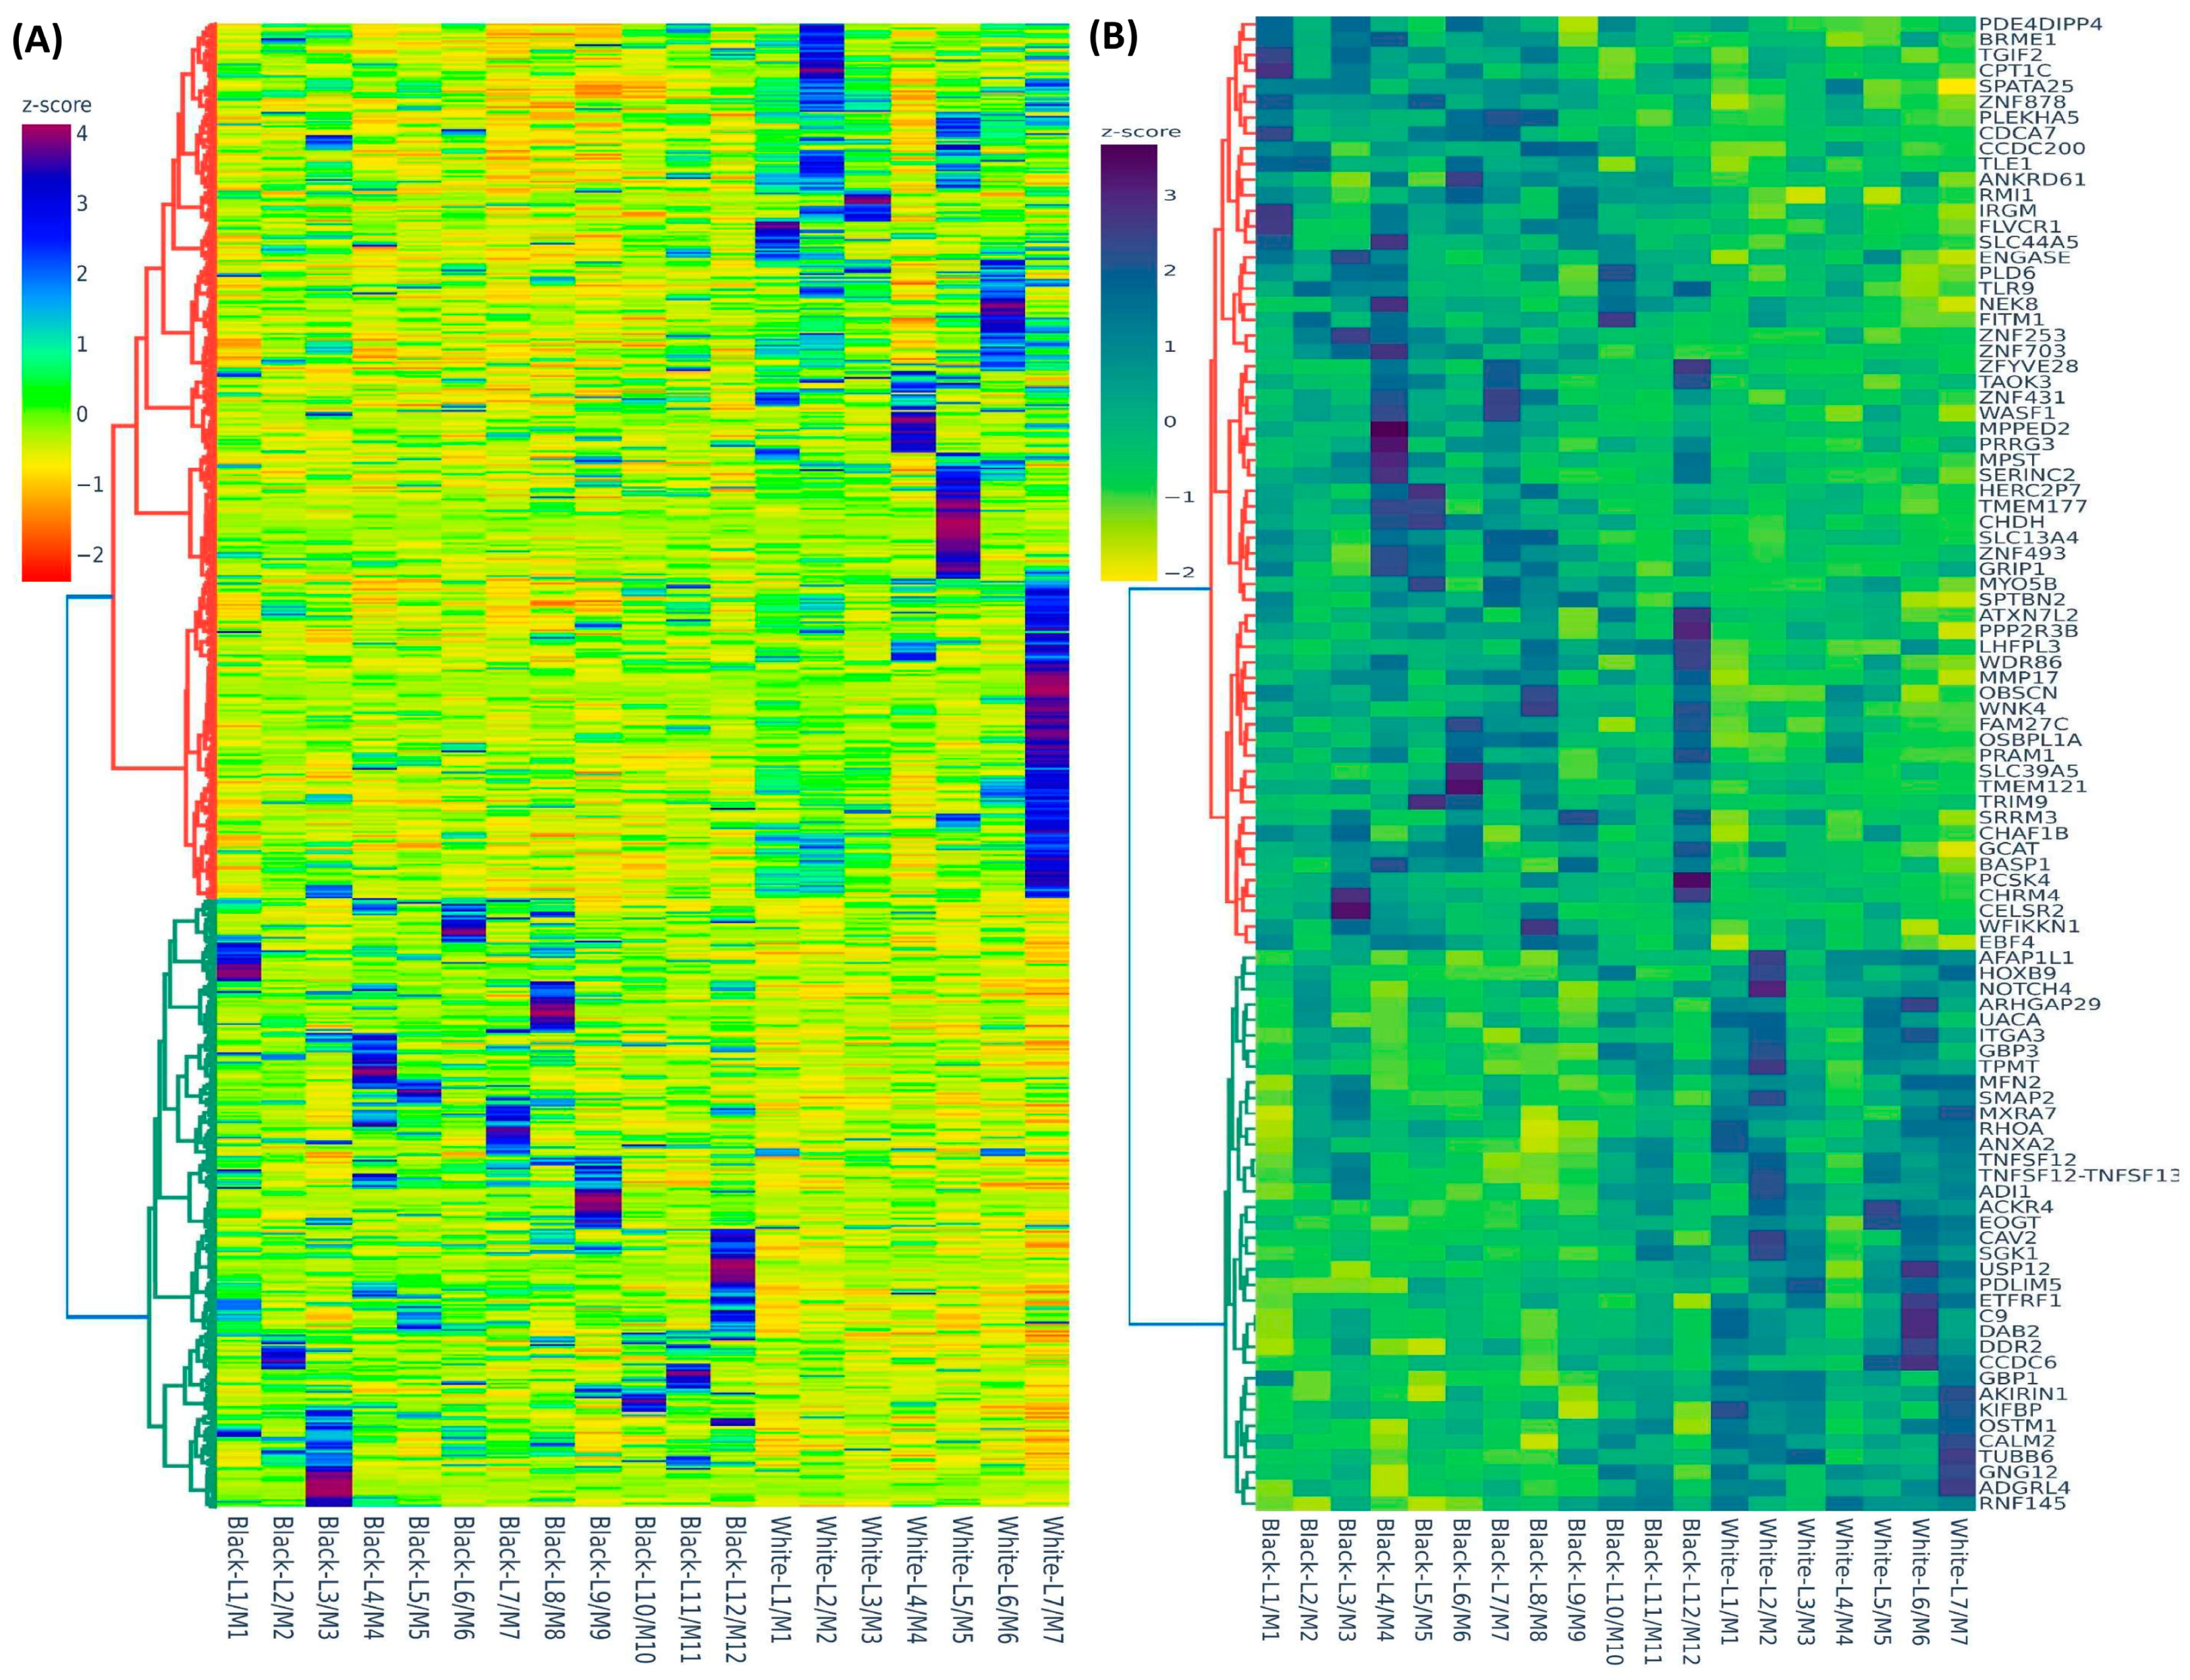
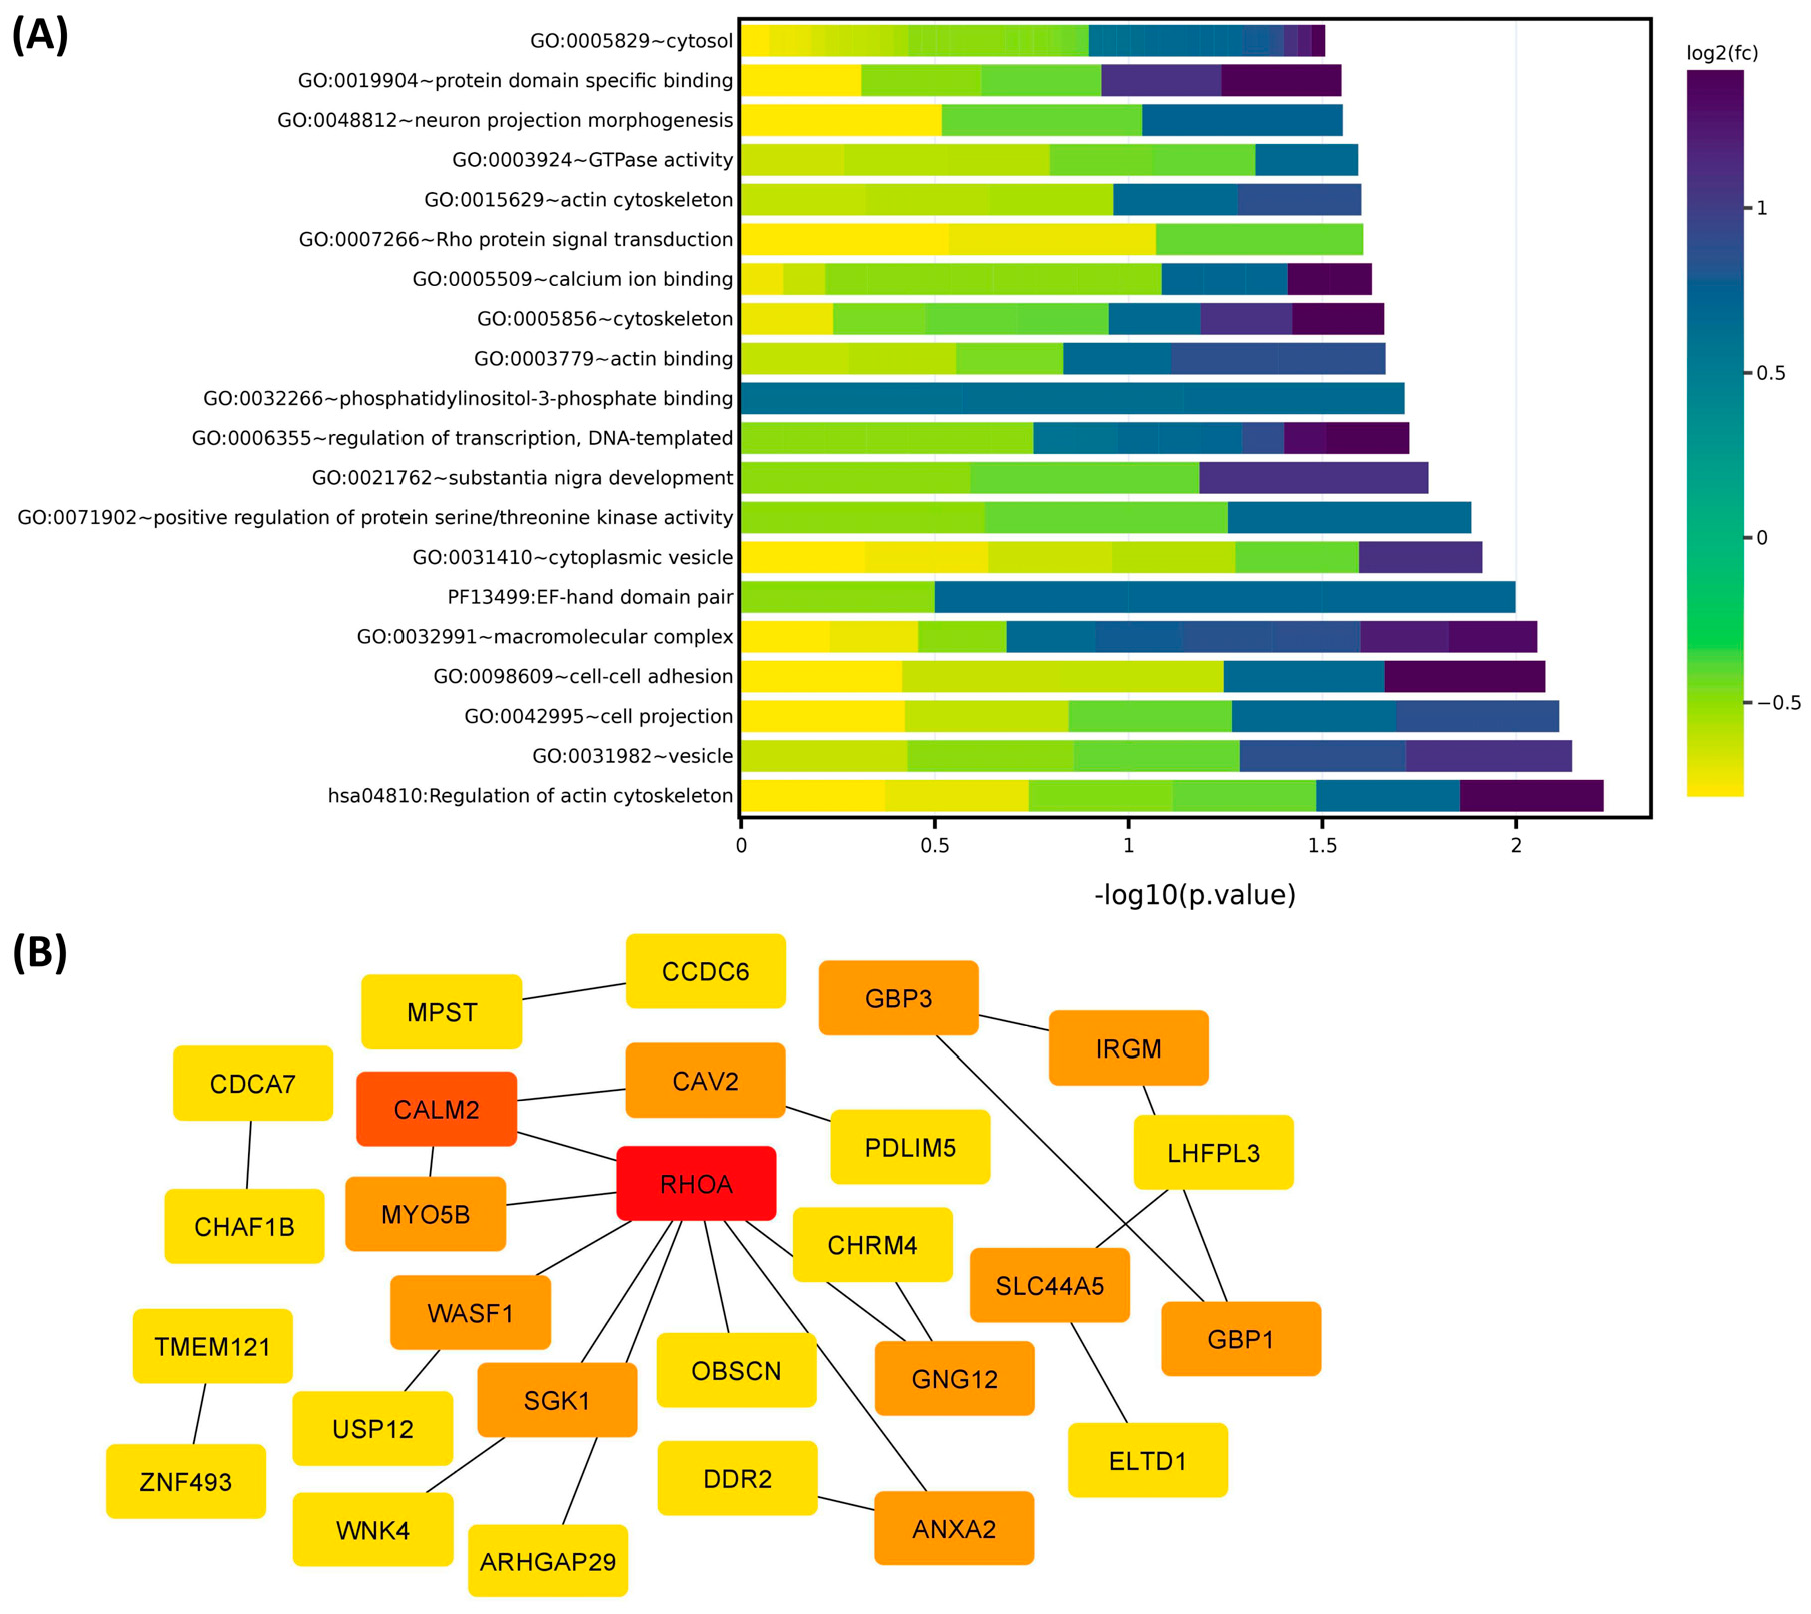
2.1. Differential Expression of Race/Ethnicity-Associated Coding RNA Transcripts in Leiomyoma and Matched Myometrium
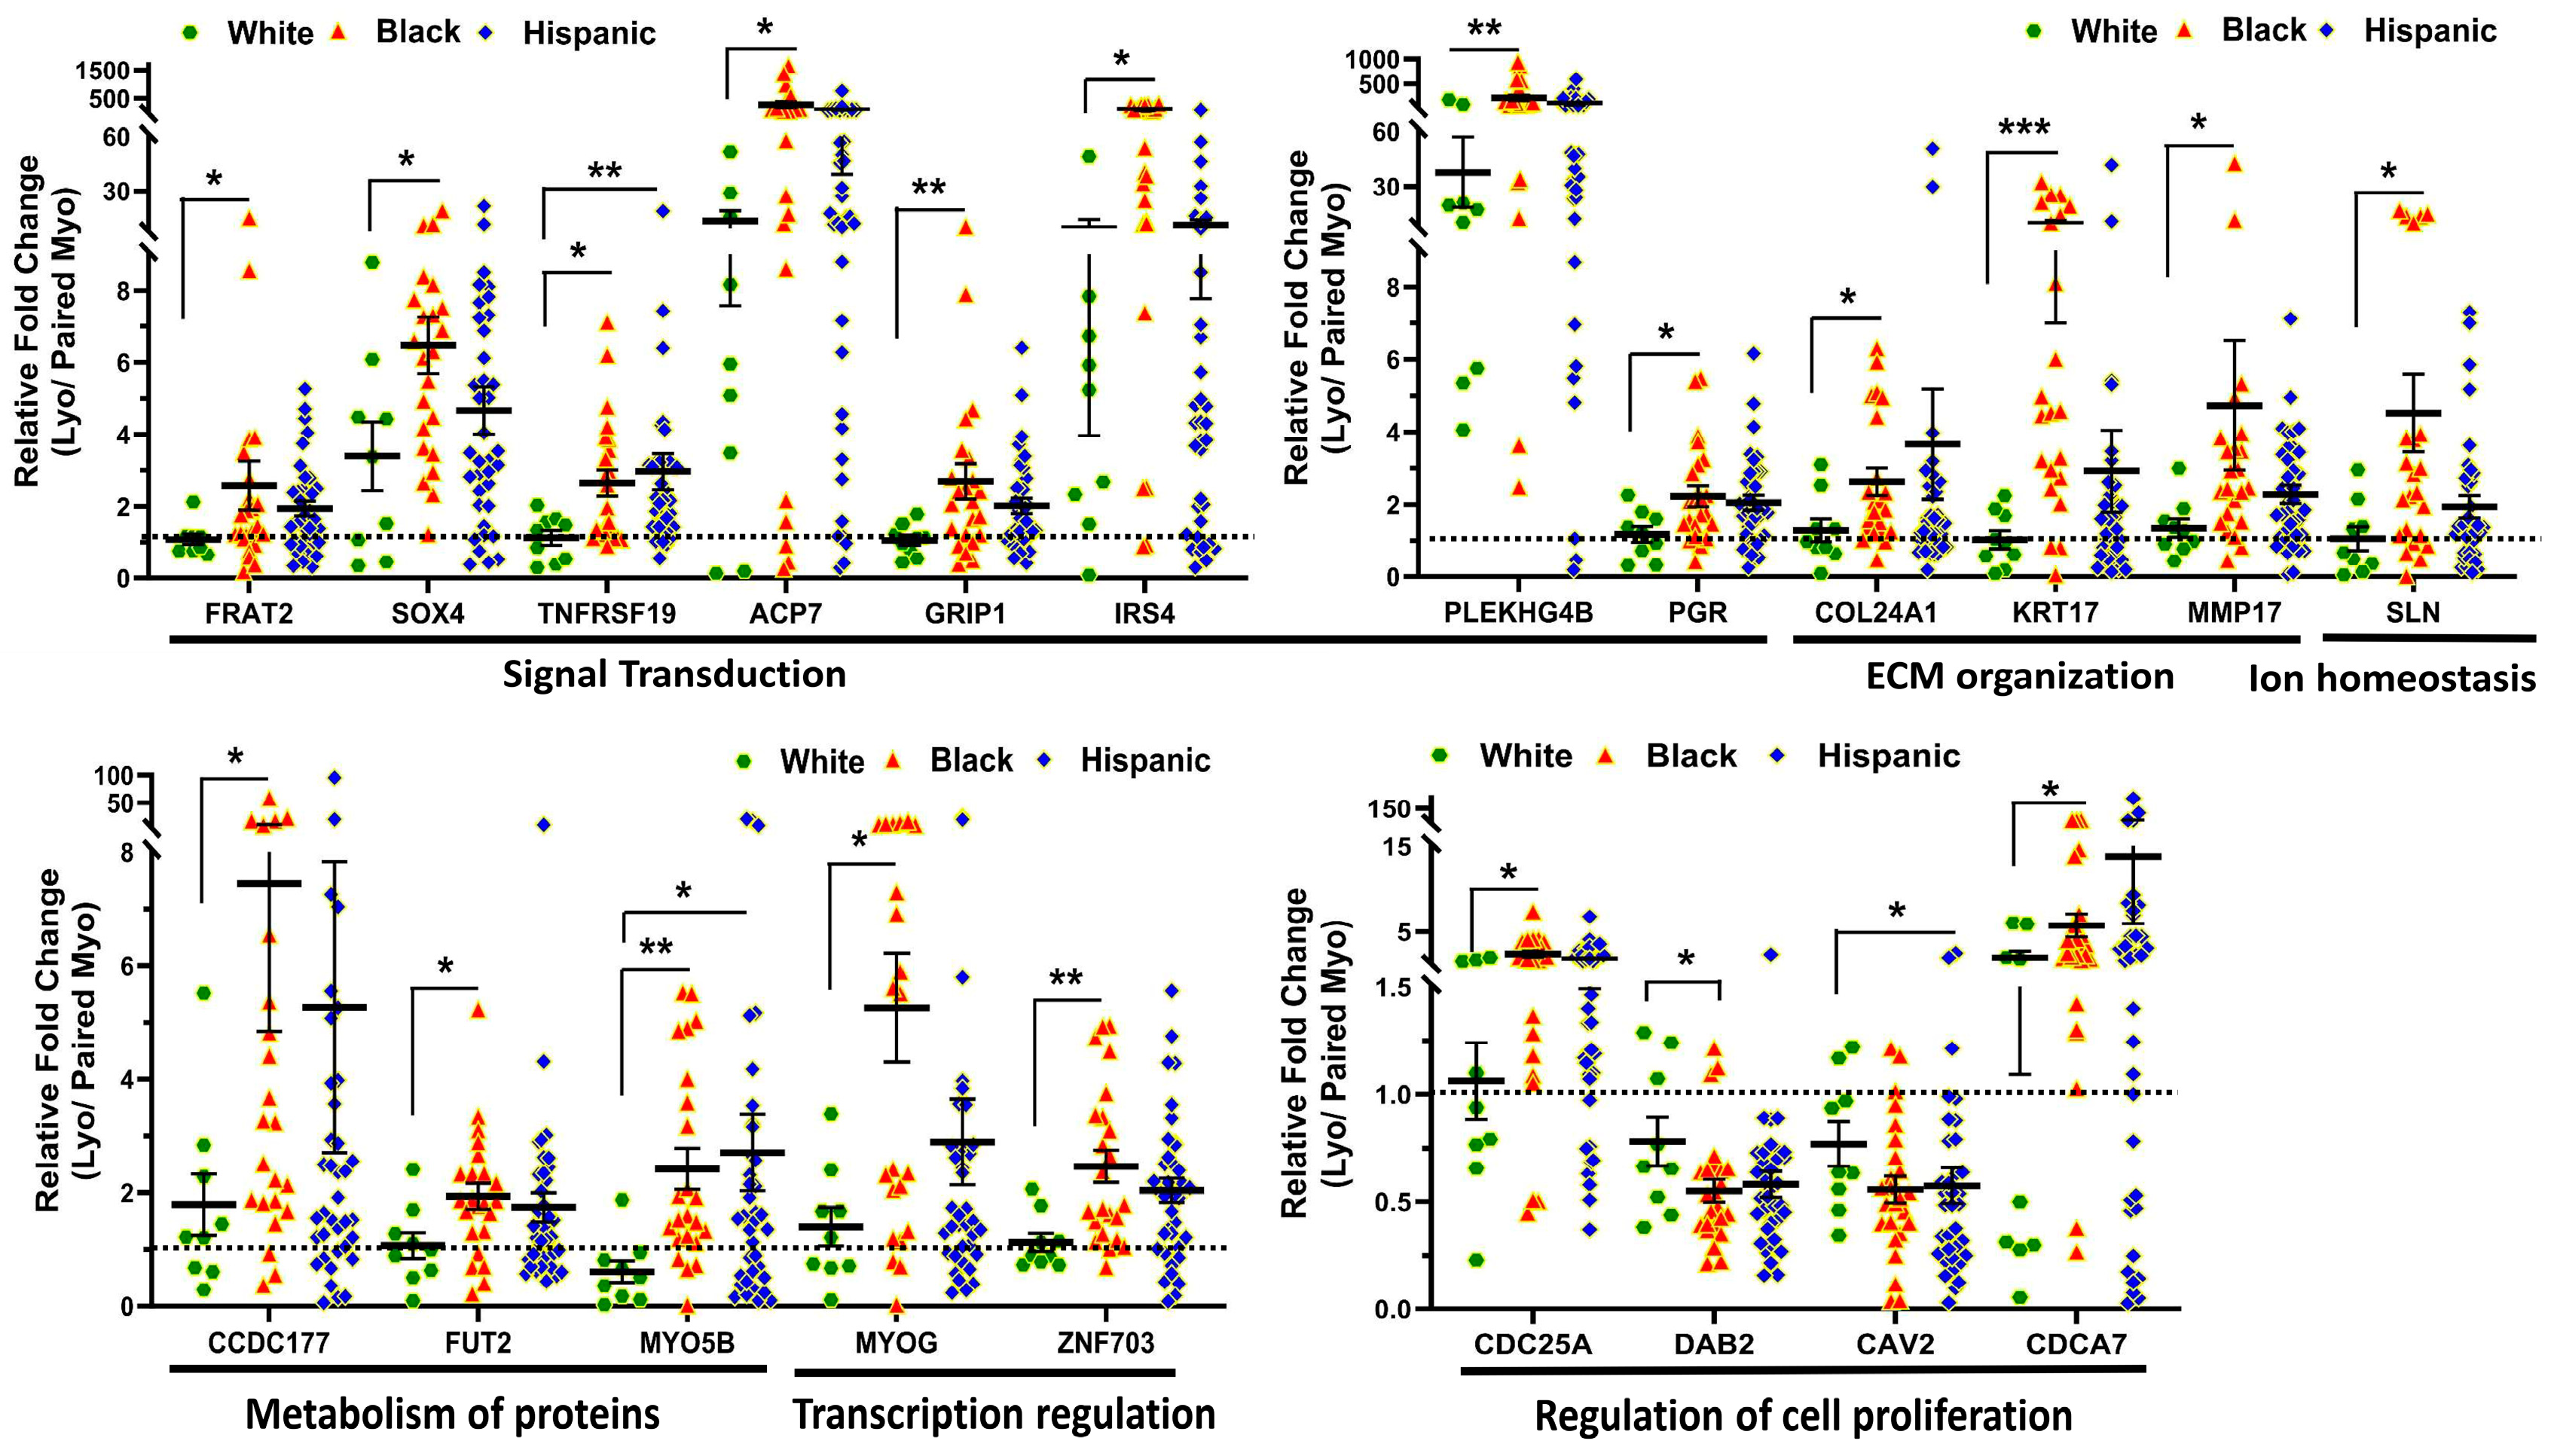
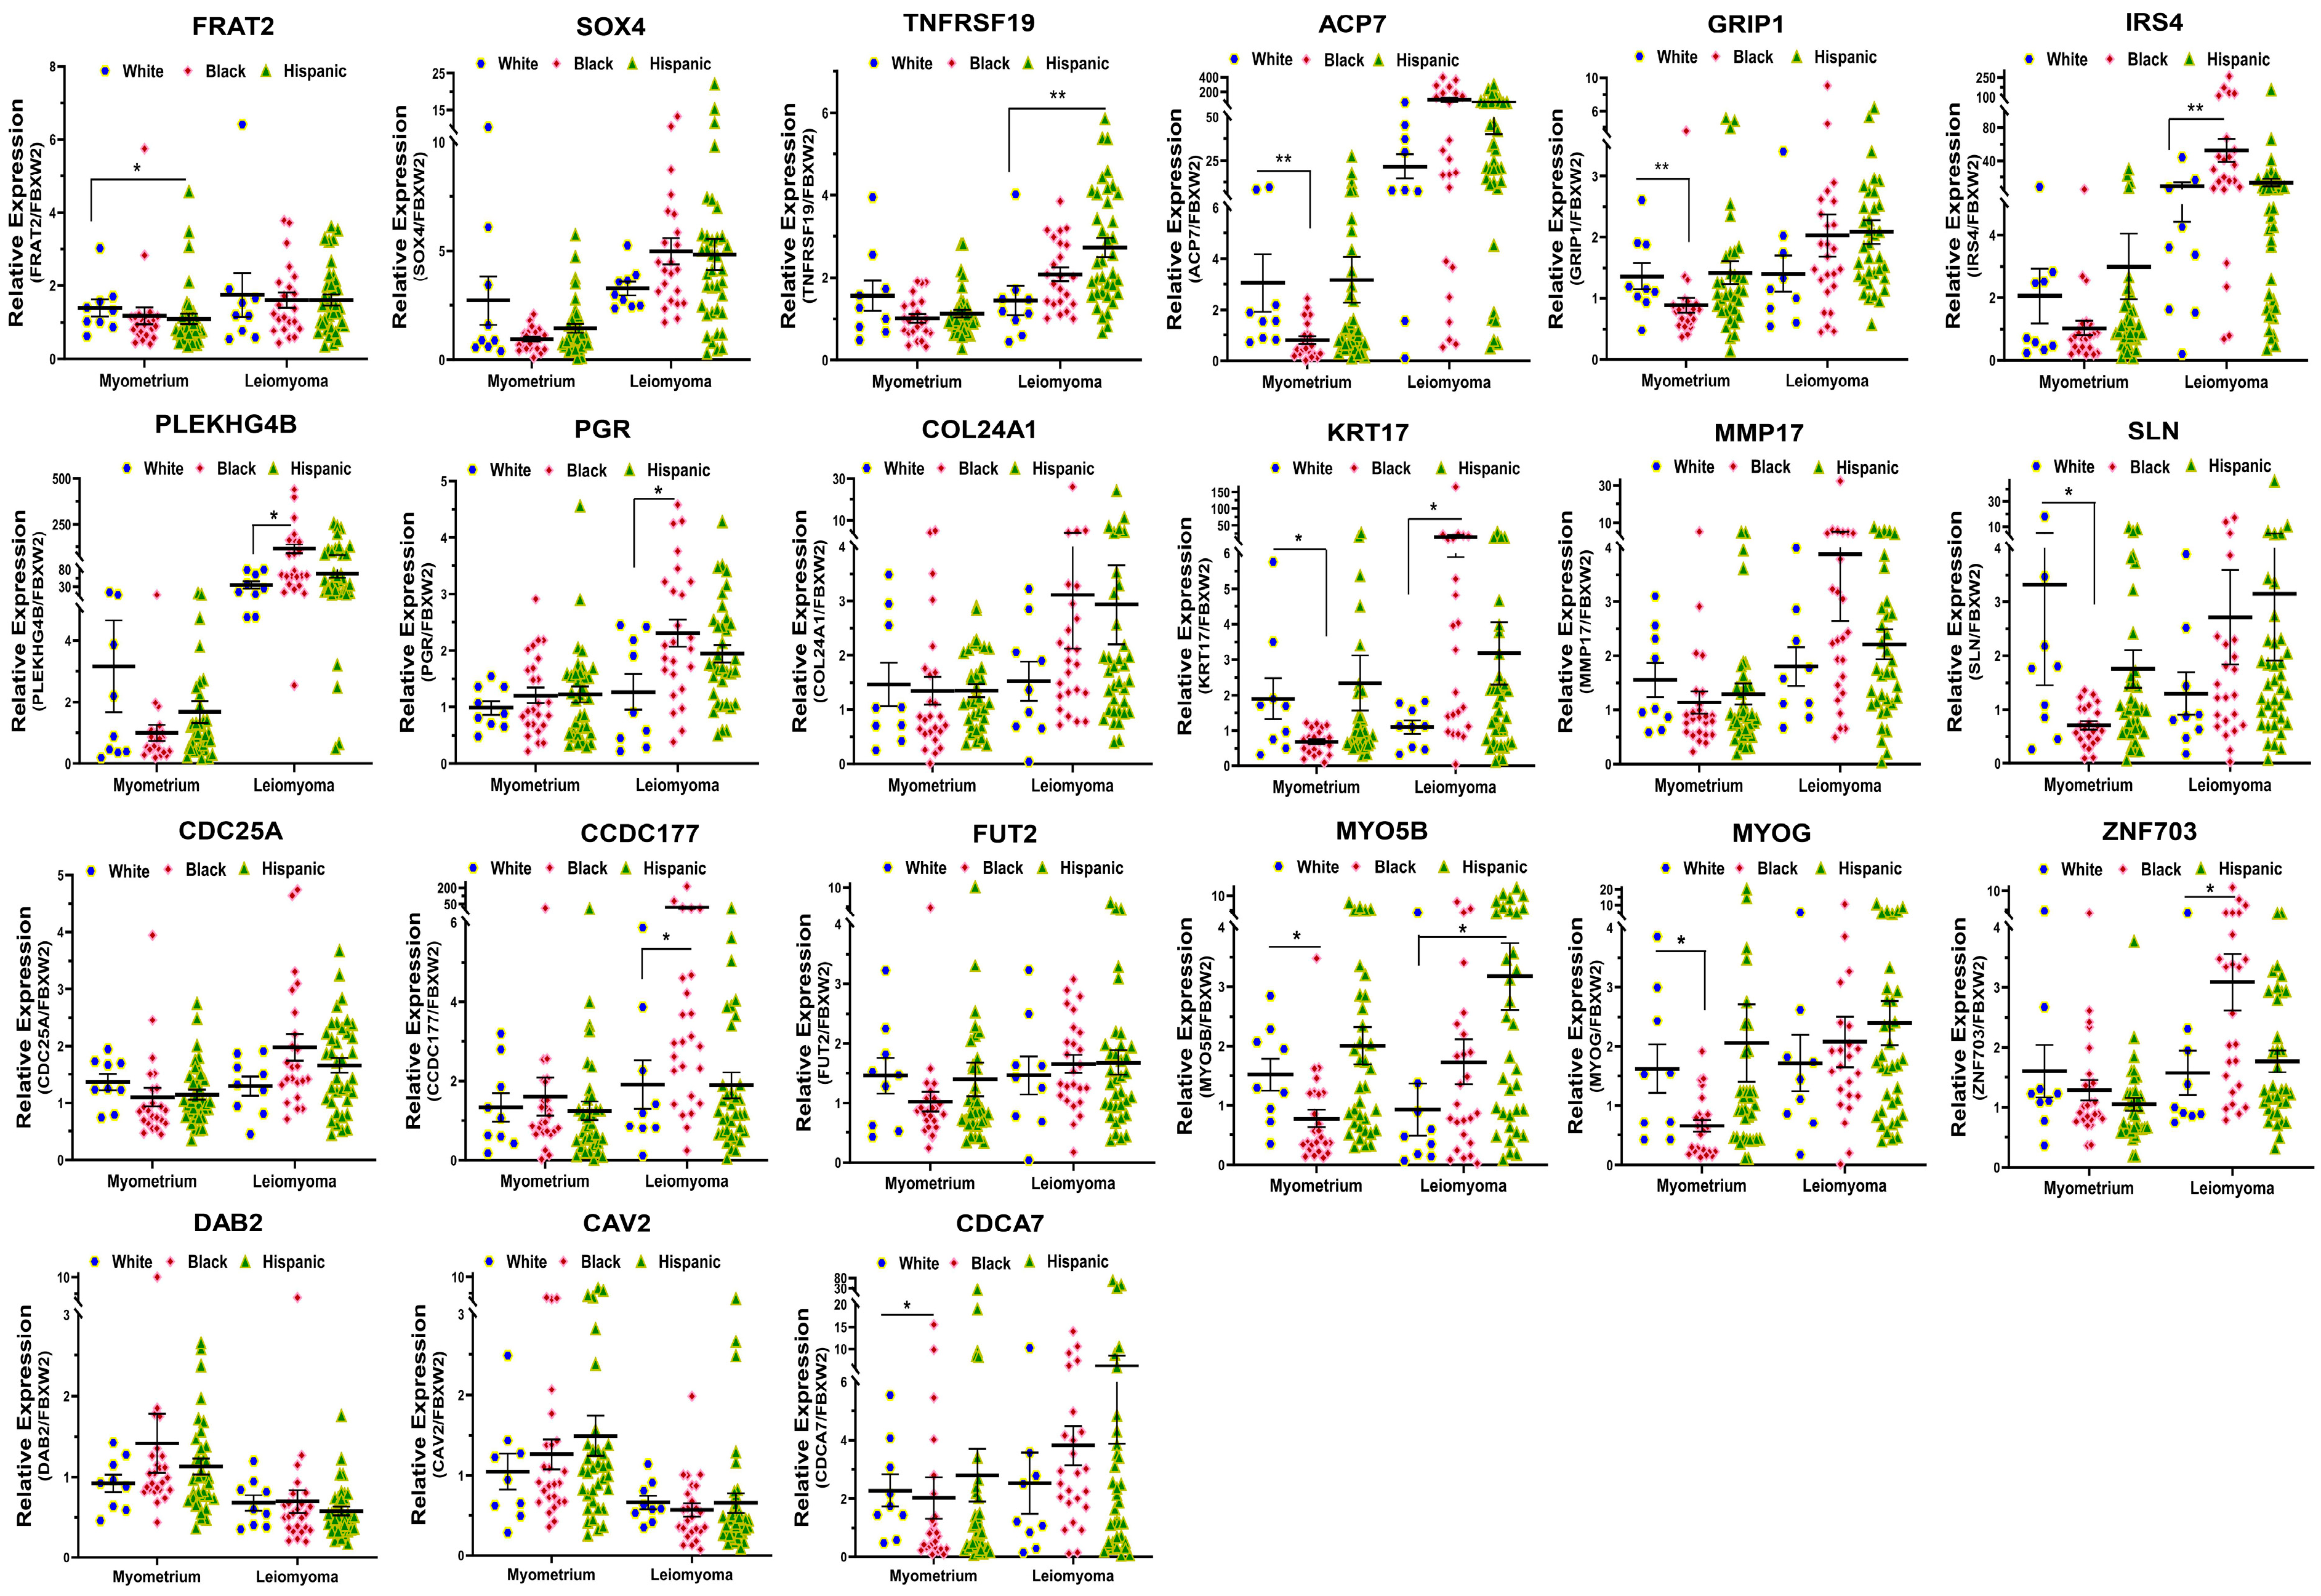
2.2. Validation of Race/Ethnicity-Associated Coding RNA Transcripts in Leiomyoma and Matched Myometrium
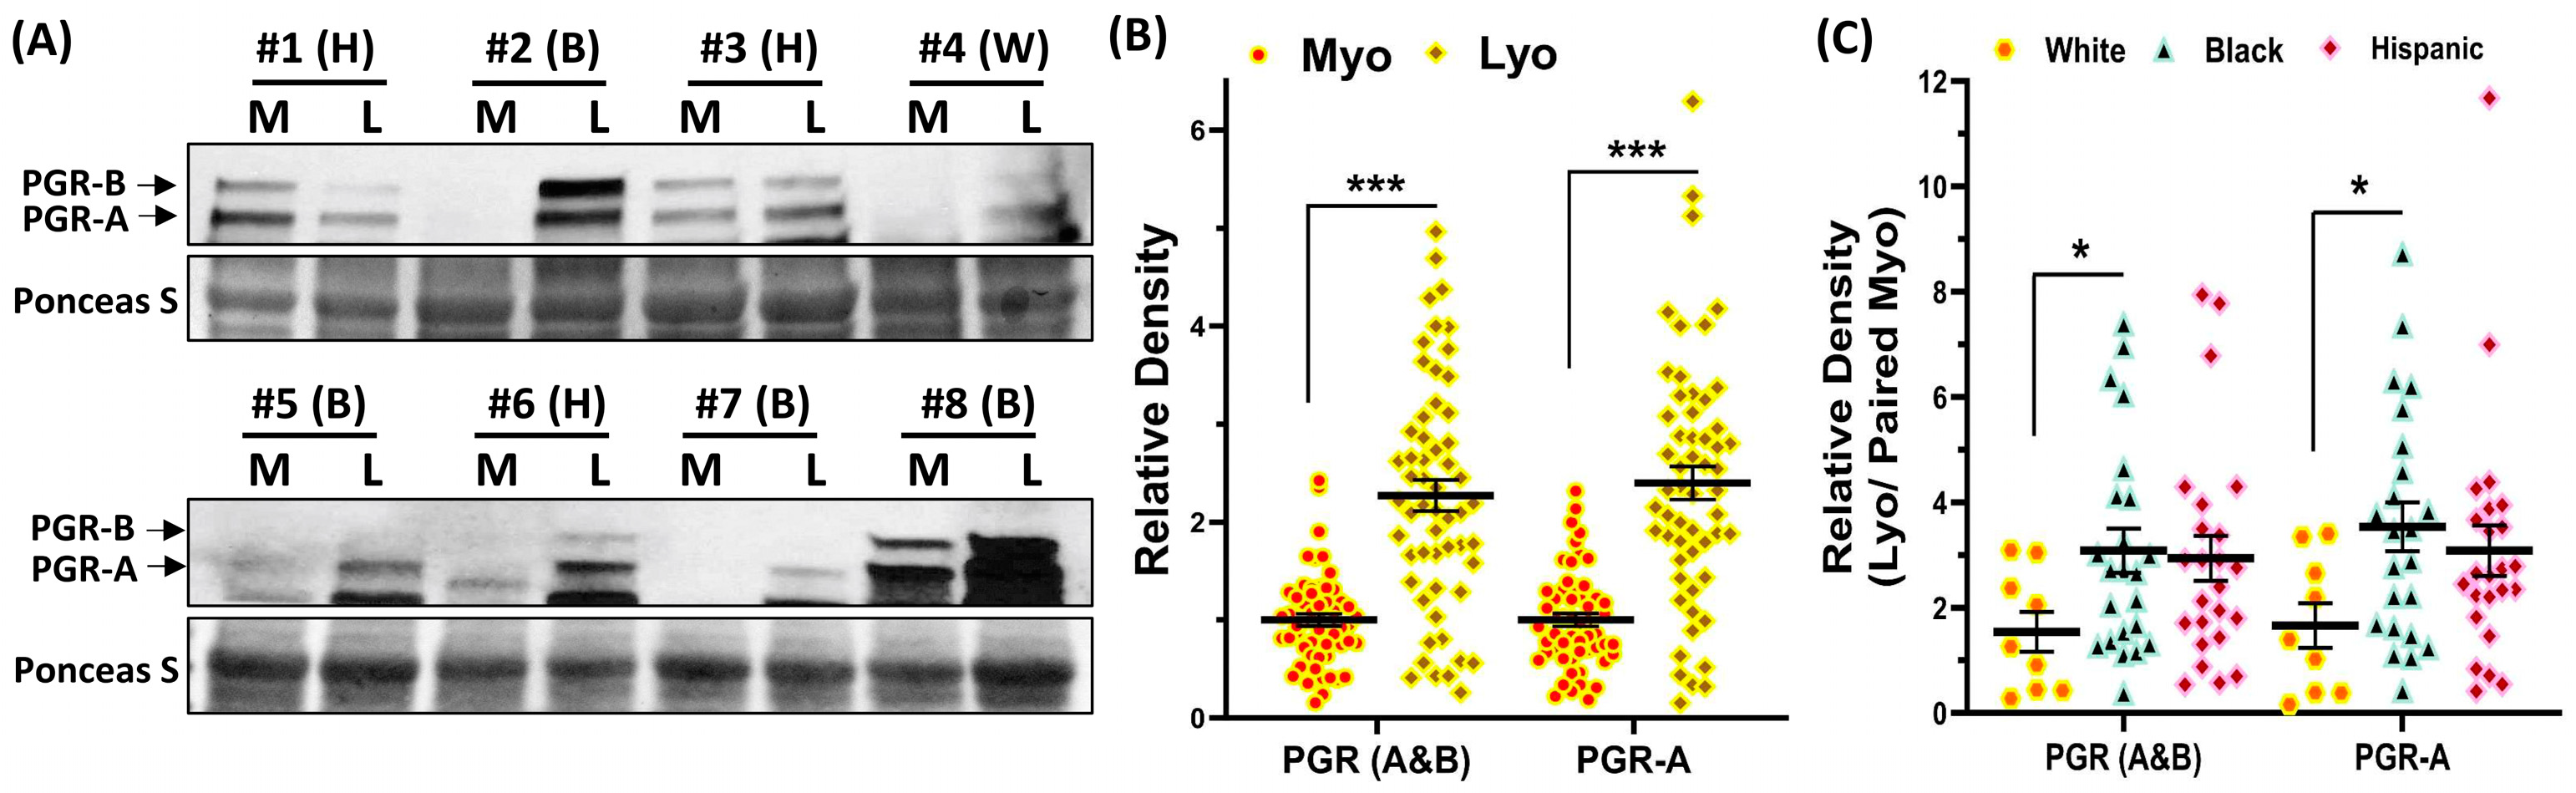
2.3. Validation of PGR Protein Expression in Leiomyoma and Matched Myometrium
3. Discussion
4. Materials and Methods
4.1. Myometrium and Leiomyoma Tissues Collection
4.2. MED12 Mutation Analysis
4.3. RNA Sequencing and Bioinformatic Analysis
4.4. Quantitative RT-PCR
4.5. Immunoblotting
4.6. Statistical Analysis
Supplementary Materials
Author Contributions
Funding
Institutional Review Board Statement
Informed Consent Statement
Data Availability Statement
Conflicts of Interest
References
- Wise, L.A.; Laughlin-Tommaso, S.K. Epidemiology of Uterine Fibroids: From Menarche to Menopause. Clin. Obstet. Gynecol. 2016, 59, 2–24. [Google Scholar] [CrossRef] [PubMed]
- Marsh, E.E.; Ekpo, G.E.; Cardozo, E.R.; Brocks, M.; Dune, T.; Cohen, L.S. Racial differences in fibroid prevalence and ultrasound findings in asymptomatic young women (18–30 years old): A pilot study. Fertil. Steril. 2013, 99, 1951–1957. [Google Scholar] [CrossRef]
- Marshall, L.M.; Spiegelman, D.; Barbieri, R.L.; Goldman, M.B.; Manson, J.E.; Colditz, G.A.; Willett, W.C.; Hunter, D.J. Variation in the incidence of uterine leiomyoma among premenopausal women by age and race. Obstet. Gynecol. 1997, 90, 967–973. [Google Scholar] [CrossRef] [PubMed]
- Kjerulff, K.H.; Langenberg, P.; Seidman, J.D.; Stolley, P.D.; Guzinski, G.M. Uterine leiomyomas. Racial differences in severity, symptoms and age at diagnosis. J. Reprod. Med. 1996, 41, 483–490. [Google Scholar] [PubMed]
- Stewart, E.A.; Nicholson, W.K.; Bradley, L.; Borah, B.J. The burden of uterine fibroids for African-American women: Results of a national survey. J. Womens Health 2013, 22, 807–816. [Google Scholar] [CrossRef] [PubMed]
- Tufano, A.; Perdonà, S.; Viscuso, P.; Frisenda, M.; Canale, V.; Rossi, A.; Del Prete, P.; Passaro, F.; Calarco, A. The Impact of Ethnicity and Age on Distribution of Metastases in Patients with Upper Tract Urothelial Carcinoma: Analysis of SEER Data. Biomedicines 2023, 11, 1943. [Google Scholar] [CrossRef] [PubMed]
- Alexander, A.L.; Strohl, A.E.; Rieder, S.; Holl, J.; Barber, E.L. Examining Disparities in Route of Surgery and Postoperative Complications in Black Race and Hysterectomy. Obstet. Gynecol. 2019, 133, 6–12. [Google Scholar] [CrossRef]
- Othman, E.E.; Al-Hendy, A. Molecular genetics and racial disparities of uterine leiomyomas. Best Pract. Res. Clin. Obstet. Gynaecol. 2008, 22, 589–601. [Google Scholar] [CrossRef]
- Catherino, W.H.; Eltoukhi, H.M.; Al-Hendy, A. Racial and ethnic differences in the pathogenesis and clinical manifestations of uterine leiomyoma. Semin. Reprod. Med. 2013, 31, 370–379. [Google Scholar] [CrossRef]
- Sabry, M.; Halder, S.K.; Allah, A.S.; Roshdy, E.; Rajaratnam, V.; Al-Hendy, A. Serum vitamin D3 level inversely correlates with uterine fibroid volume in different ethnic groups: A cross-sectional observational study. Int. J. Womens Health 2013, 5, 93–100. [Google Scholar]
- Commandeur, A.E.; Styer, A.K.; Teixeira, J.M. Epidemiological and genetic clues for molecular mechanisms involved in uterine leiomyoma development and growth. Hum. Reprod. Update 2015, 21, 593–615. [Google Scholar] [CrossRef]
- Prusinski Fernung, L.E.; Jones, K.; Mas, A.; Kleven, D.; Waller, J.L.; Al-Hendy, A. Expanding upon the Human Myometrial Stem Cell Hypothesis and the Role of Race, Hormones, Age, and Parity in a Profibroid Environment. Am. J. Pathol. 2018, 188, 2293–2306. [Google Scholar] [CrossRef]
- Amant, F.; Dorfling, C.M.; de Brabanter, J.; Vandewalle, J.; Vergote, I.; Lindeque, B.G.; van Rensburg, E.J. A possible role of the cytochrome P450c17alpha gene (CYP17) polymorphism in the pathobiology of uterine leiomyomas from black South African women: A pilot study. Acta Obstet. Gynecol. Scand. 2004, 83, 234–239. [Google Scholar] [PubMed]
- Gooden, K.M.; Schroeder, J.C.; North, K.E.; Gammon, M.D.; Hartmann, K.E.; Taylor, J.; Baird, D.D. Val153Met polymorphism of catechol-O-methyltransferase and prevalence of uterine leiomyomata. Reprod. Sci. 2007, 14, 117–120. [Google Scholar] [CrossRef]
- de Oliveira, E.; de Aquino Castro, R.; Gomes, M.T.; da Silva, I.D.; Baracat, E.C.; de Lima, G.R.; Sartori, M.G.; Girão, M.J. The catechol-O-methyltransferase (COMT) gene polymorphism and prevalence of uterine fibroids. Maturitas 2008, 60, 235–238. [Google Scholar] [CrossRef]
- Al-Hendy, A.; Salama, S.A. Catechol-O-methyltransferase polymorphism is associated with increased uterine leiomyoma risk in different ethnic groups. J. Soc. Gynecol. Investig. 2006, 13, 136–144. [Google Scholar] [CrossRef] [PubMed]
- Ishikawa, H.; Reierstad, S.; Demura, M.; Rademaker, A.W.; Kasai, T.; Inoue, M.; Usui, H.; Shozu, M.; Bulun, S.E. High aromatase expression in uterine leiomyoma tissues of African-American women. J. Clin. Endocrinol. Metab. 2009, 94, 1752–1756. [Google Scholar] [CrossRef] [PubMed]
- Chuang, T.D.; Quintanilla, D.; Boos, D.; Khorram, O. Tryptophan catabolism is dysregulated in leiomyomas. Fertil. Steril. 2021, 116, 1160–1171. [Google Scholar] [CrossRef]
- Chuang, T.D.; Quintanilla, D.; Boos, D.; Khorram, O. Further characterization of tryptophan metabolism and its dysregulation in fibroids. F&S Sci. 2022, 3, 392–400. [Google Scholar]
- Chuang, T.D.; Quintanilla, D.; Boos, D.; Khorram, O. Differential Expression of Super-Enhancer-Associated Long Non-coding RNAs in Uterine Leiomyomas. Reprod. Sci. 2022, 29, 2960–2976. [Google Scholar] [CrossRef]
- Bray, M.J.; Wellons, M.F.; Jones, S.H.; Torstenson, E.S.; Edwards, T.L.; Velez Edwards, D.R. Transethnic and race-stratified genome-wide association study of fibroid characteristics in African American and European American women. Fertil. Steril. 2018, 110, 737–745.e34. [Google Scholar] [CrossRef]
- Edwards, T.L.; Giri, A.; Hellwege, J.N.; Hartmann, K.E.; Stewart, E.A.; Jeff, J.M.; Bray, M.J.; Pendergrass, S.A.; Torstenson, E.S.; Keaton, J.M.; et al. A Trans-Ethnic Genome-Wide Association Study of Uterine Fibroids. Front. Genet. 2019, 10, 511. [Google Scholar] [CrossRef]
- Pan, Q.; Luo, X.; Chegini, N. Genomic and proteomic profiling I: Leiomyomas in African Americans and Caucasians. Reprod. Biol. Endocrinol. 2007, 5, 34. [Google Scholar] [CrossRef] [PubMed]
- Paul, E.N.; Grey, J.A.; Carpenter, T.J.; Madaj, Z.B.; Lau, K.H.; Givan, S.A.; Burns, G.W.; Chandler, R.L.; Wegienka, G.R.; Shen, H.; et al. Transcriptome and DNA methylome analyses reveal underlying mechanisms for the racial disparity in uterine fibroids. JCI Insight 2022, 7, e160274. [Google Scholar] [CrossRef]
- Li, Y.; McNally, R.P.; Feng, Y.; Kim, J.J.; Wei, J.J. Racial differences in transcriptomics and reactive oxygen species burden in myometrium and leiomyoma. Hum. Reprod. 2023, 38, 609–620. [Google Scholar] [CrossRef]
- Chuang, T.D.; Gao, J.; Quintanilla, D.; McSwiggin, H.; Boos, D.; Yan, W.; Khorram, O. Differential Expression of MED12-Associated Coding RNA Transcripts in Uterine Leiomyomas. Int. J. Mol. Sci. 2023, 24, 3742. [Google Scholar] [CrossRef]
- Ptacek, T.; Song, C.; Walker, C.L.; Sell, S.M. Physical mapping of distinct 7q22 deletions in uterine leiomyoma and analysis of a recently annotated 7q22 candidate gene. Cancer Genet. Cytogenet. 2007, 174, 116–120. [Google Scholar] [CrossRef] [PubMed]
- Madauss, K.P.; Grygielko, E.T.; Deng, S.J.; Sulpizio, A.C.; Stanley, T.B.; Wu, C.; Short, S.A.; Thompson, S.K.; Stewart, E.L.; Laping, N.J.; et al. A structural and in vitro characterization of asoprisnil: A selective progesterone receptor modulator. Mol. Endocrinol. 2007, 21, 1066–1081. [Google Scholar] [CrossRef] [PubMed]
- Cordeiro Mitchell, C.N.; Islam, M.S.; Afrin, S.; Brennan, J.; Psoter, K.J.; Segars, J.H. Mechanical stiffness augments ligand-dependent progesterone receptor B activation via MEK 1/2 and Rho/ROCK-dependent signaling pathways in uterine fibroid cells. Fertil. Steril. 2021, 116, 255–265. [Google Scholar] [CrossRef]
- Malik, M.; Segars, J.; Catherino, W.H. Integrin beta1 regulates leiomyoma cytoskeletal integrity and growth. Matrix Biol. 2012, 31, 389–397. [Google Scholar] [CrossRef]
- Jiang, J.; Yu, C.; Chen, M.; Zhang, H.; Tian, S.; Sun, C. Reduction of miR-29c enhances pancreatic cancer cell migration and stem cell-like phenotype. Oncotarget 2015, 6, 2767–2778. [Google Scholar] [CrossRef] [PubMed]
- Moreno, C.S. SOX4: The unappreciated oncogene. Semin Cancer Biol. 2020, 67 Pt 1, 57–64. [Google Scholar] [CrossRef]
- Katoh, M. Multi-layered prevention and treatment of chronic inflammation, organ fibrosis and cancer associated with canonical WNT/β-catenin signaling activation (Review). Int. J. Mol. Med. 2018, 42, 713–725. [Google Scholar] [CrossRef]
- Deng, C.; Lin, Y.X.; Qi, X.K.; He, G.P.; Zhang, Y.; Zhang, H.J.; Xu, M.; Feng, Q.S.; Bei, J.X.; Zeng, Y.X.; et al. TNFRSF19 Inhibits TGFβ Signaling through Interaction with TGFβ Receptor Type I to Promote Tumorigenesis. Cancer Res. 2018, 78, 3469–3483. [Google Scholar] [CrossRef] [PubMed]
- Flanagan, J.U.; Cassady, A.I.; Schenk, G.; Guddat, L.W.; Hume, D.A. Identification and molecular modeling of a novel, plant-like, human purple acid phosphatase. Gene 2006, 377, 12–20. [Google Scholar] [CrossRef] [PubMed]
- Jang, Y.; Cheong, W.; Park, G.; Kim, Y.; Ha, J.; Ahn, S. Tumor Microenvironment and Genes Affecting the Prognosis of Temozolomide-Treated Glioblastoma. J. Pers. Med. 2023, 13, 188. [Google Scholar] [CrossRef] [PubMed]
- Brückner, K.; Pablo Labrador, J.; Scheiffele, P.; Herb, A.; Seeburg, P.H.; Klein, R. EphrinB ligands recruit GRIP family PDZ adaptor proteins into raft membrane microdomains. Neuron 1999, 22, 511–524. [Google Scholar] [CrossRef]
- Mardilovich, K.; Pankratz, S.L.; Shaw, L.M. Expression and function of the insulin receptor substrate proteins in cancer. Cell Commun. Signal. 2009, 7, 14. [Google Scholar] [CrossRef]
- Ninomiya, K.; Ohta, K.; Yamashita, K.; Mizuno, K.; Ohashi, K. PLEKHG4B enables actin cytoskeletal remodeling during epithelial cell-cell junction formation. J. Cell Sci. 2021, 134, jcs249078. [Google Scholar] [CrossRef]
- Ali, M.; Ciebiera, M.; Vafaei, S.; Alkhrait, S.; Chen, H.Y.; Chiang, Y.F.; Huang, K.C.; Feduniw, S.; Hsia, S.M.; Al-Hendy, A. Progesterone Signaling and Uterine Fibroid Pathogenesis; Molecular Mechanisms and Potential Therapeutics. Cells 2023, 12, 1117. [Google Scholar] [CrossRef]
- Koch, M.; Laub, F.; Zhou, P.; Hahn, R.A.; Tanaka, S.; Burgeson, R.E.; Gerecke, D.R.; Ramirez, F.; Gordon, M.K. Collagen XXIV, a vertebrate fibrillar collagen with structural features of invertebrate collagens: Selective expression in developing cornea and bone. J. Biol. Chem. 2003, 278, 43236–43244. [Google Scholar] [CrossRef] [PubMed]
- Zhang, H.; Zhang, Y.; Xia, T.; Lu, L.; Luo, M.; Chen, Y.; Liu, Y.; Li, Y. The Role of Keratin17 in Human Tumours. Front. Cell Dev. Biol. 2022, 10, 818416. [Google Scholar] [CrossRef]
- Yip, C.; Foidart, P.; Noël, A.; Sounni, N.E. MT4-MMP: The GPI-Anchored Membrane-Type Matrix Metalloprotease with Multiple Functions in Diseases. Int. J. Mol. Sci. 2019, 20, 354. [Google Scholar] [CrossRef] [PubMed]
- Chambers, P.J.; Juracic, E.S.; Fajardo, V.A.; Tupling, A.R. Role of SERCA and sarcolipin in adaptive muscle remodeling. Am. J. Physiol. Cell Physiol. 2022, 322, C382–C394. [Google Scholar] [CrossRef] [PubMed]
- Ju, Q.; Zhao, Y.J.; Ma, S.; Li, X.M.; Zhang, H.; Zhang, S.Q.; Yang, Y.M.; Yan, S.X. Genome-wide analysis of prognostic-related lncRNAs, miRNAs and mRNAs forming a competing endogenous RNA network in lung squamous cell carcinoma. J. Cancer Res. Clin. Oncol. 2020, 146, 1711–1723. [Google Scholar] [CrossRef] [PubMed]
- Liu, P.; Liu, J.; Ding, M.; Liu, Y.; Zhang, Y.; Chen, X.; Zhou, Z. FUT2 promotes the tumorigenicity and metastasis of colorectal cancer cells via the Wnt/β-catenin pathway. Int. J. Oncol. 2023, 62, 35. [Google Scholar] [CrossRef]
- Bowman, D.M.; Kaji, I.; Goldenring, J.R. Altered MYO5B Function Underlies Microvillus Inclusion Disease: Opportunities for Intervention at a Cellular Level. Cell Mol. Gastroenterol. Hepatol. 2022, 14, 553–565. [Google Scholar] [CrossRef]
- Zammit, P.S. Function of the myogenic regulatory factors Myf5, MyoD, Myogenin and MRF4 in skeletal muscle, satellite cells and regenerative myogenesis. Semin. Cell Dev. Biol. 2017, 72, 19–32. [Google Scholar] [CrossRef]
- Yang, G.; Ma, F.; Zhong, M.; Fang, L.; Peng, Y.; Xin, X.; Zhong, J.; Yuan, F.; Gu, H.; Zhu, W.; et al. ZNF703 acts as an oncogene that promotes progression in gastric cancer. Oncol Rep. 2014, 31, 1877–1882. [Google Scholar] [CrossRef]
- Sur, S.; Agrawal, D.K. Phosphatases and kinases regulating CDC25 activity in the cell cycle: Clinical implications of CDC25 overexpression and potential treatment strategies. Mol. Cell Biochem. 2016, 416, 33–46. [Google Scholar] [CrossRef]
- Price, Z.K.; Lokman, N.A.; Yoshihara, M.; Kajiyama, H.; Oehler, M.K.; Ricciardelli, C. Disabled-2 (DAB2): A Key Regulator of Anti- and Pro-Tumorigenic Pathways. Int. J. Mol. Sci. 2022, 24, 696. [Google Scholar] [CrossRef]
- Bkaily, G.; Jacques, D. Calcium Homeostasis, Transporters, and Blockers in Health and Diseases of the Cardiovascular System. Int. J. Mol. Sci. 2023, 24, 8803. [Google Scholar] [CrossRef]
- Osthus, R.C.; Karim, B.; Prescott, J.E.; Smith, B.D.; McDevitt, M.; Huso, D.L.; Dang, C.V. The Myc target gene JPO1/CDCA7 is frequently overexpressed in human tumors and has limited transforming activity in vivo. Cancer Res. 2005, 65, 5620–5627. [Google Scholar] [CrossRef]
- Ishikawa, H.; Ishi, K.; Serna, V.A.; Kakazu, R.; Bulun, S.E.; Kurita, T. Progesterone is essential for maintenance and growth of uterine leiomyoma. Endocrinology 2010, 151, 2433–2442. [Google Scholar] [CrossRef] [PubMed]
- Chuang, T.D.; Khorram, O. Regulation of Cell Cycle Regulatory Proteins by MicroRNAs in Uterine Leiomyoma. Reprod. Sci. 2019, 26, 250–258. [Google Scholar] [CrossRef]
- Lindqvist, A.; Rodríguez-Bravo, V.; Medema, R.H. The decision to enter mitosis: Feedback and redundancy in the mitotic entry network. J. Cell Biol. 2009, 185, 193–202. [Google Scholar] [CrossRef]
- Terada, Y.; Tatsuka, M.; Jinno, S.; Okayama, H. Requirement for tyrosine phosphorylation of Cdk4 in G1 arrest induced by ultraviolet irradiation. Nature 1995, 376, 358–362. [Google Scholar] [CrossRef] [PubMed]
- Iavarone, A.; Massagué, J. Repression of the CDK activator Cdc25A and cell-cycle arrest by cytokine TGF-beta in cells lacking the CDK inhibitor p15. Nature 1997, 387, 417–422. [Google Scholar] [CrossRef] [PubMed]
- Vigo, E.; Müller, H.; Prosperini, E.; Hateboer, G.; Cartwright, P.; Moroni, M.C.; Helin, K. CDC25A phosphatase is a target of E2F and is required for efficient E2F-induced S phase. Mol. Cell Biol. 1999, 19, 6379–6395. [Google Scholar] [CrossRef]
- Shen, T.; Huang, S. The role of Cdc25A in the regulation of cell proliferation and apoptosis. Anticancer Agents Med. Chem. 2012, 12, 631–639. [Google Scholar] [CrossRef]
- Ray, D.; Terao, Y.; Fuhrken, P.G.; Ma, Z.Q.; DeMayo, F.J.; Christov, K.; Heerema, N.A.; Franks, R.; Tsai, S.Y.; Papoutsakis, E.T.; et al. Deregulated CDC25A expression promotes mammary tumorigenesis with genomic instability. Cancer Res. 2007, 67, 984–991. [Google Scholar] [CrossRef] [PubMed]
- Zhang, X.; Mu, X.; Huang, O.; Xie, Z.; Jiang, M.; Geng, M.; Shen, K. Luminal breast cancer cell lines overexpressing ZNF703 are resistant to tamoxifen through activation of Akt/mTOR signaling. PLoS ONE 2013, 8, e72053. [Google Scholar] [CrossRef] [PubMed]
- Zhang, X.; Mu, X.; Huang, O.; Wang, Z.; Chen, J.; Chen, D.; Wang, G. ZNF703 promotes triple-negative breast cancer cells through cell-cycle signaling and associated with poor prognosis. BMC Cancer 2022, 22, 226. [Google Scholar] [CrossRef]
- Ma, F.; Bi, L.; Yang, G.; Zhang, M.; Liu, C.; Zhao, Y.; Wang, Y.; Wang, J.; Bai, Y.; Zhang, Y. ZNF703 promotes tumor cell proliferation and invasion and predicts poor prognosis in patients with colorectal cancer. Oncol. Rep. 2014, 32, 1071–1077. [Google Scholar] [CrossRef]
- Palumberi, D.; Aldi, S.; Ermini, L.; Ziche, M.; Finetti, F.; Donnini, S.; Rosati, F. RNA-mediated gene silencing of FUT1 and FUT2 influences expression and activities of bovine and human fucosylated nucleolin and inhibits cell adhesion and proliferation. J. Cell. Biochem. 2010, 111, 229–238. [Google Scholar] [CrossRef] [PubMed]
- Lai, T.Y.; Chen, I.J.; Lin, R.J.; Liao, G.S.; Yeo, H.L.; Ho, C.L.; Wu, J.C.; Chang, N.C.; Lee, A.C.; Yu, A.L. Fucosyltransferase 1 and 2 play pivotal roles in breast cancer cells. Cell Death Discov. 2019, 5, 74. [Google Scholar] [CrossRef]
- Paulino, V.M.; Yang, Z.; Kloss, J.; Ennis, M.J.; Armstrong, B.A.; Loftus, J.C.; Tran, N.L. TROY (TNFRSF19) is overexpressed in advanced glial tumors and promotes glioblastoma cell invasion via Pyk2-Rac1 signaling. Mol. Cancer Res. 2010, 8, 1558–1567. [Google Scholar] [CrossRef]
- Čokić, V.P.; Mossuz, P.; Han, J.; Socoro, N.; Beleslin-Čokić, B.B.; Mitrović, O.; Subotički, T.; Diklić, M.; Leković, D.; Gotić, M.; et al. Microarray and Proteomic Analyses of Myeloproliferative Neoplasms with a Highlight on the mTOR Signaling Pathway. PLoS ONE 2015, 10, e0135463. [Google Scholar] [CrossRef]
- Spanjaard, R.A.; Whren, K.M.; Graves, C.; Bhawan, J. Tumor necrosis factor receptor superfamily member TROY is a novel melanoma biomarker and potential therapeutic target. Int. J. Cancer 2007, 120, 1304–1310. [Google Scholar] [CrossRef]
- Gao, L.; Zhang, L. Construction and comprehensive analysis of a ceRNA network to reveal potential prognostic biomarkers for lung adenocarcinoma. BMC Cancer 2021, 21, 849. [Google Scholar] [CrossRef]
- Xia, Z.; Zhang, N.; Ding, D. Proliferation and migration of hepatoblastoma cells are mediated by IRS-4 via PI3K/Akt pathways. Int. J. Clin. Exp. Med. 2014, 7, 3763–3769. [Google Scholar]
- Ursø, B.; Ilondo, M.M.; Holst, P.A.; Christoffersen, C.T.; Ouwens, M.; Giorgetti, S.; Van Obberghen, E.; Naor, D.; Tornqvist, H.; De Meyts, P. IRS-4 mediated mitogenic signalling by insulin and growth hormone in LB cells, a murine T-cell lymphoma devoid of IGF-I receptors. Cell Signal. 2003, 15, 385–394. [Google Scholar] [CrossRef]
- Fantin, V.R.; Keller, S.R.; Lienhard, G.E.; Wang, L.M. Insulin receptor substrate 4 supports insulin- and interleukin 4-stimulated proliferation of hematopoietic cells. Biochem. Biophys. Res. Commun. 1999, 260, 718–723. [Google Scholar] [CrossRef]
- Guijarro, L.G.; Sanmartin-Salinas, P.; Pérez-Cuevas, E.; Toledo-Lobo, M.V.; Monserrat, J.; Zoullas, S.; Sáez, M.A.; Álvarez-Mon, M.A.; Bujan, J.; Noguerales-Fraguas, F.; et al. Possible Role of IRS-4 in the Origin of Multifocal Hepatocellular Carcinoma. Cancers 2021, 13, 2560. [Google Scholar] [CrossRef]
- Sanmartín-Salinas, P.; Lobo, M.; Noguerales-Fraguas, F.; Londoño, M.T.; Jiménez-Ruiz, A.; Guijarro, L.G. Insulin receptor substrate-4 is overexpressed in colorectal cancer and promotes retinoblastoma-cyclin-dependent kinase activation. J. Gastroenterol. 2018, 53, 932–944. [Google Scholar] [CrossRef] [PubMed]
- Vervoort, S.J.; van Boxtel, R.; Coffer, P.J. The role of SRY-related HMG box transcription factor 4 (SOX4) in tumorigenesis and metastasis: Friend or foe? Oncogene 2013, 32, 3397–3409. [Google Scholar] [CrossRef]
- Jian, Y.; Kong, L.; Xu, H.; Shi, Y.; Huang, X.; Zhong, W.; Huang, S.; Li, Y.; Shi, D.; Xiao, Y.; et al. Protein phosphatase 1 regulatory inhibitor subunit 14C promotes triple-negative breast cancer progression via sustaining inactive glycogen synthase kinase 3 beta. Clin. Transl. Med. 2022, 12, e725. [Google Scholar] [CrossRef] [PubMed]
- Zhu, Z.; Ni, H.; You, B.; Shi, S.; Shan, Y.; Bao, L.; Duan, B.; You, Y. Elevated EGFL6 modulates cell metastasis and growth via AKT pathway in nasopharyngeal carcinoma. Cancer Med. 2018, 7, 6281–6289. [Google Scholar] [CrossRef] [PubMed]
- Su, G.; Wang, W.; Xu, L.; Li, G. Progress of EGFL6 in angiogenesis and tumor development. Int. J. Clin. Exp. Pathol. 2022, 15, 436–443. [Google Scholar]
- Engelman, J.A.; Zhang, X.; Galbiati, F.; Volonte, D.; Sotgia, F.; Pestell, R.G.; Minetti, C.; Scherer, P.E.; Okamoto, T.; Lisanti, M.P. Molecular genetics of the caveolin gene family: Implications for human cancers, diabetes, Alzheimer disease, and muscular dystrophy. Am. J. Hum. Genet. 1998, 63, 1578–1587. [Google Scholar] [CrossRef]
- Engelman, J.A.; Zhang, X.L.; Galbiati, F.; Lisanti, M.P. Chromosomal localization, genomic organization, and developmental expression of the murine caveolin gene family (Cav-1, -2, and -3). Cav-1 and Cav-2 genes map to a known tumor suppressor locus (6-A2/7q31). FEBS Lett. 1998, 429, 330–336. [Google Scholar] [CrossRef]
- Engelman, J.A.; Zhang, X.L.; Lisanti, M.P. Genes encoding human caveolin-1 and -2 are co-localized to the D7S522 locus (7q31.1), a known fragile site (FRA7G) that is frequently deleted in human cancers. FEBS Lett. 1998, 436, 403–410. [Google Scholar] [CrossRef] [PubMed]
- Mok, S.C.; Chan, W.Y.; Wong, K.K.; Cheung, K.K.; Lau, C.C.; Ng, S.W.; Baldini, A.; Colitti, C.V.; Rock, C.O.; Berkowitz, R.S. DOC-2, a candidate tumor suppressor gene in human epithelial ovarian cancer. Oncogene 1998, 16, 2381–2387. [Google Scholar] [CrossRef] [PubMed]
- Wang, Z.; Tseng, C.P.; Pong, R.C.; Chen, H.; McConnell, J.D.; Navone, N.; Hsieh, J.T. The mechanism of growth-inhibitory effect of DOC-2/DAB2 in prostate cancer. Characterization of a novel GTPase-activating protein associated with N-terminal domain of DOC-2/DAB2. J. Biol. Chem. 2002, 277, 12622–12631. [Google Scholar] [CrossRef] [PubMed]
- Leppert, P.C.; Jayes, F.L.; Segars, J.H. The extracellular matrix contributes to mechanotransduction in uterine fibroids. Obstet. Gynecol. Int. 2014, 2014, 783289. [Google Scholar] [CrossRef] [PubMed]
- Navarro, A.; Bariani, M.V.; Yang, Q.; Al-Hendy, A. Understanding the Impact of Uterine Fibroids on Human Endometrium Function. Front. Cell Dev. Biol. 2021, 9, 633180. [Google Scholar] [CrossRef]
- Yang, Q.; Al-Hendy, A. Update on the Role and Regulatory Mechanism of Extracellular Matrix in the Pathogenesis of Uterine Fibroids. Int. J. Mol. Sci. 2023, 24, 5778. [Google Scholar] [CrossRef]
- Yang, L.; Zhang, S.; Wang, G. Keratin 17 in disease pathogenesis: From cancer to dermatoses. J. Pathol. 2019, 247, 158–165. [Google Scholar] [CrossRef]
- Toprani, S.M.; Kelkar Mane, V. Role of DNA damage and repair mechanisms in uterine fibroid/leiomyomas: A review. Biol. Reprod. 2021, 104, 58–70. [Google Scholar] [CrossRef]
- Nair, R.R.; Hsu, J.; Jacob, J.T.; Pineda, C.M.; Hobbs, R.P.; Coulombe, P.A. A role for keratin 17 during DNA damage response and tumor initiation. Proc. Natl. Acad. Sci. USA 2021, 118, e2020150118. [Google Scholar] [CrossRef]
- Hobbs, R.P.; DePianto, D.J.; Jacob, J.T.; Han, M.C.; Chung, B.M.; Batazzi, A.S.; Poll, B.G.; Guo, Y.; Han, J.; Ong, S.; et al. Keratin-dependent regulation of Aire and gene expression in skin tumor keratinocytes. Nat. Genet. 2015, 47, 933–938. [Google Scholar] [CrossRef]
- Ji, R.; Ji, Y.; Ma, L.; Ge, S.; Chen, J.; Wu, S.; Huang, T.; Sheng, Y.; Wang, L.; Yi, N.; et al. Keratin 17 upregulation promotes cell metastasis and angiogenesis in colon adenocarcinoma. Bioengineered 2021, 12, 12598–12611. [Google Scholar] [CrossRef] [PubMed]
- Chuang, T.D.; Khorram, O. Mechanisms underlying aberrant expression of miR-29c in uterine leiomyoma. Fertil. Steril. 2016, 105, 236–245.e1. [Google Scholar] [CrossRef] [PubMed]
- Chuang, T.D.; Khorram, O. miR-200c Regulates IL8 Expression by Targeting IKBKB: A Potential Mediator of Inflammation in Leiomyoma Pathogenesis. PLoS ONE 2014, 9, e95370. [Google Scholar] [CrossRef] [PubMed]
- Ciebiera, M.; Włodarczyk, M.; Zgliczyńska, M.; Łukaszuk, K.; Męczekalski, B.; Kobierzycki, C.; Łoziński, T.; Jakiel, G. The Role of Tumor Necrosis Factor α in the Biology of Uterine Fibroids and the Related Symptoms. Int. J. Mol. Sci. 2018, 19, 3869. [Google Scholar] [CrossRef]
- Sohail, A.; Sun, Q.; Zhao, H.; Bernardo, M.M.; Cho, J.A.; Fridman, R. MT4-(MMP17) and MT6-MMP (MMP25), A unique set of membrane-anchored matrix metalloproteinases: Properties and expression in cancer. Cancer Metastasis Rev. 2008, 27, 289–302. [Google Scholar] [CrossRef]
- Xiao, C.; Wang, Y.; Cheng, Q.; Fan, Y. Increased expression of MMP17 predicts poor clinical outcomes in epithelial ovarian cancer patients. Medicine 2022, 101, e30279. [Google Scholar] [CrossRef]
- Yip, C.; Foidart, P.; Somja, J.; Truong, A.; Lienard, M.; Feyereisen, E.; Schroeder, H.; Gofflot, S.; Donneau, A.F.; Collignon, J.; et al. MT4-MMP and EGFR expression levels are key biomarkers for breast cancer patient response to chemotherapy and erlotinib. Br. J. Cancer 2017, 116, 742–751. [Google Scholar] [CrossRef] [PubMed]
- Wang, F.; Dong, J.; Zhang, Y.; Yue, S.; Guo, H.; Liang, P.; Zhou, Y.; Wei, Y.; Zhai, W.; Gao, J. Identification of novel diagnostic and prognostic biomarkers for hepatocellular carcinoma. Oncol. Rep. 2020, 43, 87–98. [Google Scholar] [CrossRef]
- Misawa, K.; Kanazawa, T.; Imai, A.; Endo, S.; Mochizuki, D.; Fukushima, H.; Misawa, Y.; Mineta, H. Prognostic value of type XXII and XXIV collagen mRNA expression in head and neck cancer patients. Mol. Clin. Oncol. 2014, 2, 285–291. [Google Scholar] [CrossRef] [PubMed]
- Jamaluddin, M.F.B.; Nahar, P.; Tanwar, P.S. Proteomic Characterization of the Extracellular Matrix of Human Uterine Fibroids. Endocrinology 2018, 159, 2656–2669. [Google Scholar] [CrossRef]
- Takamiya, K.; Kostourou, V.; Adams, S.; Jadeja, S.; Chalepakis, G.; Scambler, P.J.; Huganir, R.L.; Adams, R.H. A direct functional link between the multi-PDZ domain protein GRIP1 and the Fraser syndrome protein Fras1. Nat. Genet. 2004, 36, 172–177. [Google Scholar] [CrossRef]
- Faralli, H.; Dilworth, F.J. Turning on myogenin in muscle: A paradigm for understanding mechanisms of tissue-specific gene expression. Comp. Funct. Genom. 2012, 2012, 836374. [Google Scholar] [CrossRef]
- Mayer, D.C.; Leinwand, L.A. Sarcomeric gene expression and contractility in myofibroblasts. J. Cell Biol. 1997, 139, 1477–1484. [Google Scholar] [CrossRef]
- Leng, C.; Overeem, A.W.; Cartón-Garcia, F.; Li, Q.; Klappe, K.; Kuipers, J.; Cui, Y.; Zuhorn, I.S.; Arango, D.; van Ijzendoorn, S.C.D. Loss of MYO5B expression deregulates late endosome size which hinders mitotic spindle orientation. PLoS Biol. 2019, 17, e3000531. [Google Scholar] [CrossRef] [PubMed]
- Roland, J.T.; Bryant, D.M.; Datta, A.; Itzen, A.; Mostov, K.E.; Goldenring, J.R. Rab GTPase-Myo5B complexes control membrane recycling and epithelial polarization. Proc. Natl. Acad. Sci. USA 2011, 108, 2789–2794. [Google Scholar] [CrossRef]
- Dong, W.; Chen, X.; Chen, P.; Yue, D.; Zhu, L.; Fan, Q. Inactivation of MYO5B promotes invasion and motility in gastric cancer cells. Dig. Dis. Sci. 2012, 57, 1247–1252. [Google Scholar] [CrossRef] [PubMed]
- Sakai, T.; Choo, Y.Y.; Sato, O.; Ikebe, R.; Jeffers, A.; Idell, S.; Tucker, T.; Ikebe, M. Myo5b Transports Fibronectin-Containing Vesicles and Facilitates FN1 Secretion from Human Pleural Mesothelial Cells. Int. J. Mol. Sci. 2022, 23, 4823. [Google Scholar] [CrossRef]
- Arici, A.; Sozen, I. Transforming growth factor-beta3 is expressed at high levels in leiomyoma where it stimulates fibronectin expression and cell proliferation. Fertil. Steril. 2000, 73, 1006–1011. [Google Scholar] [CrossRef]
- Chuang, T.D.; Rehan, A.; Khorram, O. Functional role of the long noncoding RNA X-inactive specific transcript in leiomyoma pathogenesis. Fertil. Steril. 2021, 115, 238–247. [Google Scholar] [CrossRef] [PubMed]
- Wu, Y.; Chen, J.; Tan, F.; Wang, B.; Xu, W.; Yuan, C. ITGA9: Potential Biomarkers and Therapeutic Targets in Different Tumors. Curr. Pharm. Des. 2022, 28, 1412–1418. [Google Scholar] [CrossRef] [PubMed]
- Li, R.X.; Yiu, W.H.; Tang, S.C. Role of bone morphogenetic protein-7 in renal fibrosis. Front. Physiol. 2015, 6, 114. [Google Scholar] [CrossRef]
- Zhong, L.; Wang, X.; Wang, S.; Yang, L.; Gao, H.; Yang, C. The anti-fibrotic effect of bone morphogenic protein-7(BMP-7) on liver fibrosis. Int. J. Med. Sci. 2013, 10, 441–450. [Google Scholar] [CrossRef]
- Gokce, A.; Yilmaz, I.; Bircan, R.; Tonbul, M.; Gokay, N.S.; Gokce, C. Synergistic Effect of TGF-β1 And BMP-7 on Chondrogenesis and Extracellular Matrix Synthesis: An In Vitro Study. Open Orthop. J. 2012, 6, 406–413. [Google Scholar] [CrossRef] [PubMed]
- Stumm, C.L.; Halcsik, E.; Landgraf, R.G.; Camara, N.O.; Sogayar, M.C.; Jancar, S. Lung remodeling in a mouse model of asthma involves a balance between TGF-β1 and BMP-7. PLoS ONE 2014, 9, e95959. [Google Scholar] [CrossRef] [PubMed]
- Aluganti Narasimhulu, C.; Singla, D.K. The Role of Bone Morphogenetic Protein 7 (BMP-7) in Inflammation in Heart Diseases. Cells 2020, 9, 280. [Google Scholar] [CrossRef]
- Yang, Q.; Ciebiera, M.; Victoria Bariani, M.; Ali, M.; Elkafas, H.; Boyer, T.G.; Al-Hendy, A. Comprehensive Review of Uterine Fibroids: Developmental Origin, Pathogenesis, and Treatment. Endocr. Rev. 2021, 43, 678–719. [Google Scholar] [CrossRef]
- Saitoh, T.; Moriwaki, J.; Koike, J.; Takagi, A.; Miwa, T.; Shiokawa, K.; Katoh, M. Molecular cloning and characterization of FRAT2, encoding a positive regulator of the WNT signaling pathway. Biochem. Biophys. Res. Commun. 2001, 281, 815–820. [Google Scholar] [CrossRef]
- Zhou, Y.; Li, C.; Peng, J.; Luo, P.; Xie, C.; Liu, S.; Chen, G.; Li, T. WNT signaling pathway regulator-FRAT2 affects oncogenesis and prognosis of basal-like breast cancer. J. Thorac. Dis. 2020, 12, 3478–3487. [Google Scholar] [CrossRef]
- Rafique, S.; Segars, J.H.; Leppert, P.C. Mechanical Signaling and Extracellular Matrix in Uterine Fibroids. Semin. Reprod. Med. 2017, 35, 487–493. [Google Scholar] [CrossRef]
- Jorge, S.; Chang, S.; Barzilai, J.J.; Leppert, P.; Segars, J.H. Mechanical signaling in reproductive tissues: Mechanisms and importance. Reprod. Sci. 2014, 21, 1093–1107. [Google Scholar] [CrossRef] [PubMed]
- Hodge, R.G.; Ridley, A.J. Regulating Rho GTPases and their regulators. Nat. Rev. Mol. Cell Biol. 2016, 17, 496–510. [Google Scholar] [CrossRef] [PubMed]
- Yang, Q.; Nair, S.; Laknaur, A.; Ismail, N.; Diamond, M.P.; Al-Hendy, A. The Polycomb Group Protein EZH2 Impairs DNA Damage Repair Gene Expression in Human Uterine Fibroids. Biol. Reprod. 2016, 94, 69. [Google Scholar] [CrossRef] [PubMed]
- Chuang, T.D.; Khorram, O. Tranilast Inhibits Genes Functionally Involved in Cell Proliferation, Fibrosis, and Epigenetic Regulation and Epigenetically Induces miR-29c Expression in Leiomyoma Cells. Reprod. Sci. 2017, 24, 1253–1263. [Google Scholar] [CrossRef]
- Kim, J.J.; Sefton, E.C.; Bulun, S.E. Progesterone receptor action in leiomyoma and endometrial cancer. Prog. Mol. Biol. Transl. Sci. 2009, 87, 53–85. [Google Scholar]
- Brandon, D.D.; Bethea, C.L.; Strawn, E.Y.; Novy, M.J.; Burry, K.A.; Harrington, M.S.; Erickson, T.E.; Warner, C.; Keenan, E.J.; Clinton, G.M. Progesterone receptor messenger ribonucleic acid and protein are overexpressed in human uterine leiomyomas. Am. J. Obstet. Gynecol. 1993, 169, 78–85. [Google Scholar] [CrossRef] [PubMed]
- Englund, K.; Blanck, A.; Gustavsson, I.; Lundkvist, U.; Sjöblom, P.; Norgren, A.; Lindblom, B. Sex steroid receptors in human myometrium and fibroids: Changes during the menstrual cycle and gonadotropin-releasing hormone treatment. J. Clin. Endocrinol. Metab. 1998, 83, 4092–4096. [Google Scholar] [CrossRef]
- Wei, J.J.; Chiriboga, L.; Arslan, A.A.; Melamed, J.; Yee, H.; Mittal, K. Ethnic differences in expression of the dysregulated proteins in uterine leiomyomata. Hum. Reprod. 2006, 21, 57–67. [Google Scholar] [CrossRef]
- Mäkinen, N.; Heinonen, H.R.; Moore, S.; Tomlinson, I.P.; van der Spuy, Z.M.; Aaltonen, L.A. MED12 exon 2 mutations are common in uterine leiomyomas from South African patients. Oncotarget 2011, 2, 966–969. [Google Scholar] [CrossRef] [PubMed]
- McGuire, M.M.; Yatsenko, A.; Hoffner, L.; Jones, M.; Surti, U.; Rajkovic, A. Whole exome sequencing in a random sample of North American women with leiomyomas identifies MED12 mutations in majority of uterine leiomyomas. PLoS ONE 2012, 7, e33251. [Google Scholar] [CrossRef]
- Halder, S.K.; Laknaur, A.; Miller, J.; Layman, L.C.; Diamond, M.; Al-Hendy, A. Novel MED12 gene somatic mutations in women from the Southern United States with symptomatic uterine fibroids. Mol. Genet. Genom. 2015, 290, 505–511. [Google Scholar] [CrossRef]
- Park, M.J.; Shen, H.; Kim, N.H.; Gao, F.; Failor, C.; Knudtson, J.F.; McLaughlin, J.; Halder, S.K.; Heikkinen, T.A.; Vahteristo, P.; et al. Mediator Kinase Disruption in MED12-Mutant Uterine Fibroids From Hispanic Women of South Texas. J. Clin. Endocrinol. Metab. 2018, 103, 4283–4292. [Google Scholar] [CrossRef]
- Chuang, T.D.; Khorram, O. Expression Profiling of lncRNAs, miRNAs, and mRNAs and Their Differential Expression in Leiomyoma Using Next-Generation RNA Sequencing. Reprod. Sci. 2018, 25, 246–255. [Google Scholar] [CrossRef] [PubMed]
- Chuang, T.D.; Xie, Y.; Yan, W.; Khorram, O. Next-generation sequencing reveals differentially expressed small noncoding RNAs in uterine leiomyoma. Fertil. Steril. 2018, 109, 919–929. [Google Scholar] [CrossRef] [PubMed]
- Chuang, T.D.; Munoz, L.; Quintanilla, D.; Boos, D.; Khorram, O. Therapeutic Effects of Long-Term Administration of Tranilast in an Animal Model for the Treatment of Fibroids. Int. J. Mol. Sci. 2023, 24, 10465. [Google Scholar] [CrossRef] [PubMed]
- de Sena Brandine, G.; Smith, A.D. Falco: High-speed FastQC emulation for quality control of sequencing data. F1000Research 2019, 8, 1874. [Google Scholar] [CrossRef]
- Kim, D.; Langmead, B.; Salzberg, S.L. HISAT: A fast spliced aligner with low memory requirements. Nat. Methods 2015, 12, 357–360. [Google Scholar] [CrossRef] [PubMed]
- Liao, Y.; Smyth, G.K.; Shi, W. The Subread aligner: Fast, accurate and scalable read mapping by seed-and-vote. Nucleic Acids Res. 2013, 41, e108. [Google Scholar] [CrossRef]
- Ewels, P.; Magnusson, M.; Lundin, S.; Käller, M. MultiQC: Summarize analysis results for multiple tools and samples in a single report. Bioinformatics 2016, 32, 3047–3048. [Google Scholar] [CrossRef]
- Delhomme, N.; Padioleau, I.; Furlong, E.E.; Steinmetz, L.M. easyRNASeq: A bioconductor package for processing RNA-Seq data. Bioinformatics 2012, 28, 2532–2533. [Google Scholar] [CrossRef]
- Iqbal, A.; Duitama, C.; Metge, F.; Rosskopp, D.; Boucas, J. Flaski, Flaski 3.12.2; Zenodo: Geneva, Switzerland, 2021. [Google Scholar]
- Szklarczyk, D.; Franceschini, A.; Wyder, S.; Forslund, K.; Heller, D.; Huerta-Cepas, J.; Simonovic, M.; Roth, A.; Santos, A.; Tsafou, K.P.; et al. STRING v10: Protein-protein interaction networks, integrated over the tree of life. Nucleic Acids Res. 2015, 43, D447–D452. [Google Scholar] [CrossRef] [PubMed]
- Almeida, T.A.; Quispe-Ricalde, A.; Montes de Oca, F.; Foronda, P.; Hernandez, M.M. A high-throughput open-array qPCR gene panel to identify housekeeping genes suitable for myometrium and leiomyoma expression analysis. Gynecol. Oncol. 2014, 134, 138–143. [Google Scholar] [CrossRef] [PubMed]
- Chuang, T.D.; Quintanilla, D.; Boos, D.; Khorram, O. Long Noncoding RNA MIAT Modulates the Extracellular Matrix Deposition in Leiomyomas by Sponging MiR-29 Family. Endocrinology 2021, 162, bqab186. [Google Scholar] [CrossRef] [PubMed]


| ENSEMBL_GENE_ID | Genes | log2 (FoldChange) | padj |
|---|---|---|---|
| ENSG00000129048 | ACKR4 | −0.98571759418595 | 0.016261611 |
| ENSG00000162618 | ADGRL4 | −0.730451745246549 | 0.021985159 |
| ENSG00000182551 | ADI1 | −0.473711465167378 | 0.0481993 |
| ENSG00000157510 | AFAP1L1 | −0.904978358197408 | 0.01851514 |
| ENSG00000174574 | AKIRIN1 | −0.590414814282603 | 0.003694255 |
| ENSG00000157999 | ANKRD61 | 0.691198791 | 0.034099101 |
| ENSG00000182718 | ANXA2 | −0.618428859469741 | 0.019572457 |
| ENSG00000137962 | ARHGAP29 | −0.718256380610321 | 0.042451786 |
| ENSG00000162650 | ATXN7L2 | 0.678347659 | 0.042636838 |
| ENSG00000176788 | BASP1 | 1.07947171 | 0.006518371 |
| ENSG00000132016 | BRME1 | 0.661505175 | 0.020851774 |
| ENSG00000113600 | C9 | −0.703595240369084 | 0.026897711 |
| ENSG00000143933 | CALM2 | −0.489335184417676 | 0.008440807 |
| ENSG00000105971 | CAV2 | −0.851491859685069 | 0.038728692 |
| ENSG00000236383 | CCDC200 | 0.605100694 | 0.012214075 |
| ENSG00000108091 | CCDC6 | −0.72039613537964 | 0.04919997 |
| ENSG00000144354 | CDCA7 | 3.131437732 | 0.005090236 |
| ENSG00000143126 | CELSR2 | 1.420142912 | 0.044457001 |
| ENSG00000159259 | CHAF1B | 0.78736468 | 0.022420806 |
| ENSG00000016391 | CHDH | 1.855973134 | 0.004550716 |
| ENSG00000180720 | CHRM4 | 1.601579406 | 0.025196859 |
| ENSG00000169169 | CPT1C | 0.909847927 | 0.023118876 |
| ENSG00000153071 | DAB2 | −0.704920969888342 | 0.026402222 |
| ENSG00000162733 | DDR2 | −0.554606158437811 | 0.009311408 |
| ENSG00000088881 | EBF4 | 0.703879433 | 0.003016076 |
| ENSG00000167280 | ENGASE | 0.59590162 | 0.029004618 |
| ENSG00000163378 | EOGT | −0.883114504762434 | 0.012720403 |
| ENSG00000205707 | ETFRF1 | −0.408436567922212 | 0.032513346 |
| ENSG00000231527 | FAM27C | 0.797595443 | 0.013815831 |
| ENSG00000285321 | FITM1 | 1.249462295 | 0.042681194 |
| ENSG00000162769 | FLVCR1 | 0.594590046 | 0.006516276 |
| ENSG00000117228 | GBP1 | −0.580760531241074 | 0.005806013 |
| ENSG00000117226 | GBP3 | −0.639124945111892 | 0.046454847 |
| ENSG00000100116 | GCAT | 0.682650655 | 0.031571242 |
| ENSG00000172380 | GNG12 | −0.473486408045602 | 0.025014425 |
| ENSG00000155974 | GRIP1 | 1.084594681 | 0.019454493 |
| ENSG00000170689 | HOXB9 | −1.60364025325228 | 0.016884729 |
| ENSG00000237693 | IRGM | 0.684838416 | 0.008265492 |
| ENSG00000005884 | ITGA3 | −0.785456415144709 | 0.024192267 |
| ENSG00000198954 | KIFBP | −0.404000966500028 | 0.041977871 |
| ENSG00000187416 | LHFPL3 | 0.900676029 | 0.023206141 |
| ENSG00000116688 | MFN2 | −0.437884181348915 | 0.036758025 |
| ENSG00000198598 | MMP17 | 1.282282893 | 0.00061147 |
| ENSG00000066382 | MPPED2 | 1.950018885 | 0.045996611 |
| ENSG00000128309 | MPST | 0.783557462 | 0.024797843 |
| ENSG00000182534 | MXRA7 | −0.455181924885382 | 0.030824687 |
| ENSG00000167306 | MYO5B | 0.856051914 | 0.041759626 |
| ENSG00000160602 | NEK8 | 0.627987206 | 0.047865902 |
| ENSG00000235396 | NOTCH4 | −0.484552663548917 | 0.041998944 |
| ENSG00000154358 | OBSCN | 0.656724611 | 0.035896745 |
| ENSG00000141447 | OSBPL1A | 0.693232152 | 0.011515721 |
| ENSG00000081087 | OSTM1 | −0.550742788524356 | 0.020084338 |
| ENSG00000115257 | PCSK4 | 1.30636991 | 0.04361426 |
| ENSG00000290904 | PDE4DIPP4 | 0.822554506 | 0.026796414 |
| ENSG00000163110 | PDLIM5 | −0.616541920543817 | 0.02817133 |
| ENSG00000179598 | PLD6 | 0.763237458 | 0.008882134 |
| ENSG00000052126 | PLEKHA5 | 0.625224515 | 0.011933448 |
| ENSG00000276438 | PPP2R3B | 0.68893296 | 0.040025832 |
| ENSG00000133246 | PRAM1 | 0.84169506 | 0.040427487 |
| ENSG00000130032 | PRRG3 | 1.418129302 | 0.033504092 |
| ENSG00000067560 | RHOA | −0.414796410616333 | 0.0240862 |
| ENSG00000178966 | RMI1 | 0.828504136 | 0.001401385 |
| ENSG00000145860 | RNF145 | −0.398685120823013 | 0.013611116 |
| ENSG00000168528 | SERINC2 | 1.25222147 | 0.02318918 |
| ENSG00000118515 | SGK1 | −1.1217221618793 | 0.037292795 |
| ENSG00000164707 | SLC13A4 | 0.625492215 | 0.015016236 |
| ENSG00000139540 | SLC39A5 | 0.889453589 | 0.048991739 |
| ENSG00000137968 | SLC44A5 | 1.174040295 | 0.010752015 |
| ENSG00000084070 | SMAP2 | −0.471202785875124 | 0.029158884 |
| ENSG00000149634 | SPATA25 | 0.844104476 | 0.027233962 |
| ENSG00000173898 | SPTBN2 | 0.857422484 | 0.005325753 |
| ENSG00000177679 | SRRM3 | 0.956168836 | 0.036233089 |
| ENSG00000135090 | TAOK3 | 0.722318639 | 0.020904922 |
| ENSG00000118707 | TGIF2 | 0.684452361 | 0.027880253 |
| ENSG00000196781 | TLE1 | 0.604094935 | 0.006045956 |
| ENSG00000239732 | TLR9 | 0.994924051 | 0.010095372 |
| ENSG00000184986 | TMEM121 | 1.255528818 | 0.012071561 |
| ENSG00000144120 | TMEM177 | 0.649576577 | 0.025741594 |
| ENSG00000239697 | TNFSF12 | −0.504945190909519 | 0.042070126 |
| ENSG00000248871 | TNFSF12-TNFSF13 | −0.524933065913806 | 0.032530573 |
| ENSG00000137364 | TPMT | −0.599933728185664 | 0.036726324 |
| ENSG00000100505 | TRIM9 | 1.963547604 | 0.021114898 |
| ENSG00000176014 | TUBB6 | −0.583604412902083 | 0.04341609 |
| ENSG00000137831 | UACA | −0.459808559154032 | 0.041008333 |
| ENSG00000152484 | USP12 | −0.667776945538996 | 0.036226476 |
| ENSG00000112290 | WASF1 | 0.661083104 | 0.014216308 |
| ENSG00000187260 | WDR86 | 0.782512036 | 0.016809294 |
| ENSG00000127578 | WFIKKN1 | 0.822204726 | 0.022154194 |
| ENSG00000126562 | WNK4 | 1.21048519 | 0.012389336 |
| ENSG00000159733 | ZFYVE28 | 0.649531661 | 0.045798091 |
| ENSG00000256771 | ZNF253 | 0.891216558 | 0.008172245 |
| ENSG00000196705 | ZNF431 | 0.592983837 | 0.020198178 |
| ENSG00000196268 | ZNF493 | 0.687387776 | 0.01036717 |
| ENSG00000183779 | ZNF703 | 1.320402356 | 0.007772286 |
| ENSG00000257446 | ZNF878 | 1.055383649 | 0.001750249 |
| GO/KEGG Pathway Enrichment | Symbol | Lyo vs. Myo | Black(Lyo/Myo) vs. White(Lyo/Myo) | Black(Lyo) vs. White(Lyo) | Black(Myo) vs. White(Myo) | MED12-Mut(Lyo/Myo) vs. MED12-WT(Lyo/Myo) | Function |
|---|---|---|---|---|---|---|---|
| Signal Transduction | FRAT2 | Up (p < 0.001) | Up (p < 0.05) | No Significance | No Significance | Up (p < 0.05) | Positive WNT signaling pathway regulator; promotes the abnormal β-catenin accumulation through sequestering GSK-3β protein, by which carcinogenesis is promoted [31]. |
| Signal Transduction | SOX4 | Up (p < 0.001) | Up (p < 0.05) | No Significance | No Significance | No Significance | DNA-binding transcription factor; related to the apoptosis pathway and WNT and ERK signaling pathways, as well as tumorigenesis and involved in the regulation of bone and embryonic development and cell fate determination [32]. |
| Signal Transduction | TNFRSF19 | Up (p < 0.001) | Up (p < 0.05) | No Significance | No Significance | Up (p < 0.05) | Member of the TNF-receptor superfamily; essential in embryonic development, and involved in regulation of JNK, WNT/β-catenin and TGF-β signaling pathway, and apoptosis in a caspase-independent mechanism [33,34]. |
| Signal Transduction | ACP7 | Up (p < 0.001) | Up (p < 0.05) | No Significance | Down (p < 0.01) | Up (p < 0.01) | Member of purple acid phosphatases family, plays a critical role in the prognosis of glioblastoma [35,36]. |
| Signal Transduction | GRIP1 | Up (p < 0.001) | Up (p < 0.01) | No Significance | Down (p < 0.01) | No Significance | Member of the glutamate receptor interacting protein family, assembles multiprotein signaling complex and mediates the membrane organization through trafficking of its binding partners to specific location [37]. |
| Signal Transduction | IRS4 | Up (p < 0.001) | Up (p < 0.05) | Up (p < 0.01) | No Significance | Up (p < 0.01) | Contains many potential tyrosine and serine/threonine phosphorylation sites and has been shown to contribute to tumor initiation and progression through mediating a complex network of cytoplasmic signaling upon receptor stimulation [38]. |
| Signal Transduction | PLEKHG4B | Up (p < 0.001) | Up (p < 0.01) | Up (p < 0.05) | No Significance | Up (p < 0.001) | Member of Rho-guanine nucleotide exchange factor, which contains a pleckstrin homology domain and plays an essential role in activation of Cdc42 [39]. |
| Signal Transduction | PGR | Up (p < 0.001) | Up (p < 0.05) | Up (p < 0.05) | No Significance | No Significance | PGR includes two isoforms (A and B), which plays a central role in the physiological effects of progesterone acting as transcriptional activator or repressor [40]. |
| Extracellular matrix organization | COL24A1 | Up (p < 0.001) | Up (p < 0.05) | No Significance | No Significance | No Significance | Member of collagen gene family; participates in regulation of type I collagen fibrillogenesis during fetal development at specific anatomical locations [41]. |
| Extracellular matrix organization | KRT17 | Up (p < 0.001) | Up (p < 0.001) | Up (p < 0.05) | Down (p < 0.05) | Up (p < 0.05) | A multifunctional protein that plays an important role in the formation and maintenance of cellular structural support; regulates a variety of biological processes such as cell proliferation, apoptosis, migration, and signal transduction [42]. |
| Extracellular matrix organization | MMP17 | Up (p < 0.001) | Up (p < 0.05) | No Significance | No Significance | No Significance | Involved in the breakdown of various components of extracellular matrix and precursors of transmembrane inflammatory mediators or growth factors; overexpressed in multiple cancers and aasociated with tumor progression [43]. |
| Ion homeostasis | SLN | Up (p < 0.01) | Up (p < 0.05) | No Significance | Down (p < 0.05) | No Significance | Is one of the sarcoplasmic reticulum Ca(2+)-ATPases; plays an essential role in calcium homeostasis through modulation of calcium re-uptake in muscle cells [44]. |
| Metabolism of proteins | CCDC177 | Up (p < 0.001) | Up (p < 0.05) | Up (p < 0.05) | No Significance | No Significance | Associated with myopathy, fiber-type disproportion, and Pontiac fever. Has a significant prognostic value in prediction of overall survival in lung squamous cell carcinoma patients [45]. |
| Metabolism of proteins | FUT2 | Up (p < 0.001) | Up (p < 0.05) | No Significance | No Significance | No Significance | is a galactoside 2-L-fucosyltransferase enzyme; overexpressed and involved in regulation of proliferation and metastasis of colorectal cancer through activation of Wnt/β-catenin pathway [46]. |
| Metabolism of proteins | MYO5B | Up (p < 0.01) | Up (p < 0.01) | No Significance | Down (p < 0.05) | No Significance | MYO5B is involved in plasma membrane recycling and vesicular trafficking. It has been associated with bipolar disorder, and its mutation caused microvillous inclusion disease because of deficient trafficking of basolateral and apical proteins [47]. |
| Transcription regulation | MYOG | Up (p < 0.001) | Up (p < 0.05) | No Significance | Down (p < 0.05) | No Significance | Is a muscle-specific transcriptional activator that promotes myogenesis, muscle differentiation, and involved in preventing reversal of muscle cell differentiation. It induces fibroblasts to differentiate into myoblasts and is essential for the development of functional embryonic skeletal muscle [48]. |
| Transcription regulation | ZNF703 | Up (p < 0.001) | Up (p < 0.01) | Up (p < 0.05) | No Significance | Up (p < 0.05) | Identified as an oncogene and involved in regulation of cell adhesion, migration, proliferation, and gene transcription through recruitment of histone deacetylases [49]. |
| Regulation of cell proliferation | CDC25A | Up (p < 0.001) | Up (p < 0.05) | No Significance | No Significance | No Significance | Member of the tyrosine protein phosphatase; regulates cell cycle progression from G1 to the S phase by targeting cyclin-dependent kinase CDC2, CDK1 and CDK2. CDC25A is considered as an oncogene through its involvement in RAS, E2F family and p53-p21-Cdk axis mediated carcinogenesis [50]. |
| Regulation of cell proliferation | DAB2 | Down (p < 0.001) | Down (p < 0.05) | No Significance | No Significance | No Significance | A mitogen-responsive phosphoprotein; is a key regulator of anti- or pro-tumorigenic pathways [51]. |
| Regulation of cell proliferation | CAV2 | Down (p < 0.001) | Down (p < 0.05) | No Significance | No Significance | Down (p < 0.05) | A scaffolding protein within caveolar membranes; involved in insulin-stimulated nuclear translocation and essential cellular functions such as cellular growth control, lipid metabolism, and signal transduction including MAPK, STAT3, EGFR and G protein α-associated signaling pathway [52]. |
| Regulation of cell proliferation | CDCA7 | Up (p < 0.01) | Up (p < 0.05) | No Significance | Down (p < 0.05) | No Significance | Is a validated c-Myc responsive gene and involved in c-MYC-mediated cell transformation, tumorigenesis, and anchorage-independent growth and clonogenicity of lymphoblastoid cells [53]. |
Disclaimer/Publisher’s Note: The statements, opinions and data contained in all publications are solely those of the individual author(s) and contributor(s) and not of MDPI and/or the editor(s). MDPI and/or the editor(s) disclaim responsibility for any injury to people or property resulting from any ideas, methods, instructions or products referred to in the content. |
© 2023 by the authors. Licensee MDPI, Basel, Switzerland. This article is an open access article distributed under the terms and conditions of the Creative Commons Attribution (CC BY) license (https://creativecommons.org/licenses/by/4.0/).
Share and Cite
Chuang, T.-D.; Ton, N.; Rysling, S.; Quintanilla, D.; Boos, D.; Gao, J.; McSwiggin, H.; Yan, W.; Khorram, O. The Influence of Race/Ethnicity on the Transcriptomic Landscape of Uterine Fibroids. Int. J. Mol. Sci. 2023, 24, 13441. https://doi.org/10.3390/ijms241713441
Chuang T-D, Ton N, Rysling S, Quintanilla D, Boos D, Gao J, McSwiggin H, Yan W, Khorram O. The Influence of Race/Ethnicity on the Transcriptomic Landscape of Uterine Fibroids. International Journal of Molecular Sciences. 2023; 24(17):13441. https://doi.org/10.3390/ijms241713441
Chicago/Turabian StyleChuang, Tsai-Der, Nhu Ton, Shawn Rysling, Derek Quintanilla, Drake Boos, Jianjun Gao, Hayden McSwiggin, Wei Yan, and Omid Khorram. 2023. "The Influence of Race/Ethnicity on the Transcriptomic Landscape of Uterine Fibroids" International Journal of Molecular Sciences 24, no. 17: 13441. https://doi.org/10.3390/ijms241713441