Article

Genome-Wide Identification and Expression Analysis of the Sucrose Synthase Gene Family in Sweet Potato and Its Two Diploid Relatives

Key Laboratory of Sweetpotato Biology and Biotechnology, Ministry of Agriculture and Rural Affairs/Beijing Key Laboratory of Crop Genetic Improvement/Laboratory of Crop Heterosis and Utilization, Ministry of Education, College of Agronomy & Biotechnology, China Agricultural University, Beijing 100193, China
*
Author to whom correspondence should be addressed.
Int. J. Mol. Sci. 2023, 24(15), 12493; https://doi.org/10.3390/ijms241512493
Submission received: 27 June 2023 / Revised: 3 August 2023 / Accepted: 4 August 2023 / Published: 6 August 2023
(This article belongs to the Special Issue Molecular Genetics and Breeding Mechanisms in Crops 2.0)

Abstract

:
Sucrose synthases (SUS; EC 2.4.1.13) encoded by a small multigene family are the central system of sucrose metabolism and have important implications for carbon allocation and energy conservation in nonphotosynthetic cells of plants. Though the SUS family genes (SUSs) have been identified in several plants, they have not been explored in sweet potato. In this research, nine, seven and seven SUSs were identified in the cultivated sweet potato (Ipomoea batatas, 2n = 6x = 90) as well as its two diploid wild relatives I. trifida (2n = 2x = 30) and I. triloba (2n = 2x = 30), respectively, and divided into three subgroups according to their phylogenetic relationships. Their protein physicochemical properties, chromosomal localization, phylogenetic relationship, gene structure, promoter cis-elements, protein interaction network and expression patterns were systematically analyzed. The results indicated that the SUS gene family underwent segmental and tandem duplications during its evolution. The SUSs were highly expressed in sink organs. The IbSUSs especially IbSUS2, IbSUS5 and IbSUS7 might play vital roles in storage root development and starch biosynthesis. The SUSs could also respond to drought and salt stress responses and take part in hormone crosstalk. This work provides new insights for further understanding the functions of SUSs and candidate genes for improving yield, starch content, and abiotic stress tolerance in sweet potatoes.

1. Introduction

Sucrose is mainly synthesized in leaves and green parts of plants and then transported to sink tissues where it serves as a carbon source of energy for various metabolic pathways [1,2,3,4,5]. Sucrose synthase (SUS; EC 2.4.1.13), which reversibly catalyzes the conversion of sucrose to fructose and UDP-glucose, is considered as the key enzyme involved in the sugar metabolism of plants [2]. As a result, sucrose biosynthesis is essential for the growth and development of plants [2,6,7]. SUS proteins (SUSs) are usually homotetramers composed of subunits with a molecular mass of about 90 kDa and belong to the glycosyltransferase-4 subfamily of glycosyltransferases [4,8,9]. SUSs are encoded by a small multigene family [10]. The SUS family genes (SUSs) have been identified in several plants. For example, six, three, and six SUSs were identified in Arabidopsis [11], maize [12], and rice [13], respectively. The genomes of Gossypium arboreum, G. raimondii and G. hirsutum contained eight, eight, and 15 SUSs, respectively [14]. Fifteen SUSs were identified in poplar [15].
There are currently several reports on the functions of SUSs in plants. Potato Sus3 gene was highly expressed in stems and roots, which showed the vascular function of SUS, and the Sus4 gene was expressed primarily in the storage and vascular tissues of tubers, which facilitated the sink function of SUS [16]. Biemelt et al. [17] suggest that during hypoxia SUS might function in channeling excess carbohydrates into cell wall polymers for later consumption in potatoes. The two maize isozymes of SUS were found to be critical in endosperm development, SS1 for cell wall integrity and SS2 for starch biosynthesis [18]. The study of Ricard et al. [19] proved the critical role of SUS for anoxic tolerance of maize roots. The endosperm-specific transcription factor Opaque2 (O2) transactivated Sus1 and Sus2 and regulated starch biosynthesis during endosperm filling in maize [20]. In Arabidopsis, SUS possibly had a role in carbon partitioning during the early to middle stages of seed development, and at later stages, it might play roles within the embryo, cotyledon, and aleurone layer [21]. The results of Baroja-Fernándeza et al. [22] indicated that SUS was involved in the cellulose and starch biosynthesis of Arabidopsis. AtSUS3 in Arabidopsis regulated starch accumulation in guard cells [23]. Overexpression of a potato SUS gene in cotton elevated SUS activity, improved early seed development, increased seed set, and promoted fiber elongation [24]. In cotton, GhSUS2 positively regulated fiber development, but its phosphorylation by GhCPK84 and GhCPK93 inhibited fiber elongation [25]. Thermo-responsive Sus3 gene was involved in high-temperature tolerance during the ripening stage in rice [26]. Overexpression of the bamboo BeSUS5 gene in poplar improved cellulose content, cell wall thickness, and fiber quality [27].
Sweet potato (Ipomoea batatas (L.) Lam., 2n = B1B1B2B2B2B2 = 6x = 90) is an autohexaploid crop that belongs to the family Convolvulaceae, Genus Ipomoea, and Section Batatas. It is an economically important starchy root crop worldwide used as food, industrial materials, and bioenergy resource [28,29,30]. As the main component of sweet potato, starch accounts for 50–80% of its dry matter content [31]. As an important part of carbon metabolism, it is necessary to investigate the biological functions and regulatory mechanisms of SUSs in sweet potato. Recently, as the release of genome assemblies of cultivated sweet potato [32] and its two diploid wild relatives Ipomoea trifida and I. triloba [33], it is possible to identify and analyze the SUS gene family at the whole genome level in sweet potato. According to Zhang et al. [34], nine SUSs existed in the genome of sweet potato and the expression level of IbSus6 was higher in the storage roots of Kokei 14 than in those of its mutant. However, the characteristics, functions and regulatory mechanisms of SUSs remain unclear in sweet potato.
In the present study, SUSs were identified from sweet potato (I. batatas), I. trifida, and I. triloba, and then their protein physicochemical properties, chromosomal localization, phylogenetic relationships, gene structure, promoter cis-elements and protein interaction network were systematically analyzed. Their tissue specificity and expression pattern analyses for storage root development, starch biosynthesis and abiotic stress and hormone responses were carried out using qRT-PCR or RNA-seq. The aim of this study was to provide new insights for further understanding the functions of SUSs and candidate genes for improving yield, starch content, and abiotic stress tolerance in sweet potatoes.

2. Results

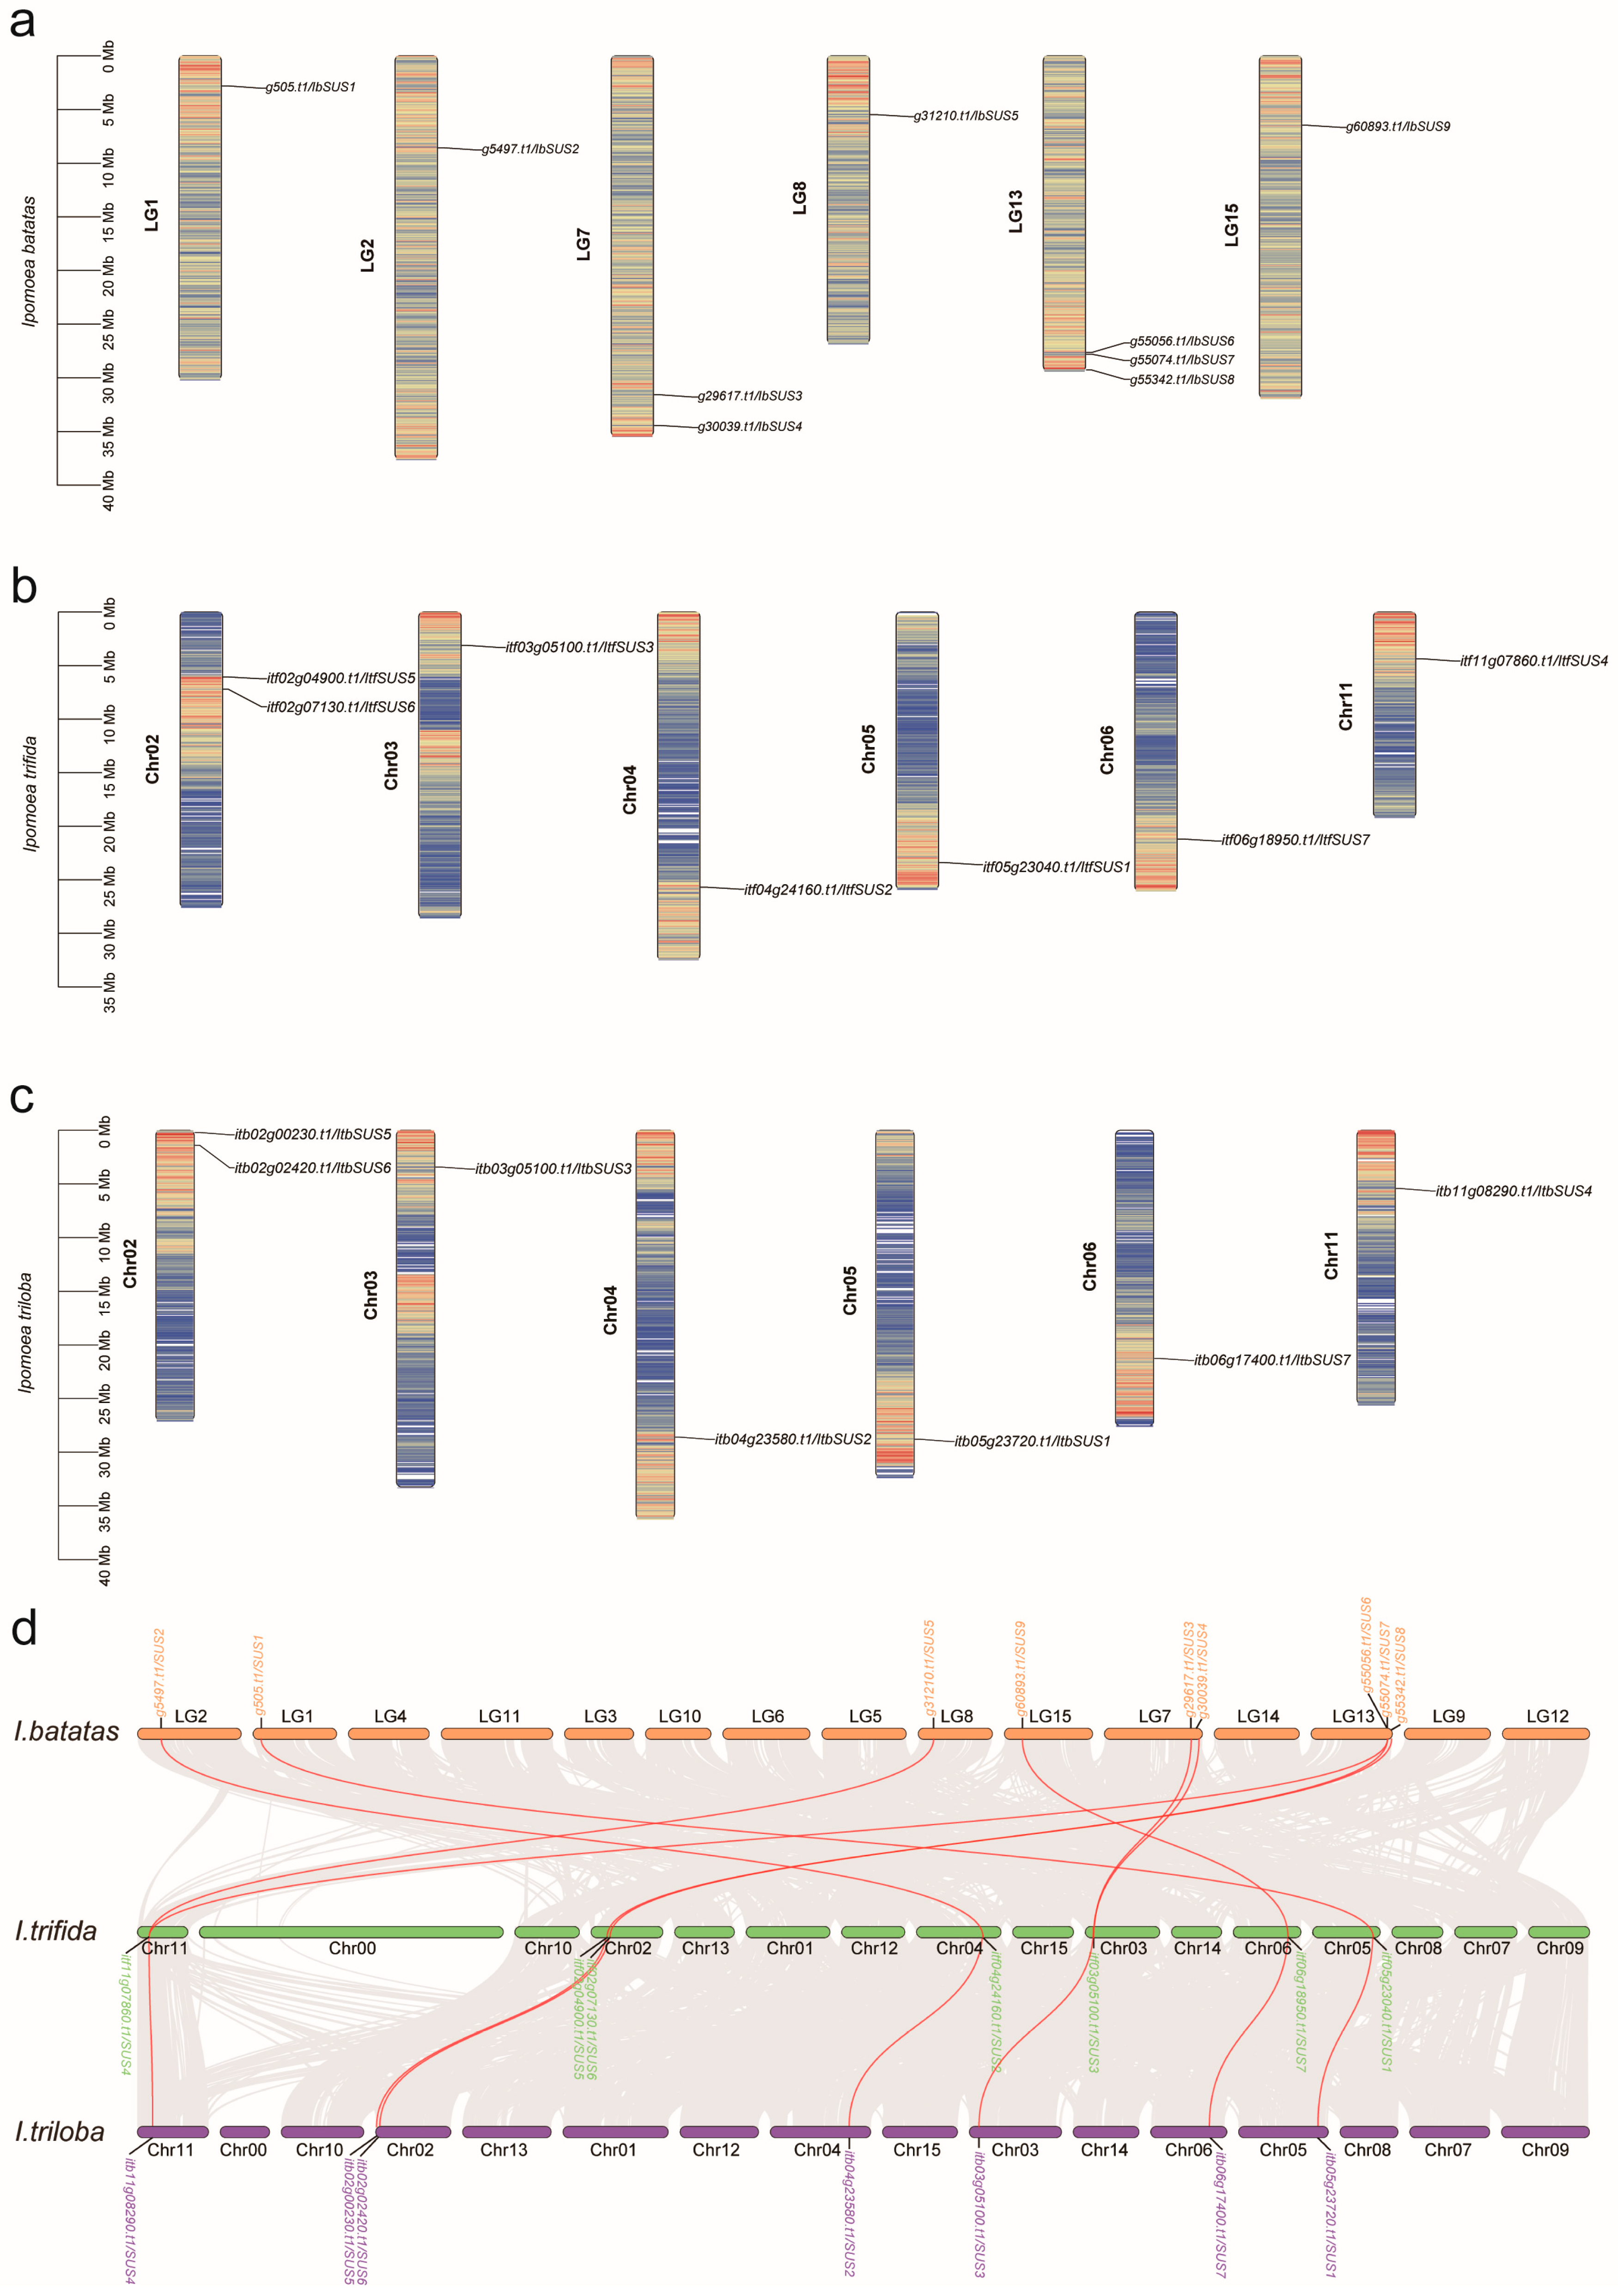
2.1. Identification of SUSs in Sweet Potato and Its Two Diploid Wild Relatives

In order to completely identify SUSs in genomes of cultivated sweet potato and its two diploid wild relatives I. trifida and I. triloba, three typical strategies (i.e., blastp search, hmmer search, and the CD-search database) were used. Nine, seven, and seven SUSs were separately identified in I. batatas, I. trifida and I. triloba, which were named “IbSUS”, “ItfSUS”, and “ItbSUS”, respectively. Their basic characteristics were analyzed using the sequences from I. batatas, I. trifida and I. triloba (Table 1). The CDS length of IbSUSs ranged from 2232 bp to 2721 bp and the genomic length varied from 4091 bp to 6116 bp. The length of putative proteins ranged from 743 aa to 906 aa, with a molecular weight (MW) of 84.78 kDa to 101.58 kDa and a theoretical isoelectric point (pI) of 6.02 to 6.99. Most of IbSUSs were stable with an instability index of less than 40 except for IbSUS1 which obtained an instability index of 40.26. The grand average of hydropathicity (GRAVY) values of IbSUSs varied from −0.351 to −0.202, indicating that they are hydrophilic proteins. Subcellular localization prediction showed that IbSUS1, IbSUS3, IbSUS4, and IbSUS9 were located in the cytoplasm, IbSUS2 and IbSUS8 in chloroplasts, IbSUS6 and IbSUS7 in mitochondria, and IbSUS5 in plastids (Table 1).
In I. trfida, the CDS length ranged from 2418 bp to 2679 bp, and the genomic length varied from 4194 bp to 6346 bp. The length of putative proteins ranged from 805 aa to 892 aa, with MW of 92.21 kDa to 99.89 kDa and pI of 5.93 to 6.40. All ItfSUSs were stable with an instability index of less than 40. GRAVY values varied from −0.336 to −0.248, indicating that they are hydrophilic proteins. Most of the ItfSUSs were located in the cytoplasm except ItfSUS2 and ItfSUS5 located in chloroplasts (Table 1). In I. triloba, the CDS length ranged from 2418 bp to 2664 bp and the genomic length varied from 4028 bp to 6636 bp. The length of putative proteins ranged from 805 aa to 887 aa, with MW of 92.09 kDa to 99.29 kDa and pI of 5.93 to 6.51. All ItfSUSs were stable with an instability index of less than 40. GRAVY values were less than 0, which are hydrophilic. ItbSUS1, ItbSUS4, ItbSUS6, and ItbSUS7 were located in the cytoplasm and ItbSUS2, ItbSUS3 and ItbSUS5 located in chloroplasts (Table 1).
Chromosomal localization showed that all of the SUSs from I. batatas, I. triloba, and I. trifida were distributed across six chromosomes (Figure 1). In I. batatas, three IbSUSs were detected on LG13, two on LG7, one on LG1, LG2, LG8 and LG15, but no SUSs were detected on LG3, LG4, LG5, LG6, LG9, LG10, LG11, LG12 and LG14 (Figure 1a). In I. trifida and I. triloba, similar distributions of SUSs were found on Chr02 (2), Chr03 (1), Chr04 (1), Chr05(1), Chr06 (1) and Chr11 (1) (Figure 1b,c). Furthermore, we analyzed the synteny between IbSUSs, ItfSUSs and ItbSUSs. The results indicated that most of ItfSUSs and ItbSUSs had one orthologous gene of IbSUSs apart from ItfSUS3 on Chr03 with two orthologous genes (IbSUS3 and IbSUS4 on LG7) and ItfSUS6 on Chr11 with two orthologous genes (IbSUS5 on LG8 and IbSUS6 on LG13). IbSUS3 and IbSUS4 were likely derived from a tandem duplication event and IbSUS5 and IbSUS6 had traces of segmental duplication (Figure 1d). These results showed that segmental and tandem duplications occurred in the process of evolution from diploid to hexaploid.

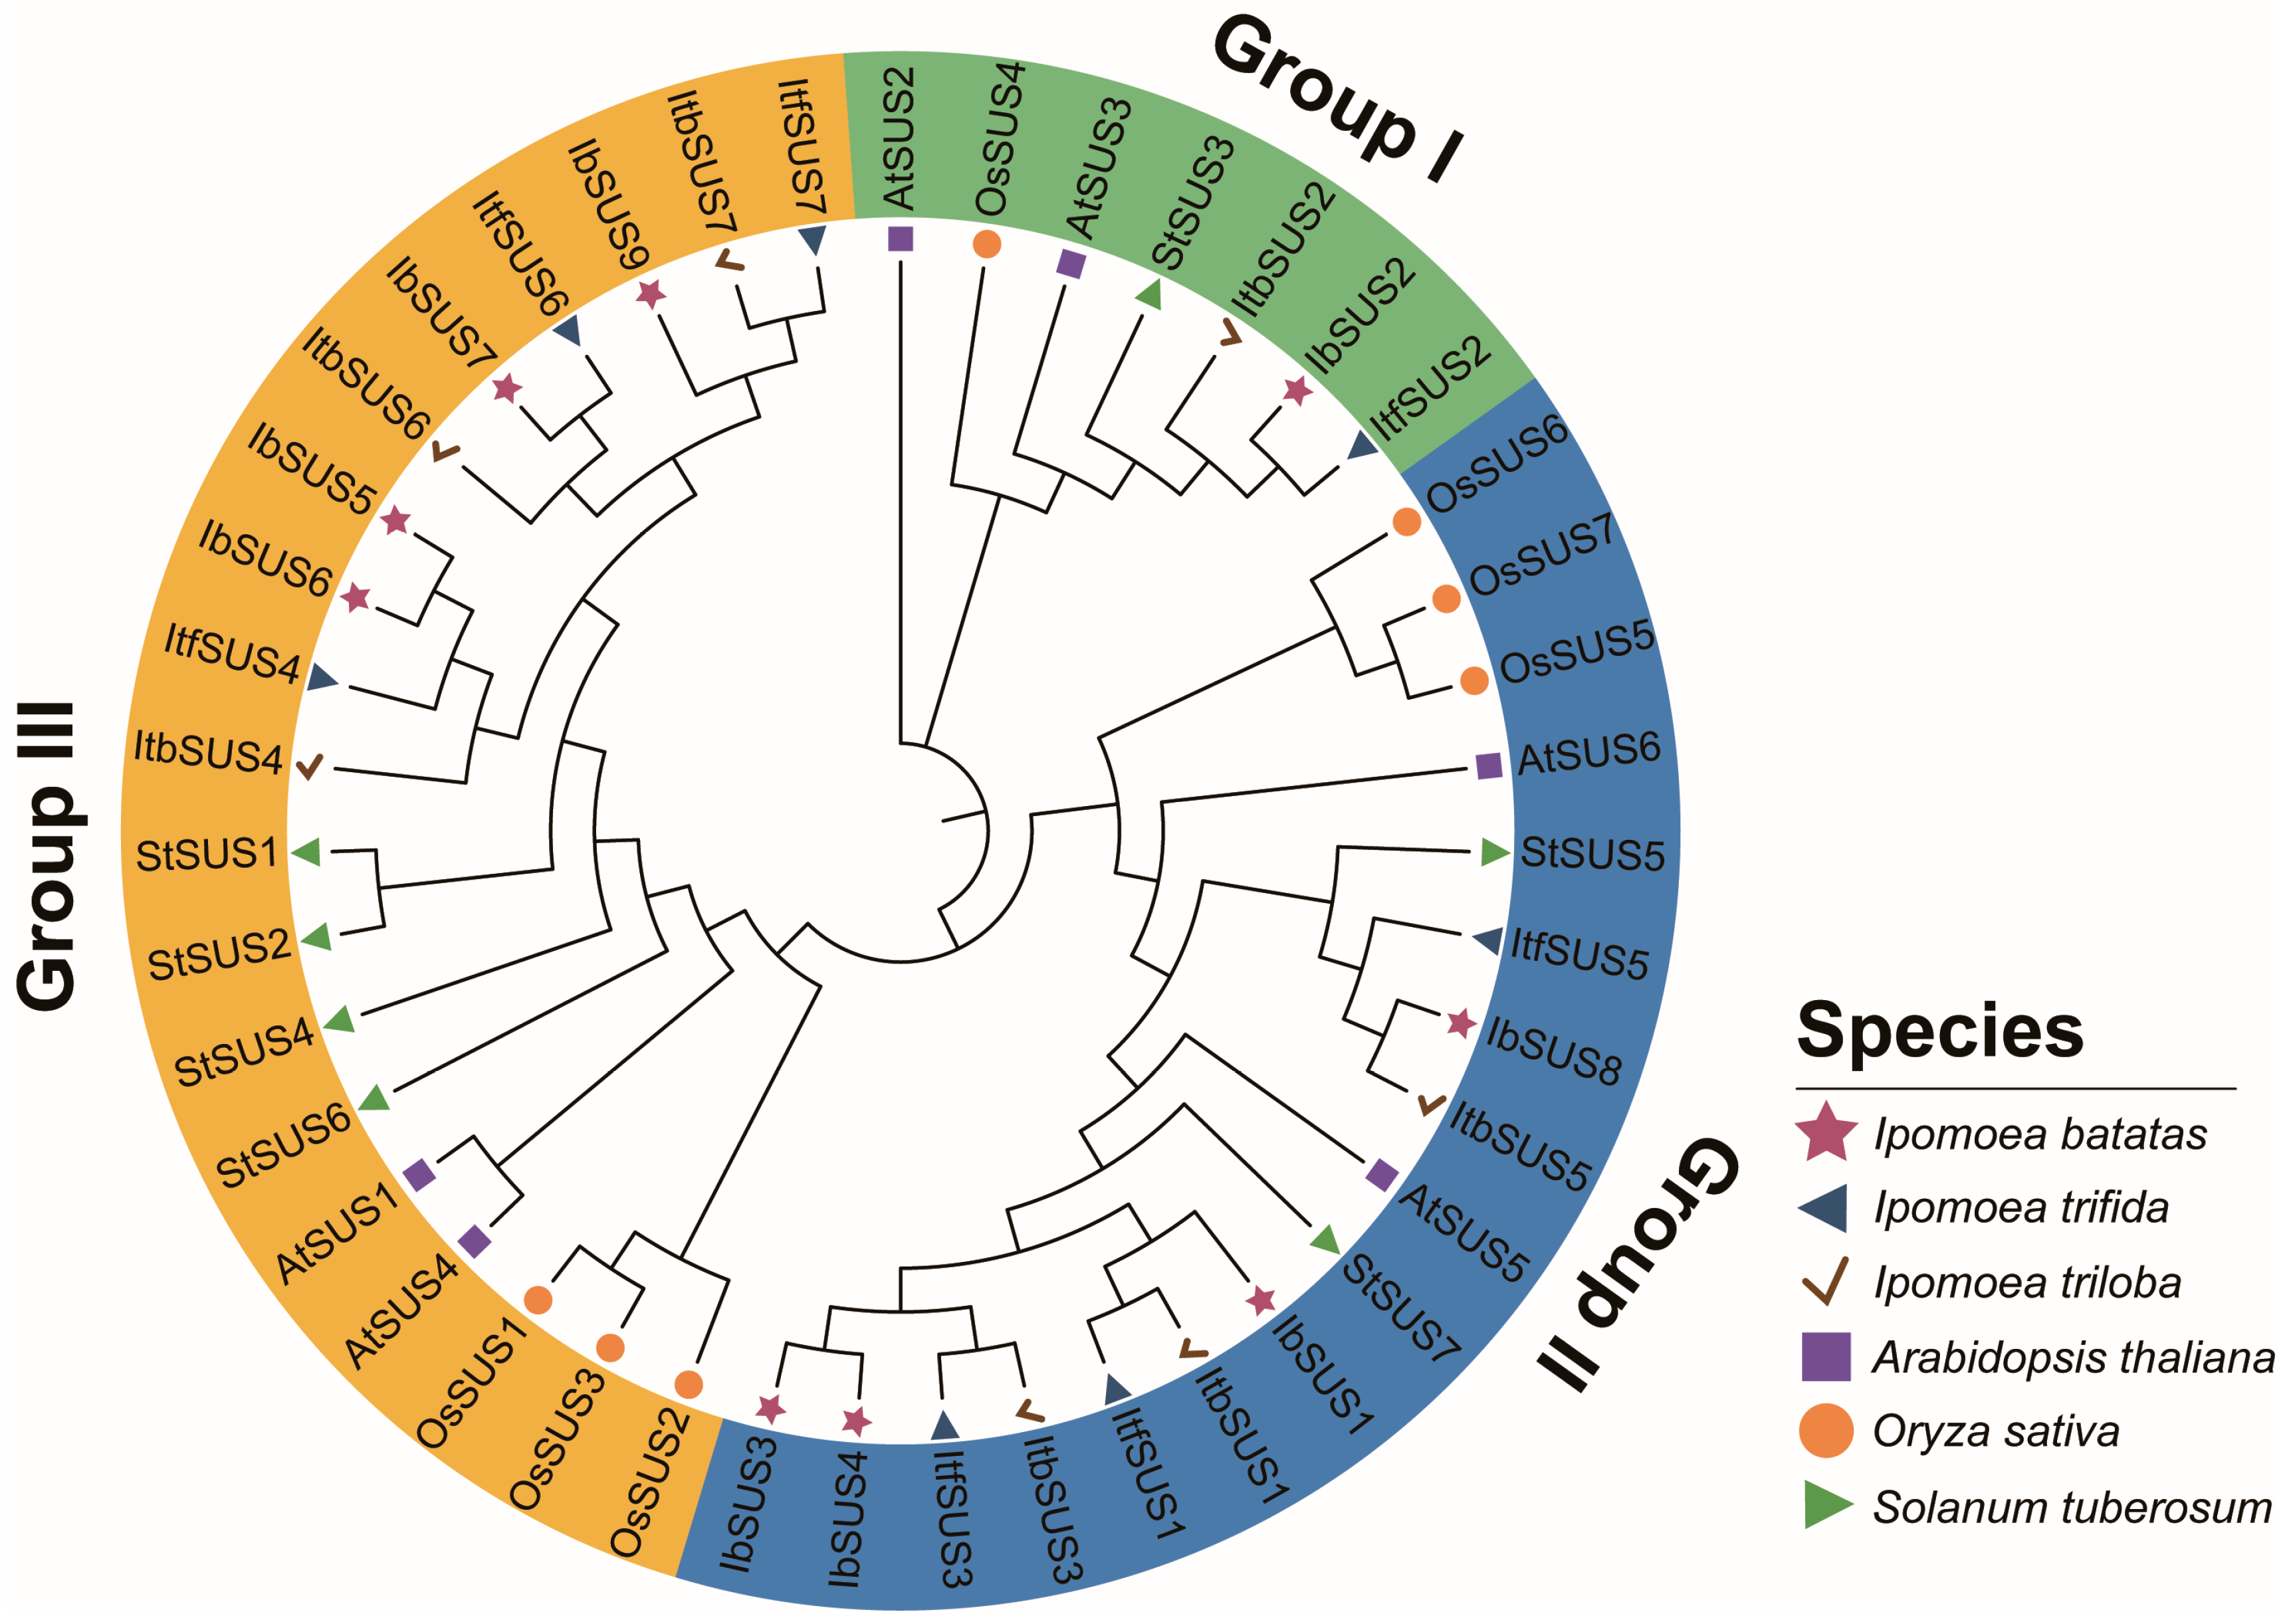
2.2. Phylogenetic Relationship Analysis of SUSs in Sweet Potato and Its Two Diploid Wild Relatives

In order to study the evolutionary relationships of SUSs in I. batatas, I. trifida, I. triloba, Arabidopsis thaliana, Oryza sativa and Solanum tuberosum, we constructed a phylogenetic tree for 43 SUSs of these six species (i.e., 9 in I. batatas, 7 in I. trifida, 7 in I. triloba, 6 in A. thaliana, 7 in O. sativa and 7 in S. tuberosum). According to the evolutionary distance, all the SUSs were divided into three groups and unevenly distributed on each branch of the phylogenetic tree (Figure 2). The specific distributions of SUSs were as follows (total: I. batatas, I. trifida, I. triloba, A.thaliana, O. sativa, and S. tuberosum): Group I (7:1, 1, 1, 2, 1, 1), Group II (17:4, 3, 3, 2, 3, 2), and Group III (19:4, 3, 3, 2, 3, 4) (Figure 2; Table S1). These results indicated that all IbSUSs were clustered with their corresponding orthologs in I. triloba and I. trifida.

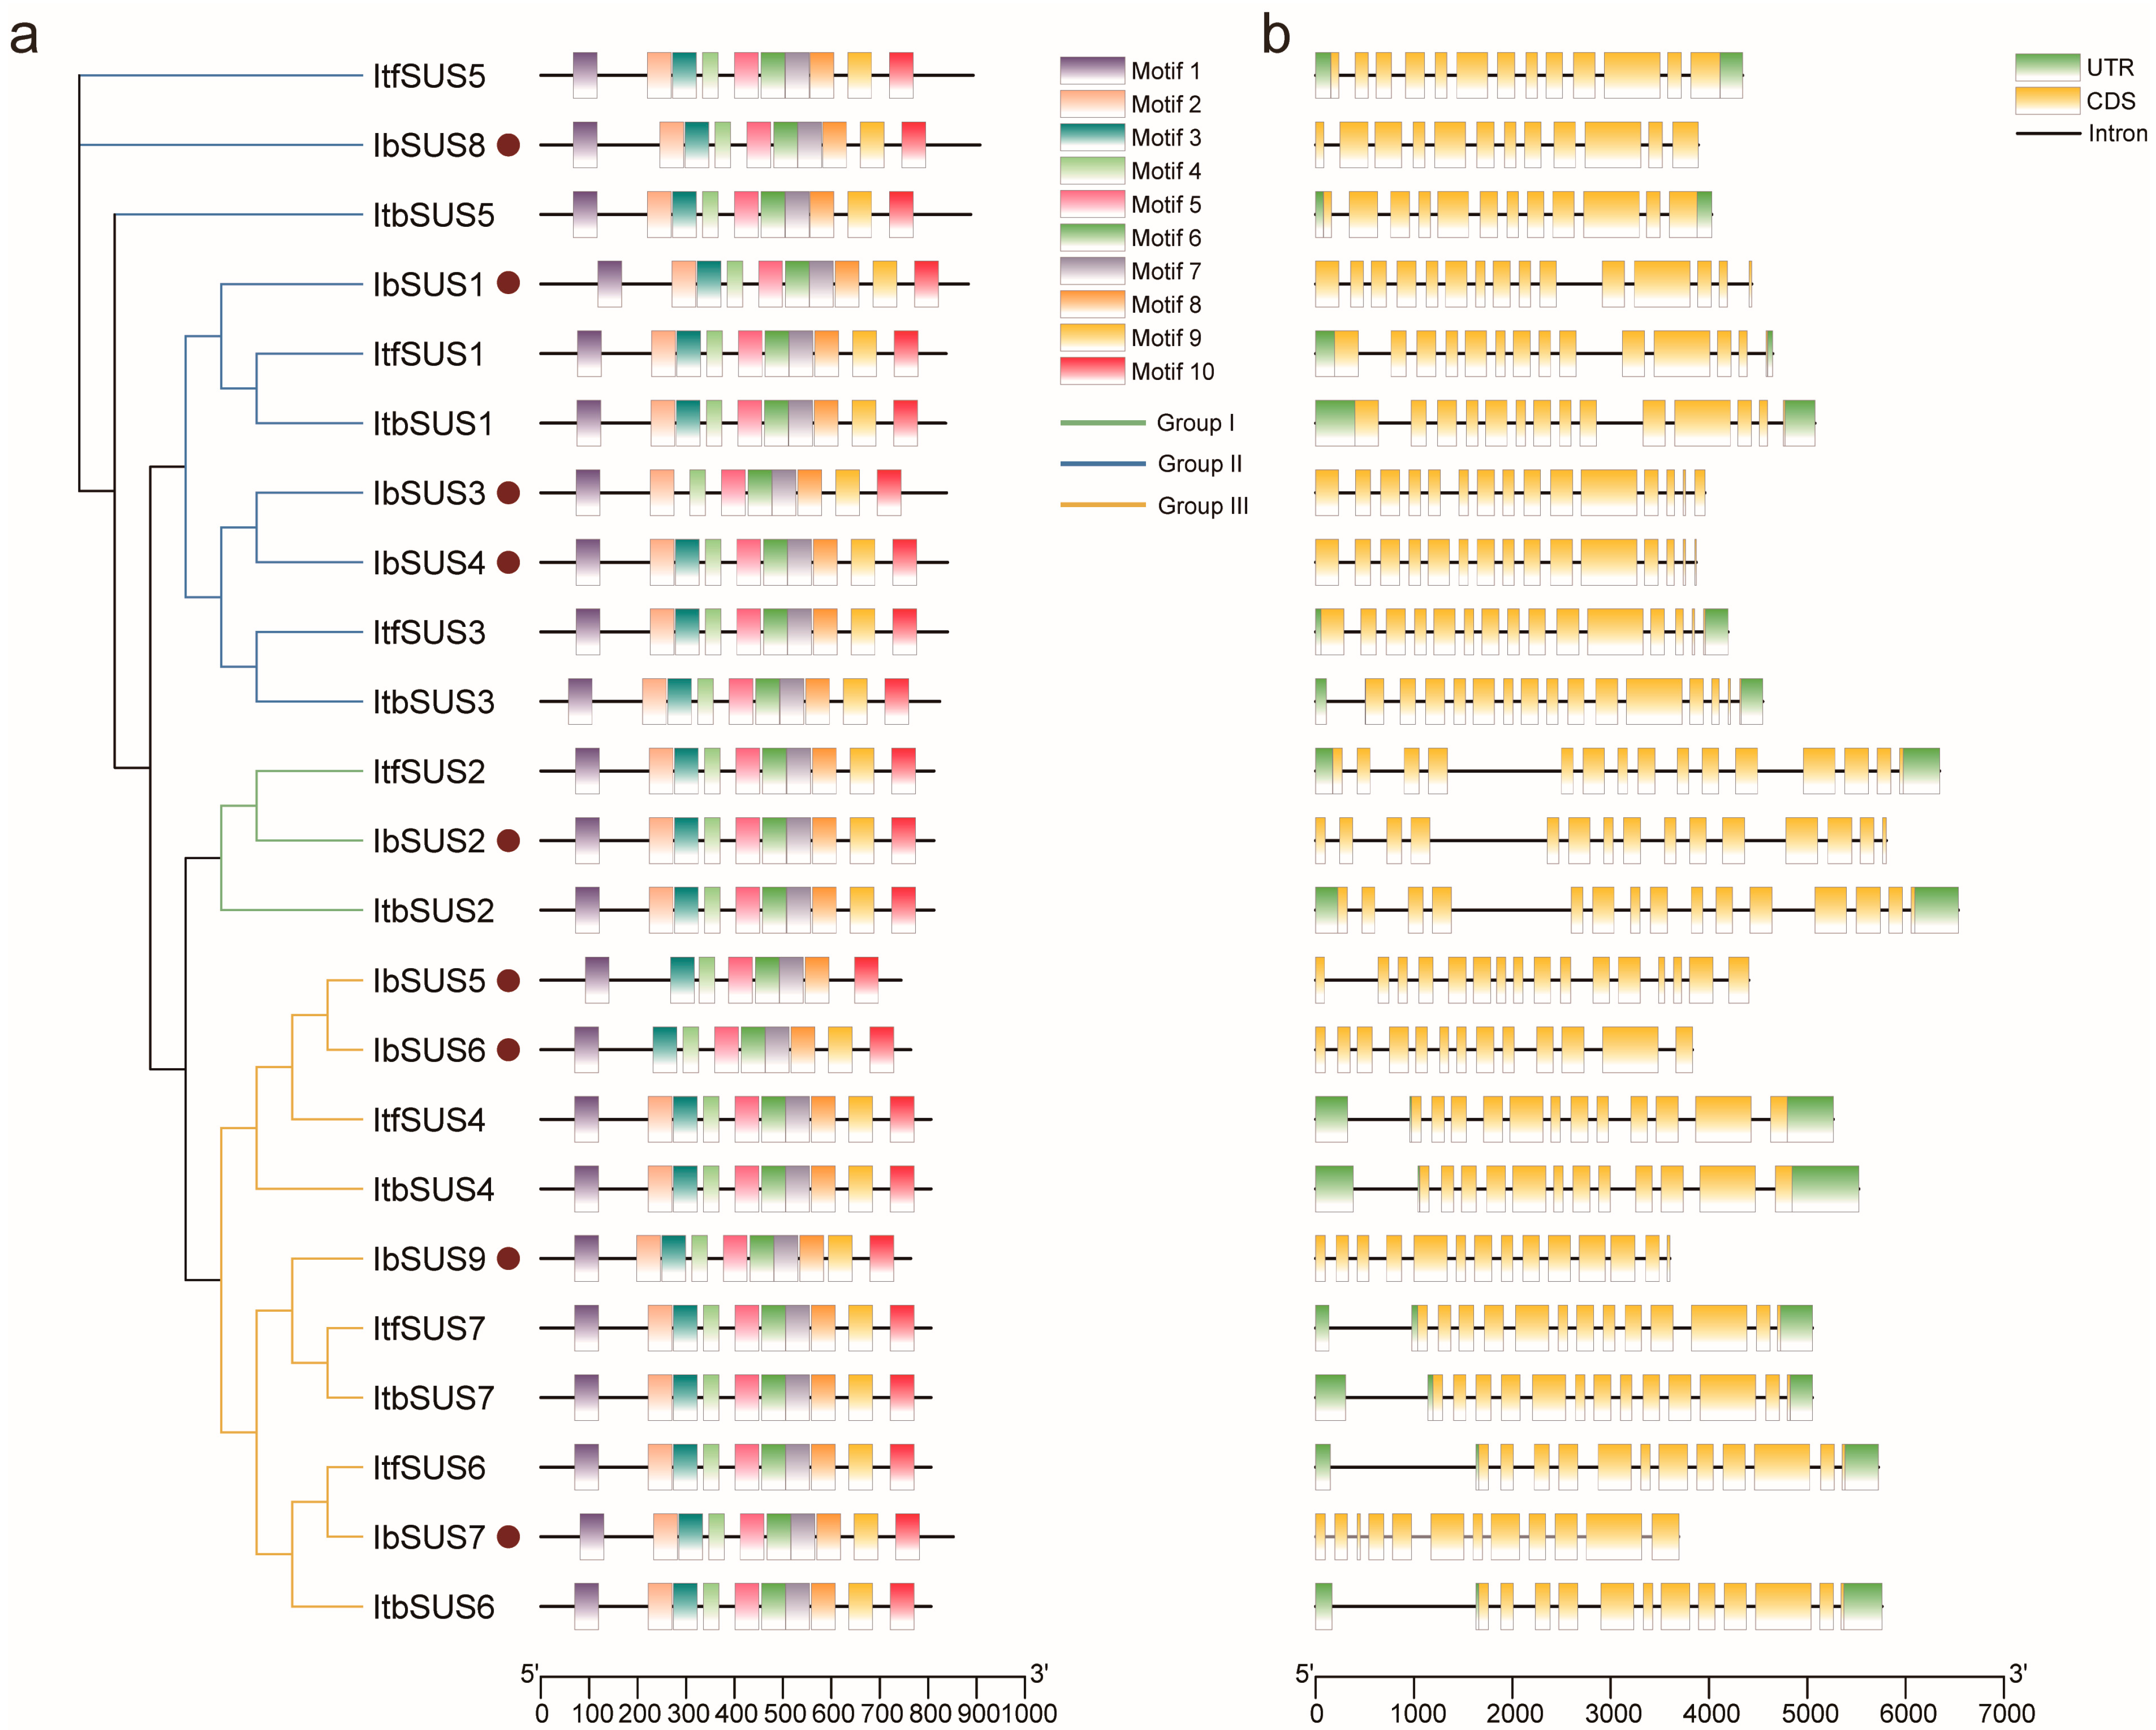
2.3. Conserved Motif and Exon–Intron Structure Analysis of SUSs in Sweet Potato and Its Two Diploid Wild Relatives

We analyzed sequence motifs in IbSUSs, ItfSUSs and ItbSUSs using the MEME website, and identified the ten conserved motifs (Figure 3a and Figure S1). Most of the SUSs contained these ten conserved motifs except for a few SUSs which were differentiated in the number and species of motifs only in I. batatas, such as IbSUS3 (containing nine motifs except for 3), IbSUS5 (containing eight motifs except for 2 and 9) and IbSUS6 (containing nine motifs except for 2) (Figure 3a).
The exon-intron distributions of IbSUS, ItbSUS and ItfSUS were analyzed to better understand the evolution of the IbSUS gene family. In general, the number of exons and introns in SUSs showed small variations (Figure 3b). The number of exons ranged from 12 (IbSUS7, IbSUS8, ItbSUS4, ItfSUS5, ItbSUS5, ItfSUS6 and ItbSUS6) to 16 (IbSUS5). In detail, some homologous SUSs had the same number of exons such as IbSUS2, ItfSUS2 and ItbSUS2 (all containing 15 exons) in Group I; IbSUS3, ItfSUS3 and ItbSUS3 (all containing 15 exons) in Group II; IbSUS7, ItfSUS6 and ItbSUS6 (all containing 12 exons) in Group III. However, some of them had more exons in I. batatas than in I. trifida and I. triloba such as IbSUS1 (containing 15 exons), ItfSUS1 (containing 14 exons) and ItbSUS1 (containing 14 exons) in Group II; IbSUS9 (containing 14 exons), ItfSUS7 (containing 13 exons) and ItbSUS7 (containing 13 exons); IbSUS5 (containing 16 exons), IbSUS6 (containing 13 exons), ItfSUS4 (containing 12 exons) and ItbSUS4 (containing 12 exons) in Group III (Figure 3b). These results indicated that the SUS gene family might become more complex in the evolution process.

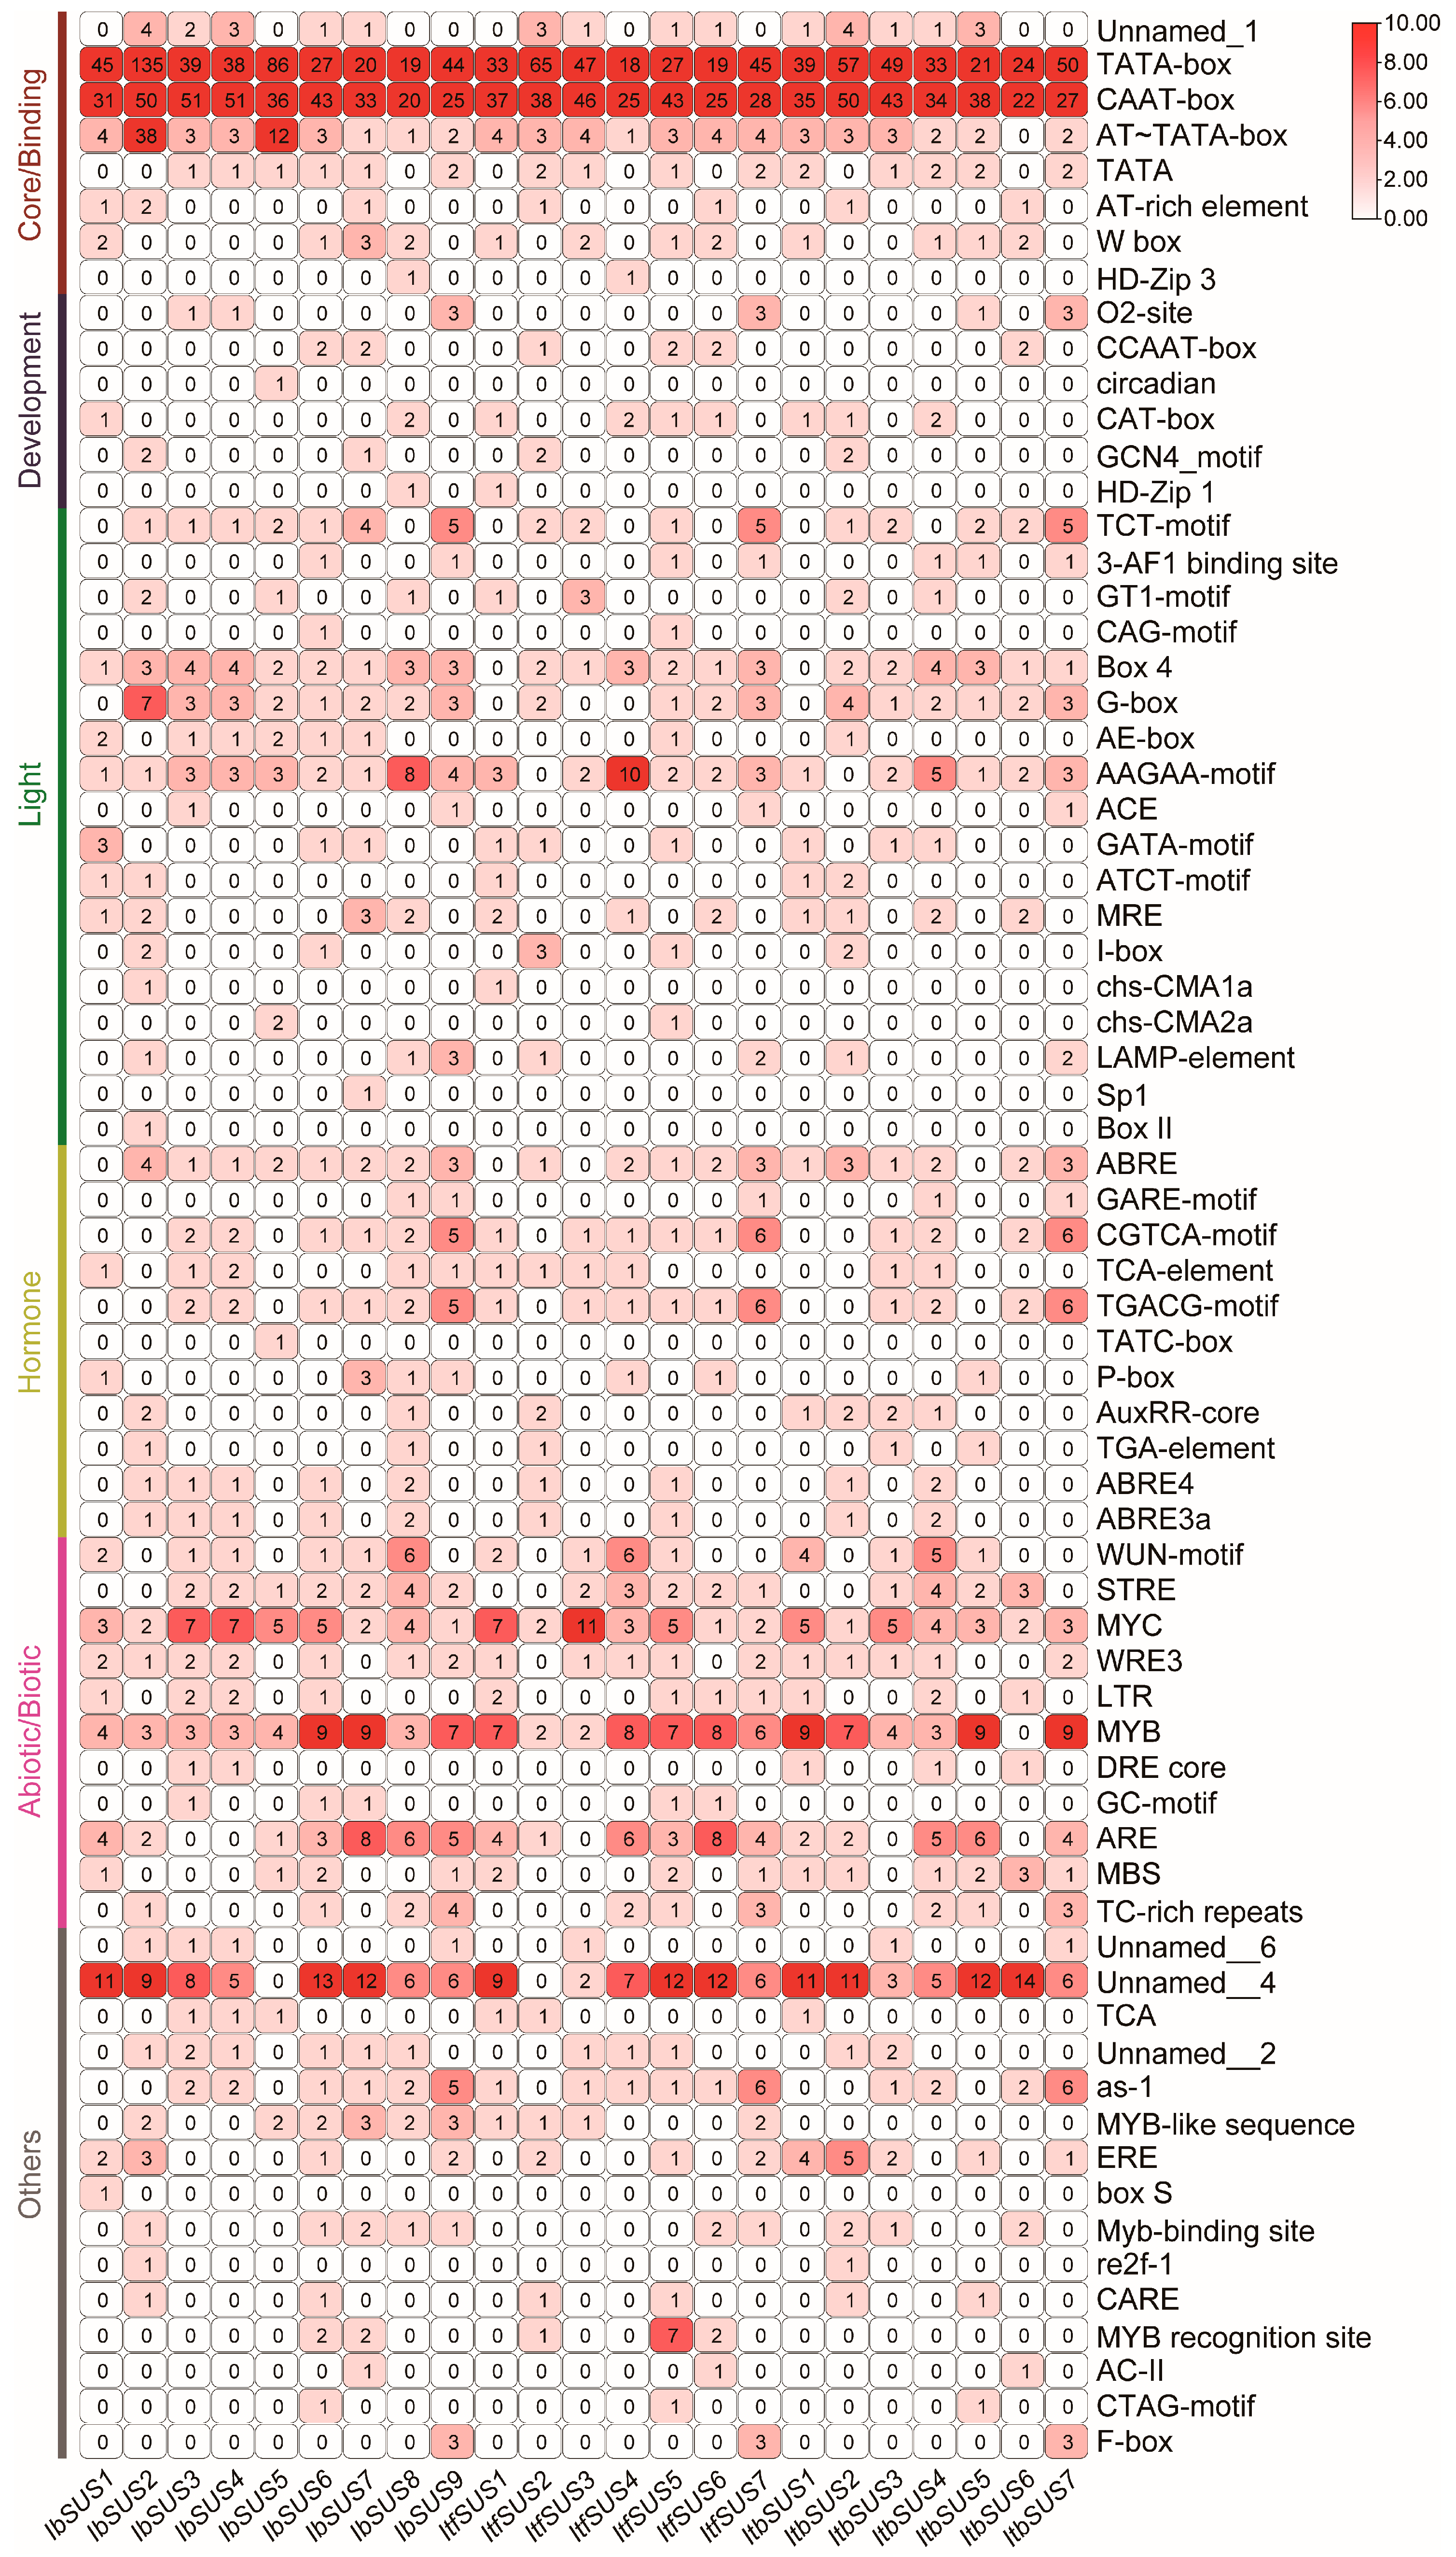
2.4. Cis-Element Analysis in the Promoters of SUSs in Sweet Potato and Its Two Diploid Wild Relatives

The promoter cis-elements are tightly related to the gene function. In order to explore the regulatory mechanisms of SUSs, we analyzed the cis-elements in promoters of IbSUSs, ItbSUSs and ItfSUSs using their 2000 bp promoter regions. According to the functions of cis-elements, we divided them into six categories: core/binding, development, light, hormone, abiotic/biotic and other unknown elements (Figure 4). All of the IbSUS promoters contained a large number of core/binding elements including TATA-box and CAAT-box. The IbSUS2 and IbSUS3 promoters had also many AT-TATA-boxes. All of the IbSUS promoters possessed at least one development element. For example, the O2-site (zein metabolism regulatory element) was found in the promoters of IbSUS3, IbSUS5 and IbSUS9; the CAT-box (associated with meristem formation and cell division) was found in the promoters of IbSUS1 and IbSUS8; the GCN4 motif (control seed-specific expression) was found in the promoters of IbSUS2 and IbSUS7 (Figure 4). The light-responsive elements TCT-motif, Box 4, G-box, AE-box, and AAGAA-motif existed in most of the IbSUSs promoters. The IbSUSs promoters contained abundant hormone-responsive elements, including ABA-responsive elements ABRE, ABRE4 and ABRE3a, JA-responsive elements CGTCA-motif and TGACG-motif, and SA-responsive elements TCA and TATC-box (Figure 4). Most of the IbSUSs promoters contained abiotic/biotic elements such as drought-responsive elements MYB and MYC, salt-responsive elements LTR and MBS, low temperature-responsive elements LTR, WRE3 and WUN motif, antioxidant response elements ARE and STRE (Figure 4).
There also were a large number of TATA-box and CAAT-box in all of the ItfSUSs and ItbSUSs promoters. Except for ItfSUS3 and ItbSUS3, the promoters of other ItfSUSs and ItbSUSs contained at least one development element (Figure 4). Compared with the promoters of IbSUSs, the promoters of ItfSUSs and ItbSUSs contained less light-responsive elements, especially G-box and AE-box. The ItfSUS1 and ItbSUS1 promoters had no Box 4 and the ItfSUS2 and ItfSUS2 promoters had no AAGAA-motif, which existed in the promoters of homologous IbSUSs. In addition, Sp I and Box II existed only in the IbSUS promoters. The ItfSUS and ItbSUS promoters were also rich in hormone-responsive elements such as ABA-responsive element ABRE, JA-responsive elements CGTCA-motif and TGACG-motif, and SA-responsive element TCA (Figure 4). Interestingly, the promoters of ItbSUS contained more IAA-responsive element AuxRR-core than those of IbSUSs and ItfSUSs. The promoters of most of ItfSUSs and ItbSUSs had many abiotic/biotic elements, such as drought-responsive elements MYB and MYC, salt-responsive elements LTR and MBS, low temperature-responsive elements LTR, WRE3 and WUN motif, antioxidant response elements ARE and STRE (Figure 4). Taken together, these findings suggest that SUSs are involved in the regulation of plant growth and development, hormone crosstalk, and abiotic/biotic stress adaption in sweet potato and its two diploid wild relatives and IbSUSs may play more important roles in the development and light response of sweet potato.

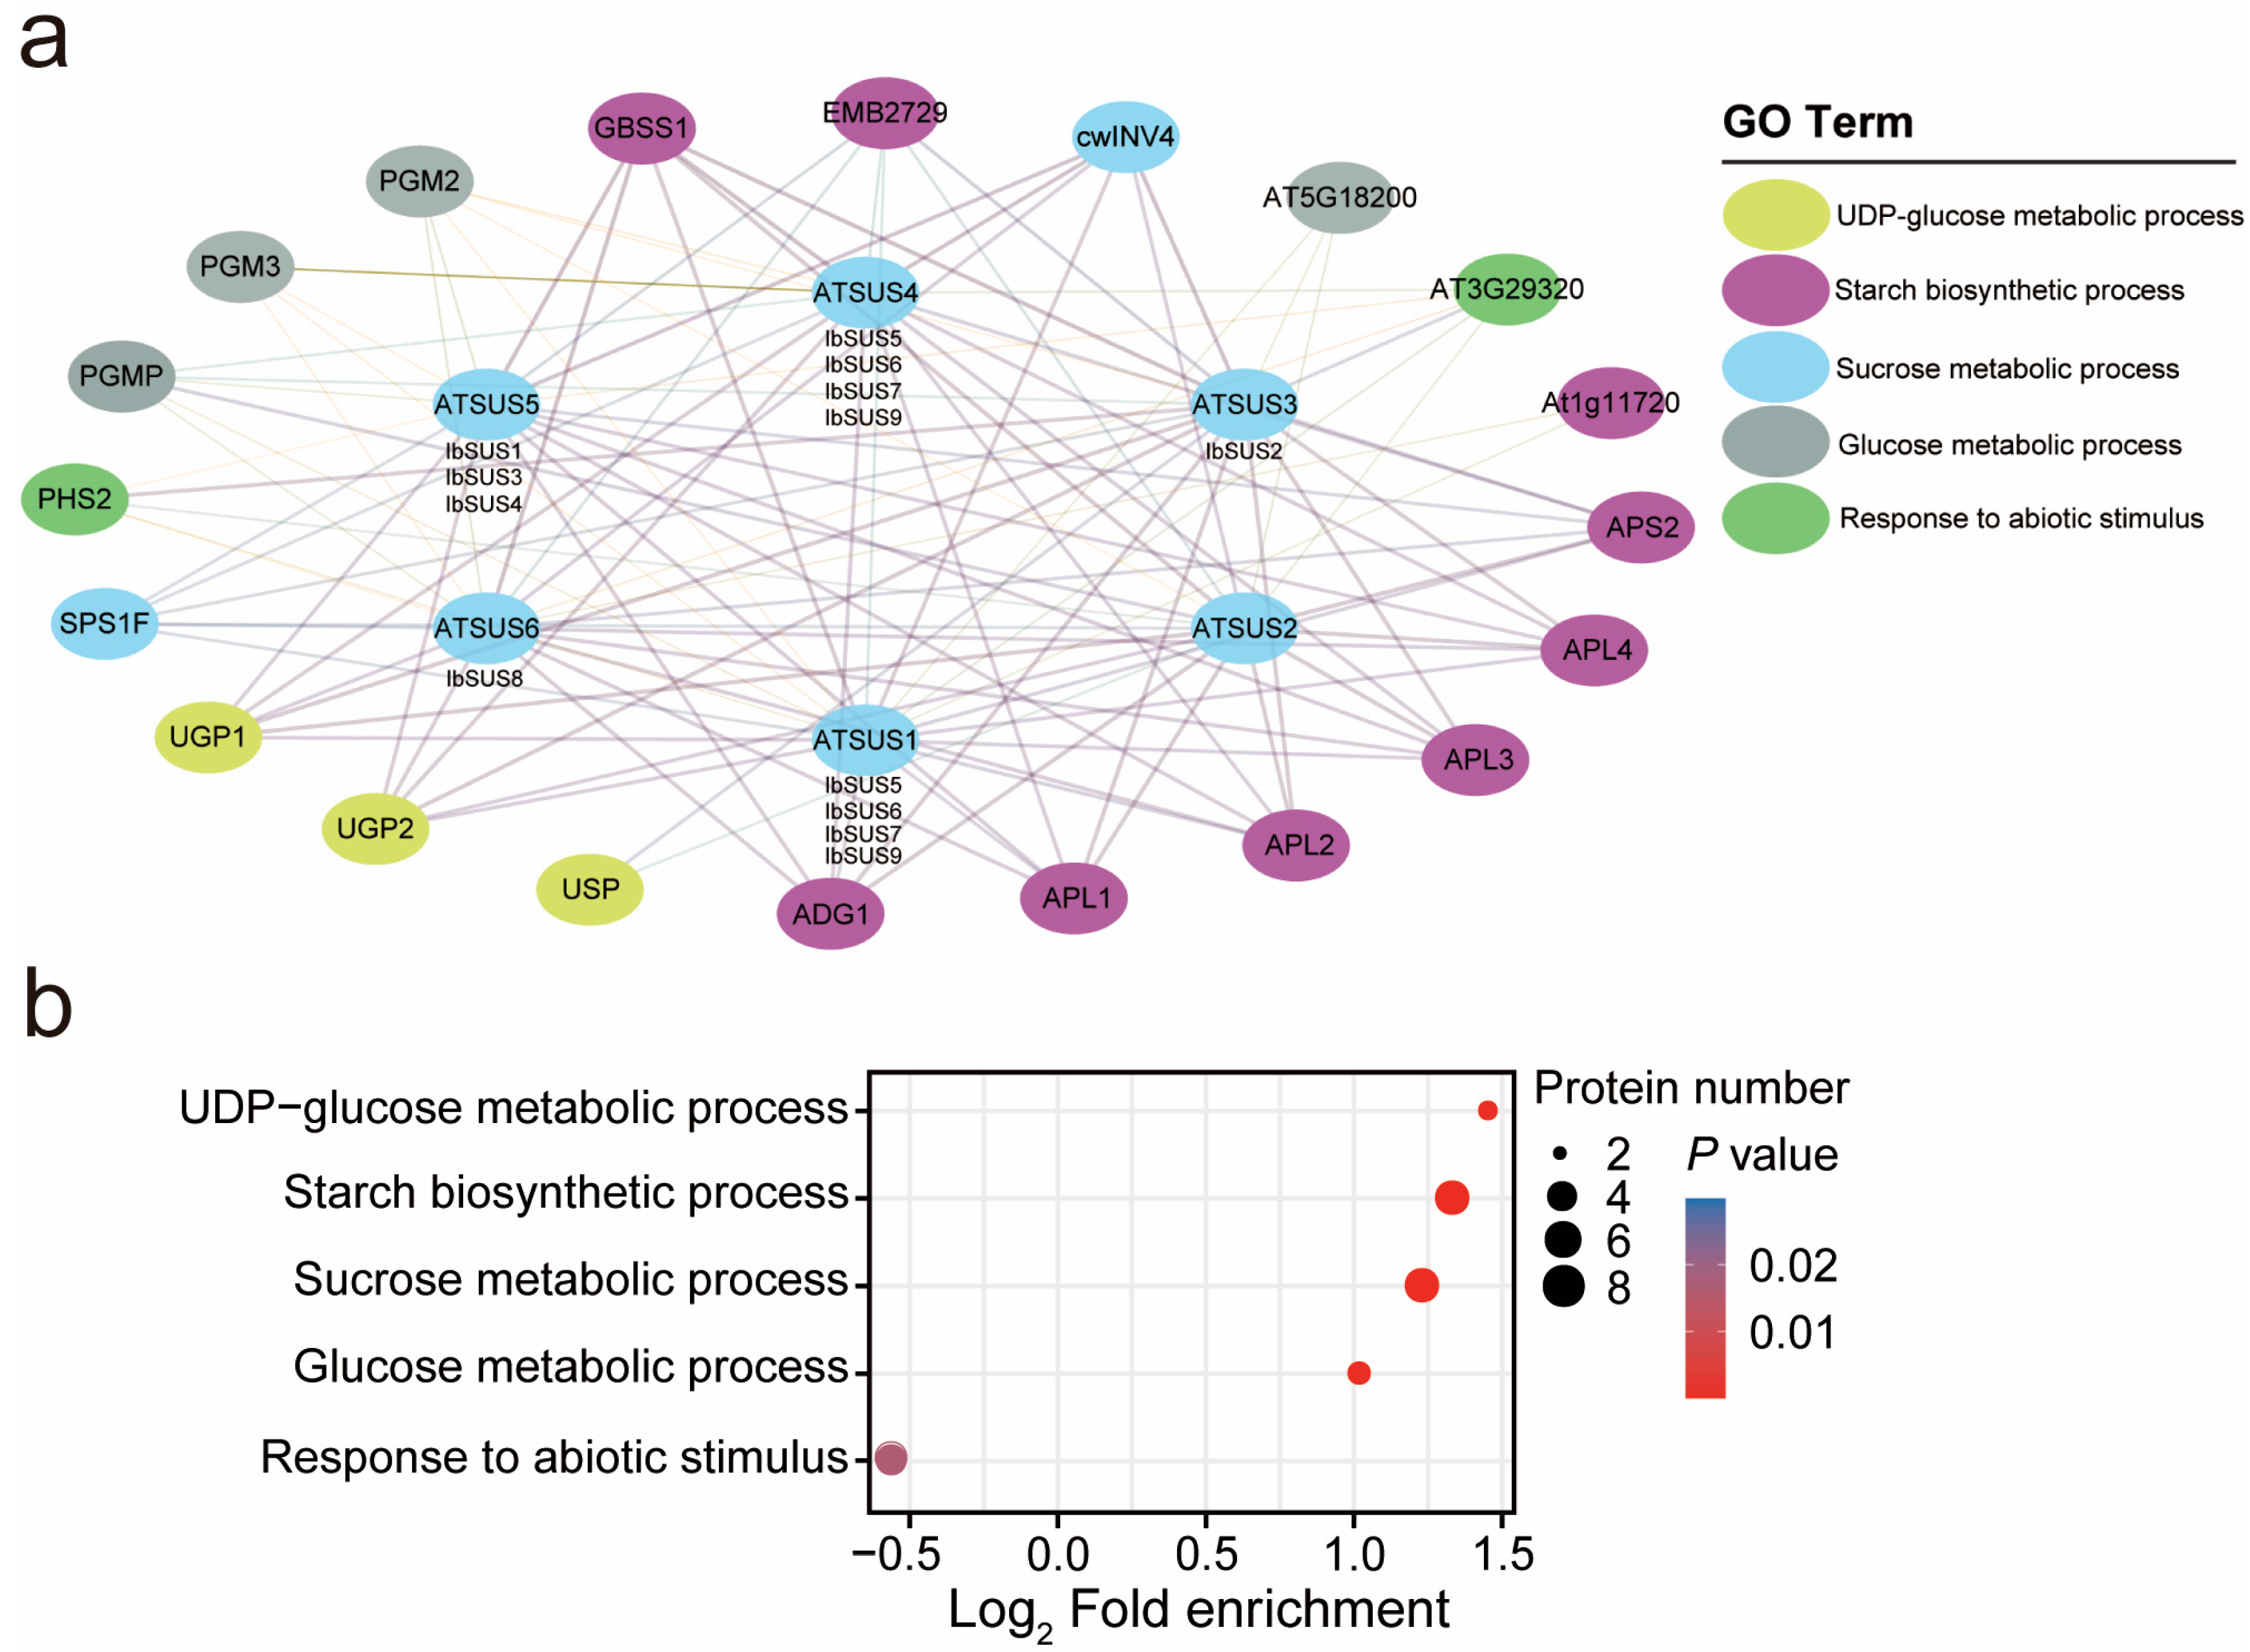
2.5. Protein Interaction Network of IbSUSs in Sweet Potato

To investigate the potential regulatory network of IbSUSs, we constructed an IbSUSs interaction network based on Arabidopsis orthologous proteins (Figure 5a). Obviously, IbSUSs could not interact with each other (Figure 5a). IbSUSs could interact with glucose-1-phosphate adenylyltransferase (ADG1, APS2, APL1, APL2, APL3, and APL4), granule-bound starch synthase (GBSS1), phosphoglucomutase (PGMP and PGM2), sucrose phosphate synthase (SPS1F), UTP-glucose-1-phosphate uridylyl transferase (UGD1 and UGD2), cell wall invertase (CWINV4), 1,4-alpha-glucan-branching enzyme (SBE3) and glycosyl transferase (AT3G29320). IbSUS1, IbSUS4, IbSUS5 and IbSUS6 could interact with phosphoglucomutase (PGM3). IbSUS1 and IbSUS6 could interact with starch synthase (At1g11720). IbSUS2 and IbSUS3 could interact with UDP-sugar pyrophosphorylase (USP). IbSUS1, IbSUS2 and IbSUS3 could interact with UDP-glucose-hexose-1-phosphate uridylyl transferase (AT5G18200). These results have demonstrated that IbSUSs play important roles in the carbon metabolism of sweet potatoes.
In order to further explore the functions of IbSUSs, we conducted an Ontology (GO) pathway enrichment analysis for proteins involved in regulatory networks and classified 26 proteins into five significantly enriched GO pathways. Interestingly, the ‘starch biosynthetic process’ and ‘sucrose metabolic process’ were the dominant terms, which further proved the roles of IbSUSs in carbon metabolism (Figure 5b). ‘Response to abiotic stimulus’ was also involved in GO enrichment. Our data have proved that IbSUSs take on important responsibilities for starch biosynthesis and abiotic stress adaptation in sweet potatoes.

2.6. Expression Analysis of SUSs in Sweet Potato and Its Two Diploid Wild Relatives

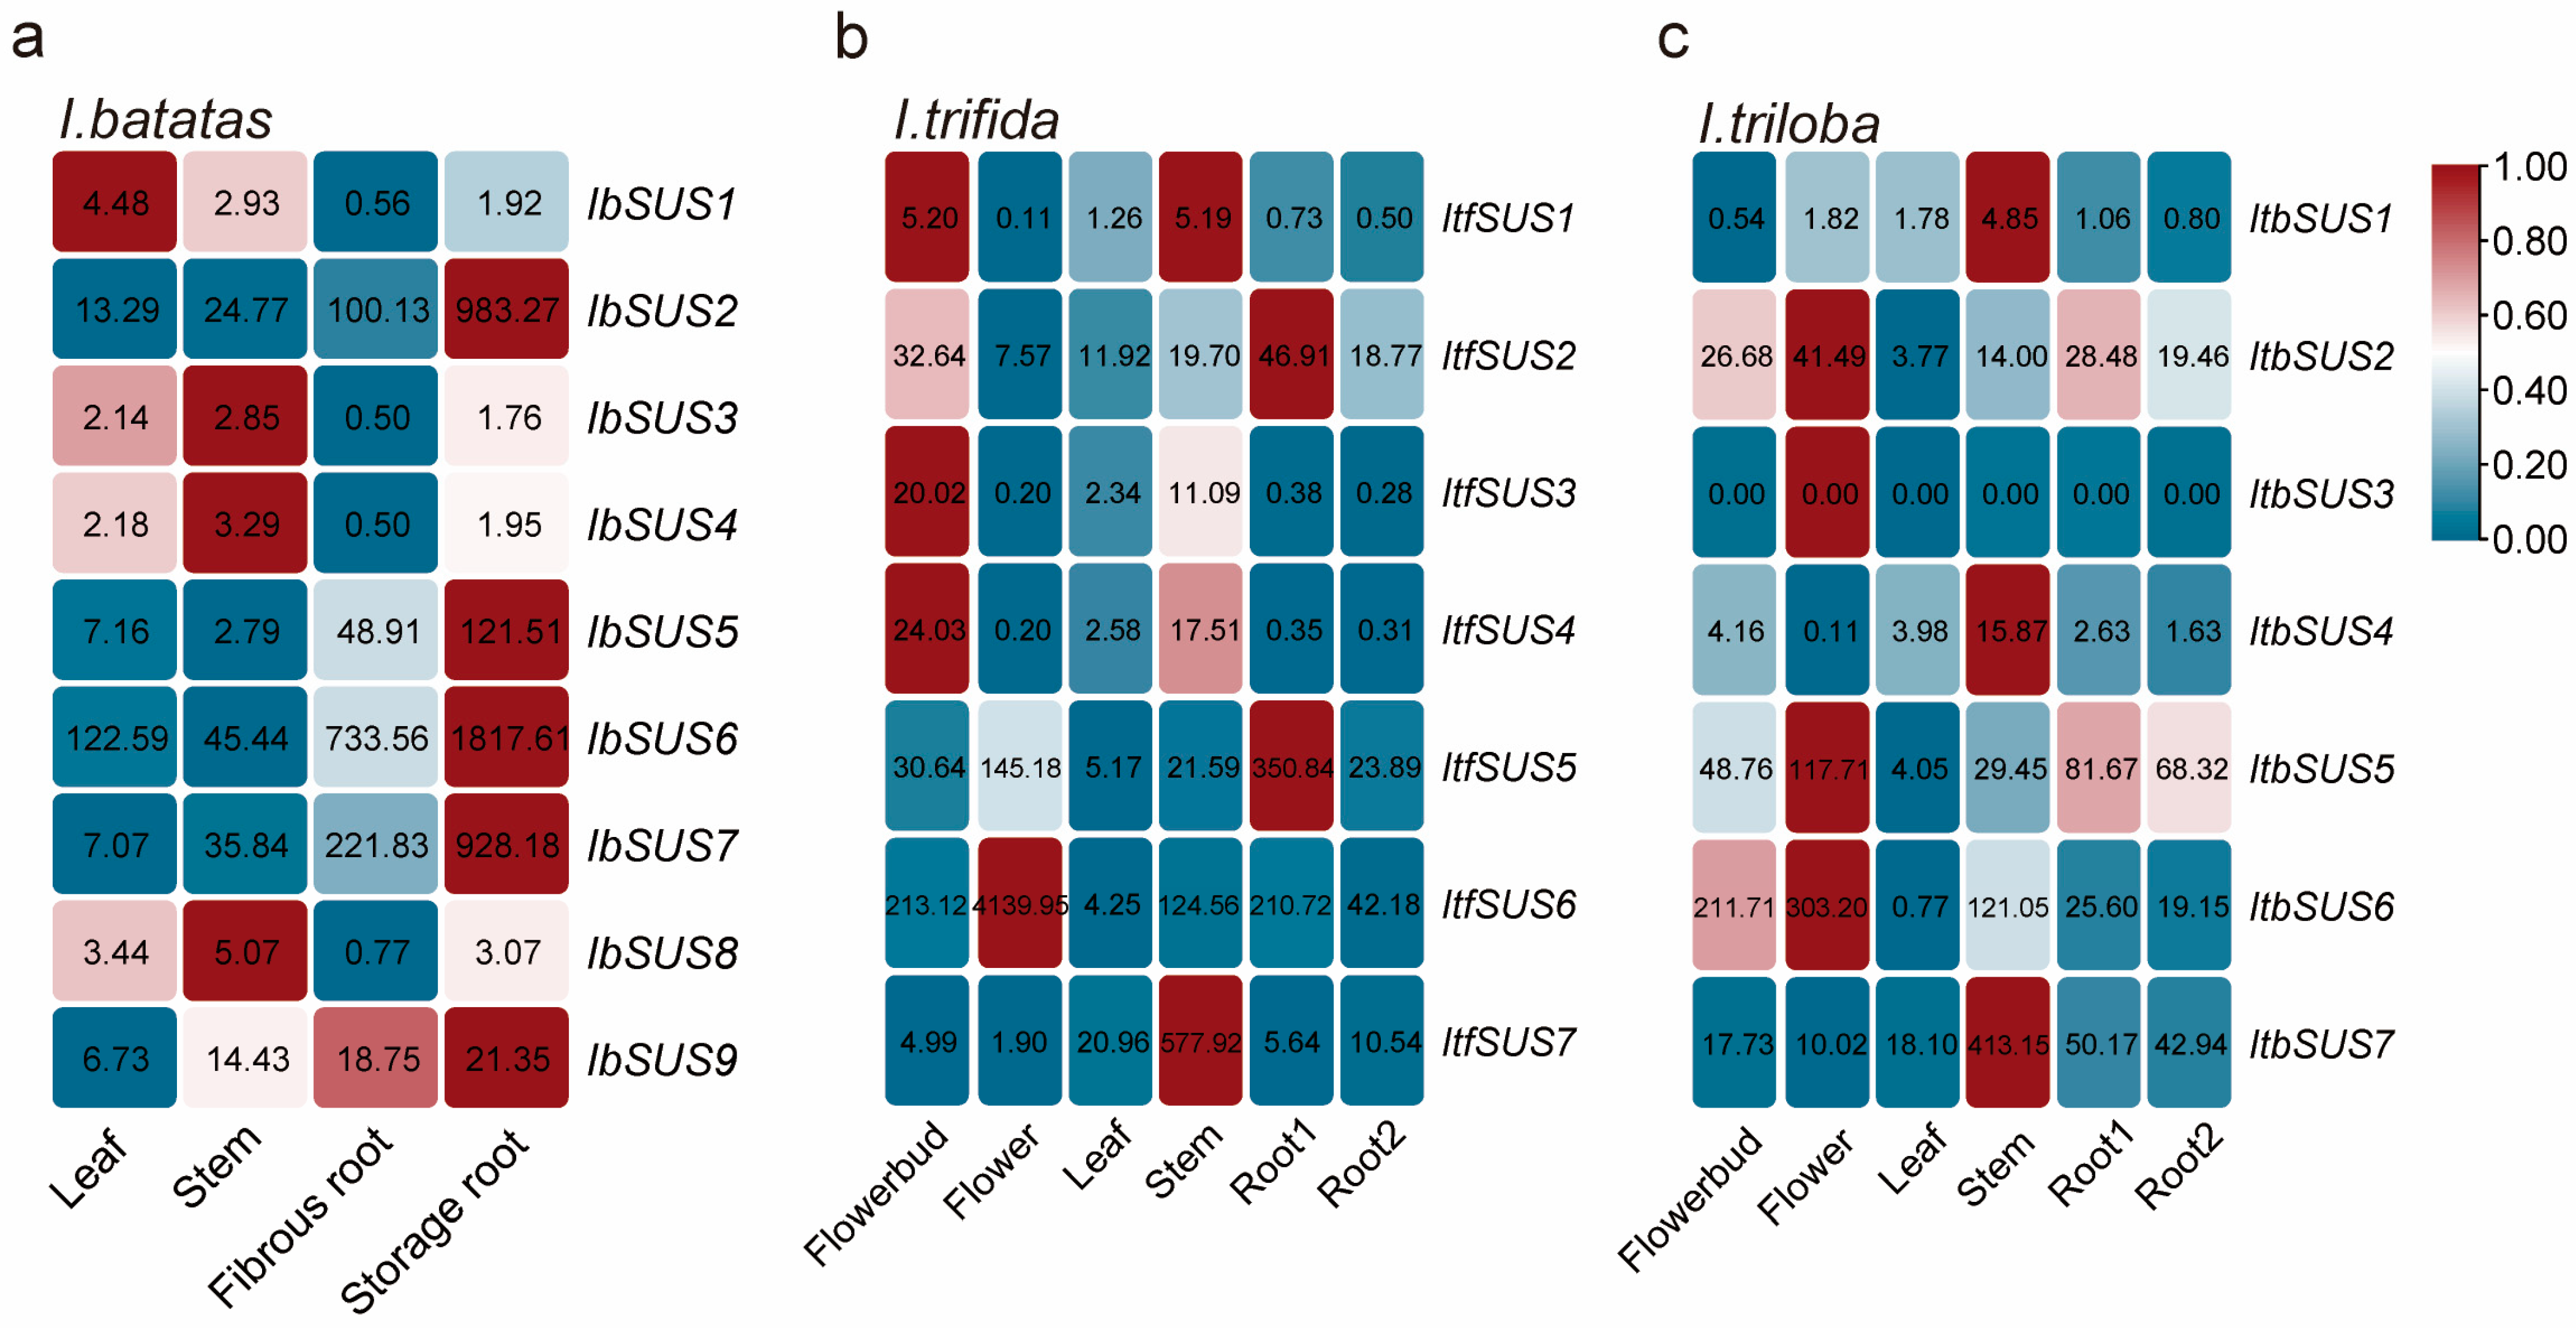
2.6.1. Expression Analysis in Various Tissues

The RNA-seq data of leaf, stem, fibrous root, and storage root tissues of sweet potato obtained at our laboratory were analyzed to investigate the potential biological functions of IbSUSs. We found that expression patterns of these IbSUSs were different in four tissues. IbSUS2 belonging to Group I and IbSUS5, IbSUS6, IbSUS7, and IbSUS9 belonging to Group III exhibited the highest expression level in storage roots; IbSUS3, IbSUS4, and IbSUS8 belonging to Group II showed the highest expression level in stems, but the highest expression level of IbSUS1 belonging to Group II was found in leaves (Figure 6a).
To study the expression patterns of ItfSUSs and ItbSUSs, we used RNA-seq data of six tissues (i.e., flower bud, flower, leaf, stem, root1, and root2) [33]. In I. trifida, ItfSUS1, ItfSUS2, ItfSUS3 and ItfSUS4 were highly expressed in flower buds; ItfSUS5 and ItfSUS6 were highly expressed in flowers; ItfSUS1, ItfSUS3, ItfSUS4 and ItfSUS7 were highly expressed in stems; ItfSUS2 and ItfSUS5 were highly expressed in root1 (Figure 6b). All the ItfSUSs had the low expression in leaves and root2. In I. triloba, ItbSUS1, ItbSUS4 and ItbSUS7 were highly expressed in stems; ItbSUS2, ItbSUS5 and ItbSUS6 were highly expressed in flower buds and flowers; ItbSUS2 and ItbSUS5 were highly expressed in roots (Figure 6c). All the ItbSUSs had low expression in leaves and no expression of ItbSUS3 was tested. Above all, these results have shown that SUSs possess different expression patterns and play important roles in the growth and development of sweet potato and its two diploid wild relatives.

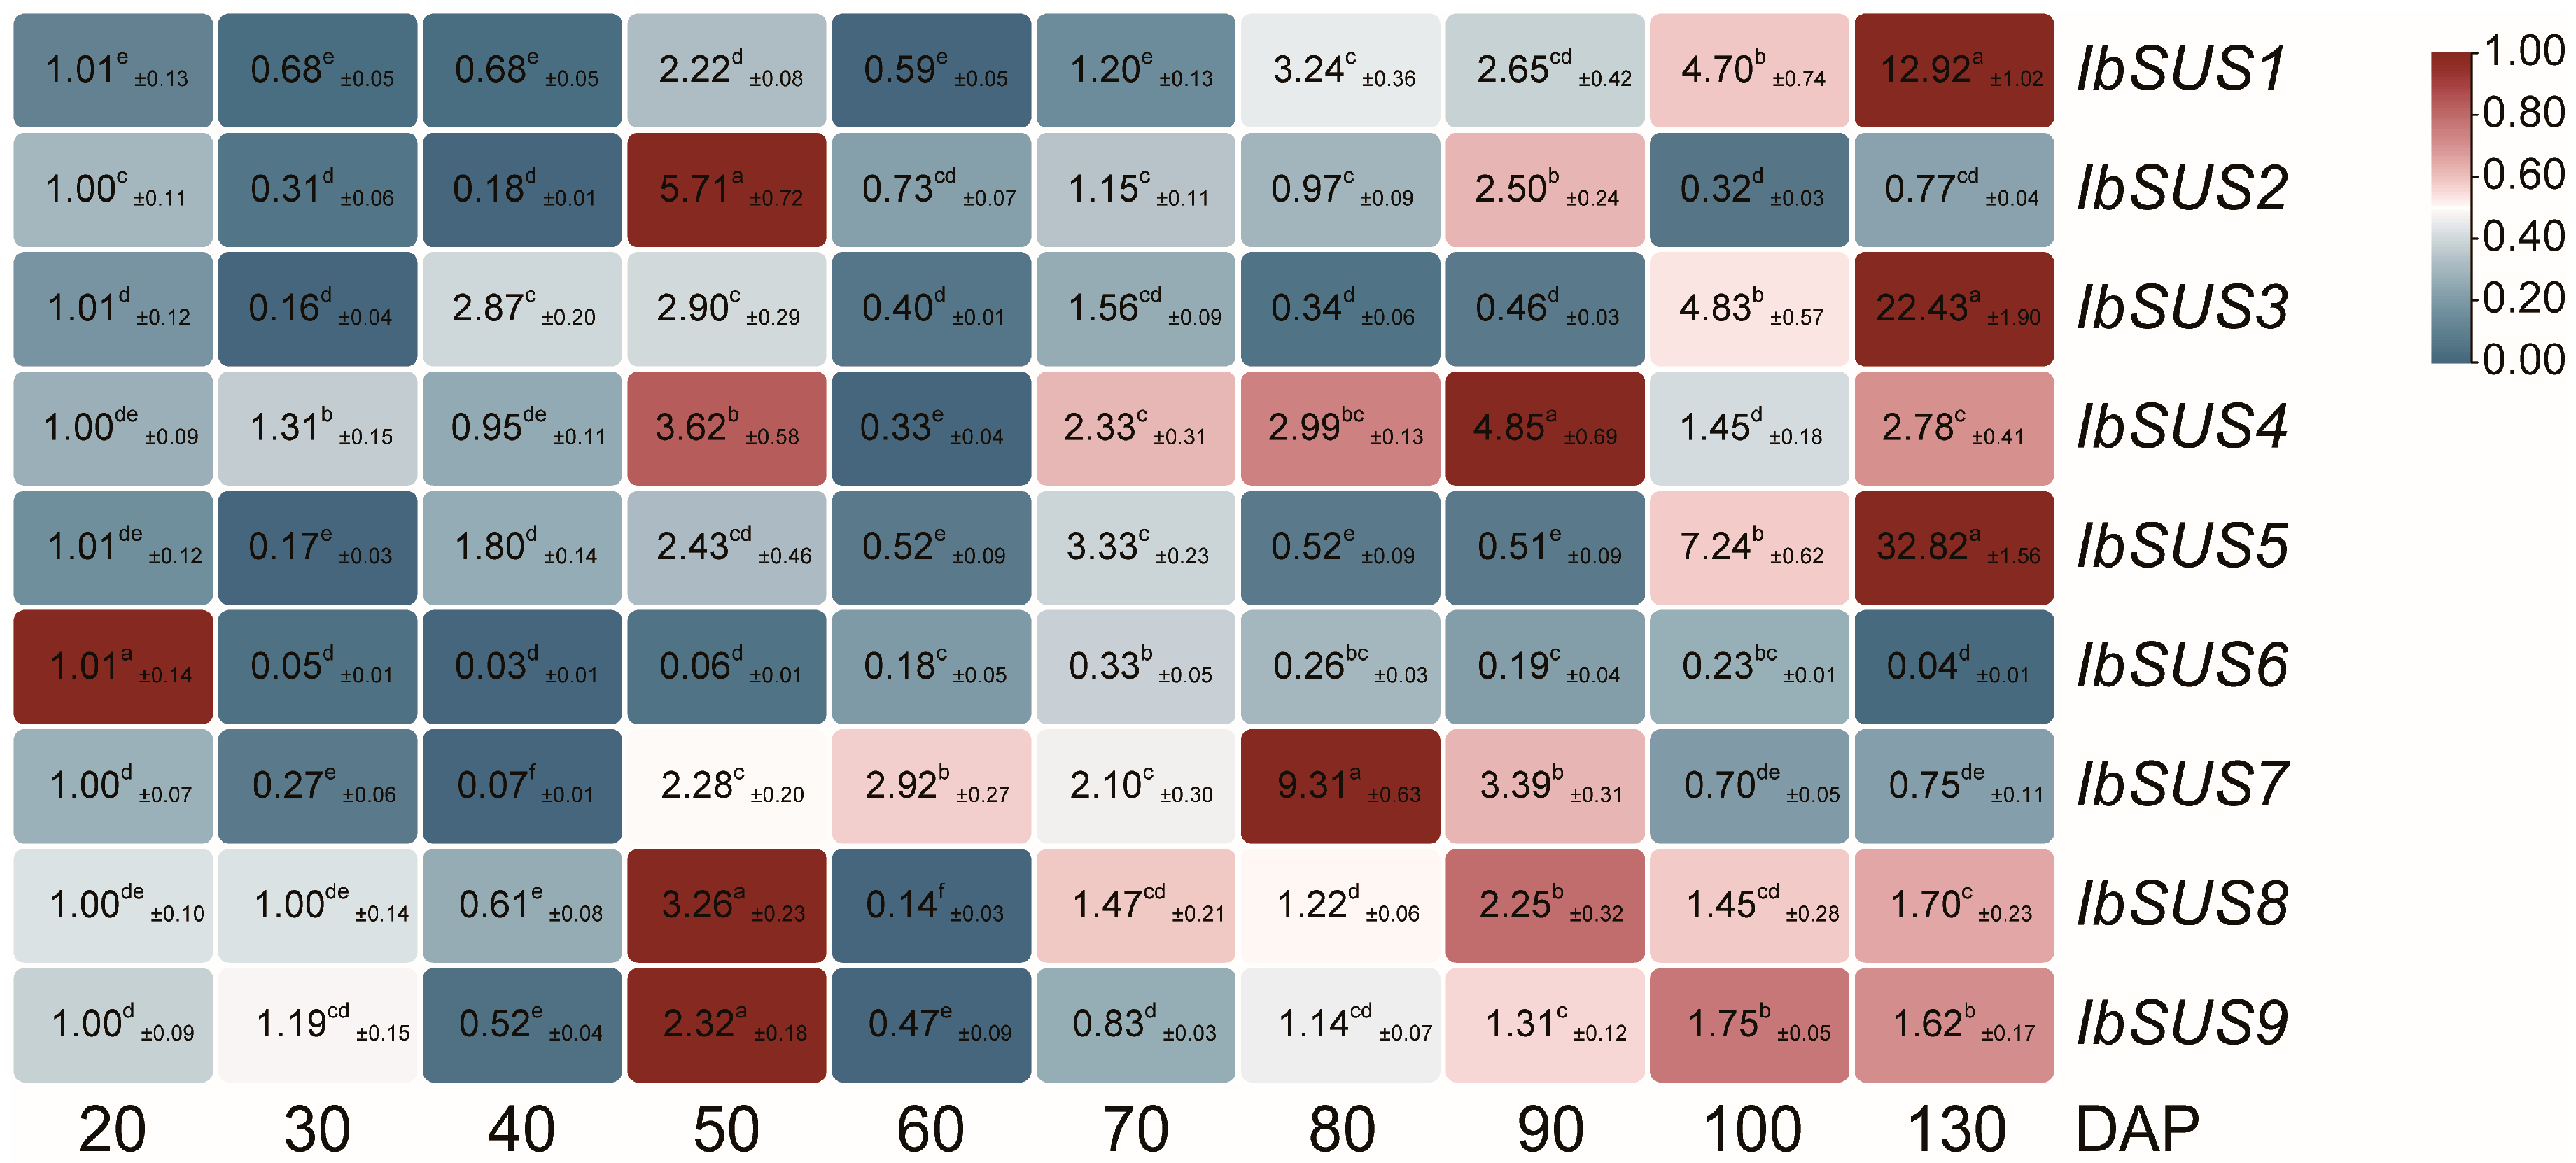
2.6.2. Expression Analysis at Different Developmental Stages of Storage Roots in Sweet Potato

In order to understand the roles of SUSs in storage root development of sweet potato, we further performed qRT-PCR to evaluate the expression levels of IbSUSs at different developmental stages of storage roots (i.e., 20, 30, 40, 50, 60, 70, 80, 90, 100 and 130 DAP: day after planting) of sweet potato line H283 with high starch content which was selected from F1 individuals from a cross between Xushu 18 and Xu 781 [35]. As shown in Figure 7, IbSUS2, IbSUS4, IbSUS8 and IbSUS9 were highly expressed at 50 DAP (rapid thickening and initial starch accumulation stage); IbSUS4, IbSUS7, IbSUS8 and IbSUS9 were highly expressed during 80 to 90/100 DAP (rapid starch accumulation); IbSUS1, IbSUS3 and IbSUS5 exhibited a sharp expression level at 130 DAP (harvest stage with the large production of soluble sugars). In addition, IbSUS6 showed a low expression level during the entire growth and development of sweet potato. These results indicated that different IbSUSs might play important roles in the development and starch and sugar accumulation at different developmental stages of sweet potato storage roots.

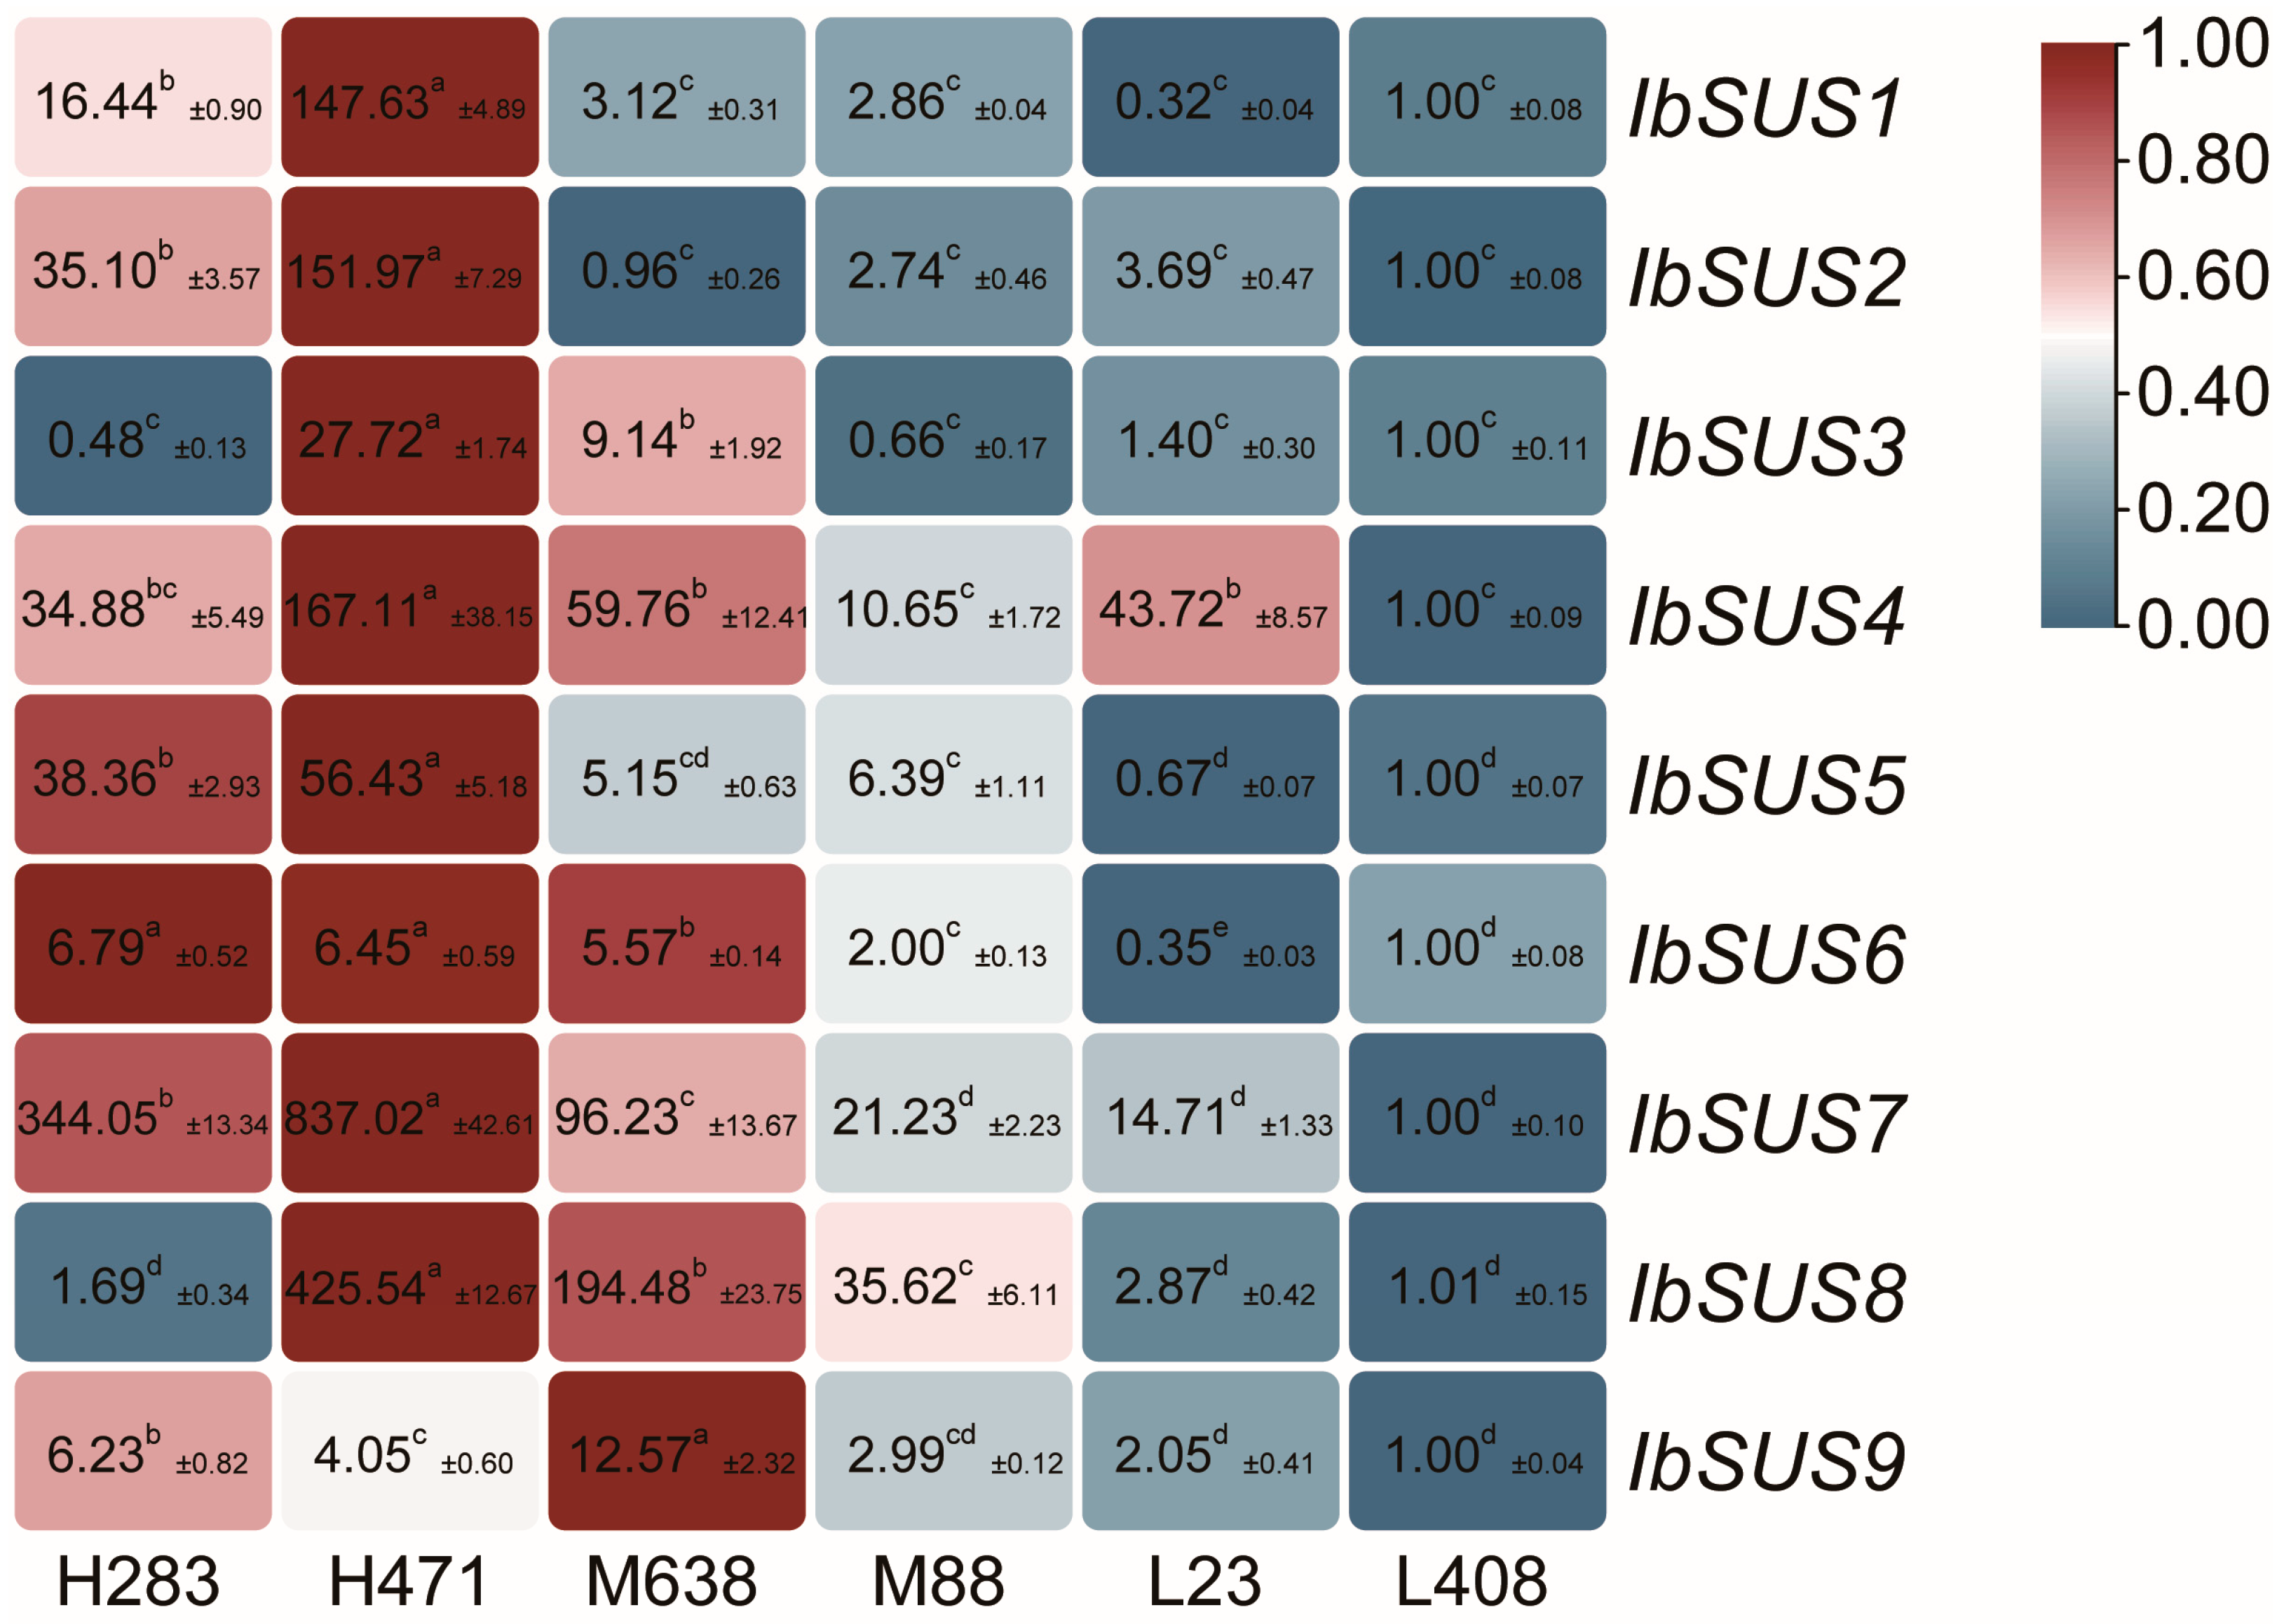
2.6.3. Expression Analysis in Sweet Potato Lines with Different Starch Contents

As described above, IbSUSs might take on important responsibilities for starch biosynthesis in sweet potatoes (Figure 5). To further investigate the roles of IbSUSs in starch biosynthesis of sweet potato, we analyzed the expression levels of IbSUSs in H283 and H471 with high starch content, M638 and M88 with medium starch content, and L23 and L408 with low starch content, which were selected from F1 individuals from a cross between Xushu 18 and Xu 781 [35]. As a whole, IbSUSs were highly expressed in the high starch lines, in particular, IbSUS1, IbSUS2, IbSUS5, IbSUS6, and IbSUS7 exhibited significantly higher expression levels in the high starch lines than in the medium/low starch lines. IbSUS3, IbSUS4, IbSUS8 and IbSUS9 had no obvious trend in expression (Figure 8).

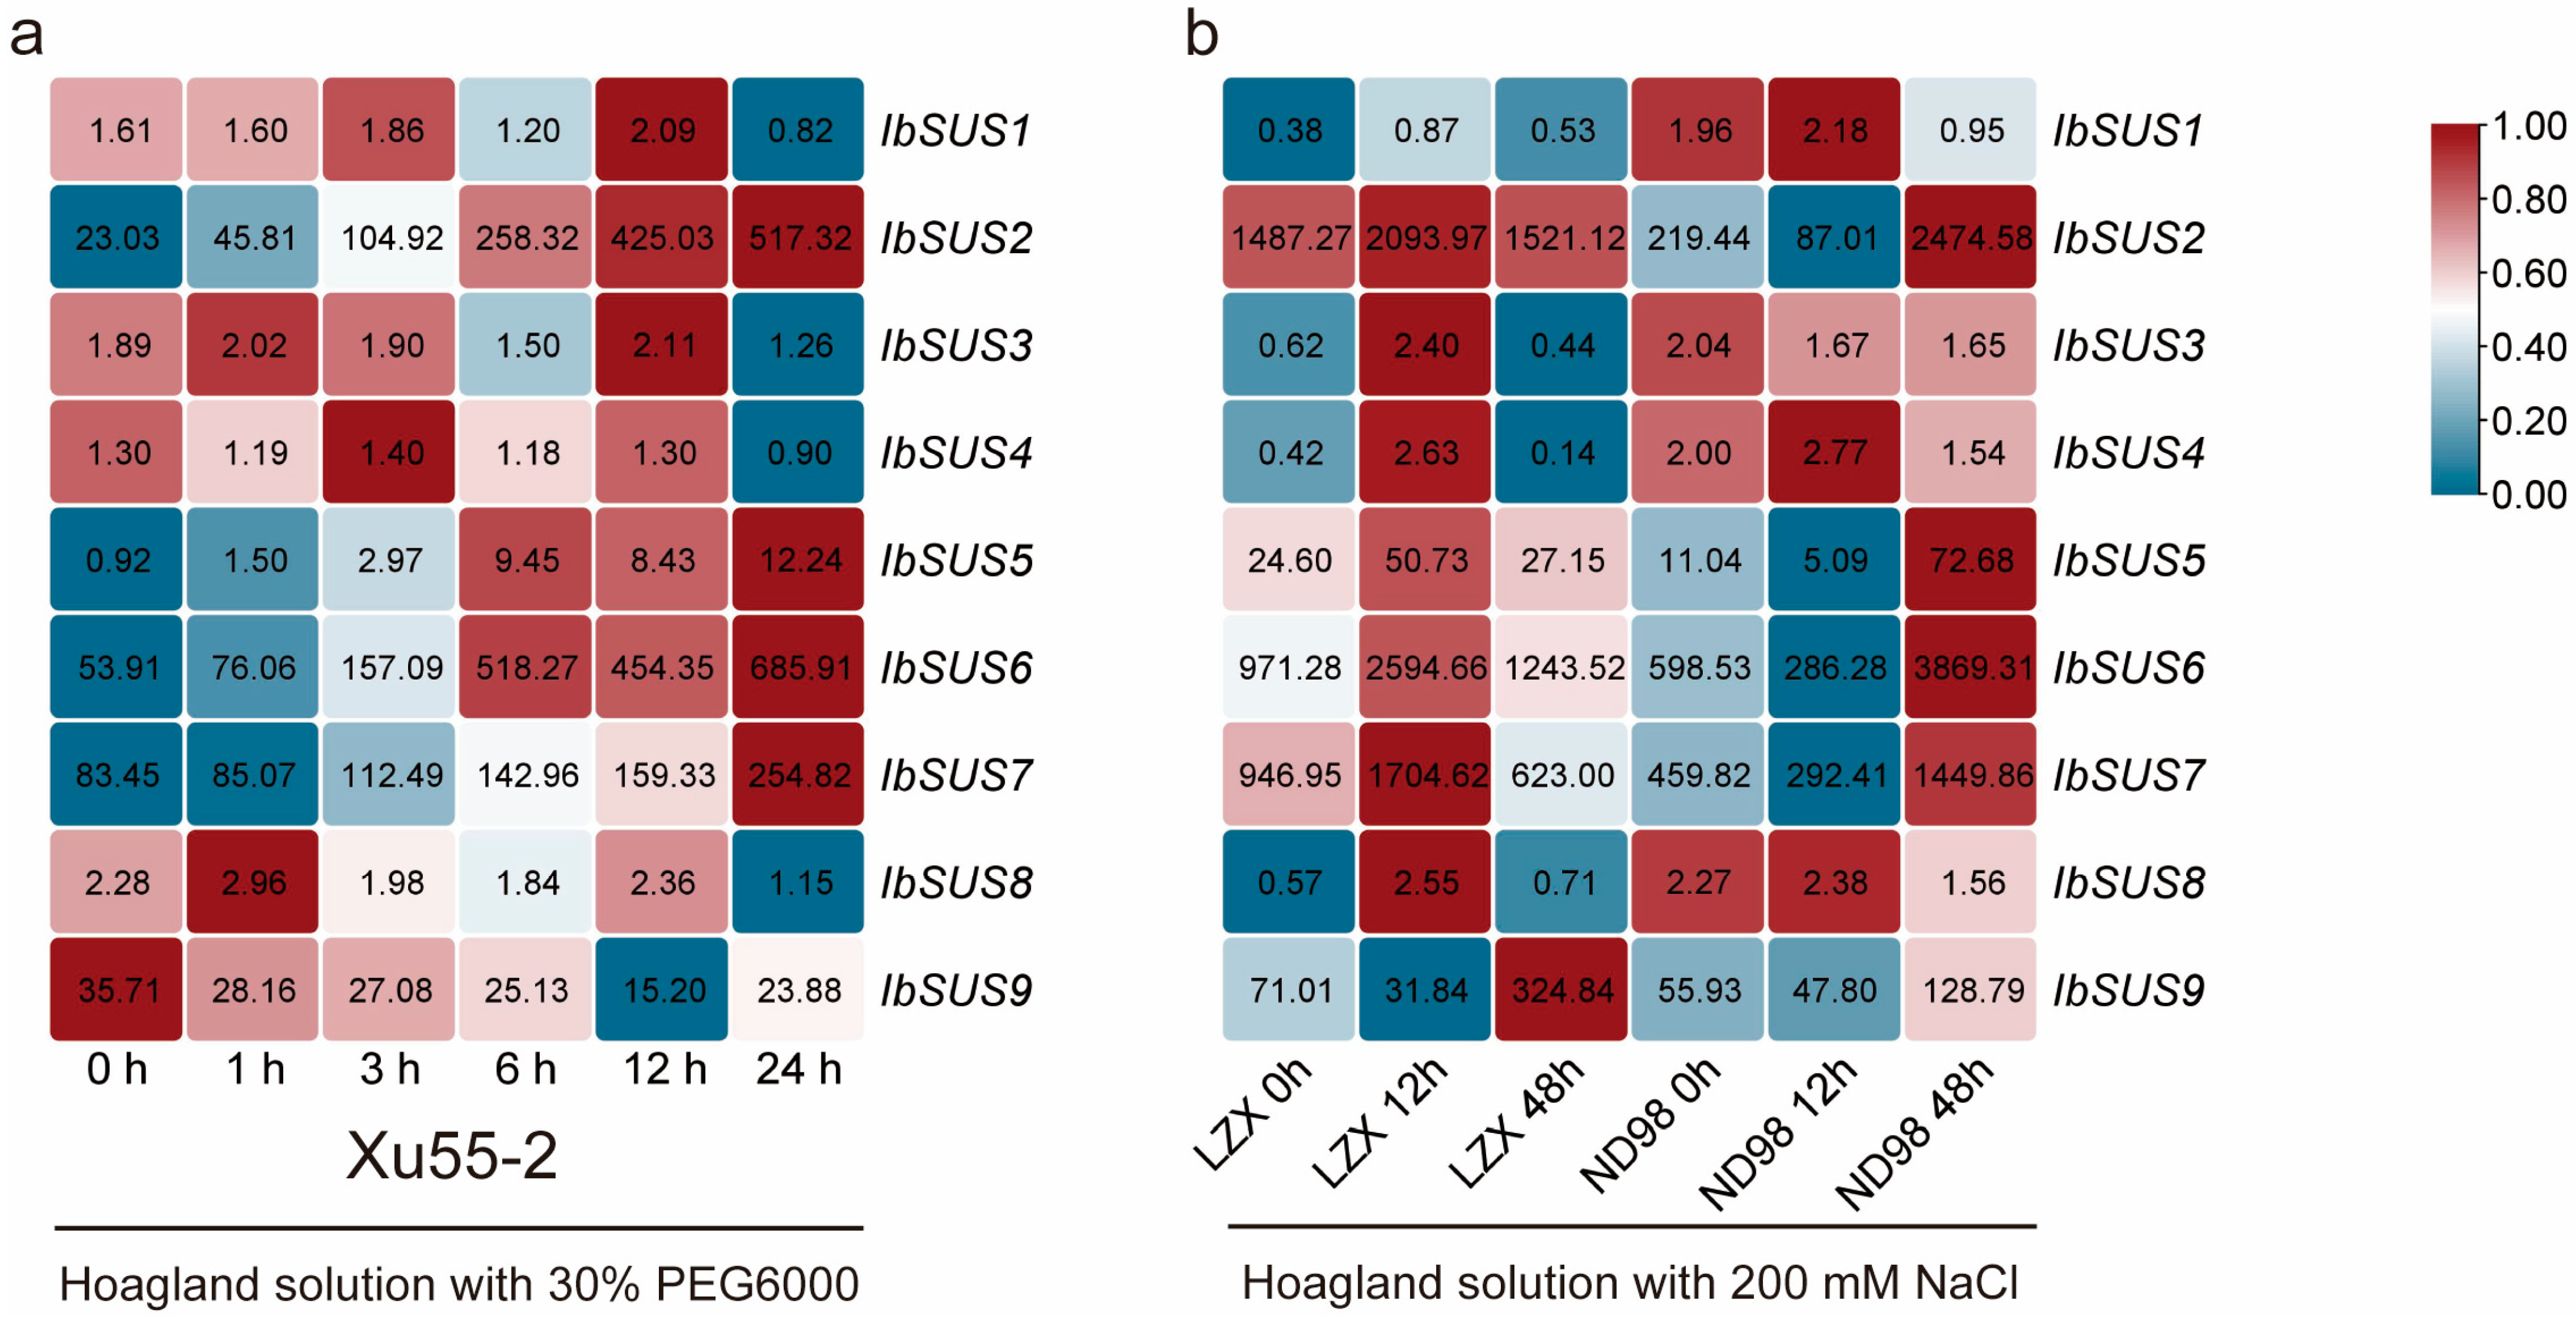
2.6.4. Expression Analysis under Drought and Salt Stresses

To investigate the potential roles of IbSUSs in drought and salt stress responses, the expression patterns of IbSUSs were analyzed using the RNA-seq data of a drought-tolerant line Xu55-2 under PEG6000 stress and the RNA-seq data of a salt-sensitive variety Lizixiang and a salt-tolerant line ND98 under NaCl stress [36,37]. Under PEG6000 stress, IbSUS2, IbSUS5, IbSUS6 and IbSUS7 were upregulated and others were downregulated or did not show significant changes in Xu55-2 (Figure 9). Under NaCl stress, IbSUS3, IbSUS4 and IbSUS8 were downregulated in ND98 and upregulated in Lizixiang and others were upregulated in both ND98 and Lizixiang (Figure 9).
Next, the expression patterns of ItfSUSs and ItbSUSs were analyzed using the RNA-seq data of I. trifida and I. triloba under drought and salt stresses [33]. In I. trifida, ItfSUS1 was upregulated only under NaCl stress, ItfSUS2, ItfSUS5 and ItfSUS6 were upregulated under mannitol and NaCl stresses and others were downregulated or did not show significant changes under mannitol and NaCl stresses (Figure S2). In I. triloba, ItbSUS2 and ItbSUS5 were upregulated under mannitol and NaCl stresses, ItbSUS6 was upregulated only under NaCl stress, and others were downregulated or did not show significant changes under mannitol and NaCl stresses (Figure S2). Taken together, these results indicated that some SUSs were involved in response to drought and salt stresses in sweet potato and its two diploid wild relatives.

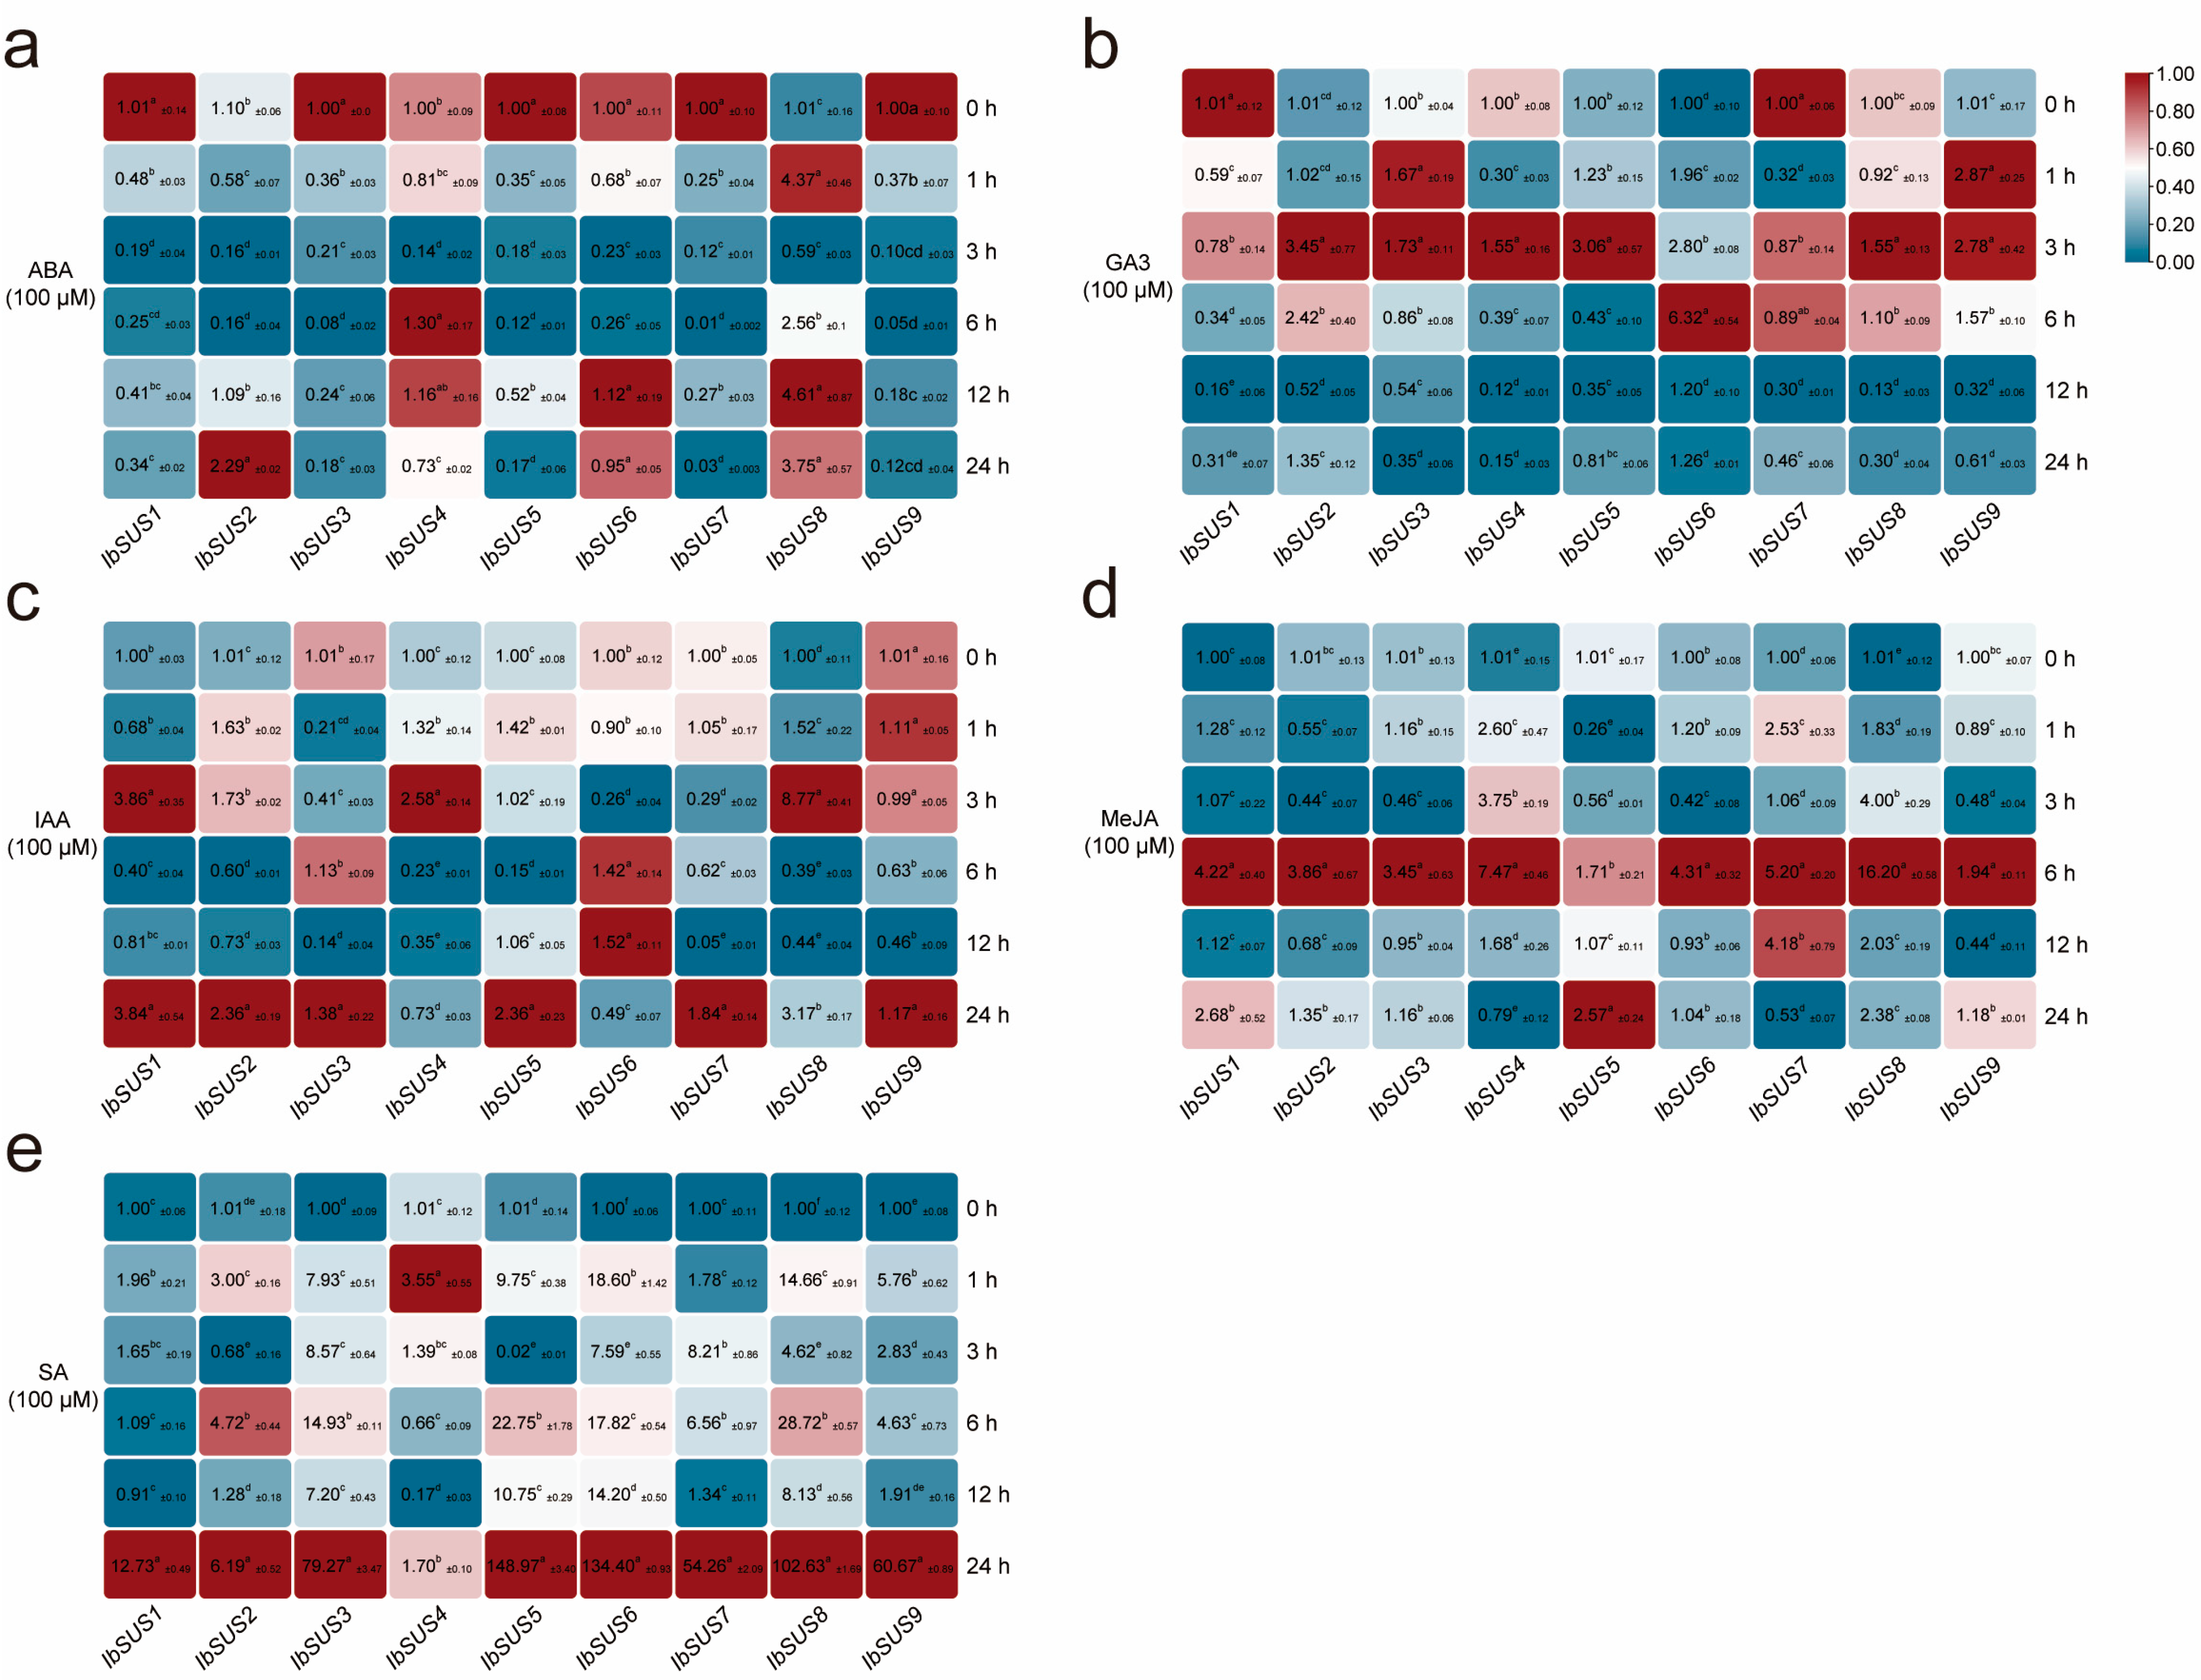
2.6.5. Expression Analysis in Response to Hormones

To analyze the potential biological functions of IbSUSs in the hormone crosstalk of sweet potato, we conducted qRT-PCR to evaluate the expression levels of IbSUSs in sweet potato line H283 in response to hormones, including ABA, GA3, IAA, MeJA, and SA (Figure 10). Under ABA treatment, IbSUS2 and IbSUS8 were upregulated and others were downregulated or did not show significant changes (Figure 10a). Under GA3 treatment, IbSUS2, IbSUS3, IbSUS4, IbSUS5, IbSUS6, IbSUS8 and IbSUS9 were upregulated and IbSUS1 and IbSUS7 were downregulated (Figure 10b). Under IAA treatment, IbSUS1, IbSUS2, IbSUS4, IbSUS5 and IbSUS8 were upregulated and others were downregulated or did not exhibit significant changes (Figure 10c). Under MeJA treatment, all IbSUSs were upregulated and their expression levels reached the peak at 6 h except IbSUS5 (Figure 10d). When treated with SA, all IbSUSs were upregulated and IbSUS4 peaked at1 h and others peaked at 24 h (Figure 10e).
The expression patterns of ItfSUSs and ItbSUSs were also analyzed using the RNA-seq data of I. trifida and I. triloba under ABA, GA3 and IAA treatments [33]. As shown in Figure S3, under ABA treatment, ItfSUS7 were downregulated and others were upregulated. Under GA3 treatment, ItfSUS1, ItfSUS3, ItfSUS4 and ItfSUS7 were upregulated and others were downregulated or did not show significant changes. All ItfSUSs were downregulated when treated with IAA. In I. triloba, ItbSUS1, ItbSUS2, ItbSUS4, ItbSUS5 and ItbSUS6 were upregulated, ItbSUS7 were downregulated, and ItbSUS3 showed no expression under ABA treatment. ItbSUS4, ItbSUS6 and ItbSUS7 were upregulated and others were downregulated or did not show significant changes by GA3. When treated with IAA, only ItbSUS2 was upregulated and others were downregulated (Figure S3). Therefore, these results indicated that different SUSs exhibited different expression profiles in response to hormones and they might participate in the crosstalk between various hormones in sweet potato and its two diploid relatives.

3. Discussion

3.1. Evolution of SUSs in Sweet Potato and Its Two Diploid Wild Relatives

In recent years, the SUS gene family has been identified in various plant species through comparative genome approaches. The genomes of model species Arabidopsis [11] and rice [13] both contain six SUSs. The number of SUSs is eight in diploid cotton (G. arboretum and G. raimondii) and 15 in tetraploid cotton (G. hirsutum), respectively, and it is thought that SUSs of G. hirsutum derived from those of its diploid ancestors and one SUS group underwent expansion during cotton evolution [14]. In our study, nine, seven, and seven SUSs were identified in I. batatas, I. trifida, and I. triloba, respectively. The number of SUSs identified in sweet potato was two more than that in its two diploid wild relatives. According to the chromosomal localization and phylogenetic relationships of SUSs, the homologs among I. batatas, I. trifida and I. triloba were located on similar sites (Figure 1 and Figure 2), suggesting that SUSs of sweet potato derived from those of its diploid ancestors. Two additional SUSs located on LG7 and LG13 in sweet potato were homologous to SUS3 and SUS5 in I. trifida and I. triloba, respectively. Based on the syntenic analysis (Figure 1d), we speculate that segmental and tandem duplications could lead to the increased copy number of SUSs in sweet potatoes, which might bring about functional redundancy and sub/neo-functionalization [38].
Furthermore, ten conserved motifs were identified in all of the SUSs except for IbSUS3, IbSUS5, and IbSUS6 (Figure 3a). IbSUS3 was homologous to IbSUS4, ItfSUS3, and ItbSUS3, but it did not have motif3. IbSUS5 and IbSUS6 were homologous to ItfSUS4 and ItbSUS4, but IbSUS5 lacked motif2 and motif9 and IbSUS6 lacked motif2. These results indicated that IbSUS3, IbSUS5 and IbSUS6 went through structure changes in the process of evolution, which might result in their functional differences.
Gene exon/intron structures are typically conserved among homologous genes of a gene family [39]. In our study, the majority of homologous SUSs had the same number of exons and introns in I. batatas, I. trifida and I. triloba, but some of them were different in exon-intron structures, for example, IbSUS1 (15 exons), ItfSUS1 (14 exons) and ItbSUS1 (14 exons) in Group II; IbSUS9 (14 exons), ItfSUS7 (13 exons) and ItbSUS7 (13 exons) in Group III; IbSUS5 (16 exons), IbSUS6 (13 exons), ItfSUS4 (12 exons) and ItbSUS4 (12 exons) in Group III (Figure 3b). Therefore, some IbSUSs have more exons than ItfSUSs and ItbSUSs, suggesting that exon-intron structures could lead to more functional diversification [40]. Taken together, these results reveal that IbSUSs are more complex in evolution and could participate in more biological processes compared with ItfSUSs and ItbSUSs.

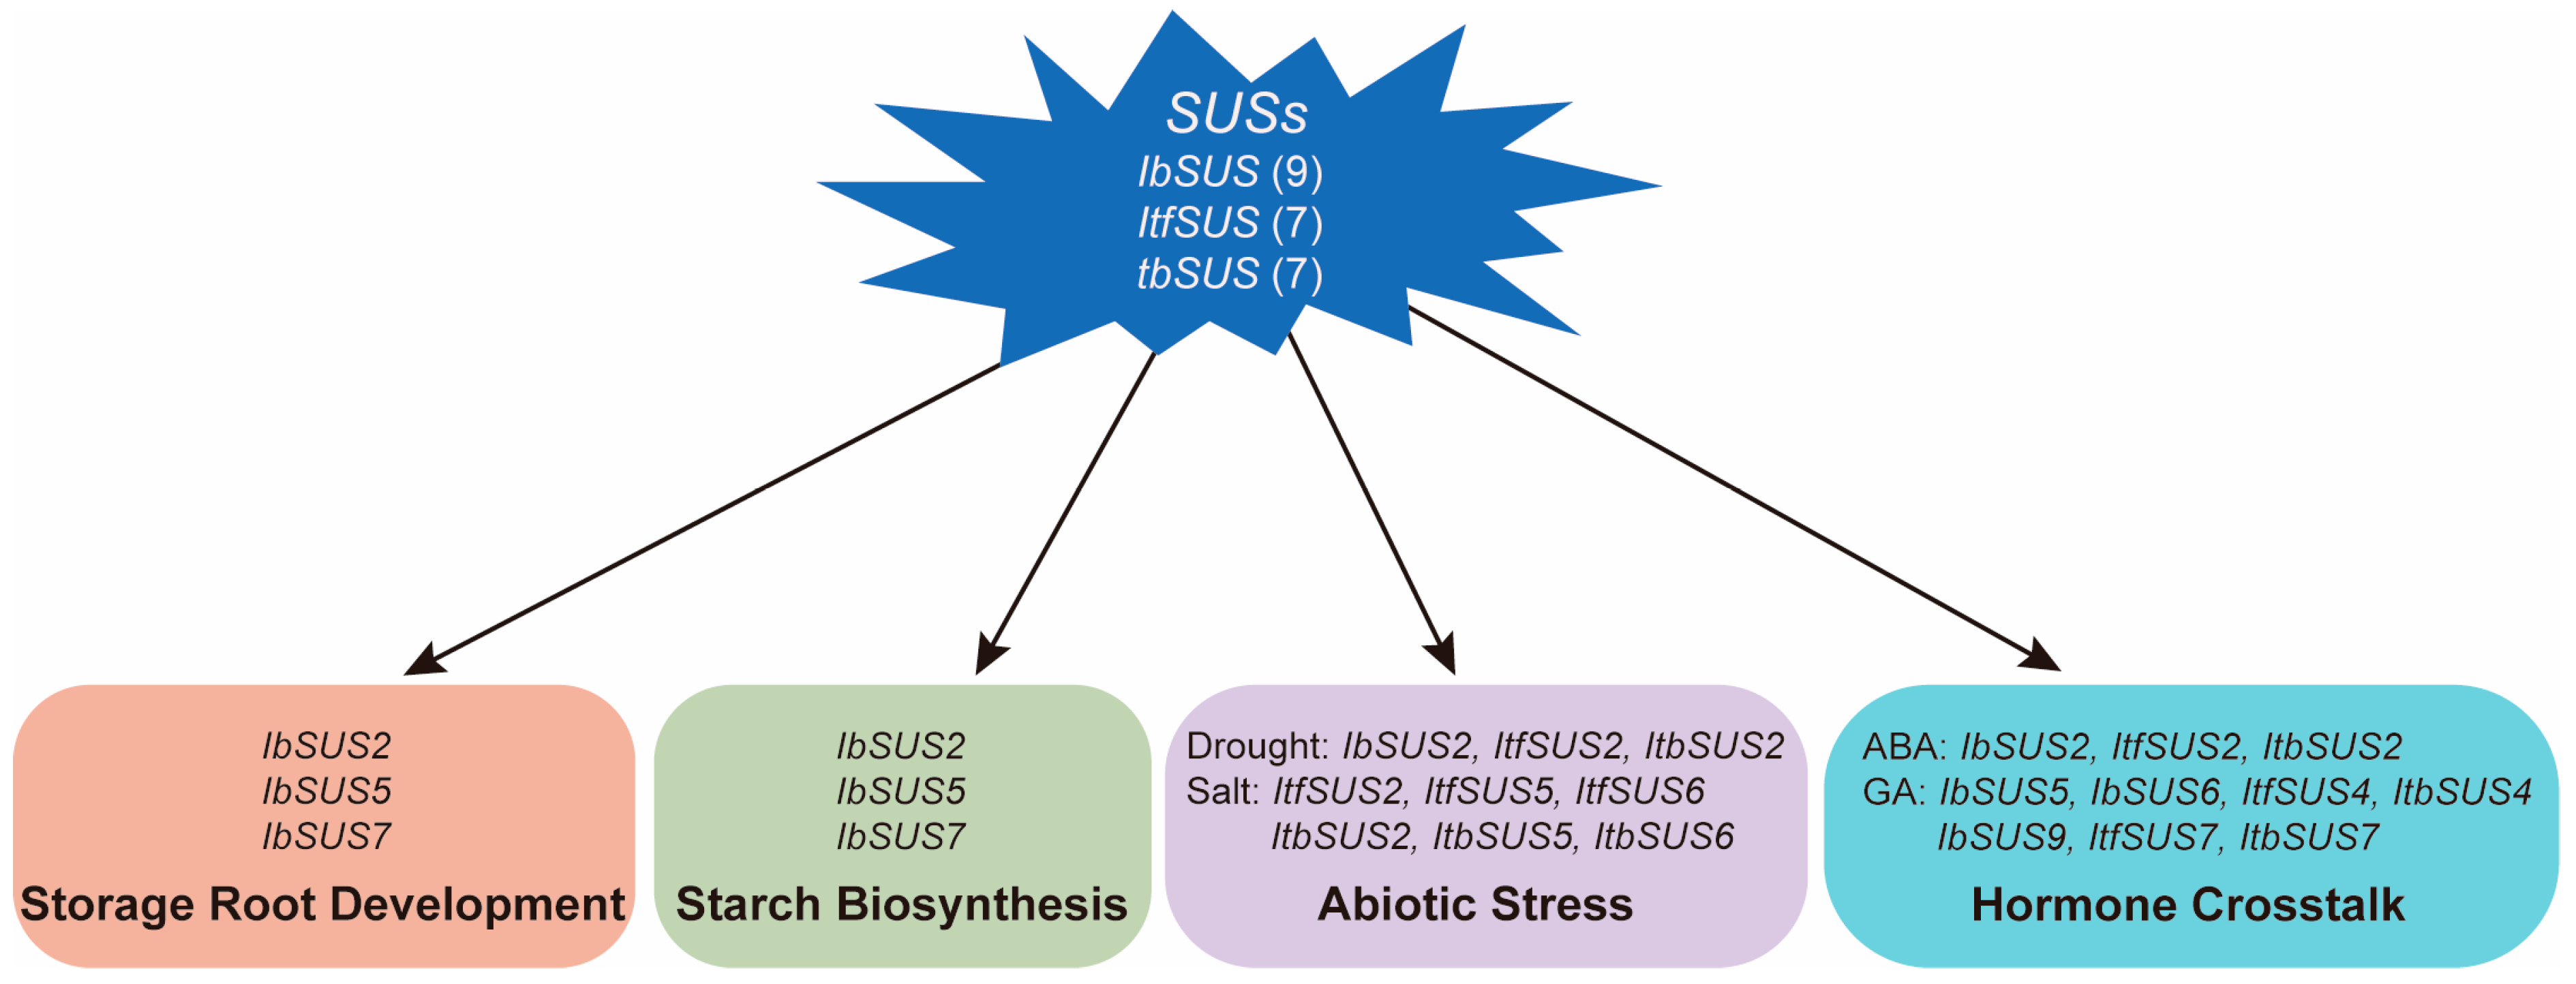
3.2. IbSUSs Are Involved in Storage Root Development and Starch Biosynthesis in Sweet Potato

As the marker for sink strength in plants, SUSs play important roles in sink organ development and their activities are generally much higher in developing seeds and fruits than in leaves [1]. In maize, ZmSUS1 mutant (sh1) had less starch content and weight in seeds, but the transactivation of Sus1 and Sus2 by endosperm-specific transcription factor Opaque2 (O2) could help the endosperm filling [11,20]. In potatoes, suppressed expression of StSUS4 decreased the tuber dry weight and starch content and enhanced StSUS4 activity increased the tuber yield and starch content [41,42]. Inhibition of the activity of SiSUS3 in tomatoes and CsSUS4 in cucumbers reduced the number, size and weight of flowers and fruits [43,44]. Overexpression of GhSUS2 in cotton and BeSUS5 in poplar enhanced cellulose production, cell wall thickness and fiber quality [25,27]. In addition, by controlling the channeling of incoming sucrose into starch and cell wall biosynthesis, different members of a given SUS family may play different roles in nonphotosynthetic cells. For instance, ZmSUS1 participated in starch biosynthesis in maize seed, ZmSUS2 contributed to endosperm cell wall biosynthesis, and ZmSUS3 may take part in the construction of basal endosperm transfer cells [11,22].
In this study, we discovered that IbSUSs could interact with many proteins related to storage root development and starch biosynthesis (Figure 5a). GO enrichment analysis showed that ‘starch biosynthetic process’ and ‘sucrose metabolic process’ were the dominant terms of these related proteins (Figure 5b). Because of this, IbSUSs may participate in storage root development and starch biosynthesis of sweet potatoes. Interestingly, SUSs in I. trifida and I. triloba were highly expressed in flower buds, flowers, root1 or stems (Figure 6). IbSUS2, IbSUS5, IbSUS6, IbSUS7 and IbSUS9 were highly expressed in storage roots, suggesting that they may be involved in starch biosynthesis of storage roots; IbSUS3, IbSUS4 and IbSUS8 were highly expressed in stems and may participate in transport and assimilation of carbohydrates (Figure 6).
As the most important harvest organ of sweet potato, storage roots are the main sink that accepts most carbohydrates. At different developmental stages of storage roots, IbSUSs exhibited different expression levels. IbSUS2, IbSUS4, IbSUS8 and IbSUS9 were highly expressed at 50 DAP; IbSUS4, IbSUS7, IbSUS8 and IbSUS9 were highly expressed during 80 to 90/100 DAP; IbSUS1, IbSUS3, and IbSUS5 were sharply expressed at 130 DAP (Figure 7). Meanwhile, IbSUS1, IbSUS2, IbSUS5, IbSUS6 and IbSUS7 exhibited much higher expression in the high starch lines than in the medium/low starch lines (Figure 8). Therefore, IbSUS2, IbSUS5 and IbSUS7 may play more important roles in storage root development and starch biosynthesis, which have the potential to be used for increasing yield and starch content in sweet potato.

3.3. SUSs Regulate Response to Drought and Salt Stresses in Sweet Potato and Its Two Diploid Wild Relatives

SUSs are reported to regulate plant response to drought stress. In Arabidopsis, drought treatment induced the expression of AtSS1 [11]. Two SUSs (HvSS1 and HvSS3) in barley and one SUS (HbSS5) in rubber trees significantly responded to drought stress [45,46]. However, there is no research indicating that SUSs regulate response to salt stress. In this study, ‘Response to abiotic stimulus’ was involved in GO enrichment (Figure 5b). Furthermore, IbSUS2, IbSUS5, IbSUS6 and IbSUS7 in sweet potato, ItfSUS2, ItfSUS5 and ItfSUS6 in I. trifida, and ItbSUS2 and ItbSUS5 in I. triloba were upregulated under drought stress (Figure 9 and Figure S2). Therefore, the SUSs, especially SUS2, may play crucial roles in response to drought stress in sweet potato and its two diploid relatives.
Under NaCl stress, IbSUS3, IbSUS4 and IbSUS8 were downregulated in ND98 but upregulated in Lizixiang and others were upregulated in both ND98 and Lizixiang (Figure 9). ItfSUS1, ItfSUS2, ItfSUS5 and ItfSUS6 in I. trifida and ItbSUS2, ItbSUS5 and ItbSUS6 in I. triloba were upregulated under NaCl stress (Figure S2). These results suggest that SUS2, SUS5 and SUS6 may regulate the response to salt stress in sweet potato and its two diploid relatives, but their salt tolerance function might have weakened during the evolution of sweet potato.

3.4. SUSs Participate in Hormone Crosstalk in Sweet Potato and Its Two Diploid Wild Relatives

In tomatoes, suppression of SlSUS1, SlSUS3 and SlSUS4 altered auxin signaling, indicating their possible roles in the regulation of plant growth and leaf morphology [47]. However, there is no report on SUSs regulating other hormones. In this research, we found abundant ABA-, JA-, and SA-responsive elements in the IbSUS promoters (Figure 4). The ItfSUSs and ItbSUSs promoters were also rich in these hormone-responsive elements (Figure 4). Furthermore, most of the IbSUSs were induced by ABA, GA3, IAA, MeJA and SA (Figure 10). Most of the ItfSUSs and ItbSUSs were also induced by ABA, GA3 and IAA (Figure S3). Especially, IbSUS2 and its homologous ItfSUS2 and ItbSUS2 were upregulated under ABA treatment; IbSUS5 and IbSUS6 and its homologous ItfSUS4 and ItbSUS4 and IbSUS9 and its homologous ItfSUS7 and ItbSUS7 were upregulated when treated with GA3. These results suggest that the SUSs may participate in the hormone crosstalk in sweet potato and its diploid wild relatives.

4. Materials and Methods

4.1. Identification of SUSs

All protein sequences of I. batatas, I. trifida and I. triloba were downloaded from the Ipomoea Genome Hub (https://ipomoea-genome.org/, accessed on 2 March 2023) and the Sweet potato Genomics Resource (http://sweetpotato.plantbiology.msu.edu/, accessed on 2 March 2023). The Hidden Markov Model (HMM) profiles of the core sucrose synthase domain (PF00862) and Glycosyltransferases domain (PF00534) from the Pfam database (http://pfam.xfam.org/, accessed on 2 March 2023) were downloaded and used to survey all SUS proteins in I. batatas, I. trifida and I. triloba. All the presumed SUSs were checked using SMART (http://smart.embl-heidelberg.de/, accessed on 2 March 2023) and Conserved Domains Database (CDD, https://www.ncbi.nlm.nih.gov/Structure/cdd/wrpsb.cgi, accessed on 2 March 2023).

4.2. Chromosomal Distribution of SUSs

IbSUSs, ItfSUSs and ItbSUSs were separately mapped to the I. batatas, I. trifida and I. triloba chromosomes based on the chromosomal locations provided in the Ipomoea Genome Hub (https://ipomoea-genome.org/, accessed on 2 March 2023) and Sweet potato Genomics Resource (http://sweetpotato.plantbiology.msu.edu/, accessed on 2 March 2023). The visualization was generated using the TBtools software v1.120 (South China Agricultural University, Guangzhou, China) [48].

4.3. Property Prediction of SUSs

The MW, theoretical pI, unstable index and hydrophilic of the SUSs were calculated using ExPASy (https://www.expasy.org/, accessed on 3 March 2023). The subcellular localization was predicted using WoLF PSORT (https://www.genscript.com/wolf-psort.html, accessed on 3 March 2023).

4.4. Phylogenetic Analysis of SUSs

The SUS sequences of A. thaliana, I. batatas, I. triloba, I. trifida, O. sativa and S. tuberosum were downloaded from the National Center for Biotechnology Information (https://www.ncbi.nlm.nih.gov/, accessed on 3 March 2023) and aligned with ClustalX. The aligned sequences were imported into MEGA11 to create a phylogenetic tree using the neighbor-joining method with 1000 bootstrap replicates [49]. The phylogenetic tree was constructed by iTOL (http://itol.embl.de/, accessed on 13 March 2023).

4.5. Domain Identification and Conserved Motif Analysis of SUSs

The conserved motifs of SUSs were analyzed using MEME software (https://meme-suite.org/meme/, accessed on 4 March 2023) and the maximum number of motif parameters was set to 10 [50]. The conserved domain structures of SUSs were visualized using the TBtools software v1.120 (South China Agricultural University, Guangzhou, China).

4.6. Exon–Intron Structure and Promoter Analyses of SUSs

The exon–intron structures of SUSs were obtained and visualized by the TBtools software v1.120 (South China Agricultural University, Guangzhou, China). The cis-elements in the approximately 2000 bp promoter regions of SUSs were predicted by PlantCARE (http://bioinformatics.psb.ugent.be/webtools/plantcare/html/, accessed on 4 March 2023) [51].

4.7. Protein Interaction Network and GO Enrichment Analysis of SUSs and Regulated Proteins

The protein interaction network of SUSs was built using STRING (https://cn.string-db.org/, accessed on 5 March 2023) based on Arabidopsis homologous proteins. The network map was constructed using Cytoscape 3.2 [52]. GO enrichment analysis of SUSs and regulated proteins was implemented using the cluster Profiler R package [53].

4.8. Transcriptome Analysis

The RNA-seq data used for expression analysis of SUSs in I. batatas were obtained at our laboratory [36,37] and those of SUSs in I. trifida and I. triloba were downloaded from the Sweet Potato Genomics Resource (http://sweetpotato.plantbiology.msu.edu/, accessed on 4 March 2023). The expression levels of SUSs were calculated as fragments per kilobase of exon per million fragments mapped (FPKM) and the heat maps of expression were constructed by TBtools software v1.120 (South China Agricultural University, Guangzhou, China).

4.9. qRT-PCR Analysis of SUSs

The storage roots of H283 sampled at the different development stages (20, 30, 40, 50, 60, 70, 80, 90, 100 and 130 DAP) and H283, H471, M638, M88, L23 and L408 sampled at 90 DAP were used for analyzing the expression of IbSUS. The leaves of the one-month-old in vitro-grown H283 plants were treated with 100 µM ABA, 100 µM GA3, 100 µM IAA, 100 µM MeJA and 100 µM SA, and then sampled at 0, 1, 3, 6, 12 and 24 h after treatment for expression analysis of IbSUSs in response to different hormones. The total RNA was extracted with the TRIzol method (Invitrogen, Carlsbad, CA, USA). The qRT-PCR was performed on a 7500 Real-Time PCR system (Applied Biosystems, Foster City, CA, USA) using the SYBR detection protocol (TaKaRa, Kyoto, Japan). Sweet potato actin gene (GenBank AY905538) was used as an internal control. The specific primers used for the qRT-PCR analysis were listed in Table S2. The values were determined from three biological replicates consisting of pools of three plants and analyzed using the comparative CT method [54]. The heat maps of the gene expression were constructed using the TBtools software v1.120 (South China Agricultural University, Guangzhou, China). The significant difference of each IbSUS was analyzed at p < 0.05 based on one-way ANOVA followed by posthoc Tukey’s test.

5. Conclusions

Nine, seven and seven SUSs were identified in the cultivated sweet potato and its two diploid wild relatives I. trifida and I. triloba, respectively. Their protein physicochemical properties, chromosomal localization, phylogenetic relationship, gene structure, promoter cis-elements, protein interaction network and expression patterns were systematically analyzed. Segmental and tandem duplications could lead to the increased copy number of SUSs in sweet potato, which might bring about functional redundancy and sub/neo-functionalization. IbSUSs have more exons than ItfSUSs and ItbSUSs which could participate in more biological processes compared with ItfSUSs and ItbSUSs. The SUSs were highly expressed in sink organs. IbSUSs might play vital roles in storage root development and starch biosynthesis in sweet potatoes and IbSUS2, IbSUS5 and IbSUS7 as candidate genes that can affect storage root development and starch biosynthesis are worth further research (Figure 11). Besides, the SUSs could also respond to drought and salt stress responses. However, the salt tolerance function of SUSs might have weakened during the evolution of sweet potatoes (Figure 11). They also took part in hormone crosstalk especially ABA and GA (Figure 11). This work provides valuable insights into the structure and function of SUSs and candidate genes for improving yield, starch content and abiotic stress tolerance in sweet potato.

Supplementary Materials

The following supporting information can be downloaded at: https://www.mdpi.com/article/10.3390/ijms241512493/s1.

Author Contributions

Q.L. and Z.J. conceived and designed the research. Z.J. performed the experiments. Z.J. and H.Z. (Huan Zhang) analyzed the data. Q.L. and Z.J. wrote the paper. H.Z. (Huan Zhang), S.G., H.Z. (Hong Zhai), S.H. and N.Z. revised the paper. All authors have read and agreed to the published version of the manuscript.

Funding

This work was supported by the National Natural Science Foundation of China (32072120), the Earmarked fund for CARS-10-Sweetpotato and the Beijing Food Crops Innovation Consortium Program (BAIC02-2023).

Institutional Review Board Statement

Not applicable.

Informed Consent Statement

Not applicable.

Data Availability Statement

The data presented in this study are available on request from the corresponding author.

Conflicts of Interest

The authors declare no conflict of interest.

References

  1. Ruan, Y.L. Sucrose metabolism: Gateway to diverse carbon use and sugar signaling. Annu. Rev. Plant Biol. 2014, 65, 33–67. [Google Scholar] [CrossRef] [PubMed]
  2. Zhu, X.D.; Wang, M.Q.; Li, X.P.; Jiu, S.T.; Wang, C.; Fang, J.G. Genome-wide analysis of the sucrose synthase gene family in grape (Vitis vinifera): Structure, evolution and expression profiles. Genes 2017, 8, 111. [Google Scholar] [CrossRef] [Green Version]
  3. Stein, O.; Granot, D. An overview of sucrose synthases in plants. Front. Plant Sci. 2019, 10, 95. [Google Scholar] [CrossRef] [PubMed] [Green Version]
  4. Yao, D.Y.; Gonzales-Vigil, E.; Mansfield, S.D. Arabidopsis sucrose synthase localization indicates a primary role in sucrose translocation in phloem. J. Exp. Bot. 2020, 71, 1858–1869. [Google Scholar] [CrossRef]
  5. Mathan, J.; Singh, A.; Ranjan, A. Sucrose transport and metabolism control carbon partitioning between stem and grain in rice. J. Exp. Bot. 2021, 72, 4355–4372. [Google Scholar] [CrossRef]
  6. Koch, K. Sucrose metabolism: Regulatory mechanisms and pivotal roles in sugar sensing and plant development. Curr. Opin. Plant Biol. 2004, 7, 235–246. [Google Scholar] [CrossRef] [PubMed]
  7. Paul, B.D.H.; Paul, D.; Kim, F.; Marilyn, P.; Wellner, N.; Lunn, J.; Feil, R.; Simpsona, C.; Maule, A.J.; Smith, A.M. Normal growth of Arabidopsis requires cytosolic invertase but not sucrose synthase. Proc. Natl. Acad. Sci. USA 2009, 106, 13124–13129. [Google Scholar]
  8. Zheng, Y.; Anderson, S.; Zhang, Y.; Garavito, R.M. The structure of sucrose synthase-1 from Arabidopsis thaliana and its functional implications. J. Biol. Chem. 2011, 286, 36108–36118. [Google Scholar] [CrossRef] [PubMed] [Green Version]
  9. Schmolzer, K.; Gutmann, A.; Diricks, M.; Desmet, T.; Nidetzky, B. Sucrose synthase: A unique glycosyltransferase for biocatalytic glycosylation process development. Biotechnol. Adv. 2016, 34, 88–111. [Google Scholar] [CrossRef]
  10. Angeles-Núñez, J.G.; Tiessen, A. Regulation of ATSUS2 and ATSUS3 by glucose and the transcription factor LEC2 in different tissues and at different stages of arabidopsis seed development. Plant Mol. Biol. 2012, 78, 377–392. [Google Scholar] [CrossRef]
  11. Baud, S.; Vaultier, M.N.; Rochat, C. Structure and expression profile of the sucrose synthase multigene family in Arabidopsis. J. Exp. Bot. 2004, 55, 397–409. [Google Scholar] [CrossRef]
  12. Duncan, K.A.; Hardin, S.C.; Huber, S.C. The three maize sucrose synthase isoforms differ in distribution, localization, and phosphorylation. Plant Cell Physiol. 2006, 47, 959–971. [Google Scholar] [CrossRef] [Green Version]
  13. Hirose, T.; Scofield, G.N.; Terao, T. An expression analysis profile for the entire sucrose synthase gene family in rice. Plant Sci. 2008, 174, 534–543. [Google Scholar] [CrossRef]
  14. Zou, C.; Lu, C.; Shang, H.; Jing, X.; Cheng, H.; Zhang, Y.; Song, G. Genome-wide analysis of the Sus gene family in cotton. J. Integr. Plant Biol. 2013, 55, 643–653. [Google Scholar] [CrossRef]
  15. An, X.; Chen, Z.; Wang, J.; Ye, M.; Ji, L.; Wang, J.; Liao, W.; Ma, H. Identification and characterization of the Populus sucrose synthase gene family. Gene 2014, 539, 58–67. [Google Scholar] [CrossRef]
  16. Fu, H.; Park, W.D. Sink- and vascular-associated sucrose synthase functions are encoded by different gene classes in potato. Plant Cell 1995, 7, 1369–1385. [Google Scholar]
  17. Biemelt, S.; Hajirezaei, M.R.; Melzer, M.; Albrecht, G.; Sonnewald, U. Sucrose synthase activity does not restrict glycolysis in roots of transgenic potato plants under hypoxic conditions. Planta 1999, 210, 41–49. [Google Scholar] [CrossRef]
  18. Chourey, P.S.; Taliercio, E.W.; Carlson, S.J.; Ruan, Y.L. Genetic evidence that the two isozymes of sucrose synthase present in developing maize endosperm are critical, one for cell wall integrity and the other for starch biosynthesis. Mol. Gen. Genet. 1998, 259, 88–96. [Google Scholar] [CrossRef] [PubMed]
  19. Ricard, B.; Toai, T.V.; Chourey, P.; Saglio, P. Evidence for the critical role of sucrose synthase for anoxic tolerance of maize roots using a double mutant. Plant Physiol. 1998, 116, 1323–1331. [Google Scholar] [CrossRef] [PubMed] [Green Version]
  20. Deng, Y.T.; Wang, J.C.; Zhang, Z.Y.; Wu, Y.R. Transactivation of Sus1 and Sus2 by Opaque2 is an essential supplement to sucrose synthase-mediated endosperm filling in maize. Plant Biotechnol. J. 2020, 18, 1897–1907. [Google Scholar] [CrossRef] [PubMed] [Green Version]
  21. Fallahi, H.; Scofield, G.N.; Badger, M.R.; Chow, W.S.; Furbank, R.T.; Ruan, Y.L. Localization of sucrose synthase in developing seed and siliques of Arabidopsis thaliana reveals diverse roles for SUS during development. J. Exp. Bot. 2008, 59, 3283–3295. [Google Scholar] [CrossRef] [Green Version]
  22. Baroja-Fernández, E.; Muñoz, F.J.; Li, J.; Bahaji, A.; Almagro, G.; Montero, M.; Etxeberria, E.; Hidalgo, M.; Sesma, M.T.; Pozueta-Romero, J. Sucrose synthase activity in the sus1/sus2/sus3/sus4 Arabidopsis mutant is sufficient to support normal cellulose and starch production. Proc. Natl. Acad. Sci. USA 2012, 109, 321–326. [Google Scholar] [CrossRef] [PubMed]
  23. Piro, L.; Flütsch, S.; Santelia, D. Arabidopsis Sucrose Synthase 3 (SUS3) regulates starch accumulation in guard cells at the end of day. Plant Signal. Behav. 2023, 18, e2171614. [Google Scholar] [CrossRef] [PubMed]
  24. Xu, S.M.; Brill, E.; Llewellyn, D.J.; Furbank, R.T.; Ruan, Y.L. Overexpression of a potato sucrose synthase gene in cotton accelerates leaf expansion, reduces seed abortion, and enhances fiber production. Mol. Plant 2012, 5, 430–441. [Google Scholar] [CrossRef] [Green Version]
  25. Wang, Y.; Li, Y.; Cheng, F.; Zhang, S.P.; Zheng, Y.; Li, Y.; Li, X.B. Comparative phosphoproteomic analysis reveals that phosphorylation of sucrose synthase GhSUS2 by Ca2+-dependent protein kinases GhCPK84/93 affects cotton fiber development. J. Exp. Bot. 2023, 74, 1836–1852. [Google Scholar] [CrossRef] [PubMed]
  26. Takehara, K.; Murata, K.; Yamaguchi, T.; Yamaguchi, K.; Chaya, G.; Kido, S.; Iwasaki, Y.; Ogiwara, H.; Ebitani, T.; Miura, K. Thermo-responsive allele of sucrose synthase 3 (Sus3) provides high temperature tolerance during the ripening stage in rice (Oryza sativa L.). Breed. Sci. 2018, 68, 336–342. [Google Scholar] [CrossRef] [PubMed] [Green Version]
  27. Huang, Y.; Wang, L.L.; Hu, S.L.; Luo, X.G.; Cao, Y. Overexpression of the bamboo sucrose synthase gene (BeSUS5) improves cellulose production, cell wall thickness and fiber quality in transgenic poplar. Tree Genet. Genomes 2020, 16, 75. [Google Scholar] [CrossRef]
  28. Liu, Q.C. Improvement for agronomically important traits by gene engineering in sweetpotato. Breed. Sci. 2017, 67, 15–26. [Google Scholar] [CrossRef] [Green Version]
  29. Zhang, H.; Zhang, Q.; Zhai, H.; Gao, S.; Yang, L.; Wang, Z.; Xu, Y.; Huo, J.; Ren, Z.; Zhao, N.; et al. IbBBX24 promotes the jasmonic acid pathway and enhances fusarium wilt resistance in sweet potato. Plant Cell 2020, 32, 1102–1123. [Google Scholar] [CrossRef]
  30. Xue, L.Y.; Wei, Z.H.; Zhai, H.; Xing, S.H.; Wang, Y.X.; He, S.Z.; Gao, S.P.; Zhao, N.; Zhang, H.; Liu, Q.C. The IbPYL8-IbbHLH66-IbbHLH118 complex mediates the abscisic acid-dependent drought response in sweet potato. New Phytol. 2022, 236, 2151–2171. [Google Scholar] [CrossRef]
  31. Lai, Y.C.; Wang, S.Y.; Gao, H.Y.; Nguyen, K.M.; Nguyen, C.H.; Shih, M.C.; Lin, K.H. Physicochemical properties of starches and expression and activity of starch biosynthesis-related genes in sweet potatoes. Food Chem. 2016, 199, 556–564. [Google Scholar] [CrossRef]
  32. Yang, J.; Moeinzadeh, M.H.; Kuhl, H.; Helmuth, J.; Xiao, P.; Haas, S.; Liu, G.; Zheng, J.; Sun, Z.; Fan, W.; et al. Haplotype-resolved sweet potato genome traces back its hexaploidization history. Nat. Plants 2017, 3, 696–703. [Google Scholar] [CrossRef] [PubMed]
  33. Wu, S.; Lau, K.H.; Cao, Q.; Hamilton, J.P.; Sun, H.; Zhou, C.; Eserman, L.; Gemenet, D.C.; Olukolu, B.A.; Wang, H.; et al. Genome sequences of two diploid wild relatives of cultivated sweetpotato reveal targets for genetic improvement. Nat. Commun. 2018, 9, 4580. [Google Scholar] [CrossRef] [PubMed] [Green Version]
  34. Zhang, W.; Xin, S.; Huang, Z.; Zhu, Z.; Si, C.; Chen, Y.; Zhu, G.; Liu, Y. Identification of key sucrose-degrading enzymes and the relevant gene family members in the development of sweetpotato storage roots. Chin. J. Trop. Crops 2022, 43, 1535–1544. [Google Scholar]
  35. Zheng, C.X.; Jiang, Z.C.; Meng, Y.S.; Yu, J.; Yang, X.S.; Zhang, H.; Zhao, N.; He, S.Z.; Gao, S.P.; Zhai, H.; et al. Construction of a high-density SSR genetic linkage map and identification of QTL for storage-root yield and dry-matter content in sweetpotato. Crop J. 2023, 11, 963–967. [Google Scholar] [CrossRef]
  36. Zhu, H.; Zhou, Y.Y.; Zhai, H.; He, S.Z.; Zhao, N.; Liu, Q.C. Transcriptome profiling reveals insights into the molecular mechanism of drought tolerance in sweetpotato. J. Integr. Agric. 2019, 18, 9–23. [Google Scholar] [CrossRef]
  37. Zhang, H.; Zhang, Q.; Zhai, H.; Li, Y.; Wang, X.; Liu, Q.; He, S. Transcript profile analysis reveals important roles of jasmonic acid signalling pathway in the response of sweet potato to salt stress. Sci. Rep. 2017, 7, 202–208. [Google Scholar] [CrossRef] [PubMed] [Green Version]
  38. Cannon, S.B.; Mitra, A.; Baumgarten, A.; Young, N.D.; May, G. The roles of segmental and tandem gene duplication in the evolution of large gene families in Arabidopsis thaliana. BMC Plant Biol. 2004, 4, 10. [Google Scholar] [CrossRef] [Green Version]
  39. Frugoli, J.A.; McPeek, M.A.; Thomas, T.L.; McClung, C.R. Intron loss and gain during evolution of the catalase gene family in angiosperms. Genetics 1998, 149, 355–365. [Google Scholar] [CrossRef]
  40. Lecharny, A.; Boudet, N.; Gy, I.; Aubourg, S.; Kreis, M. Introns in, introns out in plant gene families: A genomic approach of the dynamics of gene structure. J. Struct. Funct. Genom. 2003, 3, 111–116. [Google Scholar] [CrossRef]
  41. Zrenner, R.; Salanoubat, M.; Willmitzer, L.; Sonnewald, U. Evidence of the crucial role of sucrose synthase for sink strength using transgenic potato plants (Solanum tuberosum L.). Plant J. 1995, 7, 97–107. [Google Scholar] [CrossRef]
  42. Baroja-Fernández, E.; Muñoz, F.J.; Montero, M.; Etxeberria, E.; Sesma, M.T.; Ovecka, M.; Bahaji, A.; Ezquer, I.; Li, J.; Prat, S.; et al. Enhancing sucrose synthase activity in transgenic potato (Solanum tuberosum L.) tubers results in increased levels of starch, ADP glucose and UDP glucose and total yield. Plant Cell Physiol. 2009, 50, 1651–1662. [Google Scholar] [CrossRef] [PubMed]
  43. D’Aoust, M.A.; Yelle, S.; Nguyen-Quoc, B. Antisense inhibition of tomato fruit sucrose synthase decreases fruit setting and the sucrose unloading capacity of young fruit. Plant Cell 1999, 11, 2407–2418. [Google Scholar] [CrossRef] [PubMed] [Green Version]
  44. Fan, J.W.; Wang, H.Y.; Li, X.; Sui, X.L.; Zhang, Z.X. Downregulating cucumber sucrose synthase 4 (CsSUS4) suppresses the growth and development of flowers and fruits. Plant Cell Physiol. 2018, 60, 752–764. [Google Scholar] [CrossRef] [PubMed]
  45. Xiao, X.H.; Tang, C.R.; Fang, Y.J.; Yang, M.; Zhou, B.H.; Qi, J.; Zhang, Y. Structure and expression profile of the sucrose synthase gene family in the rubber tree: Indicative of roles in stress response and sucrose utilization in the laticifers. FEBS J. 2014, 281, 291–305. [Google Scholar] [CrossRef] [Green Version]
  46. Barrero, S.C.; Hernando, A.S.; Gonzalez, M.P.; Carbonero, P. Structure, expression profile and subcellular localisation of four different sucrose synthase genes from barley. Planta 2011, 234, 391–403. [Google Scholar] [CrossRef] [Green Version]
  47. Goren, S.; Lugassi, N.; Stein, O.; Yeselson, Y.; Schaffer, A.A.; David-Schwartz, R.; Granot, D. Suppression of sucrose synthase affects auxin signaling and leaf morphology in tomato. PLoS ONE 2017, 12, e0182334. [Google Scholar] [CrossRef] [Green Version]
  48. Chen, C.; Chen, H.; Zhang, Y.; Thomas, H.R.; Frank, M.H.; He, Y.; Xia, R. TBtools: An integrative toolkit developed for interactive analyses of big biological data. Mol. Plant 2020, 13, 1194–1202. [Google Scholar] [CrossRef]
  49. Thompson, J.D.; Gibson, T.J.; Plewniak, F.; Jeanmougin, F.; Higgins, D.G. The Clustal_X windows interface: Flexible strategies for multiple sequence alignment aided by quality analysis Tools. Nucleic Acids Res. 1997, 25, 4876–4882. [Google Scholar] [CrossRef] [Green Version]
  50. Bailey, T.L.; Johnson, J.; Grant, C.E.; Noble, W.S. The MEME Suite. Nucleic Acids Res. 2015, 43, W39–W49. [Google Scholar] [CrossRef] [Green Version]
  51. Lescot, M.; Dehais, P.; Thijs, G.; Marchal, K.; Moreau, Y.; Van de Peer, Y.; Rouze, P.; Rombauts, S. PlantCARE, a database of plant cis-acting regulatory elements and a portal to tools for in silico analysis of promoter sequences. Nucleic Acids Res. 2002, 30, 325–327. [Google Scholar] [CrossRef] [PubMed]
  52. Kohl, M.; Wiese, S.; Warscheid, B. Cytoscape: Software for visualization and analysis of biological networks. Methods Mol. Biol. 2011, 696, 291–303. [Google Scholar] [PubMed]
  53. Young, M.D.; Wakefield, M.J.; Smyth, G.K.; Oshlack, A. Gene ontology analysis for RNA-seq: Accounting for selection bias. Genome Biol. 2010, 11, R14. [Google Scholar] [CrossRef] [PubMed] [Green Version]
  54. Schmittgen, T.D.; Livak, K.J. Analyzing real-time PCR data by the comparative C-T method. Nat. Protoc. 2008, 3, 1101–1108. [Google Scholar] [CrossRef] [PubMed]
Figure 1. Chromosomal localization and distribution of SUSs in I. batatas (a), I. trifida (b), and I. triloba (c). The bars represent chromosomes. The chromosome numbers are displayed on the left side, and the gene names are displayed on the right side. The relative chromosomal localization of each SUS gene is marked on the black line of the right side and indicated by the unit Mbp. (d) Syntenic analysis of I. batatas, I. trifida and I. triloba SUSs. Chromosomes of I. batatas, I. trifida and I. triloba are shown in different colors. The approximate positions of IbSUSs, ItfSUSs and ItbSUSs are marked with short black lines on the chromosomes. Red curves denote the syntenic relationships between I. batatas and I. trifida SUSs.
Ijms 24 12493 g001
Figure 2. Phylogenetic analysis of SUSs in I. batatas, I. triloba, I. trifida, A. thaliana, O. sativa and S. tuberosum. Based on the evolutionary distance, a total of 43 SUSs were divided into three groups (groups I, II, and III, filled with green, blue, and orange, respectively). The claret stars represent nine IbSUSs in I. batatas. The dark blue triangles represent seven ItfSUSs in I. trifida. The brown check marks represent seven ItbSUSs in I. triloba. The purple squares represent six AtSUSs in A. thaliana. The orange circles represent six OsSUSs in O. sativa. The green triangles represent seven StSUSs in S. tuberosum.
Ijms 24 12493 g002
Figure 3. Conserved motifs and exon–intron structure analysis of SUSs in I. batatas, I. trifida, and I. triloba. (a) The phylogenetic tree showed that SUSs were divided into three subgroups and the ten conserved motifs were shown in different colors. The brown circles represent IbSUSs. (b) Exon–intron structures of SUSs. The green boxes, yellow boxes, and black lines represent UTRs, exons and introns, respectively.
Ijms 24 12493 g003
Figure 4. Cis-element analysis in the promoters of SUSs from I. batatas, I. trifida and I. tri loba. The cis-elements were divided into six broad categories. The degree of red colors represents the number of cis-elements in the promoters of SUSs.
Ijms 24 12493 g004
Figure 5. Functional interaction networks of IbSUSs in I. batatas according to orthologues in Arabidopsis and GO enrichment analysis of proteins in networks. (a) Network nodes represent proteins, and lines represent protein–protein associations. The thickness and color of lines represent the interaction strength. (b) GO enrichment analysis of proteins included in networks. Fisher’s exact test is used to perform GO pathway enrichment analysis. Significantly enriched KEGG pathways (p < 0.05) are shown.
Ijms 24 12493 g005
Figure 6. Expression analysis of SUSs in different tissues of I. batatas, I. trifida, and I. triloba using RNA-seq. (a) Expression patterns of IbSUSs in the leaf, stem, fibrous root and storage root of I. batatas. (b) Expression patterns of ItfSUSs in the flower bud, flower, leaf, stem, root1 and root2 of I. trifida. (c) Expression patterns of ItbSUSs in the flower bud, flower, leaf, stem, root1 and root2 of I. triloba. The FPKM values are shown in the boxes.
Ijms 24 12493 g006
Figure 7. Expression analysis of IbSUSs at different developmental stages of the H283 storage roots (i.e., 20, 30, 40, 50, 60, 70, 80, 90, 100 and 130 DAP) using qRT-PCR. The values were determined by qRT-PCR from three biological replicates consisting of pools of three plants and the results were analyzed using the comparative CT method. The expression level at 20 DAP is determined as “1”. Fold change ± SD is shown in the boxes. Different lowercase letters indicate a significant difference of each IbSUS at p < 0.05 based on one-way ANOVA followed by posthoc Tukey’s test.
Ijms 24 12493 g007
Figure 8. Expression analysis of IbSUSs in sweet potato lines with different starch contents. The values were determined by qRT-PCR from three biological replicates consisting of pools of three plants and the results were analyzed using the comparative CT method. The expression level of L408 is considered as “1”. Fold change ± SD is shown in the boxes. Different lowercase letters indicate a significant difference of each IbSUS at p < 0.05 based on one-way ANOVA followed by post-hoc Tukey’s test.
Ijms 24 12493 g008
Figure 9. Expression analysis of IbSUSs in sweet potato under drought and salt stresses as determined by RNA-seq. (a) Expression analysis of IbSUSs in the drought-tolerant line Xu55-2 under PEG6000 stress. (b) Expression analysis of IbSUSs in the salt-sensitive variety Lizixiang (LZX) and salt-tolerant line ND98 under NaCl stress. The FPKM values are shown in the boxes.
Ijms 24 12493 g009
Figure 10. Expression analysis of IbSUSs in response to different hormones in sweet potato line H283. (a) ABA. (b) GA3. (c) IAA. (d) MeJA. (e) SA. The values were determined by qRT-PCR from three biological replicates consisting of pools of three plants and the results were analyzed using the comparative CT method. The expression at 0 h in each treatment is determined as “1”. Fold change ± SD is shown in the boxes. Different lowercase letters indicate a significant difference of each IbSUS at p < 0.05 based on one-way ANOVA followed by posthoc Tukey’s test.
Ijms 24 12493 g010
Figure 11. A conclusive graph of functions of SUSs in sweet potato and its two diploid wild relatives I. trifida and I. triloba.
Ijms 24 12493 g011
Table 1. Characteristics of SUSs in I. batatas, I. trifida and I. triloba.
Gene IDGene NameGenomic
Length (bp)
CDS
(bp)
Protein Size (aa)MW (kDa)pIInstabilityGRAVYSubcellular
Location
g505IbSUS14689264988299.996.2140.26−0.312cytoplasm
g5497IbSUS26116243681192.136.0238.17−0.275chloroplast
g29617IbSUS34187251483794.756.1436.59−0.351cytoplasm
g30039IbSUS44091252083994.956.3338.73−0.33cytoplasm
g31210IbSUS54954223274384.786.1136.16−0.202plastid
g55056IbSUS64794229276387.826.1733.53−0.298mitochondria
g55074IbSUS75591255685197.496.1638.91−0.256mitochondria
g55342IbSUS841252721906101.586.9939.82−0.214chloroplast
g60893IbSUS94931229276387.76.1835.82−0.261cytoplasm
itf05g23040ItfSUS14648251183694.866.0238.89−0.326cytoplasm
itf04g24160ItfSUS26346243681192.215.9937.62−0.281chloroplast
itf03g05100ItfSUS34194252083994.886.2239.2−0.336cytoplasm
itf11g07860ItfSUS45265241880592.605.9334.11−0.279cytoplasm
itf02g04900ItfSUS54342267989299.896.4038.81−0.248chloroplast
itf02g07130ItfSUS65723241880592.495.9535.03−0.25cytoplasm
itf06g18950ItfSUS75052241880592.715.9633.65−0.27cytoplasm
itb05g23720ItbSUS15077250883594.886.1038.94−0.332cytoplasm
itb04g23580ItbSUS26536243681192.096.0238−0.277chloroplast
itb03g05100ItbSUS34547247282393.276.3038.87−0.325chloroplast
itb11g08290ItbSUS45524241880592.586.0233.8−0.271cytoplasm
itb02g00230ItbSUS54028266488799.296.5137.07−0.236chloroplast
itb02g02420ItbSUS65760241880592.465.9335.3−0.241cytoplasm
itb06g17400ItbSUS75052241880592.745.9633.76−0.267cytoplasm
CDS, coding sequence; MW, molecular weight; pI, isoelectric point; GRAVY, grand average of hydropathicity.
Disclaimer/Publisher’s Note: The statements, opinions and data contained in all publications are solely those of the individual author(s) and contributor(s) and not of MDPI and/or the editor(s). MDPI and/or the editor(s) disclaim responsibility for any injury to people or property resulting from any ideas, methods, instructions or products referred to in the content.

