
Differential Responses of Retinal Neurons and Glia Revealed via Proteomic Analysis on Primary and Secondary Retinal Ganglion Cell Degeneration

 , , , , , and
Abstract
:1. Introduction
2. Results
3. Discussion
4. Materials and Methods
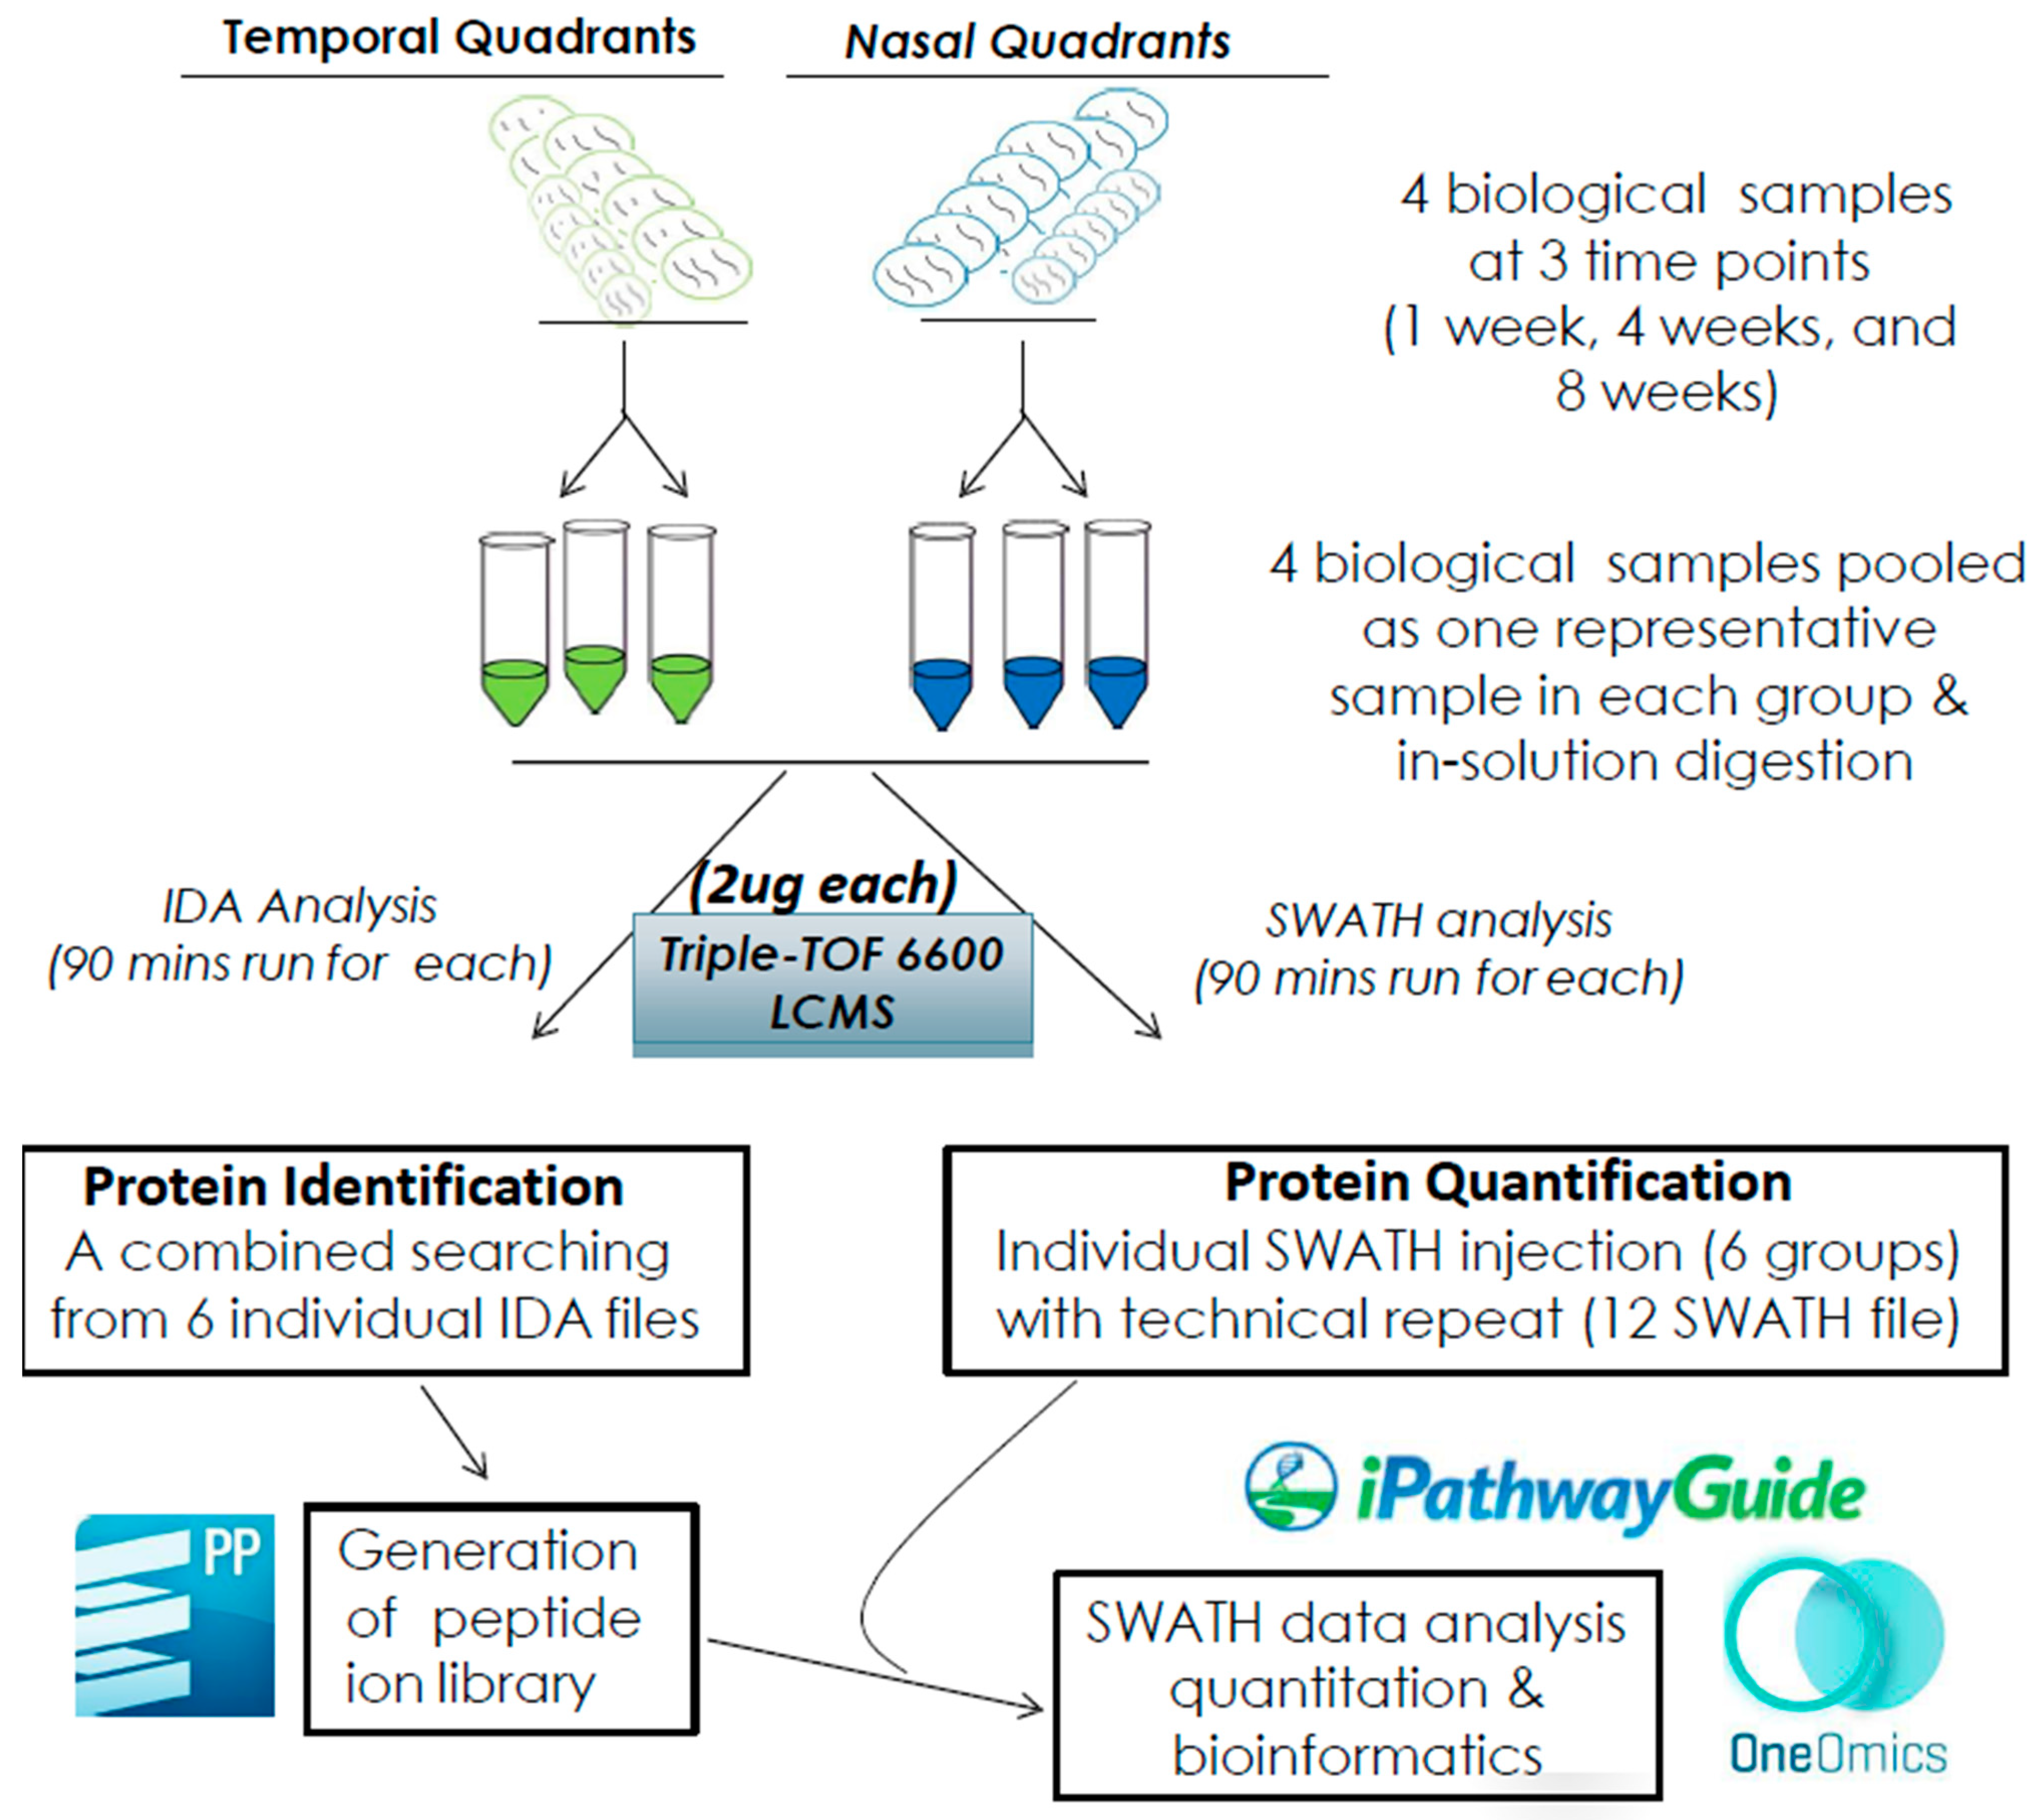
4.1. Animals and Partial Optic Nerve Transection (pONT)
4.2. Rat Retinal Harvest and Protein Extraction
4.3. Protein Reduction, Alkylation, and Digestion
4.4. Data Dependent Acquisition (DDA) and SWATH-MS Acquisition
4.5. SWATH-MS and Statistical Analysis
4.6. Bioinformatics Analysis
4.7. Tissue Processing and Immunohistochemistry
Author Contributions
Funding
Institutional Review Board Statement
Informed Consent Statement
Data Availability Statement
Acknowledgments
Conflicts of Interest
References
- Mira, R.G.; Lira, M.; Cerpa, W. Traumatic Brain Injury: Mechanisms of Glial Response. Front. Physiol. 2021, 12, 740939. [Google Scholar] [CrossRef]
- Au, N.P.B.; Ma, C.H.E. Neuroinflammation, Microglia and Implications for Retinal Ganglion Cell Survival and Axon Regeneration in Traumatic Optic Neuropathy. Front. Immunol. 2022, 13, 860070. [Google Scholar] [CrossRef] [PubMed]
- Kaur, P.; Sharma, S. Recent Advances in Pathophysiology of Traumatic Brain Injury. Curr. Neuropharmacol. 2018, 16, 1224–1238. [Google Scholar] [CrossRef] [PubMed]
- Ng, S.Y.; Lee, A.Y.W. Traumatic Brain Injuries: Pathophysiology and Potential Therapeutic Targets. Front. Cell Neurosci. 2019, 13, 528. [Google Scholar] [CrossRef]
- Frati, A.; Cerretani, D.; Fiaschi, A.; Frati, P.; Gatto, V.; La Russa, R.; Pesce, A.; Pinchi, E.; Santurro, A.; Fraschetti, F.; et al. Diffuse Axonal Injury and Oxidative Stress: A Comprehensive Review. Int. J. Mol. Sci. 2017, 18, 2600. [Google Scholar] [CrossRef] [PubMed] [Green Version]
- Stoica, B.A.; Faden, A.I. Cell death mechanisms and modulation in traumatic brain injury. Neurotherapeutics 2010, 7, 3–12. [Google Scholar] [CrossRef] [PubMed]
- Oyinbo, C.A. Secondary injury mechanisms in traumatic spinal cord injury: A nugget of this multiply cascade. Acta Neurobiol. Exp. 2011, 71, 281–299. [Google Scholar]
- Liang, Z.J.; Zeng, J.S.; Liu, S.R.; Ling, X.Y.; Xu, A.D.; Yu, J.; Ling, L. A prospective study of secondary degeneration following subcortical infarction using diffusion tensor imaging. J. Neurol. Neurosurg. Psychiatry 2007, 78, 581–586. [Google Scholar] [CrossRef] [PubMed] [Green Version]
- Bazan, N.G.; Rodriguez de Turco, E.B.; Allan, G. Mediators of injury in neurotrauma: Intracellular signal transduction and gene expression. J. Neurotrauma 1995, 12, 791–814. [Google Scholar] [CrossRef]
- Quigley, H.A. Neuronal death in glaucoma. Prog. Retin. Eye Res. 1999, 18, 39–57. [Google Scholar] [CrossRef]
- Quigley, H.A.; Addicks, E.M.; Green, W.R.; Maumenee, A.E. Optic nerve damage in human glaucoma. II: The site of injury and susceptibility to damage. Arch. Ophthalmol. 1981, 99, 635–649. [Google Scholar] [CrossRef] [PubMed]
- Miao, Y.; Zhao, G.L.; Cheng, S.; Wang, Z.; Yang, X.L. Activation of retinal glial cells contributes to the degeneration of ganglion cells in experimental glaucoma. Prog. Retin. Eye Res. 2023, 93, 101169. [Google Scholar] [CrossRef]
- Carelli, V.; La Morgia, C.; Ross-Cisneros, F.N.; Sadun, A.A. Optic neuropthies: The tip of the neurodegeneration iceberg. Hum. Mol. Genet. 2017, 26, R139–R150. [Google Scholar] [CrossRef] [PubMed] [Green Version]
- Ghaffarieh, A.; Levin, L.A. Optic nerve disease and axon pathophysiology. Int. Rev. Neurobiol. 2012, 105, 1–17. [Google Scholar] [PubMed]
- Calkins, D.J. Critical pathogenic events underlying progression of neurodegeneration in glaucoma. Prog. Retin. Eye Res. 2012, 31, 702–719. [Google Scholar] [CrossRef] [PubMed] [Green Version]
- Levkovitch-Verbin, H.; Quigley, H.A.; Kerrigan-Baumrind, L.A.; D’Anna, S.A.; Kerrigan, D.; Pease, M.E. Optic nerve transection in monkeys may result in secondary degeneration of retinal ganglion cells. Investig. Ophthalmol. Vis. Sci. 2001, 42, 975–982. [Google Scholar]
- Levkovitch-Verbin, H.; Quigley, H.A.; Martin, K.R.; Zack, D.J.; Pease, M.E.; Valenta, D.F. A model to study differences between primary and secondary degeneration of retinal ganglion cells in rats by partial optic nerve transection. Investig. Ophthalmol. Vis. Sci. 2003, 44, 3388–3393. [Google Scholar] [CrossRef] [Green Version]
- Davis, B.M.; Guo, L.; Brenton, J.; Langley, L.; Normando, E.M.; Cordeiro, M.F. Automatic quantitative analysis of experimental primary and secondary retinal neurodegeneration: Implications for optic neuropathies. Cell Death Discov. 2016, 2, 16031. [Google Scholar] [CrossRef]
- Fitzgerald, M.; Bartlett, C.A.; Harvey, A.R.; Dunlop, S.A. Early events of secondary degeneration after partial optic nerve transection: An immunohistochemical study. J. Neurotrauma 2010, 27, 439–452. [Google Scholar] [CrossRef]
- Payne, S.C.; Bartlett, C.A.; Savigni, D.L.; Harvey, A.R.; Dunlop, S.A.; Fitzgerald, M. Early proliferation does not prevent the loss of oligodendrocyte progenitor cells during the chronic phase of secondary degeneration in a CNS white matter tract. PLoS ONE 2013, 8, e65710. [Google Scholar] [CrossRef] [Green Version]
- Chiha, W.; LeVaillant, C.J.; Bartlett, C.A.; Hewitt, A.W.; Melton, P.E.; Fitzgerald, M.; Harvey, A.R. Retinal genes are differentially expressed in areas of primary versus secondary degeneration following partial optic nerve injury. PLoS ONE 2018, 13, e0192348. [Google Scholar] [CrossRef] [PubMed] [Green Version]
- Levkovitch-Verbin, H.; Dardik, R.; Vander, S.; Melamed, S. Mechanism of retinal ganglion cells death in secondary degeneration of the optic nerve. Exp. Eye Res. 2010, 91, 127–134. [Google Scholar] [CrossRef] [PubMed]
- Lam, C.; Li, K.K.; Do, C.W.; Chan, H.; To, C.H.; Kwong, J.M.K. Quantitative profiling of regional protein expression in rat retina after partial optic nerve transection using fluorescence difference two-dimensional gel electrophoresis. Mol. Med. Rep. 2019, 20, 2734–2742. [Google Scholar] [CrossRef] [Green Version]
- Kwong, J.M.K.; Caprioli, J.; Sze, Y.H.; Yu, F.J.; Li, K.K.; To, C.H.; Lam, T.C. Differential Retinal Protein Expression in Primary and Secondary Retinal Ganglion Cell Degeneration Identified by Integrated SWATH and Target-Based Proteomics. Int. J. Mol. Sci. 2021, 22, 8592. [Google Scholar] [CrossRef] [PubMed]
- Surguchov, A.; McMahon, B.; Masliah, E.; Surgucheva, I. Synucleins in ocular tissues. J. Neurosci. Res. 2001, 65, 68–77. [Google Scholar] [CrossRef] [PubMed]
- Buckingham, B.P.; Inman, D.M.; Lambert, W.; Oglesby, E.; Calkins, D.J.; Steele, M.R.; Vetter, M.L.; Marsh-Armstrong, N.; Horner, P.J. Progressive ganglion cell degeneration precedes neuronal loss in a mouse model of glaucoma. J. Neurosci. 2008, 28, 2735–2744. [Google Scholar] [CrossRef] [PubMed] [Green Version]
- Surgucheva, I.; Weisman, A.D.; Goldberg, J.L.; Shnyra, A.; Surguchov, A. Gamma-synuclein as a marker of retinal ganglion cells. Mol. Vis. 2008, 14, 1540–1548. [Google Scholar] [PubMed]
- Hirata, M.; Shearer, T.R.; Azuma, M. Hypoxia Activates Calpains in the Nerve Fiber Layer of Monkey Retinal Explants. Investig. Ophthalmol. Vis. Sci. 2015, 56, 6049–6057. [Google Scholar] [CrossRef] [PubMed] [Green Version]
- Wang, Q.; Zhuang, P.; Huang, H.; Li, L.; Liu, L.; Webber, H.C.; Dalal, R.; Siew, L.; Fligor, C.M.; Chang, K.C.; et al. Mouse γ-Synuclein Promoter-Mediated Gene Expression and Editing in Mammalian Retinal Ganglion Cells. J. Neurosci. 2020, 40, 3896–3914. [Google Scholar] [CrossRef]
- Surgucheva, I.; McMahan, B.; Ahmed, F.; Tomarev, S.; Wax, M.B.; Surguchov, A. Synucleins in glaucoma: Implication of gamma-synuclein in glaucomatous alterations in the optic nerve. J. Neurosci. Res. 2002, 68, 97–106. [Google Scholar] [CrossRef]
- Takemura, Y.; Ojima, H.; Oshima, G.; Shinoda, M.; Hasegawa, Y.; Kitago, M.; Yagi, H.; Abe, Y.; Hori, S.; Fujii-Nishimura, Y.; et al. Gamma-synuclein is a novel prognostic marker that promotes tumor cell migration in biliary tract carcinoma. Cancer Med. 2021, 10, 5599–5613. [Google Scholar] [CrossRef] [PubMed]
- Nilsson, J.; Gobom, J.; Sjödin, S.; Brinkmalm, G.; Ashton, N.J.; Svensson, J.; Johansson, P.; Portelius, E.; Zetterberg, H.; Blennow, K.; et al. Cerebrospinal fluid biomarker panel for synaptic dysfunction in Alzheimer’s disease. Alzheimers Dement. 2021, 13, e12179. [Google Scholar] [CrossRef] [PubMed]
- Peters, O.M.; Shelkovnikova, T.; Highley, J.R.; Cooper-Knock, J.; Hortobágyi, T.; Troakes, C.; Ninkina, N.; Buchman, V.L. Gamma-synuclein pathology in amyotrophic lateral sclerosis. Ann. Clin. Transl. Neurol. 2015, 2, 29–37. [Google Scholar] [CrossRef] [PubMed] [Green Version]
- Surgucheva, I.; Park, B.; Yue, B.Y.J.T.; Tomarev, S.; Surguchov, A. Interaction of myocilin with gamma-synuclein affects its secretion and aggregation. Cell Mol. Neurobiol. 2005, 25, 1009–1033. [Google Scholar] [CrossRef]
- Surguchov, A.; Surgucheva, I.; Solessio, E.; Baehr, W. Synoretin—A new protein belonging to the synuclein family. Mol. Cell Neurosci. 1999, 13, 95–103. [Google Scholar] [CrossRef]
- Surguchov, A.; Palazzo, R.E.; Surgucheva, I. Gamma synuclein: Subcellular localization in neuronal and non-neuronal cells and effect on signal transduction. Cell Motil. Cytoskelet. 2001, 49, 218–228. [Google Scholar] [CrossRef]
- Black, M.M.; Lasek, R.J. Slow components of axonal transport: Two cytoskeletal networks. J. Cell Biol. 1980, 86, 616–623. [Google Scholar] [CrossRef] [PubMed]
- Nixon, R.A.; Lewis, S.E.; Dahl, D.; Marotta, C.A.; Drager, U.C. Early posttranslational modifications of the three neurofilament subunits in mouse retinal ganglion cells: Neuronal sites and time course in relation to subunit polymerization and axonal transport. Brain Res. Mol. Brain Res. 1989, 5, 93–108. [Google Scholar] [CrossRef]
- Sánchez-Migallón, M.C.; Valiente-Soriano, F.J.; Salinas-Navarro, M.; Nadal-Nicolás, F.M.; Jiménez-López, M.; Vidal-Sanz, M.; Agudo-Barriuso, M. Nerve fibre layer degeneration and retinal ganglion cell loss long term after optic nerve crush or transection in adult mice. Exp. Eye Res. 2018, 170, 40–50. [Google Scholar] [CrossRef] [PubMed]
- Kashiwagi, K.; Ou, B.; Nakamura, S.; Tanaka, Y.; Suzuki, M.; Tsukahara, S. Increase in dephosphorylation of the heavy neurofilament subunit in the monkey chronic glaucoma model. Investig. Ophthalmol. Vis. Sci. 2003, 44, 154–159. [Google Scholar] [CrossRef] [PubMed] [Green Version]
- Chidlow, G.; Osborne, N.N. Rat retinal ganglion cell loss caused by kainate, NMDA and ischemia correlates with a reduction in mRNA and protein of Thy-1 and neurofilament light. Brain Res. 2003, 963, 298–306. [Google Scholar] [CrossRef] [PubMed]
- Wang, L.; Cioffi, G.A.; Cull, G.; Dong, J.; Fortune, B. Immunohistologic evidence for retinal glial cell changes in human glaucoma. Investig. Ophthalmol. Vis. Sci. 2002, 43, 1088–1094. [Google Scholar]
- Tanihara, H.; Hangai, M.; Sawaguchi, S.; Abe, H.; Kageyama, M.; Nakazawa, F.; Shirasawa, E.; Honda, Y. Up-regulation of glial fibrillary acidic protein in the retina of primate eyes with experimental glaucoma. Arch. Ophthalmol. 1997, 115, 752–756. [Google Scholar] [CrossRef]
- Bulirsch, L.M.; Loeffler, K.U.; Holz, F.G.; Koinzer, S.; Nadal, J.; Müller, A.M.; Herwig-Carl, M.C. Spatial and temporal immunoreaction of nestin, CD44, collagen IX and GFAP in human retinal Müller cells in the developing fetal eye. Exp. Eye Res. 2022, 217, 108958. [Google Scholar] [CrossRef] [PubMed]
- Luna, G.; Keeley, P.W.; Reese, B.E.; Linberg, K.A.; Lewis, G.P.; Fisher, S.K. Astrocyte structural reactivity and plasticity in models of retinal detachment. Exp. Eye Res. 2016, 150, 4–21. [Google Scholar] [CrossRef] [Green Version]
- Lam, T.T.; Kwong, J.M.K.; Tso, M.O.M. Early glial responses after acute elevated intraocular pressure in rats. Investig. Ophthalmol. Vis. Sci. 2003, 44, 638–645. [Google Scholar] [CrossRef] [PubMed] [Green Version]
- Vasiliou, V.; Pappa, A.; Petersen, D.R. Role of aldehyde dehydrogenases in endogenous and xenobiotic metabolism. Chem. Biol. Interact. 2000, 129, 1–19. [Google Scholar] [CrossRef] [PubMed]
- Marchitti, S.A.; Brocker, C.; Stagos, D.; Vasiliou, V. Non-P450 aldehyde oxidizing enzymes: The aldehyde dehydrogenase superfamily. Expert Opin. Drug Metab. Toxicol. 2008, 4, 697–720. [Google Scholar] [CrossRef] [Green Version]
- Lassen, N.; Black, W.J.; Estey, T.; Vasiliou, V. The role of corneal crystallins in the cellular defense mechanisms against oxidative stress. Semin. Cell Dev. Biol. 2008, 19, 100–112. [Google Scholar] [CrossRef]
- Lassen, N.; Bateman, J.B.; Estey, T.; Kuszak, J.R.; Nees, D.W.; Piatigorsky, J.; Duester, G.; Day, B.J.; Huang, J.; Hines, L.M.; et al. Multiple and additive functions of ALDH3A1 and ALDH1A1—Cataract phenotype and ocular oxidative damage in Aldh3a1(−/−)/Aldh1a1(−/−) knock-out mice. J. Biol. Chem. 2007, 282, 25668–25676. [Google Scholar] [CrossRef] [PubMed] [Green Version]
- Kong, D.; Kotraiah, V. Modulation of aldehyde dehydrogenase activity affects (±)-4-hydroxy-2E-nonenal (HNE) toxicity and HNE-protein adduct levels in PC12 cells. J. Mol. Neurosci. 2012, 47, 595–603. [Google Scholar] [CrossRef] [PubMed]
- Levonen, A.-L.; Landar, A.; Ramachandran, A.; Ceaser, E.K.; Dickinson, D.A.; Zanoni, G.; Morrow, J.D.; Darley-Usmar, V.M. Cellular mechanisms of redox cell signalling: Role of cysteine modification in controlling antioxidant defences in response to electrophilic lipid oxidation products. Biochem. J. 2004, 378 Pt 2, 373–382. [Google Scholar] [CrossRef] [PubMed] [Green Version]
- Jung, K.-A.; Choi, B.-H.; Nam, C.-W.; Song, M.; Kim, S.-T.; Lee, J.Y.; Kwak, M.K. Identification of aldo-keto reductases as NRF2-target marker genes in human cells. Toxicol. Lett. 2013, 218, 39–49. [Google Scholar] [CrossRef] [PubMed]
- Malumbres, M. Cyclin-dependent kinases. Genome Biol. 2014, 15, 122. [Google Scholar] [CrossRef] [Green Version]
- Wright, P.; Kelsall, J.; Healing, G.; Sanderson, J. Differential expression of cyclin-dependent kinases in the adult human retina in relation to CDK inhibitor retinotoxicity. Arch. Toxicol. 2019, 93, 659–671. [Google Scholar] [CrossRef] [Green Version]
- McDowell, R.E.; McGahon, M.K.; Augustine, J.; Chen, M.; McGeown, J.G.; Curtis, T.M. Diabetes Impairs the Aldehyde Detoxifying Capacity of the Retina. Investig. Ophthalmol. Vis. Sci. 2016, 57, 4762–4771. [Google Scholar] [CrossRef]
- Godinez, A.; Rajput, R.; Chitranshi, N.; Gupta, V.; Basavarajappa, D.; Sharma, S.; You, Y.; Pushpitha, K.; Dhiman, K.; Mirzaei, M.; et al. Neuroserpin, a crucial regulator for axogenesis, synaptic modelling and cell-cell interactions in the pathophysiology of neurological disease. Cell Mol. Life Sci. 2022, 79, 172. [Google Scholar] [CrossRef]
- Davis, R.L.; Shrimpton, A.E.; Holohan, P.D.; Bradshaw, C.; Feiglink, D.; Collins, G.H.; Sonderegger, P.; Kinter, J.; Beckers, L.M.; Lacbawan, F.; et al. Familial dementia caused by polymerization of mutant neuroserpin. Nature 1999, 401, 376–379. [Google Scholar] [CrossRef]
- Gupta, V.; Mirzaei, M.; Gupta, V.B.; Chitranshi, N.; Dheer, Y.; Vander Wall, R.; Abbasi, M.; You, Y.; Chung, R.; Graham, S. Glaucoma is associated with plasmin proteolytic activation mediated through oxidative inactivation of neuroserpin. Sci. Rep. 2017, 7, 8412. [Google Scholar] [CrossRef] [Green Version]
- Bian, J.; Sze, Y.H.; Tse, D.Y.; To, C.H.; McFadden, S.A.; Lam, C.S.; Li, K.K.; Lam, T.C. SWATH based quantitative proteomics reveals significant lipid metabolism in early myopic guinea pig retina. Int. J. Mol. Sci. 2021, 22, 4721. [Google Scholar] [CrossRef]
- Gu, L.; Kwong, J.M.K.; Caprioli, J.; Piri, N. Visual Function and Survival of Injured Retinal Ganglion Cells in Aged Rbfox1 Knockout Animals. Cells 2022, 11, 3401. [Google Scholar] [CrossRef] [PubMed]


| Groups | Protein | Peptide | Differentially Expressed Proteins ** |
|---|---|---|---|
| Individual search-1 wk | 2023 | 12,543 | 10/2208 (8 upregulated and 2 downregulated) |
| Individual search-4 wk | 2173 | 13,715 | 25/2208 (16 upregulated and 9 downregulated) |
| Individual search-8 wk | 2185 | 13,951 | 61/2208 (47 upregulated and 14 downregulated) |
| Combined search (1, 4, and 8 wk) * | 2531 | 18,871 | N/A |
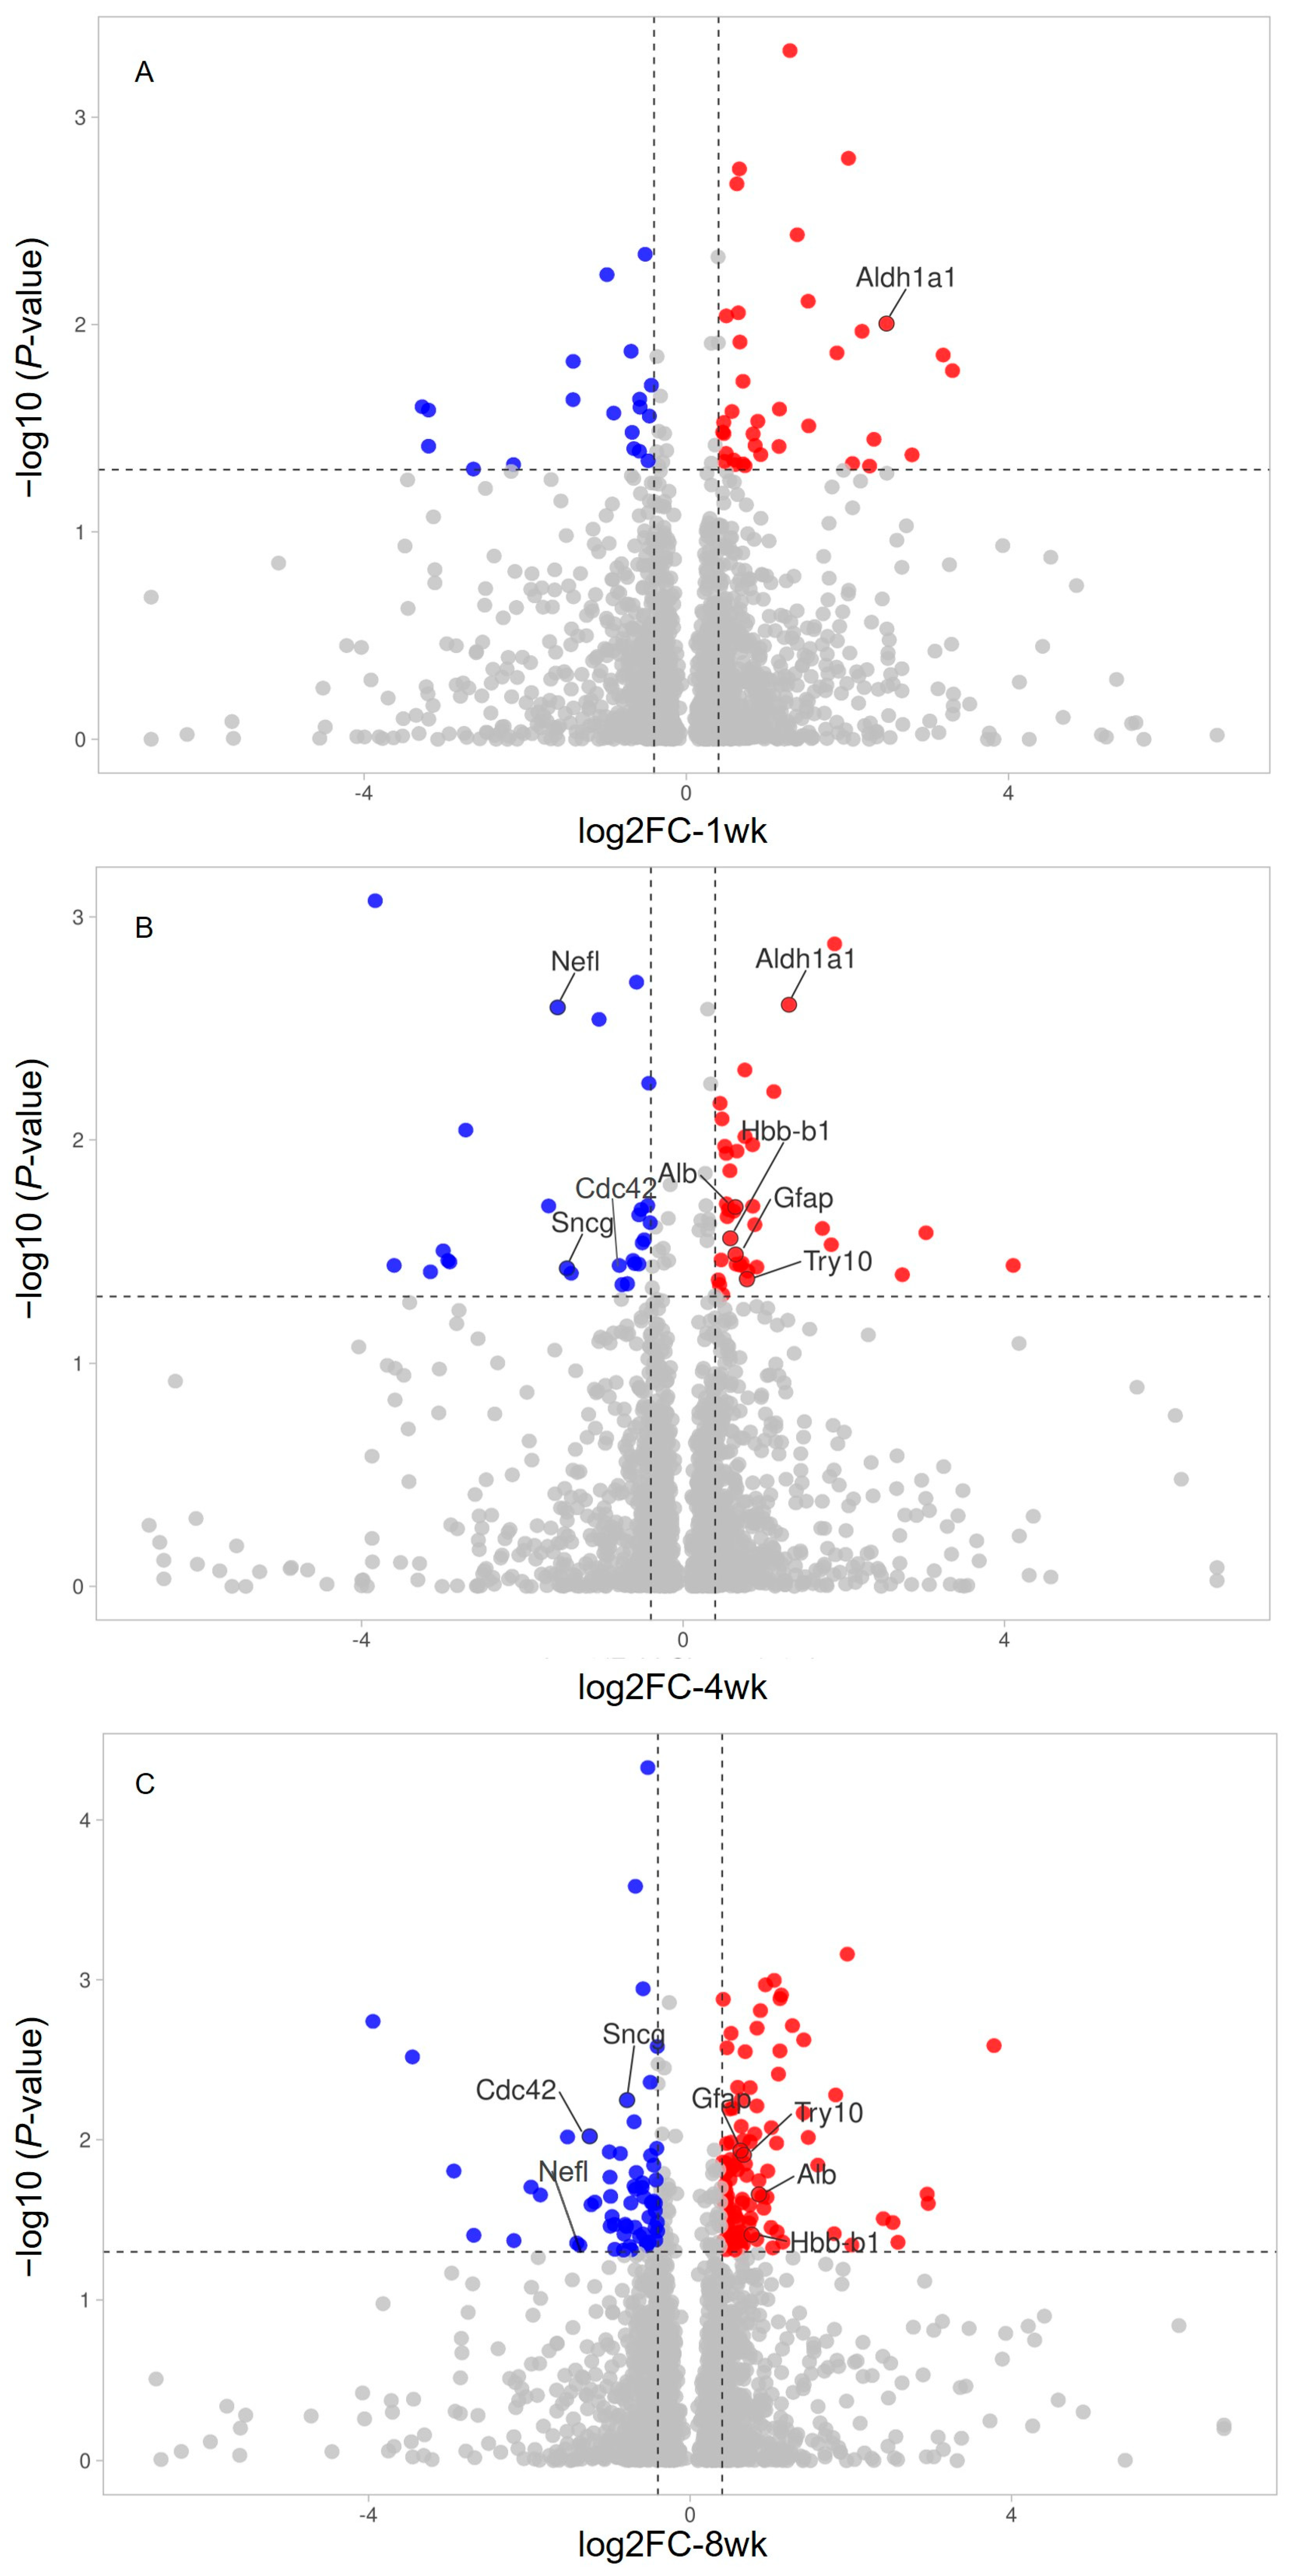
| Uniprot ID | Gene Name | Protein Name | FC (T/N) | log2FC | Confidence | p |
|---|---|---|---|---|---|---|
| Upregulation | ||||||
| D4A8G0 | Lsm12 | LSM12 homolog | 9.12 | 3.19 | 0.84 | 0.01 |
| Q1W1V7 | N/A | Liver cancer-related protein | 6.33 | 2.66 | 0.88 | 0.01 |
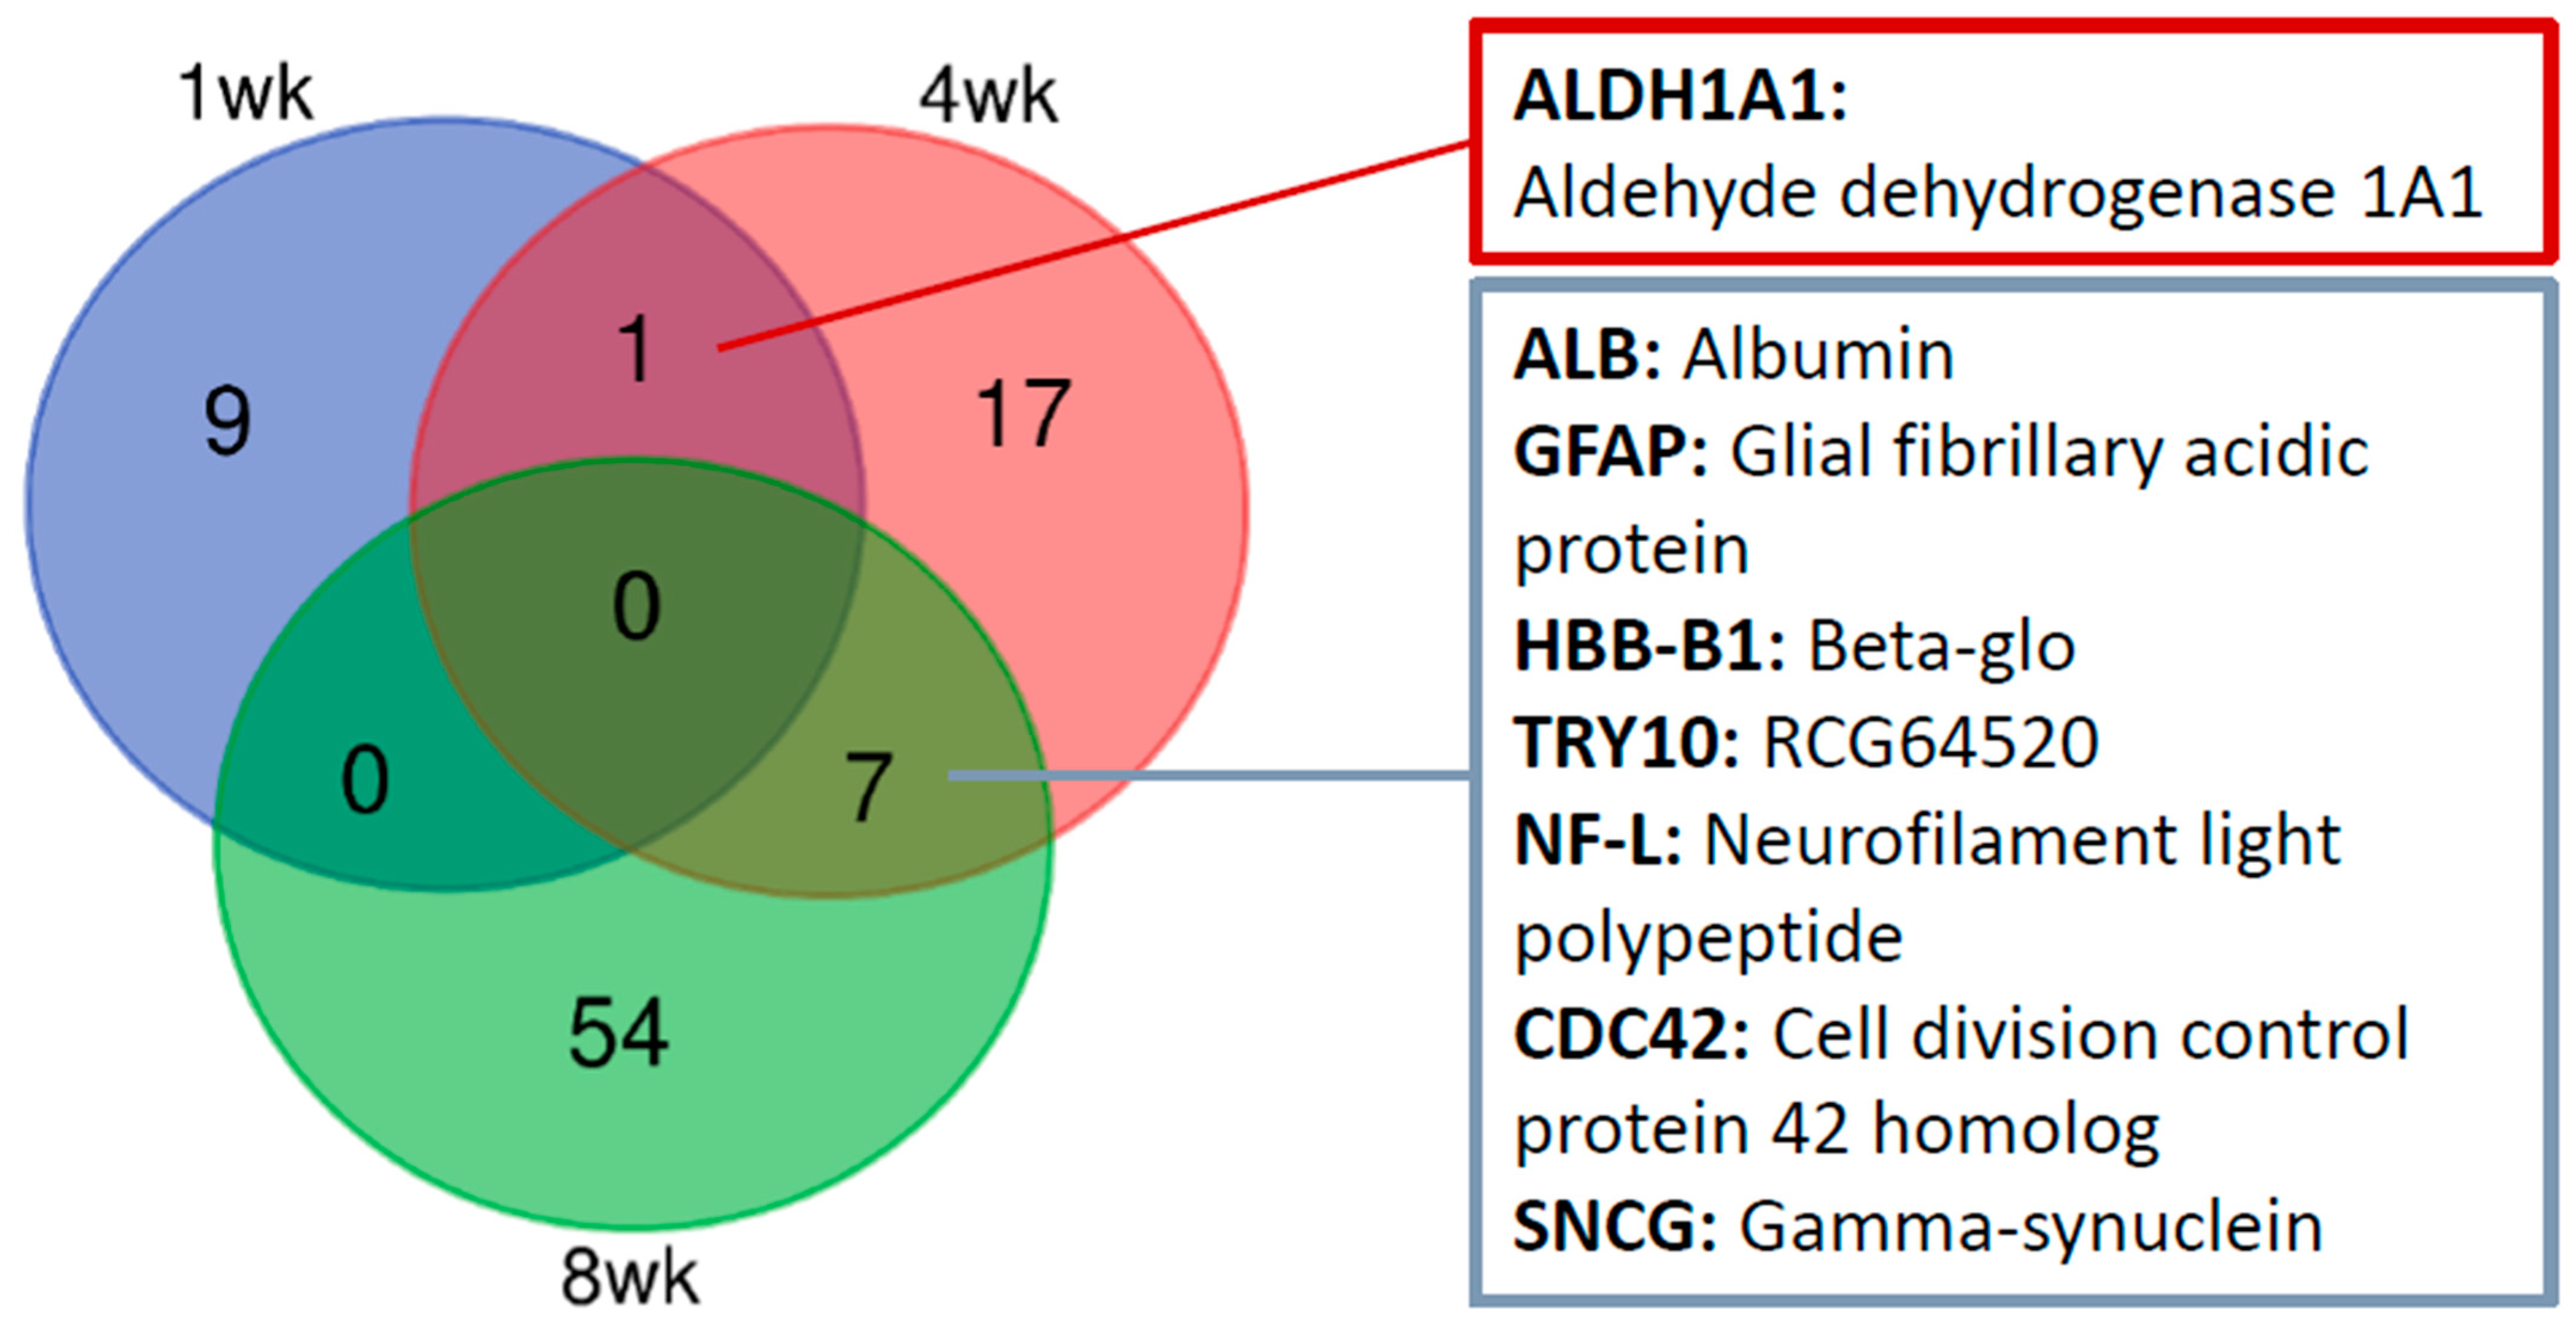
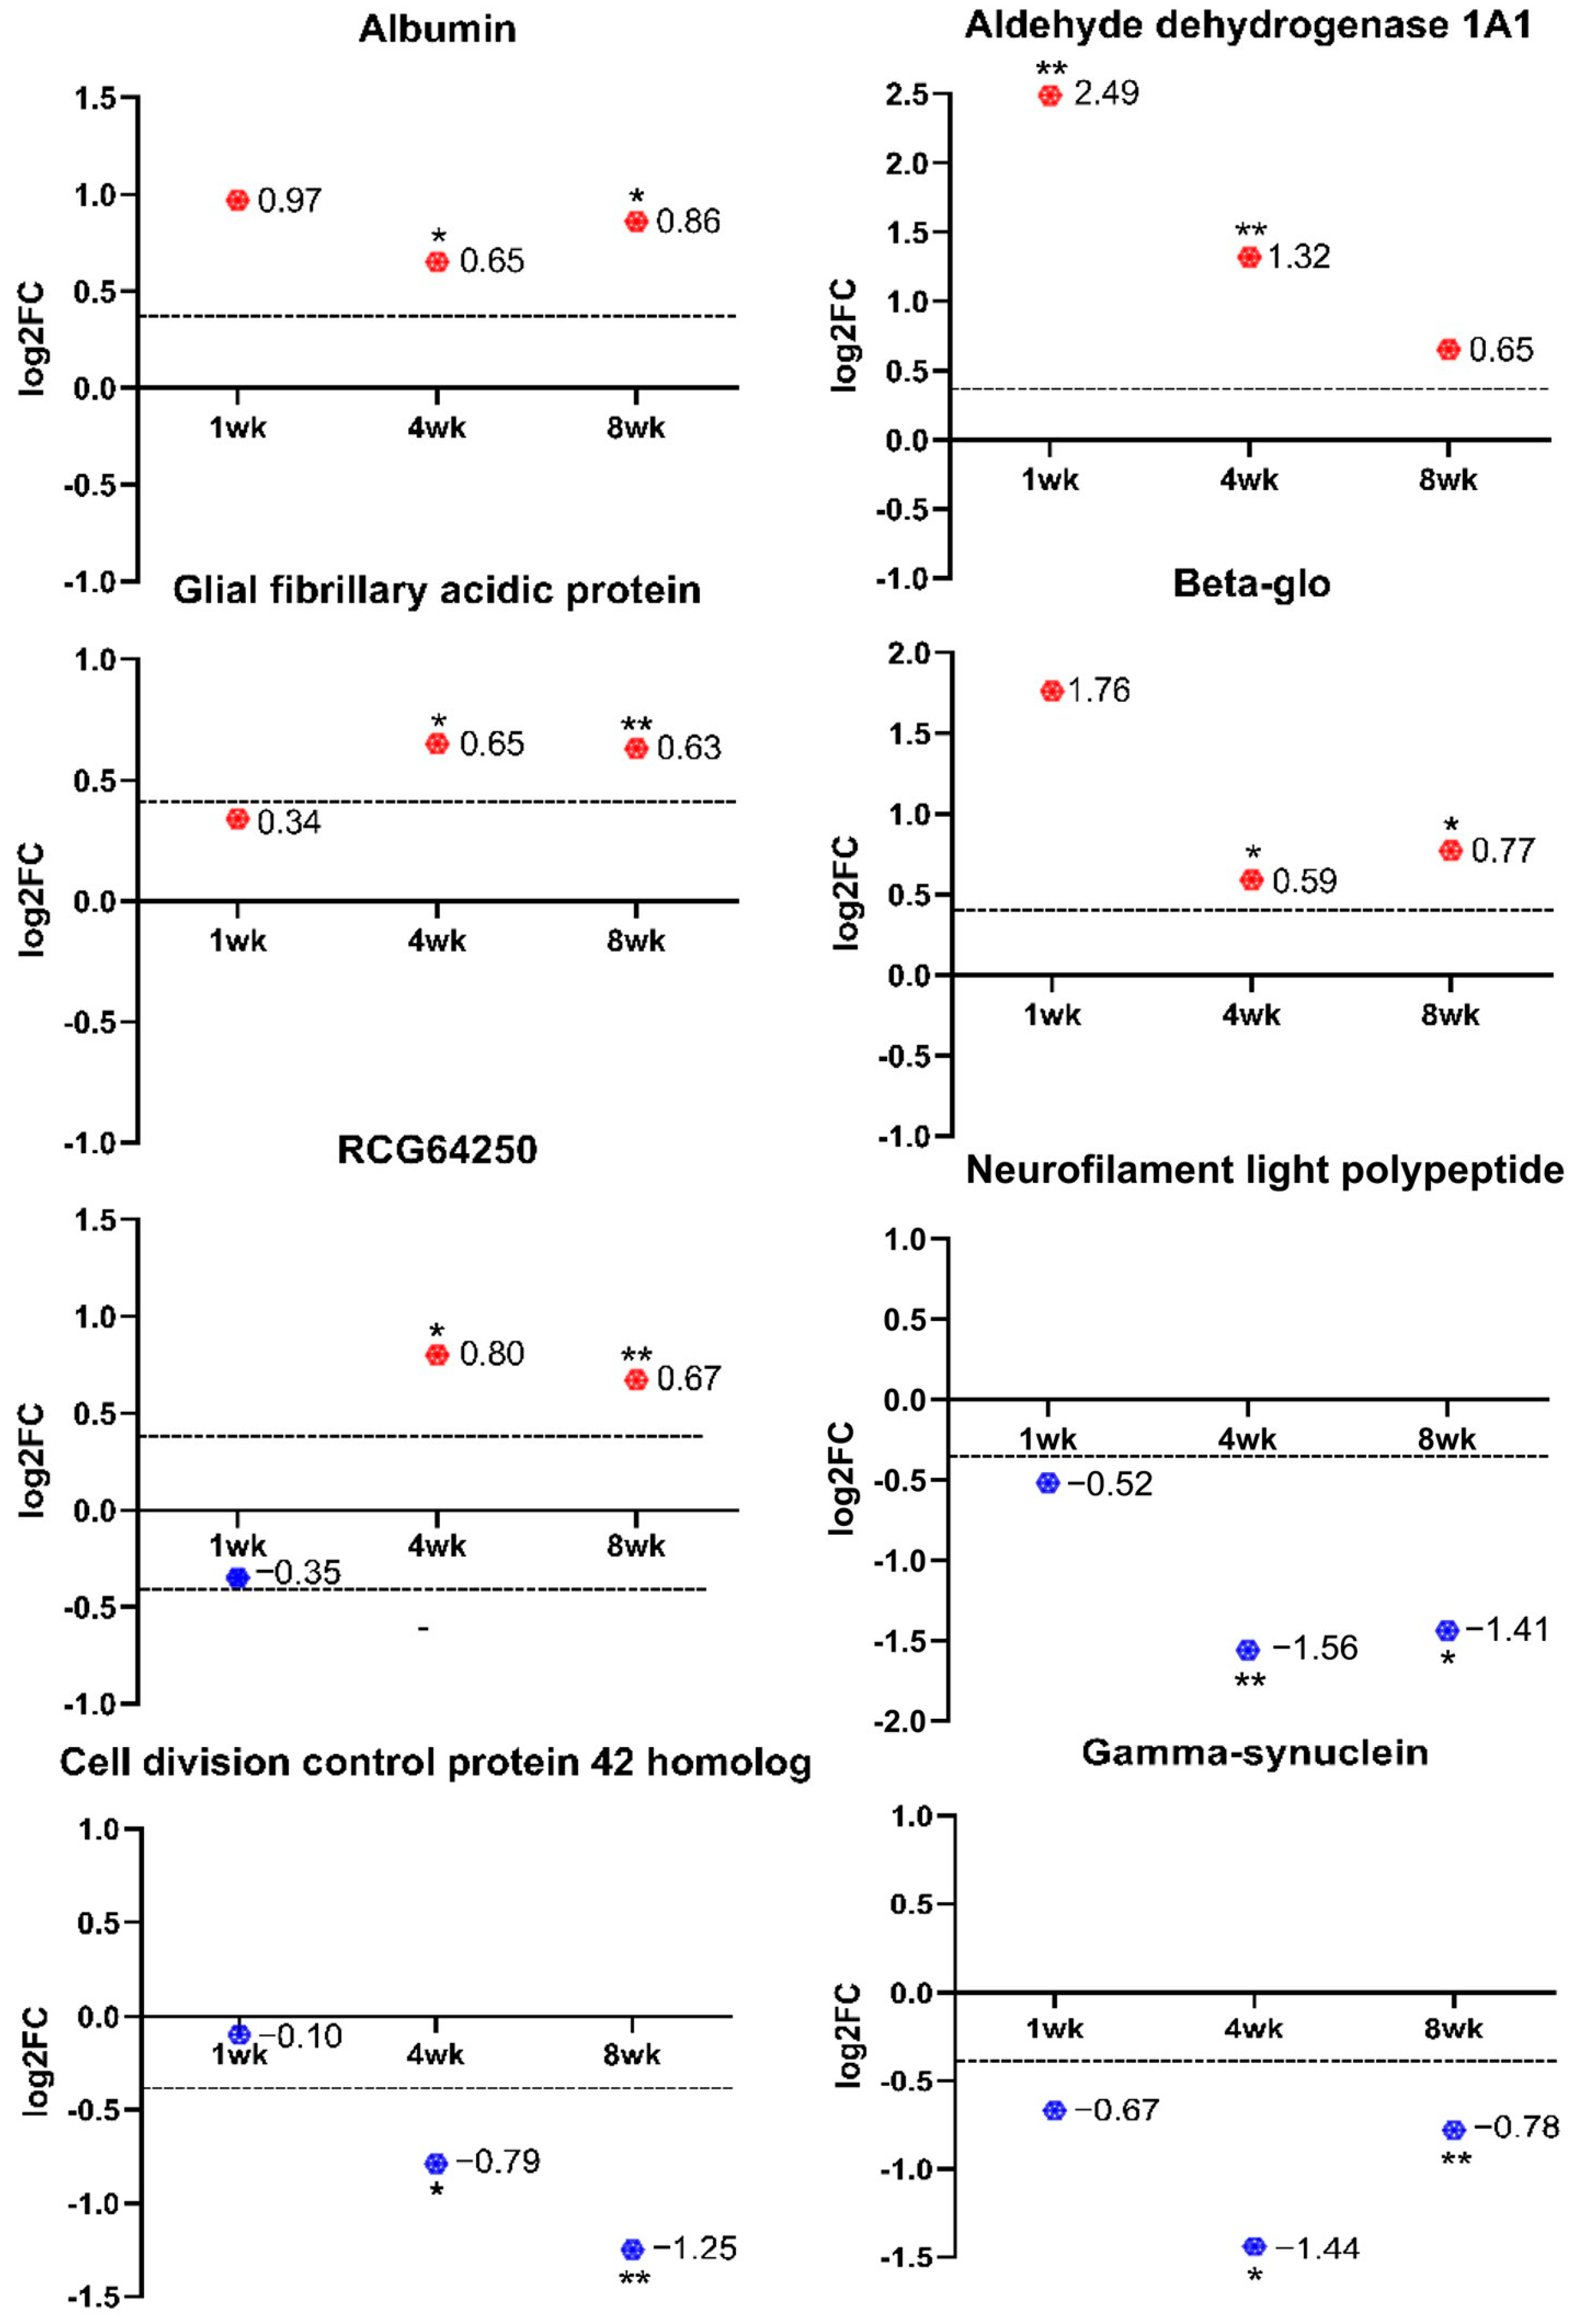
| A0A0H2UHP1 | Aldh1a1 | Aldehyde dehydrogenase 1A1 | 5.60 | 2.49 | 0.84 | 0.01 |
| B2GV57 | Cars2 | cysteine-tRNA ligase | 5.03 | 2.33 | 0.80 | 0.04 |
| A0A8I5ZSA8 | ENSRNOG00000069233 | Histone H2B | 3.34 | 1.74 | 0.91 | 0.03 |
| P69897 | Tubb5 | Tubulin beta-5 chain | 2.60 | 1.38 | 0.82 | 0.00 |
| Q6PED0 | Rps27a | Ubiquitin-40S ribosomal protein S27a | 1.78 | 0.83 | 0.93 | 0.03 |
| A0A0G2K2S2 | Slc2a1 | Solute carrier family 2, facilitated glucose transporter member 1member 1 | 1.48 | 0.57 | 0.77 | 0.03 |
| Downregulation | ||||||
| A0A0H2UHU0 | Rps25 | 40S ribosomal protein S25 | 0.38 | −1.41 | 0.72 | 0.02 |
| Q91XU7 | Cdhr1 | Cadherin-related family member 1 | 0.11 | −3.20 | 0.79 | 0.03 |
| Uniprot ID | Gene Name | Protein Name | FC (T/N) | log2FC | Confidence | p |
|---|---|---|---|---|---|---|
| Upregulation | ||||||
| B5DEZ3 | Ccdc126 | Ccdc126 protein | 17.25 | 4.11 | 0.71 | 0.04 |
| Q91ZE7 | N/A | Anion exchange protein | 8.58 | 3.10 | 0.70 | 0.00 |
| Q5M842 | IgG-2a | IgG-2a protein | 8.13 | 3.02 | 0.70 | 0.03 |
| Q05175 | Basp1 | Brain acid-soluble protein 1 | 3.36 | 1.75 | 0.80 | 0.04 |
| A0A0H2UHP1 | Aldh1a1 | Aldehyde dehydrogenase 1A1 | 2.49 | 1.32 | 0.89 | 0.00 |
| P18437 | Hmgn2 | Non-histone chromosomal protein HMG-17 | 2.19 | 1.13 | 0.72 | 0.01 |
| Q499T3 | Sirpa | Sirpa protein | 1.89 | 0.92 | 0.72 | 0.04 |
| W4VSR7 | Try10 | RCG64520 | 1.74 | 0.80 | 0.85 | 0.04 |
| A0A0G2K2V6 | Krt10 | Keratin, type I cytoskeletal 10 | 1.71 | 0.77 | 0.75 | 0.01 |
| A0A0G2JSY7 | Rho | Rhodopsin | 1.70 | 0.77 | 0.84 | 0.00 |
| A0A0H2UHW4 | Pcnp | PEST proteolytic signal-containing nuclear protein | 1.66 | 0.73 | 0.70 | 0.04 |
| D4A3K5 | H1-1 | Histone H1.1 | 1.59 | 0.67 | 0.88 | 0.01 |
| P47819 | Gfap | Glial fibrillary acidic protein | 1.57 | 0.65 | 0.87 | 0.03 |
| A0A0G2JSH5 | Alb | Albumin | 1.57 | 0.65 | 0.82 | 0.02 |
| Q6PDU6 | Hbb-b1 | Beta-glo | 1.50 | 0.59 | 0.82 | 0.03 |
| K7S2S2 | Hist2h2aa3 | Histone H2A | 1.43 | 0.52 | 0.79 | 0.01 |
| Downregulation | ||||||
| Q6P3E1 | Rps16 | Rps16 protein | 0.74 | −0.43 | 0.70 | 0.03 |
| D3ZK97 | H3f3c | Histone H3 | 0.74 | −0.43 | 0.99 | 0.01 |
| P47728 | Calb2 | Calretinin | 0.67 | −0.58 | 0.75 | 0.00 |
| Q8CFN2 | Cdc42 | Cell division control protein 42 homolog | 0.58 | −0.79 | 0.75 | 0.04 |
| A0A0G2K0T6 | Sncg | Gamma-synuclein | 0.37 | −1.44 | 0.87 | 0.04 |
| P19527 | Nefl | Neurofilament light polypeptide | 0.34 | −1.56 | 0.81 | 0.00 |
| Q5XI38 | Lcp1 | Lymphocyte cytosolic protein 1 | 0.13 | −2.92 | 0.81 | 0.03 |
| Q3B7U9 | Fkbp8 | Peptidyl-prolyl cis-trans isomerase FKBP8 | 0.13 | −2.98 | 0.70 | 0.03 |
| G3V9E4 | Apeh | Acylamino-acid-releasing enzyme | 0.08 | −3.59 | 0.71 | 0.04 |
| Uniprot ID | Gene Name | Protein Name | FC (T/N) | log2FC | Confidence | p |
|---|---|---|---|---|---|---|
| Upregulation | ||||||
| Q5M8C3 | Serpina4 | Serine (Or cysteine) proteinase inhibitor, clade A (Alpha-1 antiproteinase, antitrypsin), member 4 | 13.76 | 3.78 | 0.70 | 0.00 |
| Q6YDN7 | Cdc26 | Anaphase-promoting complex subunit CDC26 | 7.80 | 2.96 | 0.81 | 0.03 |
| Q5EB90 | Polr2c | Polymerase (RNA) II | 7.73 | 2.95 | 0.80 | 0.02 |
| P23928 | Cryab | Alpha-crystallin B chain | 2.42 | 1.27 | 0.89 | 0.00 |
| P10068 | Crygf | Gamma-crystallin F | 2.20 | 1.14 | 0.98 | 0.00 |
| A0A0H2UHM3 | Hp | Haptoglobin | 2.17 | 1.12 | 0.89 | 0.00 |
| P62697 | Crybb2 | Beta-crystallin B2 | 2.17 | 1.12 | 0.95 | 0.00 |
| A0JN13 | Cryaa | Alpha-crystallin A chain | 2.14 | 1.10 | 0.86 | 0.00 |
| Q8CGQ0 | Cryba2 | BetaA2-crystallin | 2.12 | 1.08 | 0.96 | 0.04 |
| P02767 | Ttr | Transthyretin | 2.11 | 1.08 | 0.86 | 0.01 |
| P62329 | Tmsb4x | Thymosin beta-4 | 2.07 | 1.05 | 0.78 | 0.00 |
| P02524 | Crybb3 | Beta-crystallin B3 | 1.95 | 0.97 | 0.88 | 0.02 |
| P02523 | Crybb1 | Beta-crystallin B1 | 1.94 | 0.96 | 0.87 | 0.02 |
| Q8CHN7 | Pcp4 | Calmodulin regulator protein PCP4 | 1.92 | 0.94 | 0.86 | 0.00 |
| P63249 | Pkia | cAMP-dependent protein kinase inhibitor alpha | 1.89 | 0.92 | 0.89 | 0.03 |
| Q62785 | Pdap1 | 28 kDa heat- and acid-stable phosphoprotein | 1.86 | 0.90 | 0.77 | 0.02 |
| P14881-2 | Cryba1 | Beta-crystallin A3 | 1.83 | 0.87 | 0.88 | 0.00 |
| P02770 | Alb | Albumin | 1.81 | 0.86 | 0.85 | 0.02 |
| B0K010 | Txndc17 | Thioredoxin domain-containing protein 17 | 1.81 | 0.86 | 0.70 | 0.02 |
| A0A0G2JZ73 | Serpina1 | Alpha-1-antiproteinase | 1.78 | 0.83 | 0.82 | 0.01 |
| A0A0G2K376 | Fip1l1 | Pre-mRNA 3′-end-processing factor FIP1 | 1.75 | 0.80 | 0.70 | 0.01 |
| Q6PDU6 | Hbb-b1 | Beta-glo | 1.70 | 0.77 | 0.80 | 0.04 |
| A0A1K0FUA6 | LOC100134871 | Globin a2 | 1.69 | 0.76 | 0.83 | 0.03 |
| P14046 | A1i3 | Alpha-1-inhibitor 3 | 1.68 | 0.75 | 0.84 | 0.01 |
| P20059 | Hpx | Hemopexin | 1.66 | 0.73 | 0.85 | 0.03 |
| Q923W4 | Hdgfl3 | Hepatoma-derived growth factor-related protein 3 | 1.63 | 0.71 | 0.84 | 0.02 |
| D3ZXP8 | Pcp2 | Purkinje cell protein 2 | 1.61 | 0.69 | 0.87 | 0.00 |
| W4VSR7 | Try10 | RCG64520 | 1.59 | 0.67 | 0.84 | 0.01 |
| P14841 | Cst3 | Cystatin-C | 1.58 | 0.66 | 0.99 | 0.01 |
| B4F758 | Hmgb1 | High mobility group protein B1 | 1.57 | 0.65 | 0.78 | 0.02 |
| D4A9Z8 | Chmp4bl1 | Chromatin-modifying protein 4B-like 1 | 1.57 | 0.65 | 0.73 | 0.02 |
| A0A0G2K6H5 | Cfdp1 | Craniofacial development protein 1 | 1.55 | 0.64 | 0.80 | 0.01 |
| P47819 | Gfap | Glial fibrillary acidic protein | 1.55 | 0.63 | 0.85 | 0.01 |
| Q05175 | Basp1 | Brain acid soluble protein 1 | 1.53 | 0.61 | 0.72 | 0.04 |
| P26772 | Hspe1 | 10 kDa heat shock protein, mitochondrial | 1.51 | 0.59 | 0.79 | 0.00 |
| A0A0G2JSW3 | Hbb | Hemoglobin subunit beta-1 | 1.46 | 0.55 | 0.78 | 0.01 |
| P11030 | Dbi | Acyl-CoA-binding protein | 1.46 | 0.54 | 0.86 | 0.04 |
| Q4KLJ1 | Sfrs7 | RCG61762, isoform CRA_a | 1.42 | 0.51 | 0.88 | 0.01 |
| P31044 | Pebp1 | Phosphatidylethanolamine-binding protein 1 | 1.41 | 0.49 | 0.82 | 0.04 |
| D4A6E3 | Mug1 | Murinoglobulin-1 | 1.38 | 0.47 | 0.78 | 0.02 |
| F1LNF1 | Hnrnpa2b1 | Heterogeneous nuclear ribonucleoproteins A2/B1 | 1.38 | 0.47 | 0.84 | 0.03 |
| D3ZM85 | Cplx4 | Complexin 4 | 1.38 | 0.46 | 0.71 | 0.02 |
| P55053 | Fabp5 | Fatty acid-binding protein 5 | 1.37 | 0.45 | 0.73 | 0.01 |
| Q6P6G9 | Hnrnpa1 | Heterogeneous nuclear ribonucleoprotein A1 | 1.36 | 0.45 | 0.77 | 0.01 |
| D4ABK7 | Hnrnph3 | Heterogeneous nuclear ribonucleoprotein H3 | 1.36 | 0.45 | 0.78 | 0.02 |
| P11240 | Cox5a | Cytochrome c oxidase subunit 5A | 1.36 | 0.45 | 0.79 | 0.02 |
| B1WBQ0 | Cdc5l | CDC5 cell division cycle 5-like | 1.35 | 0.43 | 0.80 | 0.02 |
| Downregulation | ||||||
| P68370 | Tuba1a | Tubulin alpha-1A chain | 0.74 | −0.43 | 0.99 | 0.02 |
| D3ZC55 | Hspa12a | Heat shock 70kDa protein 12A (Predicted), isoform CRA_a | 0.73 | −0.46 | 0.73 | 0.03 |
| Q8CJD2 | N/A | Guanylate cyclase | 0.72 | −0.47 | 0.81 | 0.03 |
| F1M779 | Cltc | Clathrin heavy chain | 0.71 | −0.49 | 0.87 | 0.00 |
| C7C5T2 | Pfkp | ATP-dependent 6-phosphofructokinase | 0.69 | −0.53 | 0.76 | 0.00 |
| P01830 | Thy1 | Thy-1 membrane glycoprotein | 0.67 | −0.58 | 0.74 | 0.00 |
| A0A0G2K0T6 | Sncg | Gamma-synuclein | 0.58 | −0.78 | 0.74 | 0.01 |
| D4AE00 | “Obsolete” | “Obsolete” | 0.55 | −0.87 | 0.74 | 0.01 |
| Q8K4V4 | Snx27 | Sorting nexin-27 | 0.53 | −0.90 | 0.81 | 0.04 |
| P12007 | Ivd | Isovaleryl-CoA dehydrogenase, mitochondrial | 0.50 | −0.99 | 0.77 | 0.03 |
| Q8CFN2 | Cdc42 | Cell division control protein 42 homolog | 0.42 | −1.25 | 0.80 | 0.01 |
| P19527 | Nefl | Neurofilament light polypeptide | 0.38 | −1.41 | 0.81 | 0.04 |
| Q6EV70 | Pofut1 | GDP-fucose protein O-fucosyltransferase 1 | 0.22 | −2.19 | 0.74 | 0.04 |
| B1H267 | Snx5 | Sorting nexin-5 | 0.06 | −3.95 | 0.78 | 0.00 |
| GO ID | T/N-1 wk | T/N-4 wk | T/N-8 wk | ||||
|---|---|---|---|---|---|---|---|
| Genes (DE/All) | p | Genes (DE/All) | p | Genes (DE/All) | p | ||
| GO term-Biological process | |||||||
| lens development in camera-type eye | GO:0002088 | N/A | N/A | 1/14 | 0.364 | 8/14 | 2.4 × 10⁻⁶ |
| neuron projection regeneration | GO:0031102 | N/A | N/A | 2/16 | 0.089 | 8/16 | 9.1 × 10⁻⁶ |
| response to wounding | GO:0009611 | 1/78 | 0.915 | 6/79 | 0.036 | 18/79 | 2.0 × 10⁻⁵ |
| visual system development | GO:0150063 | 1/65 | 0.871 | 7/67 | 0.004 | 15/67 | 1.3 × 10⁻⁴ |
| sensory system development | GO:0048880 | 1/65 | 0.871 | 7/67 | 0.004 | 15/67 | 1.3 × 10⁻⁴ |
| eye development | GO:0001654 | 1/65 | 0.871 | 7/67 | 0.004 | 15/67 | 1.3 × 10⁻⁴ |
| lipid biosynthetic process | GO:0008610 | 1/68 | 0.883 | 1/68 | 0.893 | 15/68 | 1.5 × 10⁻⁴ |
| negative regulation of endopeptidase activity | GO:0010951 | 4/40 | 0.031 | 3/40 | 0.131 | 11/40 | 1.5 × 10⁻⁴ |
| negative regulation of peptidase activity | GO:0010466 | 4/41 | 0.034 | 3/41 | 0.139 | 11/41 | 2.0 × 10⁻⁴ |
| negative regulation of hydrolase activity | GO:0051346 | 4/54 | 0.079 | 4/55 | 0.094 | 13/55 | 2.1 × 10⁻⁴ |
| GO terms-molecular function | |||||||
| structural constituent of eye lens | GO:0005212 | N/A | N/A | 1/12 | 0.325 | 8/12 | 2.9 × 10⁻⁷ |
| structural molecule activity | GO:0005198 | 7/111 | 0.054 | 6/112 | 0.145 | 23/112 | 2.7 × 10⁻⁶ |
| serine-type endopeptidase inhibitor activity | GO:0004867 | 2/13 | 0.060 | 3/13 | 0.007 | 6/13 | 1.6 × 10⁻⁴ |
| endopeptidase inhibitor activity | GO:0004866 | 4/25 | 0.007 | 3/25 | 0.044 | 8/25 | 2.7 × 10⁻⁴ |
| peptidase inhibitor activity | GO:0030414 | 4/25 | 0.007 | 3/25 | 0.044 | 8/25 | 2.7 × 10⁻⁴ |
| endopeptidase regulator activity | GO:0061135 | 4/28 | 0.010 | 3/28 | 0.058 | 8/28 | 6.4 × 10⁻⁴ |
| signaling receptor regulator activity | GO:0030545 | N/A | N/A | 1/18 | 0.445 | 6/18 | 0.001 |
| peptidase regulator activity | GO:0061134 | 4/31 | 0.014 | 3/31 | 0.075 | 8/31 | 0.001 |
| monosaccharide binding | GO:0048029 | 1/20 | 0.472 | 1/20 | 0.481 | 6/20 | 0.002 |
| receptor ligand activity | GO:0048018 | N/A | N/A | N/A | N/A | 5/15 | 0.003 |
| GO terms-cellular component | |||||||
| extracellular space | GO:0005615 | 7/125 | 0.079 | 9/127 | 0.014 | 28/127 | 1.1 × 10⁻⁷ |
| extracellular region | GO:0005576 | 9/163 | 0.052 | 12/165 | 0.004 | 30/165 | 3.1 × 10⁻⁶ |
| hemoglobin complex | GO:0005833 | N/A | N/A | 1/4 | 0.118 | 3/4 | 0.002 |
| haptoglobin-hemoglobin complex | GO:0031838 | N/A | N/A | N/A | N/A | 3/4 | 0.002 |
| neurofilament | GO:0005883 | N/A | N/A | 1/5 | 0.146 | 3/5 | 0.004 |
| presynaptic intermediate filament cytoskeleton | GO:0099182 | N/A | N/A | 1/2 | 0.061 | 2/2 | 0.006 |
| intermediate filament | GO:0005882 | 1/19 | 0.444 | 4/19 | 0.002 | 5/19 | 0.013 |
| axon | GO:0030424 | 7/209 | 0.449 | 7/211 | 0.486 | 25/211 | 0.017 |
| postsynaptic intermediate filament cytoskeleton | GO:0099160 | N/A | N/A | 1/3 | 0.090 | 2/3 | 0.017 |
| growth cone membrane | GO:0032584 | N/A | N/A | N/A | N/A | 2/3 | 0.017 |
Disclaimer/Publisher’s Note: The statements, opinions and data contained in all publications are solely those of the individual author(s) and contributor(s) and not of MDPI and/or the editor(s). MDPI and/or the editor(s) disclaim responsibility for any injury to people or property resulting from any ideas, methods, instructions or products referred to in the content. |
© 2023 by the authors. Licensee MDPI, Basel, Switzerland. This article is an open access article distributed under the terms and conditions of the Creative Commons Attribution (CC BY) license (https://creativecommons.org/licenses/by/4.0/).
Share and Cite
Kwong, J.M.K.; Caprioli, J.; Lee, J.C.Y.; Song, Y.; Yu, F.-J.; Bian, J.; Sze, Y.-H.; Li, K.-K.; Do, C.-W.; To, C.-H.; et al. Differential Responses of Retinal Neurons and Glia Revealed via Proteomic Analysis on Primary and Secondary Retinal Ganglion Cell Degeneration. Int. J. Mol. Sci. 2023, 24, 12109. https://doi.org/10.3390/ijms241512109
Kwong JMK, Caprioli J, Lee JCY, Song Y, Yu F-J, Bian J, Sze Y-H, Li K-K, Do C-W, To C-H, et al. Differential Responses of Retinal Neurons and Glia Revealed via Proteomic Analysis on Primary and Secondary Retinal Ganglion Cell Degeneration. International Journal of Molecular Sciences. 2023; 24(15):12109. https://doi.org/10.3390/ijms241512109
Chicago/Turabian StyleKwong, Jacky M. K., Joseph Caprioli, Joanne C. Y. Lee, Yifan Song, Feng-Juan Yu, Jingfang Bian, Ying-Hon Sze, King-Kit Li, Chi-Wai Do, Chi-Ho To, and et al. 2023. "Differential Responses of Retinal Neurons and Glia Revealed via Proteomic Analysis on Primary and Secondary Retinal Ganglion Cell Degeneration" International Journal of Molecular Sciences 24, no. 15: 12109. https://doi.org/10.3390/ijms241512109