
The Influence of Pedo-Climatic Conditions on the Micromorphological, Phytochemical Features, and Biological Properties of Leaves of Saponaria sicula Raf

 , , , , and
Abstract
:
1. Introduction
2. Results
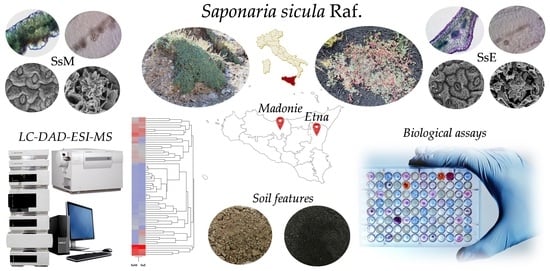
2.1. Soil Features
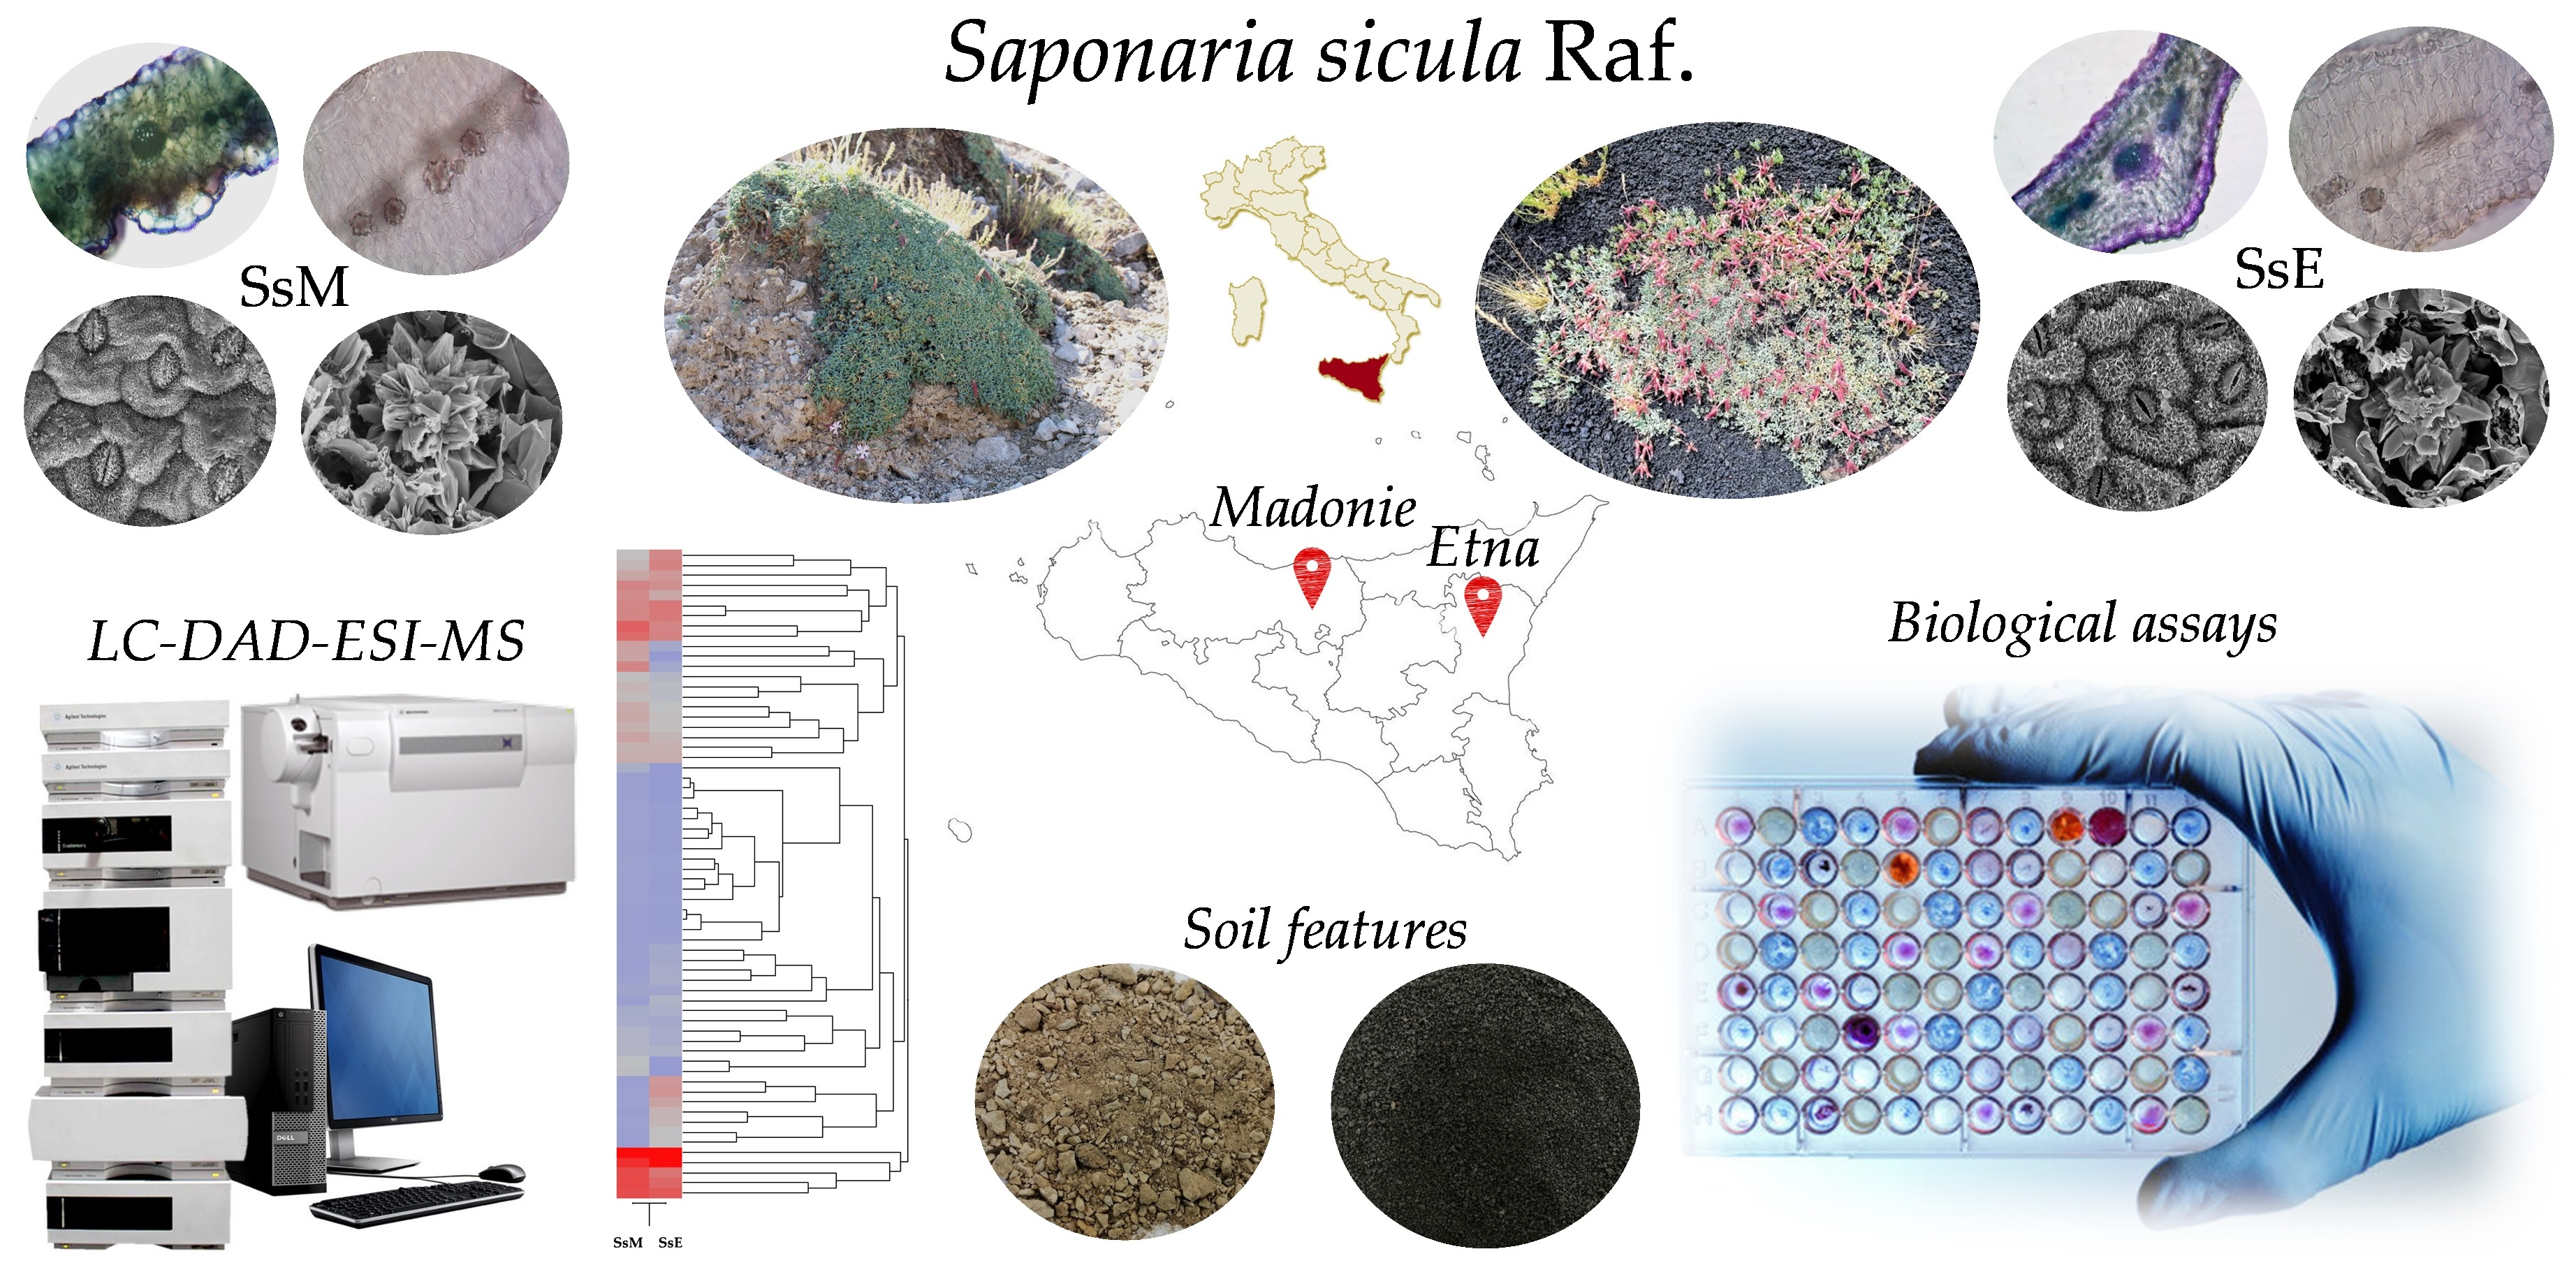
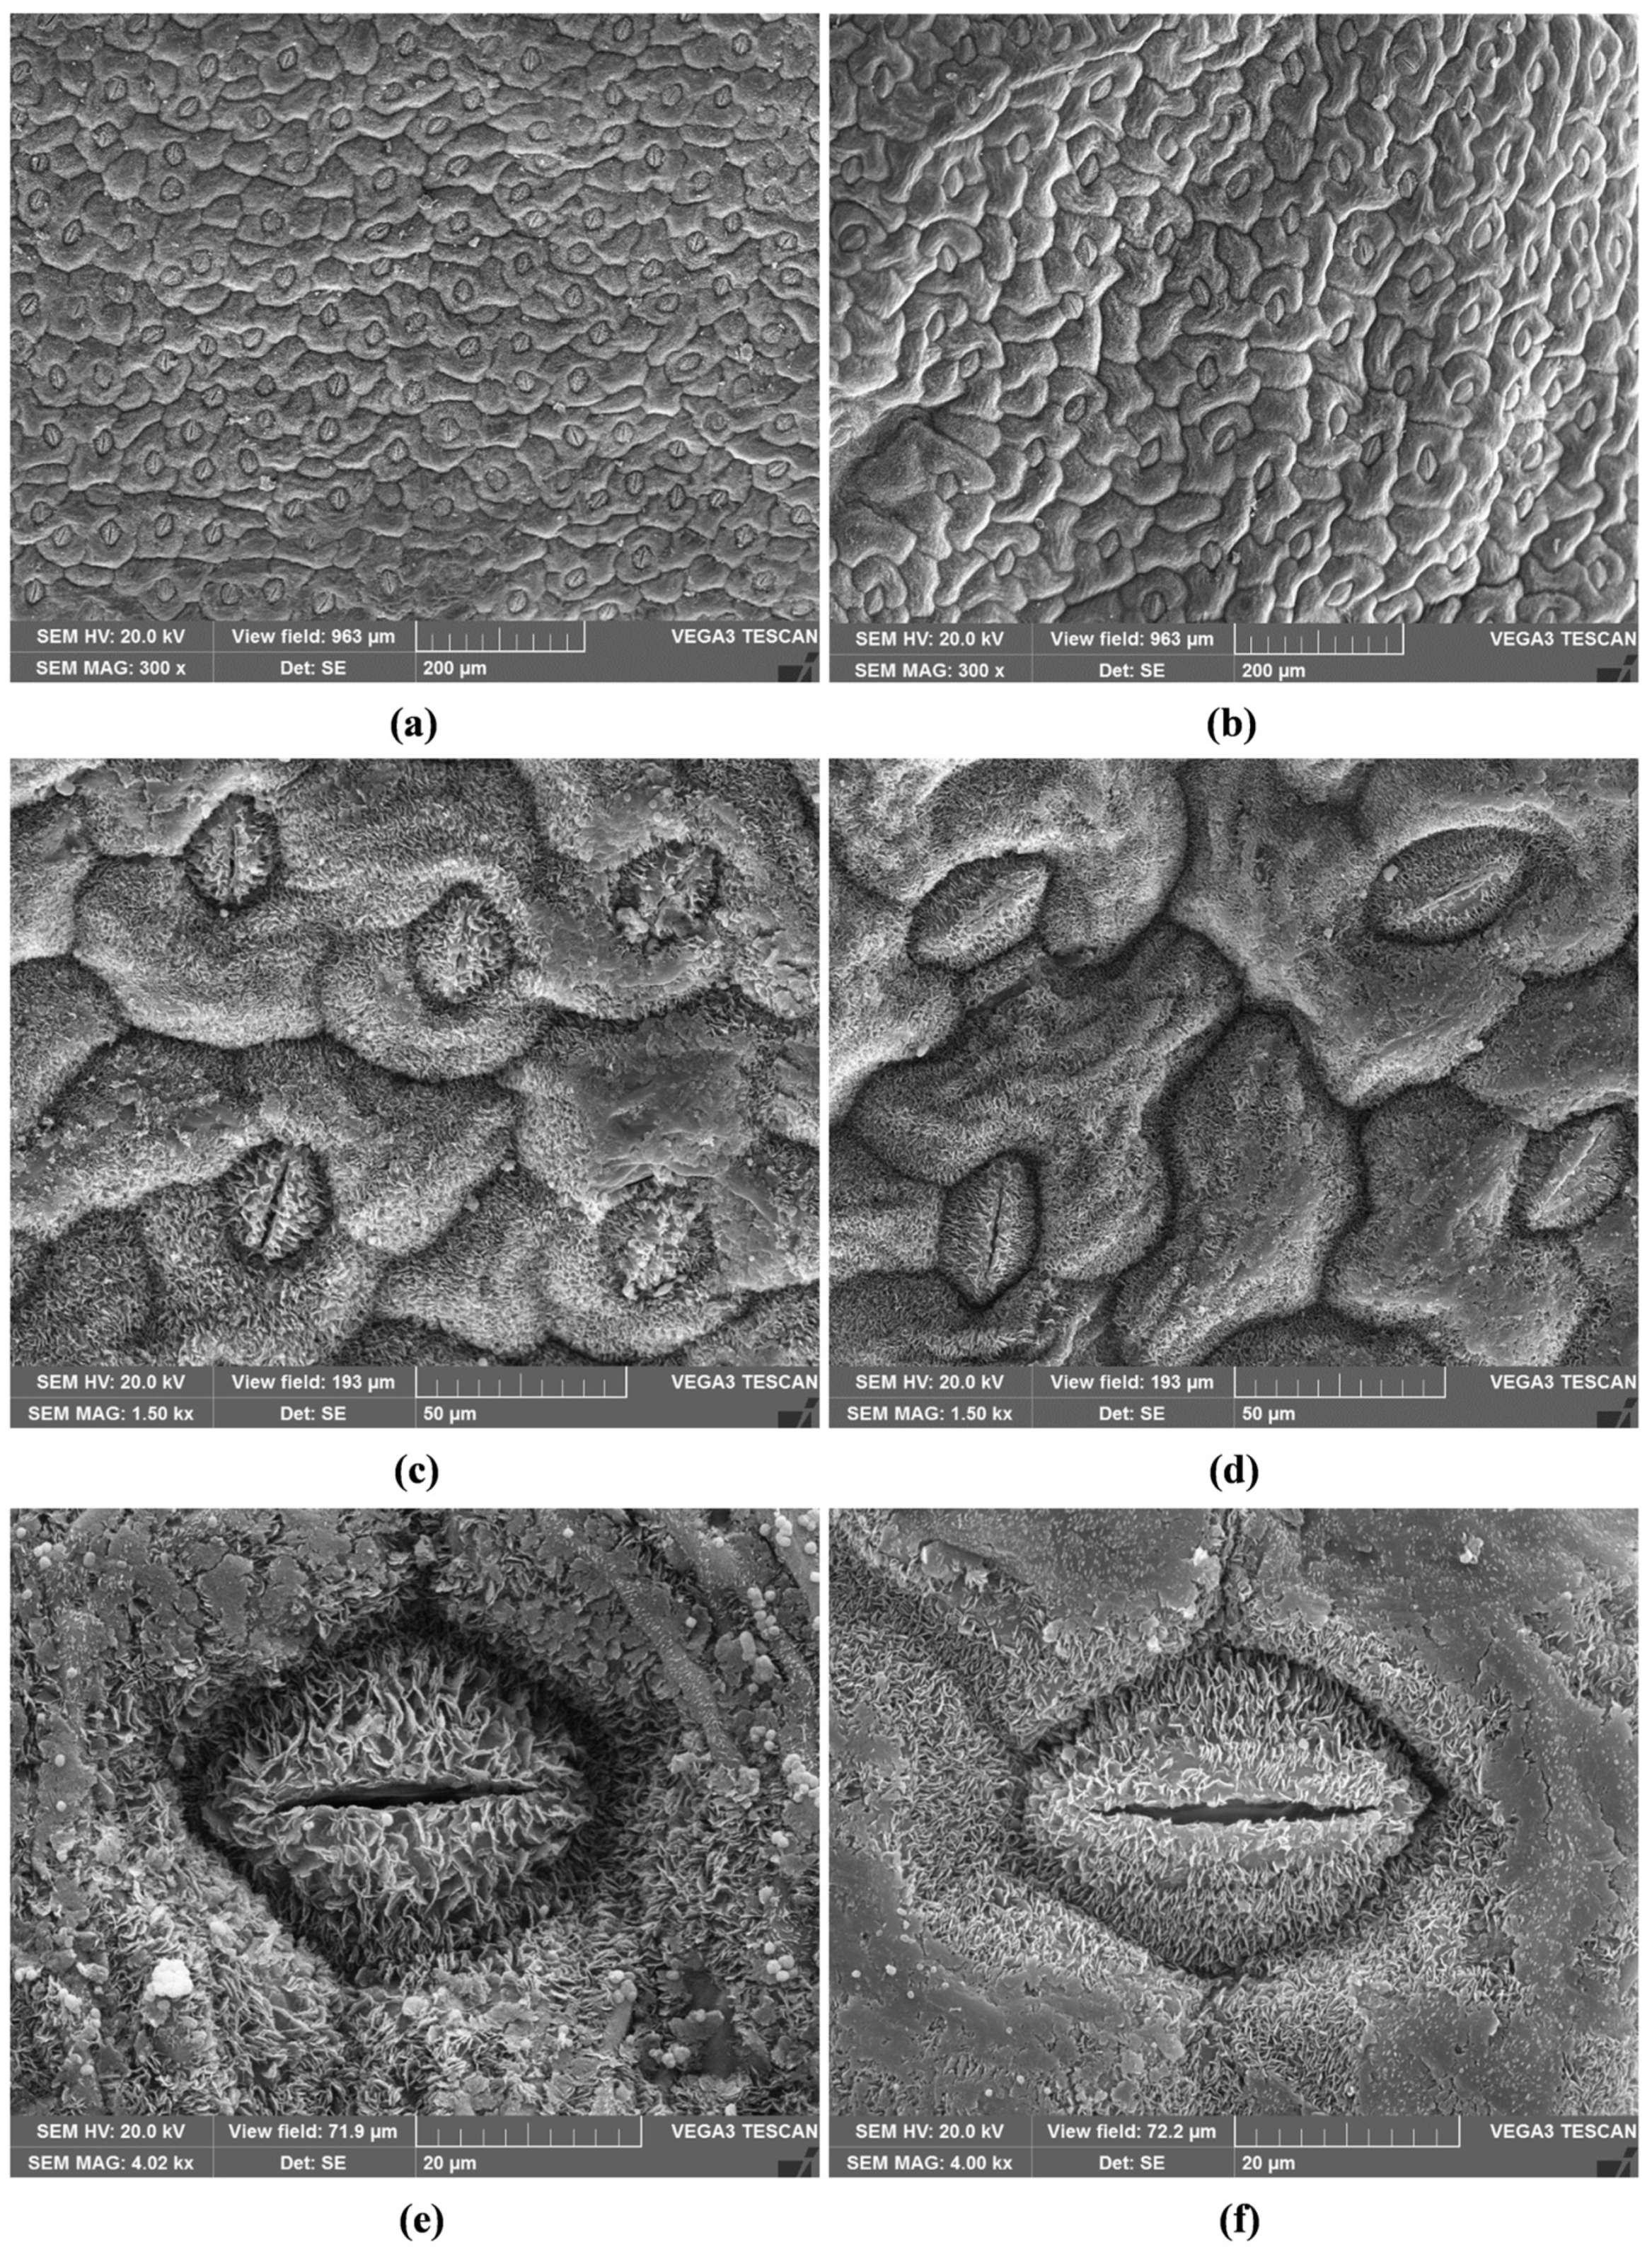
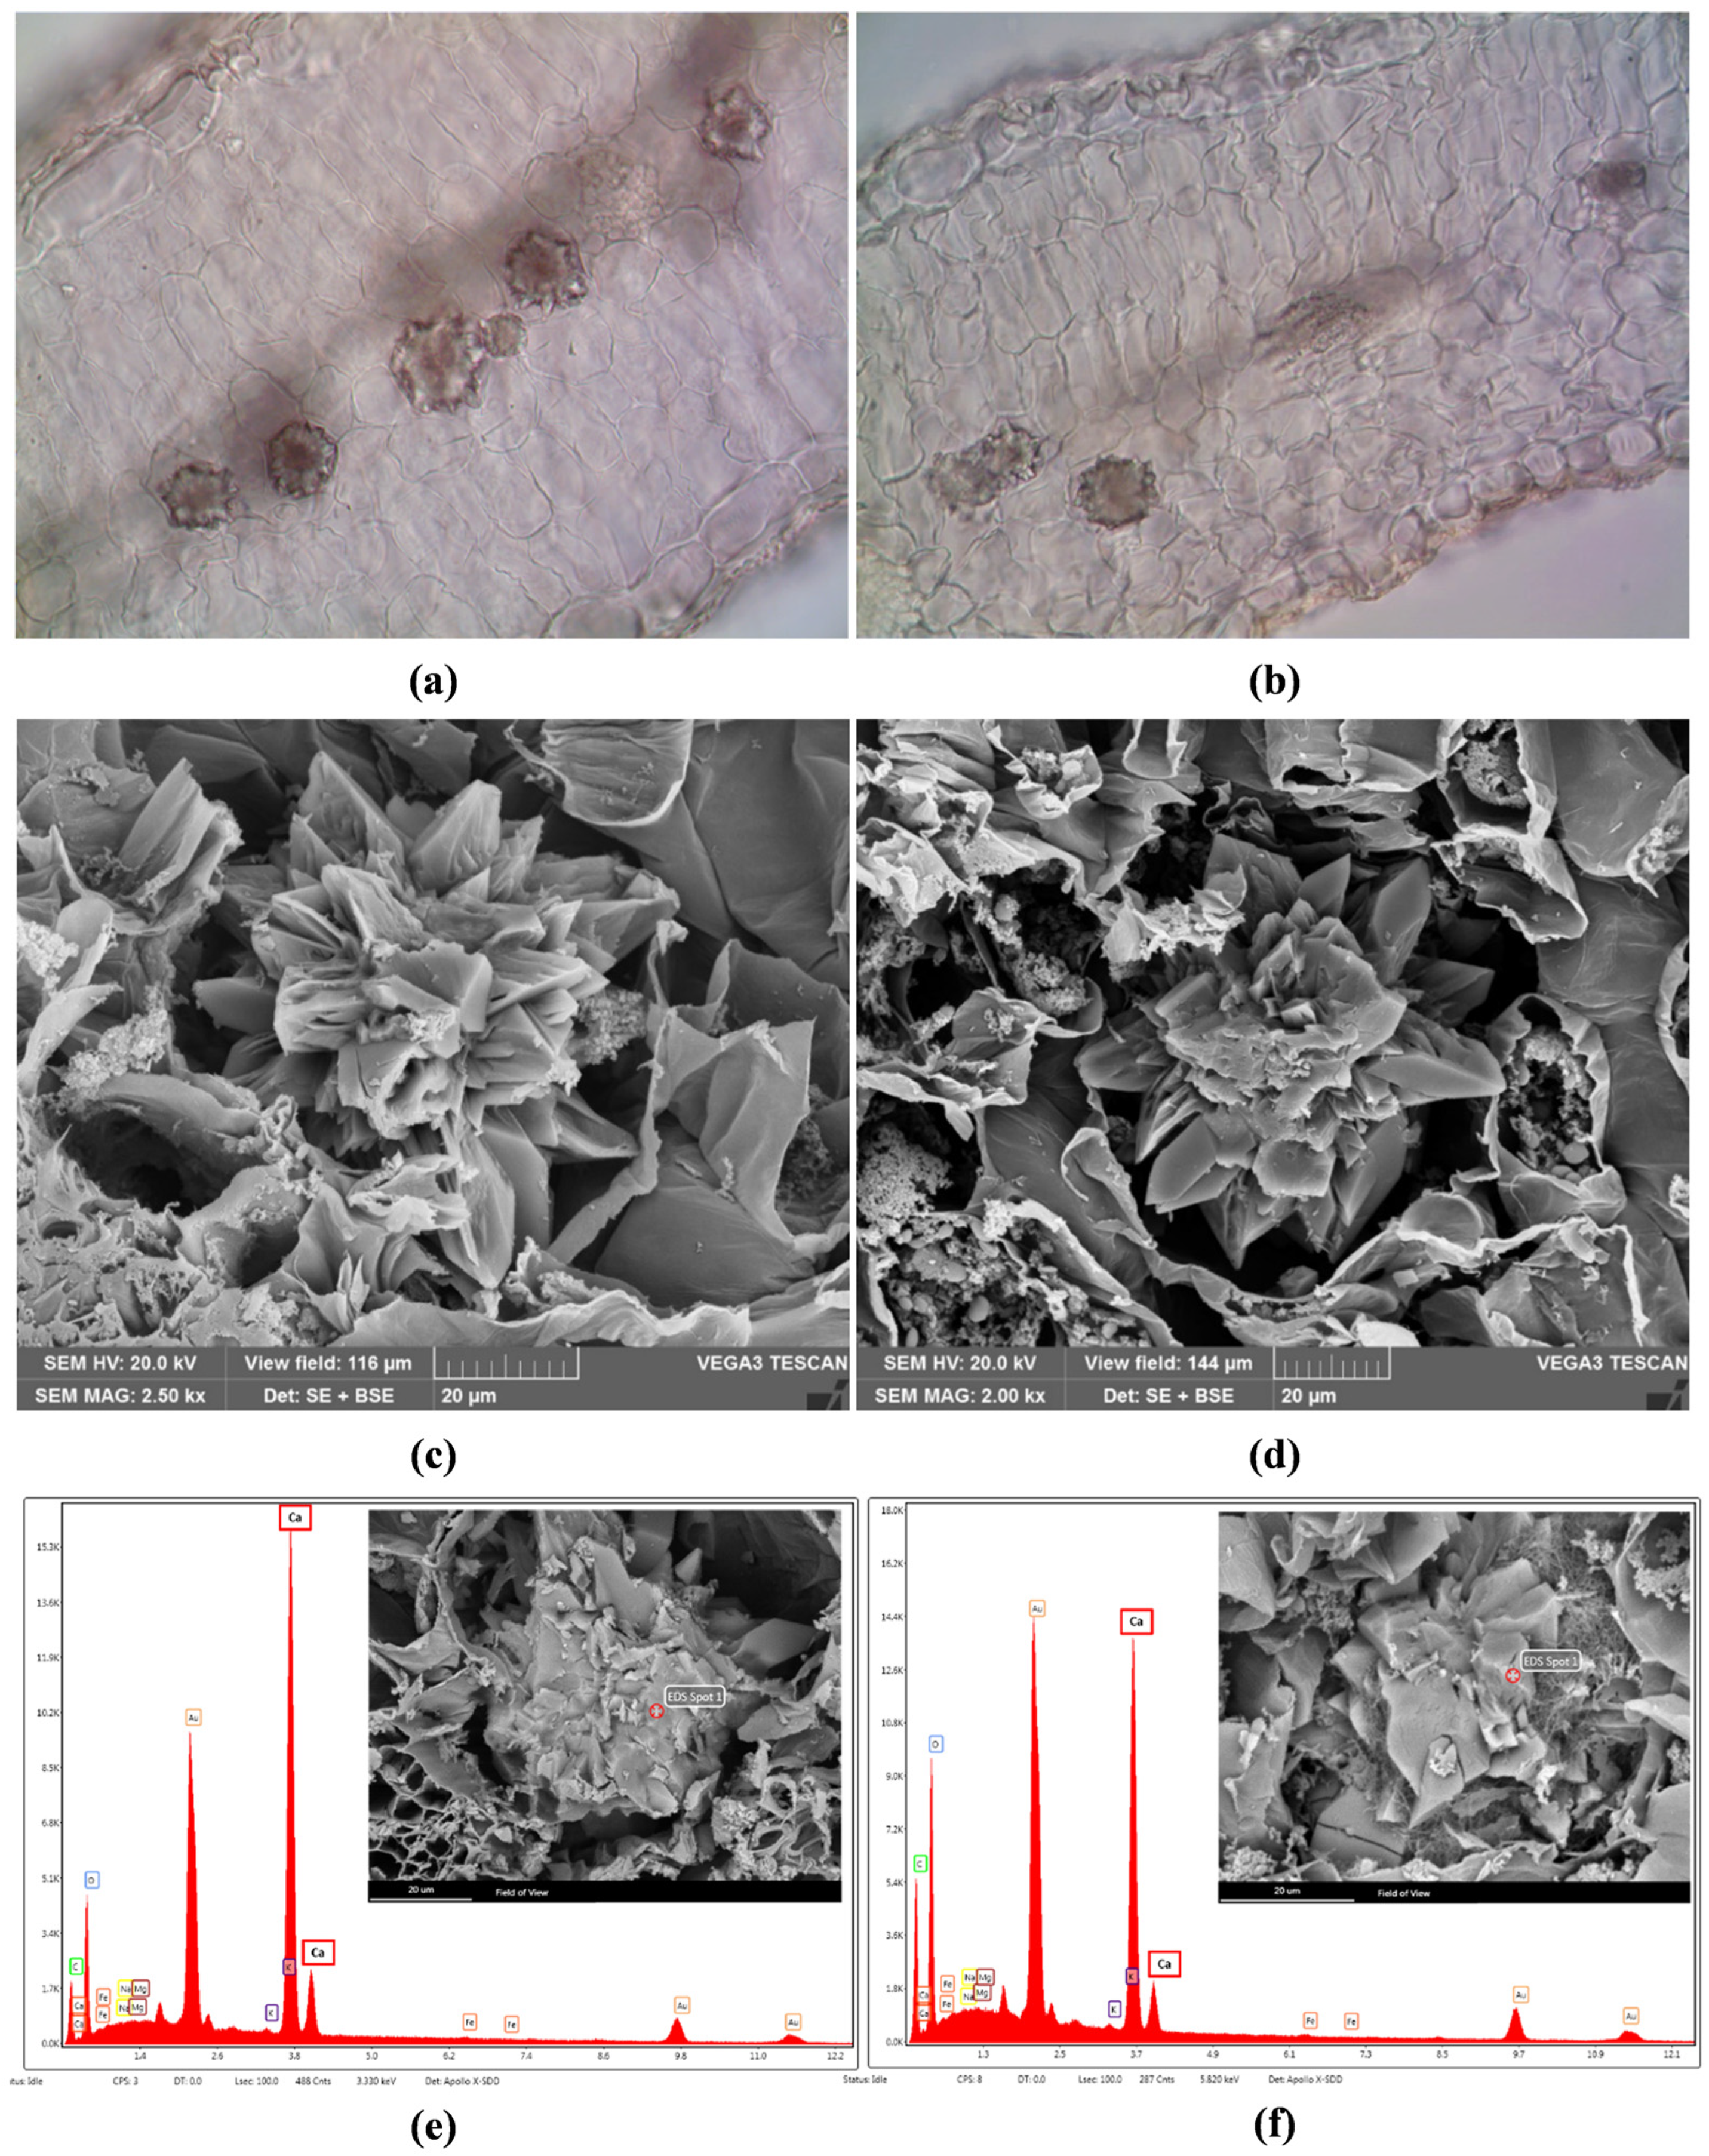
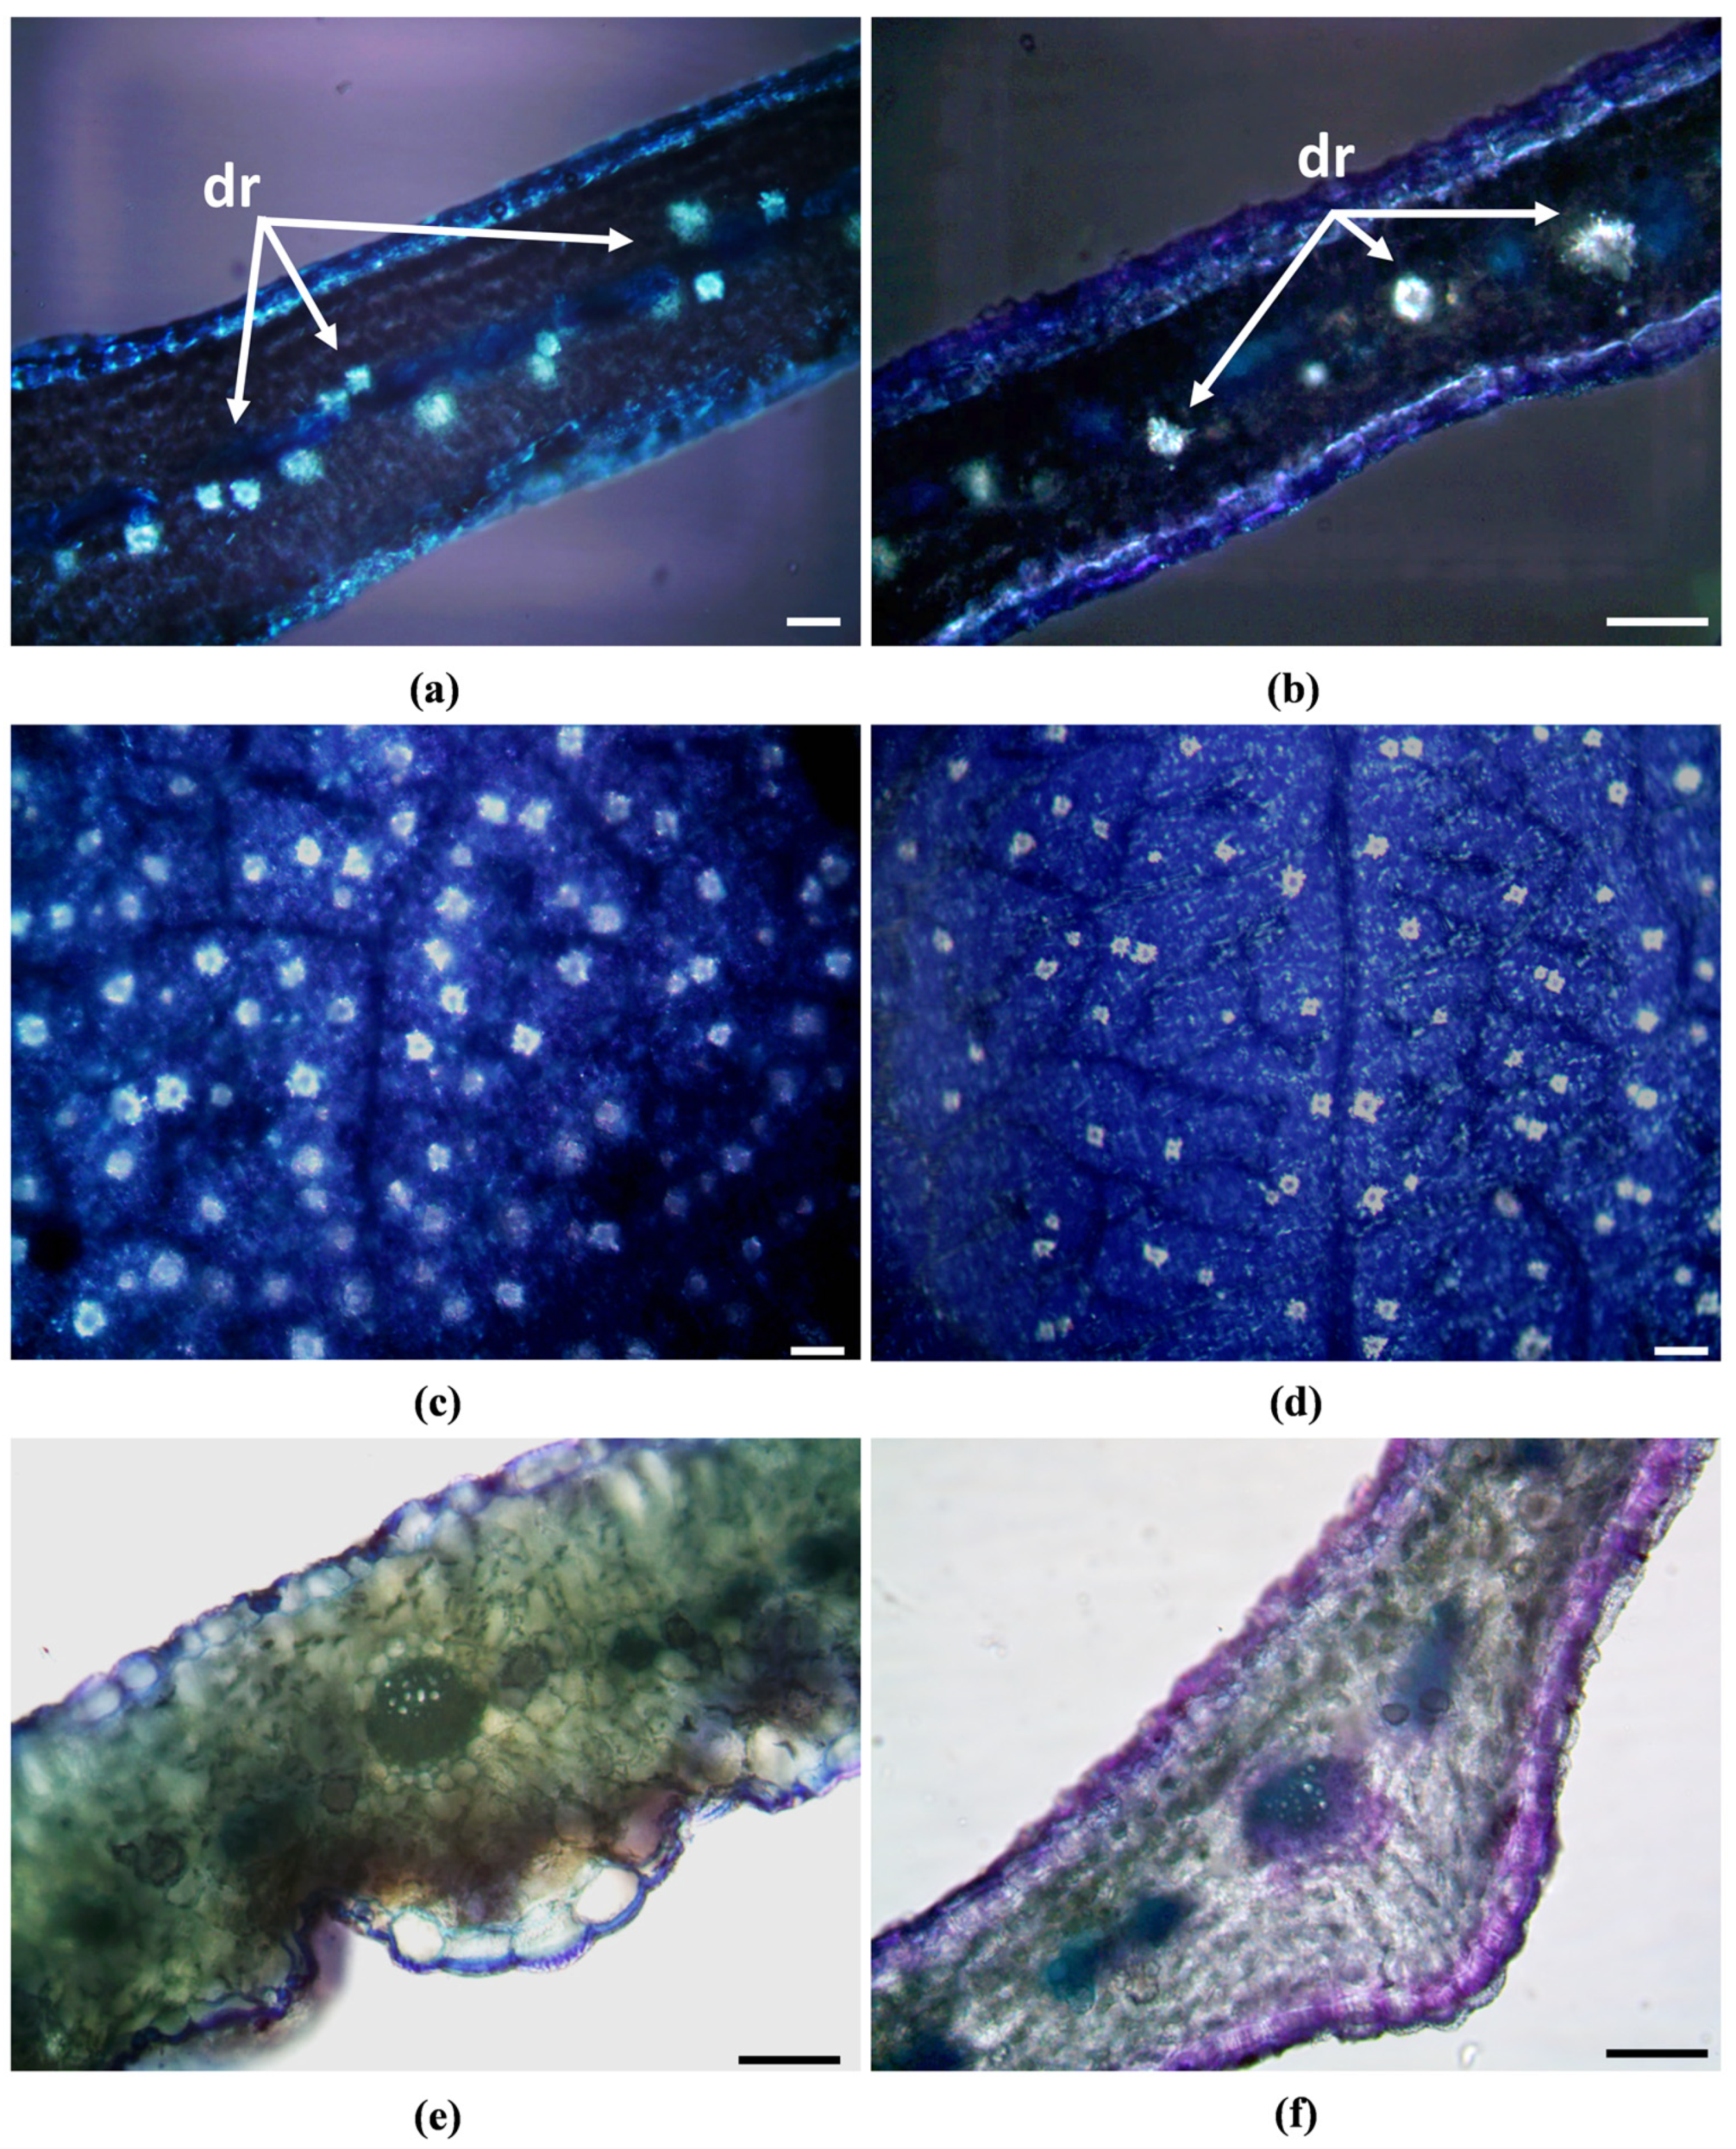
2.2. Micromorphological Characterisation
2.3. Stomatal Index and Density
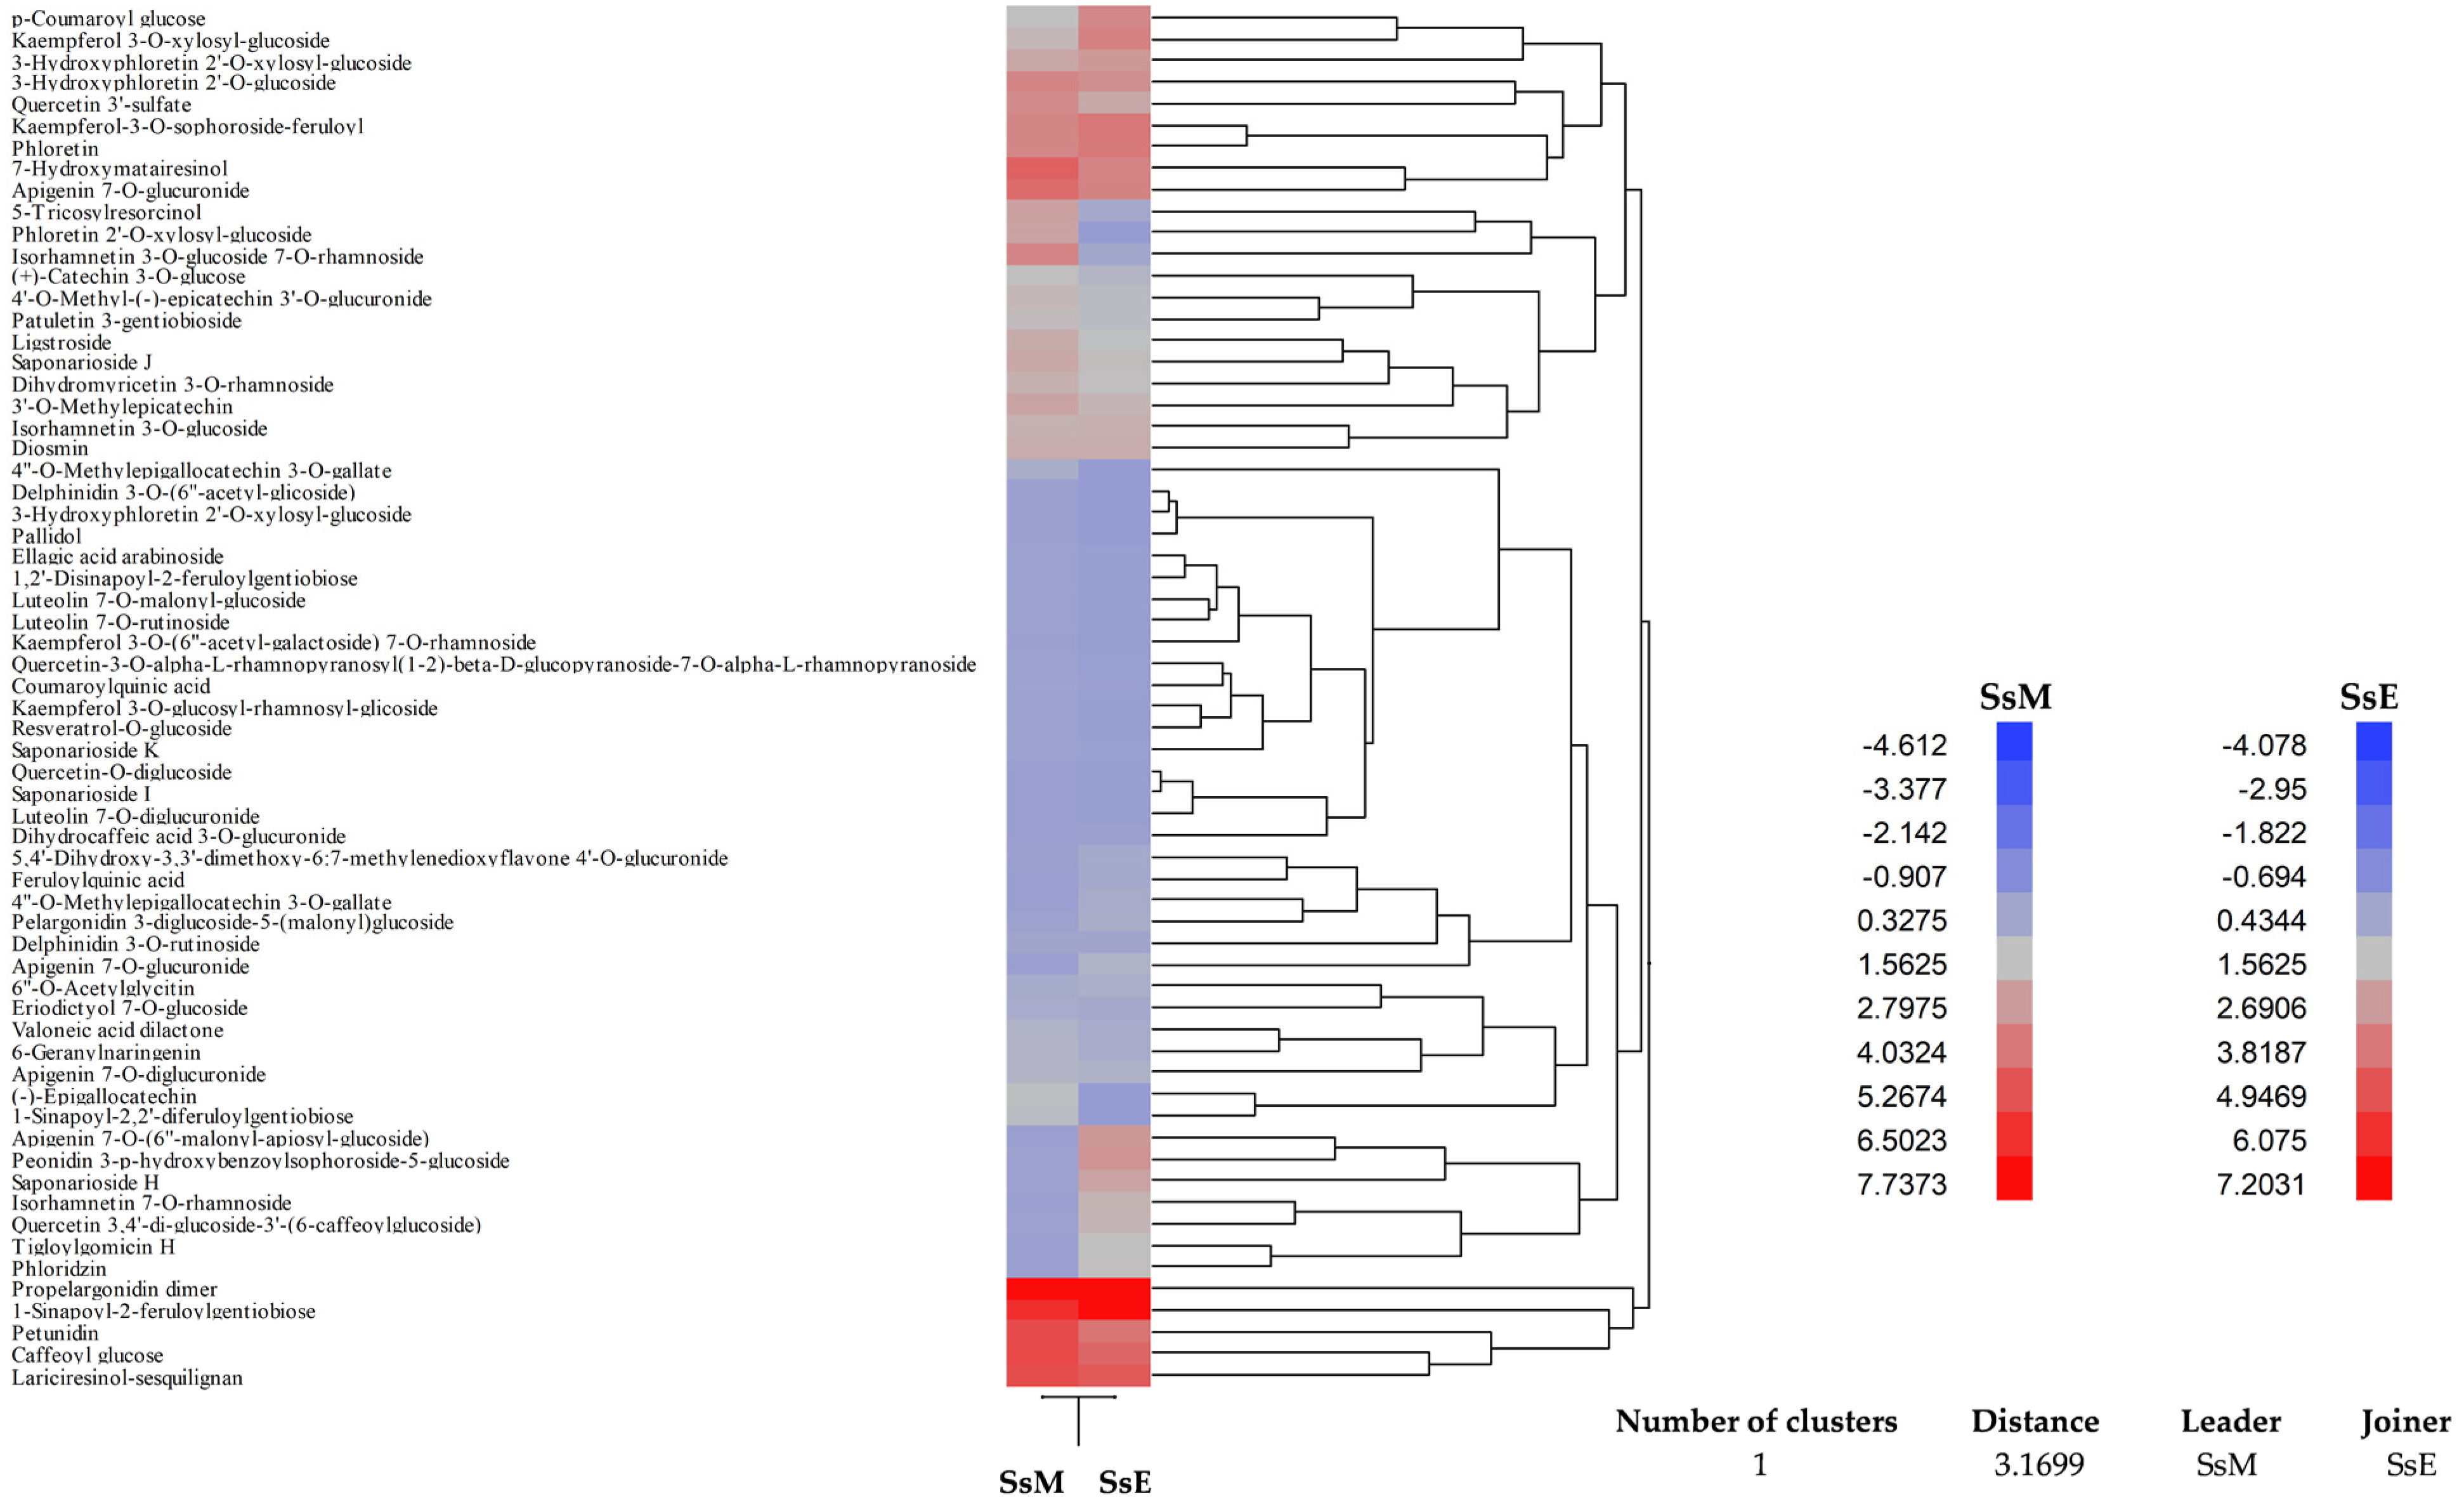
2.4. Phytochemical Analyses
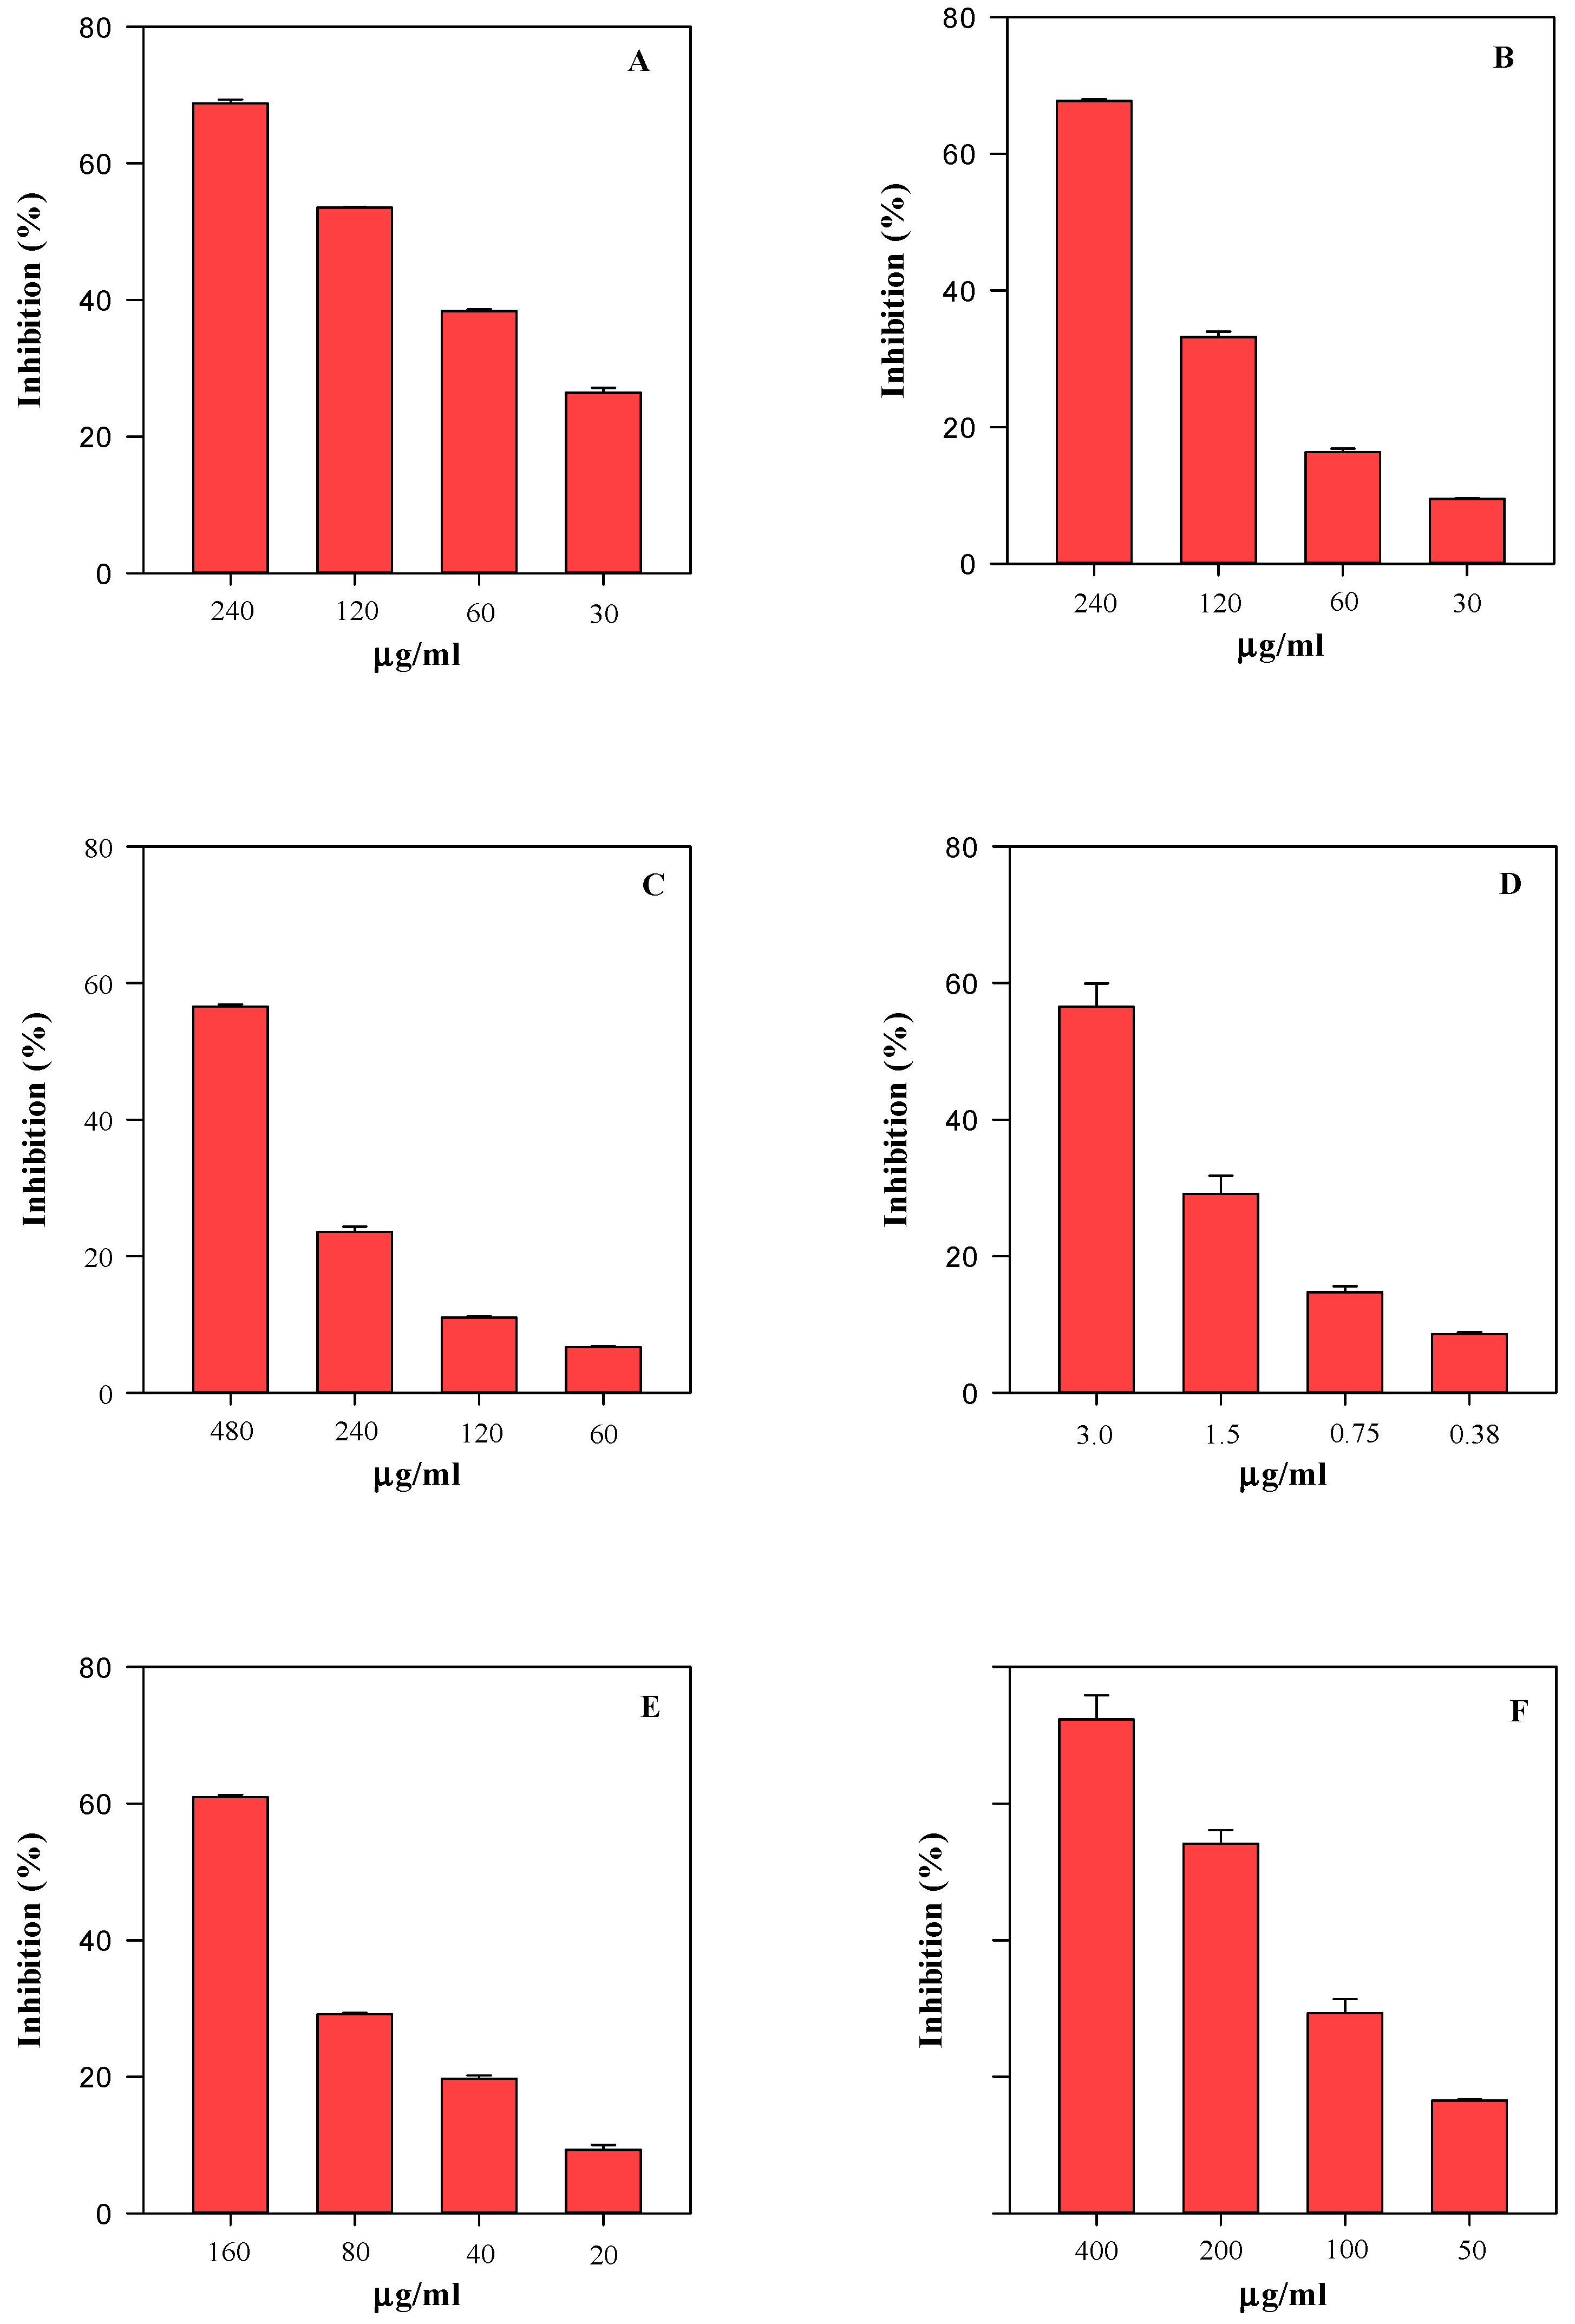
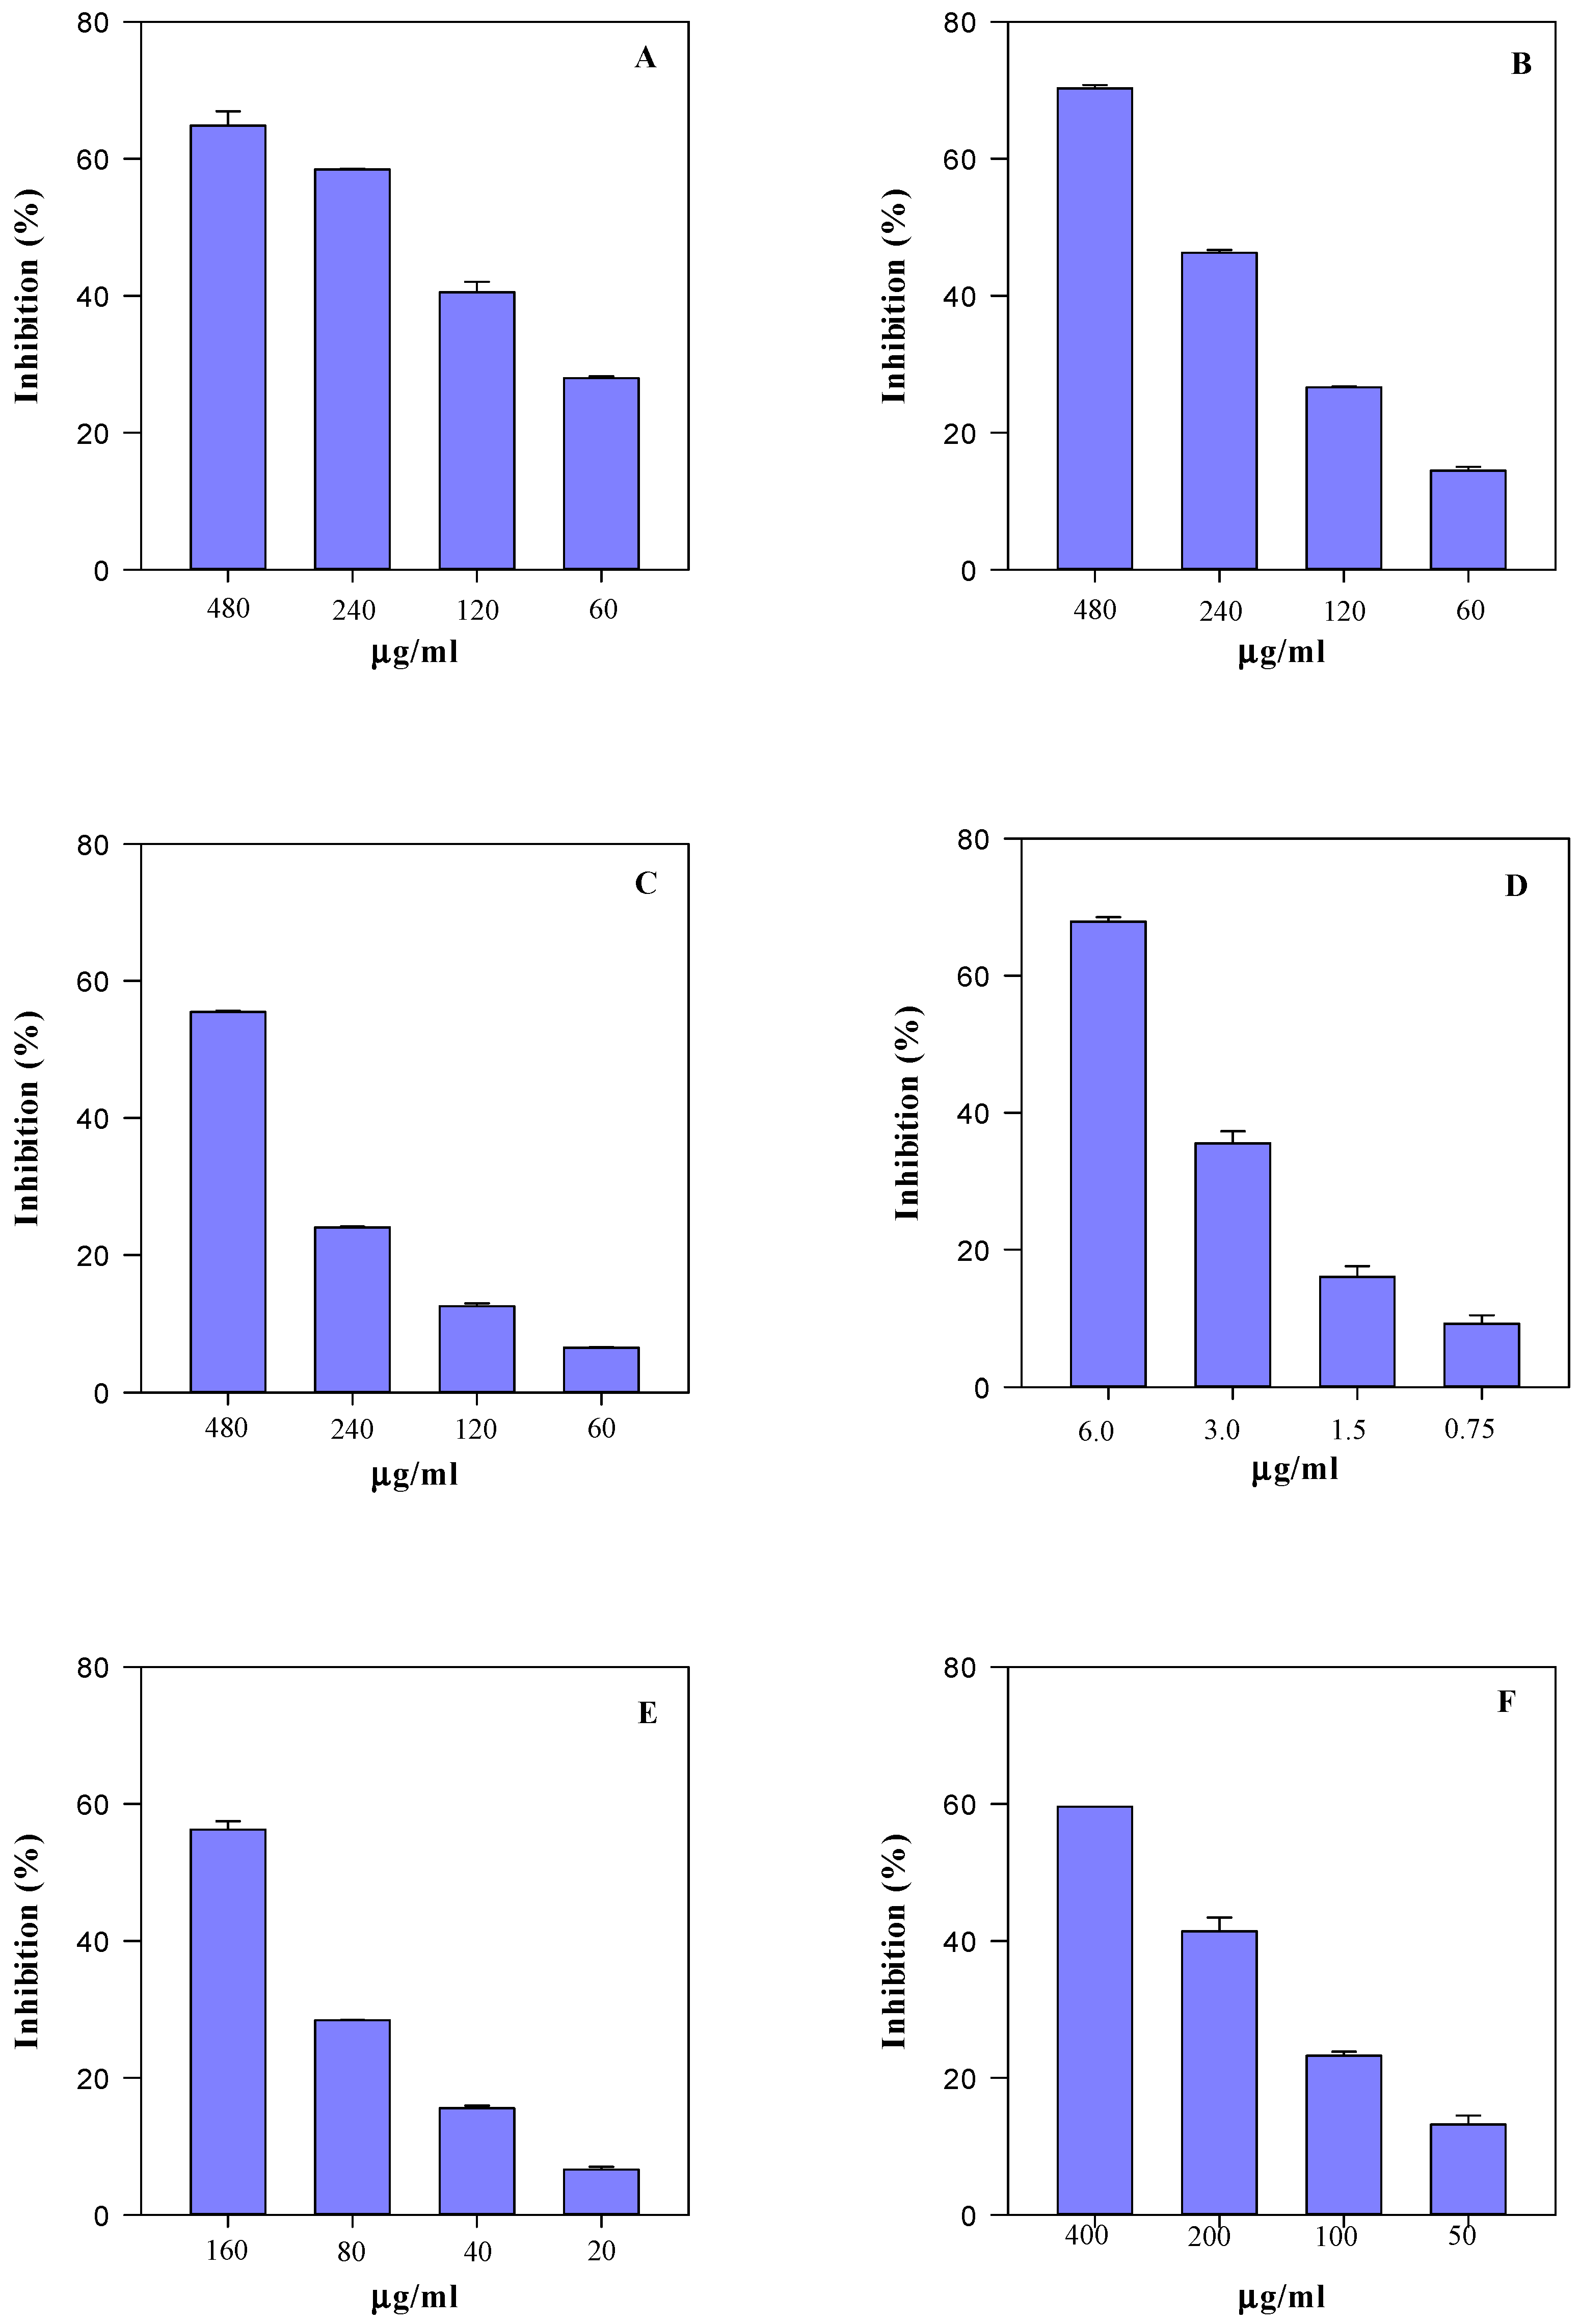
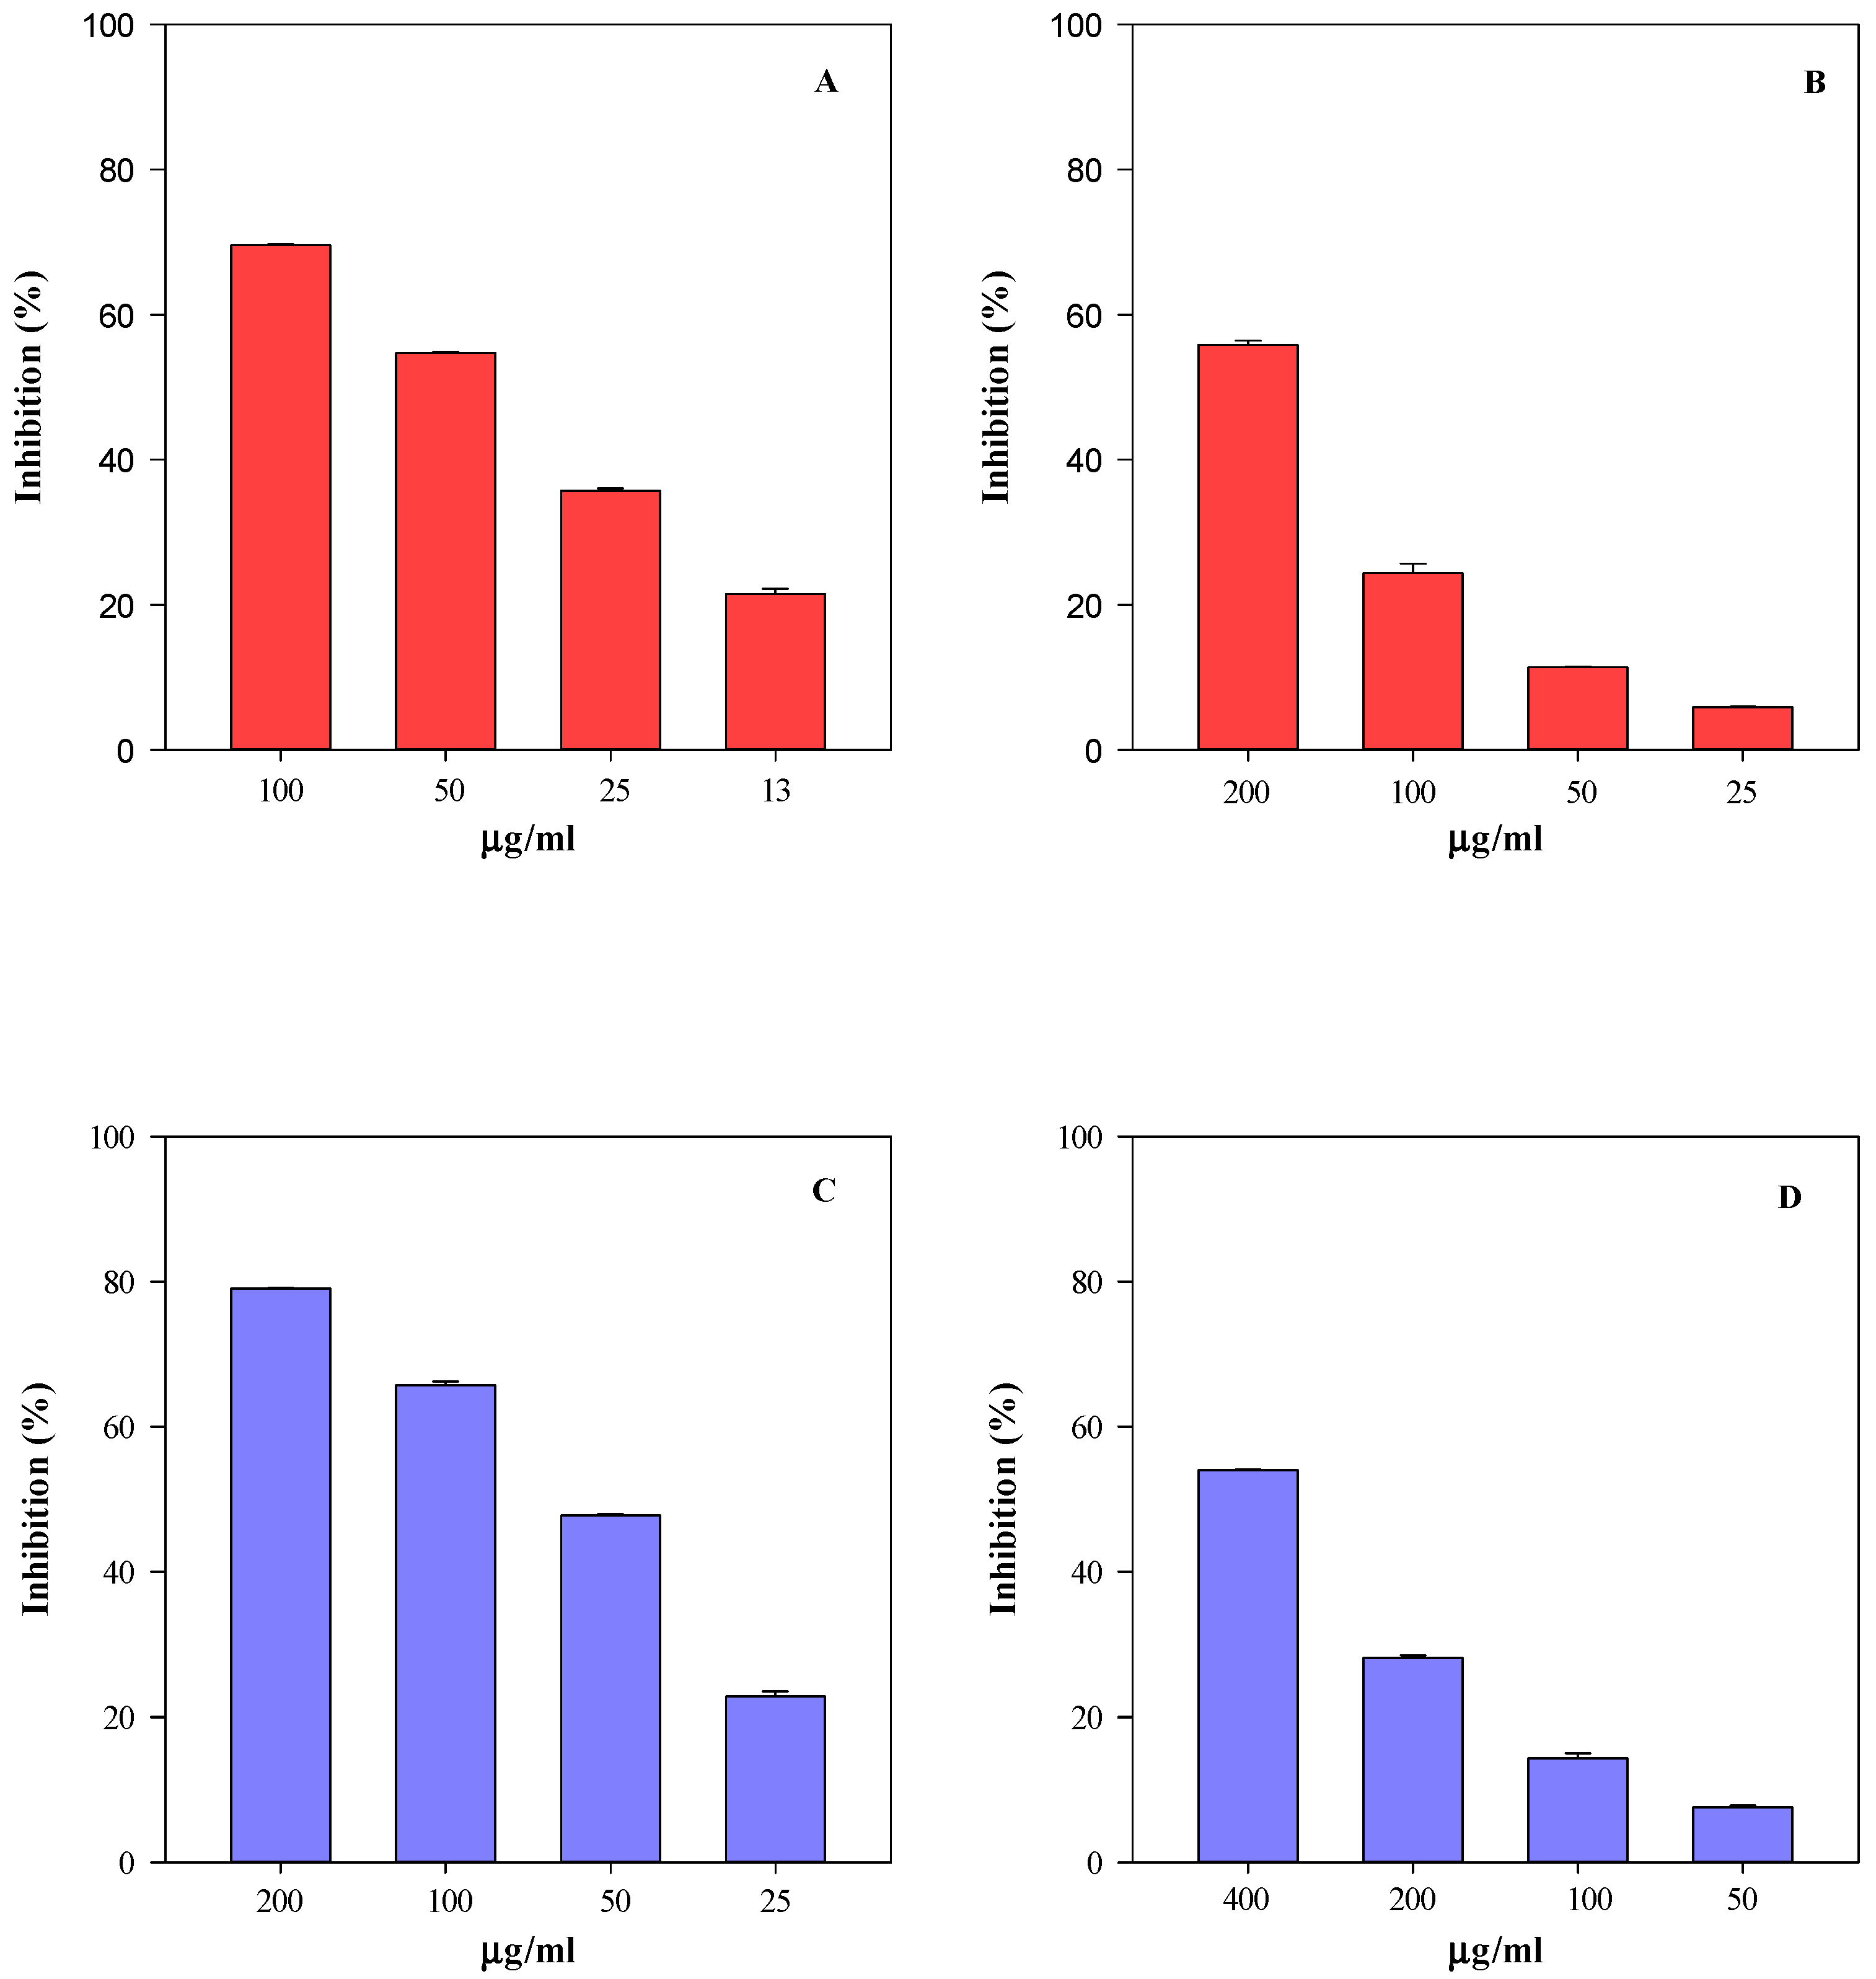
2.5. Biological Activity
3. Discussion
4. Materials and Methods
4.1. Chemicals
4.2. Plant Material
4.3. Light and Scanning Electron Microscopy
4.4. Sample Extraction
4.5. Phytochemical Screening
4.5.1. Total Phenols
4.5.2. Total Flavonoids
4.5.3. Vanillin Index
4.5.4. Proanthocyanidins
4.6. Phytochemical Characterisation by LC-DAD-ESI-MS Analysis
4.7. Antioxidant and Anti-Inflammatory Activity
4.7.1. TEAC Assay
4.7.2. FRAP Assay
4.7.3. DPPH Assay
4.7.4. ORAC
4.7.5. ICA Assay
4.7.6. BCB Assay
4.7.7. Protease Assay
4.7.8. ADA Assay
4.8. Statistical Analysis
5. Conclusions
Author Contributions
Funding
Institutional Review Board Statement
Informed Consent Statement
Data Availability Statement
Acknowledgments
Conflicts of Interest
References
- Chandra, S.; Rawat, D.S.; Bhatt, A. Phytochemistry and pharmacological activities of Saponaria officinalis L.: A review. Not. Sci. Biol. 2021, 13, 10809. [Google Scholar] [CrossRef]
- Jürgens, A.; Witt, T.; Gottsberger, G. Flower scent composition in Dianthus and Saponaria species (Caryophyllaceae) and its relevance for pollination biology and taxonomy. Biochem. Syst. Ecol. 2003, 31, 345–357. [Google Scholar] [CrossRef]
- Petrović, G.M.; Ilić, M.D.; Stankov-Jovanović, V.P.; Stojanović, G.S.; Jovanović, S.Č. Phytochemical analysis of Saponaria officinalis L. shoots and flowers essential oils. Nat. Prod. Res. 2018, 32, 331–334. [Google Scholar] [CrossRef]
- Ataşlar, E. Morphological and anatomical investigations on the Saponaria kotschyi Boiss. (Caryophyllaceae). Turk. J. Bot. 2004, 28, 193–199. [Google Scholar]
- Chevallier, A. The Encyclopedia of Medicinal Plants Dorling Kindersley; DK Publishing: London, UK, 1996. [Google Scholar]
- Baytop, T. Türkiye’de Bitkiler Ile Tedavi: Geçmişte ve Bugün; Nobel Tıp Kitabevleri: Istanbul, Turkey, 1999. [Google Scholar]
- Tutin, T.G.; Burges, N.A.; Chater, A.O.; Heywood, V.H.; Moore, D.M.; Valentine, D.H.; Walters, S.M.; Webb, D.A. Floro Europea; Cambridge University Press: Cambridge, UK, 1993; pp. 223–224. [Google Scholar]
- Pignatti, S.; Guarino, R.; La Rosa, M. Flora d’Italia, 2nd ed.; Edagricole di New Business: Media, Bologna, 2019. [Google Scholar]
- Mazzeo, G.; Longo, S.; Seminara, A.R.; Bella, S.; Ferrauto, G. Preliminary observations on anthophilous insects and foraging behaviour of Apis mellifera L. in a protected area of the Etna Park. Redia 2007, 90, 109–113. [Google Scholar]
- Sardashiti, S. Effect of sucrose supplementation in micro-propagation nodal culture of Sicilian Soapwort (Saponaria sicula). Ornam. Med. Plants 2018, 2, 1–6. [Google Scholar]
- Cornara, L.; Sgrò, F.; Raimondo, F.M.; Ingegneri, M.; Mastracci, L.; D’Angelo, V.; Germanò, M.P.; Trombetta, D.; Smeriglio, A. Pedoclimatic Conditions Influence the Morphological, Phytochemical and Biological Features of Mentha pulegium L. Plants 2023, 12, 24. [Google Scholar] [CrossRef]
- Ouédraogo, R.F.; Sama, H.; Nana, R.; Kihindo, A.P.; Kiendrébéogo, F.K.; Badiel, B.; Kaboré, Z.; Dondassé, E.; Ouédraogo, M.; Zombré, G. Impact of pedo-climatic conditions on Jatropha curcas L. seeds oil content. Int. J. Sci. Res. 2020, 10, 1230–1231. [Google Scholar]
- Sama, H.; Traoré, D.K.; Guenné, S.; Hilou, A.; Dicko, M.H. Effect of pedo-climatic conditions on physicochemical characteristics and agro-industrial potential of three native oilseeds fruits from Burkina Faso. BMC Plant. Biol. 2022, 22, 321. [Google Scholar] [CrossRef]
- Sharma, A.; Shahzad, B.; Rehman, A.; Bhardwaj, R.; Landi, M.; Zheng, B. Response of Phenylpropanoid Pathway and the Role of Polyphenols in Plants under Abiotic Stress. Molecules 2019, 24, 2452. [Google Scholar] [CrossRef] [Green Version]
- Woodward, F.I.; Kelly, C.K. The influence of CO2 concentration on stomatal density. New Phytol. 1995, 131, 311–327. [Google Scholar] [CrossRef]
- Bragagni, A.; Mastroianni, F.; Münker, C.; Conticelli, S.; Avanzinelli, R. A carbon-rich lithospheric mantle as a source for the large CO2 emissions of Etna volcano (Italy). Geology 2022, 50, 486–490. [Google Scholar] [CrossRef]
- Xu, Z.; Jiang, Y.; Jia, B.; Zhou, G. Elevated-CO2 Response of Stomata and Its Dependence on Environmental Factors. Front. Plant Sci. 2016, 7, 657. [Google Scholar] [CrossRef] [PubMed] [Green Version]
- Engel, T.; Barthlott, W. Micromorphology of epicuticolar waxes in Centrosperms. Plant Syst. Evol. 1988, 161, 71–85. [Google Scholar] [CrossRef]
- Esau, K. Anatomy of Seed Plants; John Wiley & Sons Inc.: New York, NY, USA, 1977; 576p. [Google Scholar]
- Tütüncü Konyar, S.; Öztürk, N.; Dane, F. Occurrence, types and distribution of calcium oxalate crystals in leaves and stems of some species of poisonous plants. Bot Stud. 2014, 55, 32. [Google Scholar] [CrossRef] [Green Version]
- Franceschi, V. Calcium oxalate in plants. Trends Plant Sci. 2001, 6, 331. [Google Scholar] [CrossRef] [PubMed]
- Dresselhaus, T.; Hückelhoven, R. Biotic and Abiotic Stress Responses in Crop Plants. Agronomy 2018, 8, 267. [Google Scholar] [CrossRef] [Green Version]
- Lamaoui, M.; Jemo, M.; Datla, R.; Bekkaoui, F. Heat and Drought Stresses in Crops and Approaches for Their Mitigation. Front. Plant Sci. 2018, 6, 26. [Google Scholar] [CrossRef]
- Mittler, R. Abiotic stress, the field environment and stress combination. Trends Plant Sci. 2006, 11, 15–19. [Google Scholar] [CrossRef]
- Rao, K.M.; Raghavendra, A.; Reddy, K.J. Physiology and Molecular Biology of Stress Tolerance in Plants; Springer Science & Business Media: New York, NY, USA, 2006. [Google Scholar]
- Pereira, A. Plant abiotic stress challenges from the changing environment. Front. Plant Sci. 2016, 7, 1123. [Google Scholar] [CrossRef] [Green Version]
- Lattanzio, V. Phenolic Compounds: Introduction. In Natural Products: Phytochemistry, Botany and Metabolism of Alkaloids, Phenolics and Terpenes; Ramawat, K.G., Mérillon, J.-M., Eds.; Springer: Berlin/Heidelberg, Germany, 2013; pp. 1543–1580. [Google Scholar]
- Andersen, C.P. Source–sink balance and carbon allocation below ground in plants exposed to ozone. New Phytol. 2003, 157, 213–228. [Google Scholar] [CrossRef] [PubMed]
- Lattanzio, V.; Cardinali, A.; Ruta, C.; Fortunato, I.M.; Lattanzio, V.M.T.; Linsalata, V.; Cicco, N. Relationship of secondary metabolism to growth in oregano (Origanum vulgare L.) shoot cultures under nutritional stress. Environ. Exp. Bot. 2009, 65, 54–62. [Google Scholar] [CrossRef]
- Dixon, R.A.; Paiva, N.L. Stress-induced phenylpropanoid metabolism. Plant Cell 1995, 7, 1085. [Google Scholar] [CrossRef]
- Halvorson, J.J.; Gonzalez, J.M.; Hagerman, A.E.; Smith, J.L. Sorption of tannin and related phenolic compounds and effects on soluble-N in soil. Soil Biol. Biochem. 2009, 41, 2002–2010. [Google Scholar] [CrossRef]
- Grace, S.C.; Logan, B.A. Energy dissipation and radical scavenging by the plant phenylpropanoid pathway. Philos. Trans. R. Soc. B 2000, 355, 1499–1510. [Google Scholar] [CrossRef] [PubMed] [Green Version]
- Sharma, P.; Jha, A.B.; Dubey, R.S.; Pessarakli, M. Reactive oxygen species, oxidative damage, and antioxidative defense mechanism in plants under stressful conditions. J. Bot. 2012, 2012, 217037. [Google Scholar] [CrossRef] [Green Version]
- Demidchik, V. Mechanisms of oxidative stress in plants: From classical chemistry to cell biology. Environ. Exp. Bot. 2015, 109, 212–228. [Google Scholar] [CrossRef]
- Gupta, D.K.; Palma, J.M.; Corpas, F.J. Antioxidants and Antioxidant Enzymes in Higher Plants, 1st ed.; Springer: Cham, Switzerland, 2018. [Google Scholar]
- Hatier, J.H.B.; Gould, K.S. Foliar anthocyanins as modulators of stress signals. J. Theor. Biol. 2008, 253, 625–627. [Google Scholar] [CrossRef]
- Di Ferdinando, M.; Brunetti, C.; Fini, A.; Tattini, M. Flavonoids as antioxidants in plants under abiotic stresses. In Abiotic Stress Responses in Plants; Ahmad, P., Prasad, M., Eds.; Springer: New York, NY, USA, 2012; pp. 159–179. [Google Scholar]
- Procházková, D.; Boušová, I.; Wilhelmová, N. Antioxidant and prooxidant properties of flavonoids. Fitoterapia 2011, 82, 513–523. [Google Scholar] [CrossRef]
- Banjarnahor, S.D.; Artanti, N. Antioxidant properties of flavonoids. Med. J. Indones. 2014, 23, 239–244. [Google Scholar] [CrossRef] [Green Version]
- Melidou, M.; Riganakos, K.; Galaris, D. Protection against nuclear DNA damage offered by flavonoids in cells exposed tohydrogen peroxide: The role of iron chelation. Free Radic. Biol. Med. 2005, 39, 1591–1600. [Google Scholar] [CrossRef] [PubMed]
- Mierziak, J.; Kostyn, K.; Kulma, A. Flavonoids as important molecules of plant interactions with the environment. Molecules 2014, 19, 16240–16265. [Google Scholar] [CrossRef] [PubMed] [Green Version]
- Tattini, M.; Galardi, C.; Pinelli, P.; Massai, R.; Remorini, D.; Agati, G. Differential accumulation of flavonoids and hydroxycinnamates in leaves of Ligustrum vulgare under excess light and drought stress. New Phytol. 2004, 163, 547–561. [Google Scholar] [CrossRef] [PubMed]
- Saunders, J.A.; McClure, J.W. The distribution of flavonoids in chloroplasts of twenty-five species of vascular plants. Phytochemistry 1976, 15, 809–810. [Google Scholar] [CrossRef]
- Gao, L.; Liu, Y.; Wang, X.; Li, Y.; Han, R. Lower levels of UV-B light trigger the adaptive responses by inducing plant antioxidant metabolism and flavonoid biosynthesis in Medicago sativa seedlings. Funct. Plant Biol. 2019, 46, 896–906. [Google Scholar] [CrossRef]
- Gourlay, G.; Hawkins, B.J.; Albert, A.; Schnitzler, J.P.; Constabel, C.P. Condensed tannins as antioxidants that protect poplar against oxidative stress from drought and UV-B. Plant Cell Environ. 2022, 45, 362–377. [Google Scholar] [CrossRef]
- Hodaei, M.; Rahimmalek, M.; Arzani, A.; Talebi, M. The effect of water stress on phytochemical accumulation, bioactive compounds and expression of key genes involved in flavonoid biosynthesis in Chrysanthemum morifolium L. Ind. Crops Prod. 2018, 120, 295–304. [Google Scholar] [CrossRef]
- Shomali, A.; Das, S.; Arif, N.; Sarraf, M.; Zahra, N.; Yadav, V.; Aliniaeifard, S.; Chauhan, D.K.; Hasanuzzaman, M. Diverse Physiological Roles of Flavonoids in Plant Environmental Stress Responses and Tolerance. Plants 2022, 11, 3158. [Google Scholar] [CrossRef]
- Shahzad, B.; Tanveer, M.; Rehman, A.; Cheema, S.A.; Fahad, S.; Rehman, S.; Sharma, A. Nickel; whether toxic or essential for plants and environment––A review. Plant Physiol. Biochem. 2018, 132, 641–651. [Google Scholar] [CrossRef]
- Ancillotti, C.; Bogani, P.; Biricolti, S.; Calistri, E.; Checchini, L.; Ciofi, L.; Gonnelli, C.; Del Bubba, M. Changes in polyphenol and sugar concentrations in wild type and genetically modified Nicotiana langsdori Weinmann in response to water and heat stress. Plant Physiol. Biochem. 2015, 97, 52–61. [Google Scholar] [CrossRef]
- Bazan, G.; Marino, P.; Guarino, R.; Domina, G.; Schicchi, R. Bioclimatology and vegetation series in Sicily: A geostatistical approach. Ann. Bot. Fenn. 2015, 52, 1–18. [Google Scholar] [CrossRef]
- MiPAAF. Metodi Ufficiali di Analisi Chimica del Suolo. Decreto Ministeriale del 13 Settembre. Gazzetta Ufficiale della Repubblica Italiana, Supplemento ordinario N 284; Ministero del Politiche Agricole, Alimentari Forestali (MiPAAF): Roman, Italy, 21 October 1999. [Google Scholar]
- Chieco, C.; Rotondi, A.; Morrone, L.; Rapparini, F.; Baraldi, R. An ethanol-based fixation method for anatomical and micro-501 morphological characterization of leaves of various tree species. Biotech. Histochem. 2013, 88, 109–119. [Google Scholar] [CrossRef] [PubMed]
- Jackson, B.P. , Snowdon, D.W. Atlas of Microscopy of Medicinal Plants, Culinary Herbs and Spices; Belhaven Press A division of Pinter Publishers: London, UK, 1990. [Google Scholar]
- O’Brien, T.P.; Feder, N.; McCully, M.E. Polychromatic staining of plant cell walls by toluidine blue O. Protoplasma 1964, 59, 368–373. [Google Scholar] [CrossRef]
- O’Brien, T.P.; McCully, M.E. The Study of Plant Structure: Principles and Selected Methods; Termocarphy: Melbourne, Australia, 1981. [Google Scholar]
- He, H.; Bleby, T.M.; Veneklaas, E.J.; Lambers, H.; Kuo, J. Morphologies and elemental compositions of calcium crystals in phyllodes and branchlets of Acacia robeorum (Leguminosae: Mimosoideae). Ann Bot. 2012, 109, 887–896. [Google Scholar] [CrossRef] [PubMed] [Green Version]
- Schneider, C.A.; Rasband, W.S.; Eliceiri, K.W. NIH Image to ImageJ: 25 years of image analysis. Nat. Methods 2012, 9, 671–675. [Google Scholar] [CrossRef]
- Salisbury, E.J. On the causes and ecological significance of stomatal frequency, with special reference to the woodland flora. Philos. Trans. R. Soc. B 1927, 216, 431–439. [Google Scholar]
- Ghosh, M.; Davis, T.A. Stomata and trichomes in leaves of young plants. Phytomorphology 1973, 23, 216–229. [Google Scholar]
- Smeriglio, A.; Ragusa, S.; Monforte, M.T.; D’Angelo, V.; Circosta, C. Phytochemical analysis and evaluation of antioxidant and anti-acetylcholinesterase activities of Euphorbia dendroides L. (Euphorbiaceae) latex. Plant Biosyst. 2019, 153, 498–505. [Google Scholar] [CrossRef]
- Ingegneri, M.; Smeriglio, A.; Rando, R.; Gervasi, T.; Tamburello, M.P.; Ginestra, G.; La Camera, E.; Pennisi, R.; Sciortino, M.T.; Mandalari, G.; et al. Composition and Biological Properties of Blanched Skin and BlanchWater Belonging to Three Sicilian Almond Cultivars. Nutrients 2023, 15, 1545. [Google Scholar] [CrossRef]
- Monforte, M.T.; Smeriglio, A.; Germanò, M.P.; Pergolizzi, S.; Circosta, C.; Galati, E.M. Evaluation of antioxidant, antiinflammatory, and gastroprotective properties of Rubus fruticosus L. fruit juice. Phytother. Res. 2018, 32, 1404–1414. [Google Scholar] [CrossRef]
- Barreca, D.; Lagana, G.; Leuzzi, U.; Smeriglio, A.; Trombetta, D.; Bellocco, E. Evaluation of the nutraceutical, antioxidant and cytoprotective properties of ripe pistachio (Pistacia vera L., variety Bronte) hulls. Food Chem. 2016, 196, 493–502. [Google Scholar] [CrossRef] [PubMed]
- Smeriglio, A.; Denaro, M.; D’Angelo, V.; Germanò, M.P.; Trombetta, D. Antioxidant, anti-inflammatory and anti-angiogenic properties of Citrus lumia Juice. Front. Pharmacol. 2020, 11, 593506. [Google Scholar] [CrossRef] [PubMed]
- Danna, C.; Bazzicalupo, M.; Ingegneri, M.; Smeriglio, A.; Trombetta, D.; Burlando, B.; Cornara, L. Anti-Inflammatory and Wound Healing Properties of Leaf and Rhizome Extracts from the Medicinal Plant Peucedanum ostruthium (L.) W. D. J. Koch. Molecules 2022, 27, 4271. [Google Scholar] [CrossRef] [PubMed]
- Bazzicalupo, M.; Burlando, B.; Denaro, M.; Barreca, D.; Trombetta, D.; Smeriglio, A.; Cornara, L. Polyphenol characterization and skin-preserving properties of hydroalcoholic flower extract from Himantoglossum robertianum (Orchidaceae). Plants 2019, 8, 502. [Google Scholar] [CrossRef] [Green Version]
- Smeriglio, A.; Denaro, M.; Di Gristina, E.; Mastracci, L.; Grillo, F.; Cornara, L.; Trombetta, D. Pharmacognostic approach to evaluate the micromorphological, phytochemical and biological features of Citrus lumia seeds. Food Chem. 2022, 375, 131855. [Google Scholar] [CrossRef]


| Soil Features | Madonie | Etna |
|---|---|---|
| Sand % | 79.9 | 94.6 |
| Silt % | 19.0 | 1.3 |
| Clay % | 1.1 | 4.1 |
| pH | 8.3 | 7.5 |
| Total N (g/kg) | 1.03 | 0.75 |
| CaCO3 g/kg | 916.8 | 4.5 |
| O.M. a (g/100) | 2.4 | 0.9 |
| C/N | 13.6 | 7.1 |
| Cond. b (1:5 mS/cm) | 0.07 | 0.05 |
| C.E.C c (meq/100 g) | 6.9 | 4.9 |
| Ca d (mg/kg) | 860.0 | 50.0 |
| Mg d (mg/kg) | 135.6 | 8.4 |
| K d (mg/kg) | 54.7 | 74.3 |
| SsM | SsE | |||
|---|---|---|---|---|
| Abaxial | Adaxial | Abaxial | Adaxial | |
| Stomatal Index (%) | 25 ± 2 | 26 ± 3 | 24 ± 2 | 29 ± 5 |
| Stomatal Density (stomata/mm2) | 102 ± 9 a,c | 140 ± 22 d | 171 ± 43 b | 208 ± 59 |
| Phytochemical Assays | SsM | SsE |
|---|---|---|
| Total phenols (g GAE a/100 g DE b) | 8.56 ± 0.57 g | 6.54 ± 0.16 |
| Flavonoids (g RE c/100 g DE) | 6.09 ± 0.17 g | 5.31 ± 0.32 |
| Vanillin index (g CE d/100 g DE) | 0.60 ± 0.02 g | 0.28 ± 0.08 |
| Proanthocyanidins (g CyE e/100 g DE) | 0.04 ± 0.06 | 0.05 ± 0.08 |
| Polymerisation index f | 15.00 | 5.60 |
| Compound | RT a | λmax (nm) | [M-H]− | [M-H]+ | SsM | SsE |
|---|---|---|---|---|---|---|
| Area% | ||||||
| p-Coumaroyl glucose d | 7.4 | 322 | - | 327 | 1.59 ± 0.06 b | 3.30 ± 0.15 |
| Acetylglycitin d | 11.2 | 264, 324 | - | 489 | 0.57 ± 0.02 b | 0.82 ± 0.04 |
| Eriodictyol-O-glucoside c | 13.3 | 289, 328 | - | 451 | 0.58 ± 0.02 | 0.55 ± 0.03 |
| Dihydroxy-dimethoxy-methylenedioxyflavone-O-glucuronide | 15.1 | 247, 274, 315, 342 | 533 | - | 0.07 ± 0.00 b | 0.61 ± 0.02 |
| Feruloylquinic acid d | 17.3 | 290, 322 | - | 369 | - | 0.54 ± 0.03 |
| Tricosylresorcinol | 18.9 | 273 | - | 433 | 2.64 ± 0.08 b | 0.56 ± 0.03 |
| Delphinidin-O-(acetyl-glycoside) d | 19.6 | 245, 529 | 506 | - | 0.06 ± 0.00 | - |
| Valoneic acid dilactone | 20.2 | 256, 305, 347, 362 | 468 | - | 0.93 ± 0.04 b | 0.66 ± 0.02 |
| Ellagic acid arabinoside d | 20.4 | 254, 360 | 433 | - | 0.10 ± 0.01 | 0.08 ± 0.00 |
| Apigenin-O-glucuronide d | 21.3 | 267, 336 | - | 447 | - | 0.99 ± 0.03 |
| Luteolin-O-malonyl-glucoside d | 21.4 | 255, 267, 348 | 533 | - | 0.10 ± 0.01 | 0.08 ± 0.00 |
| (-)-Epigallocatechin c | 21.5 | 240, 274 | - | 307 | 1.47 ± 0.03 | - |
| Geranylnaringenin d | 22.6 | 289, 326 | - | 409 | 1.02 ± 0.02 b | 0.66 ± 0.01 |
| Methylepigallocatechin-O-gallate d | 22.7 | 232, 274 | - | 473 | 0.69 ± 0.03 | 0.70 ± 0.02 |
| Pallidol | 24.1 | 203, 230, 324 | 453 | - | 0.06 ± 0.00 | - |
| (+)-Catechin-O-glucose d | 25.0 | 238, 269 | - | 453 | 1.63 ± 0.05 b | 1.10 ± 0.08 |
| Kaempferol-O-(acetyl-galactoside)-O-rhamnoside d | 25.7 | 245, 265, 315, 350 | 635 | - | 0.06 ± 0.00 | 0.06 ± 0.00 |
| Apigenin-O-diglucuronide d | 25.8 | 267, 336 | - | 623 | 1.02 ± 0.02 | 0.96 ± 0.03 |
| Methyl-(-)-epicatechin-O-glucuronide d | 27.1 | 240, 274 | - | 481 | 1.89 ± 0.03 b | 1.32 ± 0.04 |
| Ligstroside | 29.0 | 235, 275 | - | 525 | 2.28 ± 0.08 b | 1.52 ± 0.05 |
| Phloretin-O-xylosyl-glucoside d | 30.2 | 242, 289 | - | 541 | 2.53 ± 0.12 | - |
| Apigenin-O-(malonyl-apiosyl-glucoside) d | 30.5 | 268, 333 | - | 651 | - | 2.80 ± 0.10 |
| Hydroxyphloretin-O-xylosyl-glucoside d | 30.9 | 242, 289 | - | 585 | 2.44 ± 0.08 b | 2.80 ± 0.12 |
| Quercetin-O-alpha-L-rhamnopyranosyl(1-2)-beta-D-glucopyranoside-O-alpha-L-rhamnopyranoside d | 31.0 | 258, 272, 303, 365 | 755 | - | 0.11 ± 0.00 | 0.12 ± 0.01 |
| Hydroxyphloretin-O-glucoside d | 31.4 | 242, 289 | - | 585 | 3.58 ± 0.15 b | 3.07 ± 0.18 |
| Kaempferol-O-glucosyl-rhamnosyl-glicoside d | 31.6 | 253, 265, 325, 364 | 755 | - | 0.11 ± 0.00 | 0.10 ± 0.00 |
| Patuletin-gentiobioside | 32.2 | 261, 270, 355 | - | 657 | 1.75 ± 0.11 b | 1.34 ± 0.08 |
| Prodelphinidin dimer B3 | 32.6 | 228, 276, 320 | 609 | - | 0.30 ± 0.02 b | 0.42 ± 0.02 |
| Isorhamnetin-O-glicoside c | 32.7 | 255, 268, 303, 357 | - | 479 | 2.03 ± 0.05 | 2.07 ± 0.08 |
| Saponarin | 33.6 | 271, 336 | 593 | - | 0.11 ± 0.01 | 0.09 ± 0.00 |
| Kaempferol-O-xylosyl-glucoside d | 33.7 | 253, 266, 323, 364 | - | 581 | 1.90 ± 0.08 b | 3.47 ± 0.14 |
| Quercetin-O-diglucoside d | 33.9 | 256, 362 | 625 | - | - | 0.09 ± 0.00 |
| Isorhamnetin-O-glucoside-O-rhamnoside d | 34.4 | 254, 265, 305, 356 | - | 625 | 3.56 ± 0.15 b | 0.47 ± 0.02 |
| Isorhamnetin-O-glicoside c | 34.8 | 255, 268, 303, 357 | - | 479 | - | 1.96 ± 0.07 |
| Propelargonidin dimer | 36.0 | 245, 280 | - | 563 | 10.49 ± 0.35 | 10.19 ± 0.22 |
| Hydroxyphloretin-O-xylosyl-glucoside d | 36.8 | 242, 289 | - | 585 | 0.06 ± 0.00 | - |
| Sinapoyl-feruloylgentiobiose | 38.6 | 282 | 723 | - | 6.54 ± 0.25 b | 7.43 ± 0.36 |
| Diosmin c | 40.3 | 260, 350 | - | 609 | 2.24 ± 0.11 | 2.16 ±0.08 |
| Luteolin-O-diglucuronide d | 40.4 | 245, 253, 267, 292, 348 | 637 | - | 0.01 ± 0.00 | 0.09 ± 0.00 |
| Saponarioside K | 41.2 | - | 988 | - | 0.12 ± 0.01 b | 0.17 ± 0.01 |
| Sinapoyl-diferuloylgentiobiose | 42.7 | 282 | - | 901 | 1.40 ± 0.10 | - |
| Kaempferol-O-feruloyl-sophoroside d | 43.4 | 245, 265, 317, 350 | - | 787 | 3.51 ± 0.15 | 3.83 ± 0.22 |
| Saponarioside J | 44.4 | - | - | 1104 | 2.41 ± 0.08 b | 1.67 ± 0.05 |
| Petunidin c | 45.8 | 279, 524 | - | 318 | 5.52 ± 0.22 b | 3.91 ± 0.17 |
| Peonidin-p-hydroxybenzoylsophoroside-glucoside d | 46.4 | 275, 500 | 906 | - | 0.09 ± 0.00 b | 2.94 ± 0.12 |
| Pelargonidin-diglucoside- (malonyl)-glucoside d | 46.8 | 267, 500 | 842 | - | 0.10 ± 0.00 b | 0.77 ± 0.02 |
| Phloretin c | 47.1 | 242, 289 | - | 275 | 3.52 ± 0.21 | 3.77 ± 0.18 |
| Saponarioside H | 47.4 | - | 779 | - | 0.09 ± 0.00 b | 2.47 ± 0.12 |
| Dihydromyricetin-O-rhamnoside d | 48.1 | 254, 274, 303, 374 | - | 467 | 2.08 ± 0.12 b | 1.60 ± 0.08 |
| Saponarioside I | 48.2 | - | 1282 | - | - | 0.09 ± 0.00 |
| Disinapoyl-feruloylgentiobiose | 48.8 | 238, 289, 320 | 929 | - | 0.09 ± 0.00 | 0.08 ± 0.00 |
| Quercetin-di-glucoside-(caffeoylglucoside) d | 49.7 | 257, 271, 301, 362 | 949 | - | 0.09 ± 0.00 b | 1.89 ± 0.08 |
| Caffeoyl glucose d | 50.6 | 290, 305, 328 | 342 | - | 5.60 ± 0.23 b | 4.33 ± 0.16 |
| Dihydrocaffeic acid-O-glucuronide d | 51.4 | 240, 300, 324 | 357 | - | - | 0.20 ± 0.01 |
| Tigloylgomicin H | 52.8 | 230, 280 | - | 501 | - | 1.53 ± 0.06 |
| Coumaroylquinic acid d | 53.8 | 280, 308, 320 | 337 | - | 0.13 ± 0.01 | 0.13 ± 0.01 |
| Resveratrol-O-glucoside d | 55.0 | 289 | 389 | - | 0.12 ± 0.01 | 0.10 ± 0.01 |
| Methylepicatechin d | 55.9 | 238, 274 | - | 305 | 2.55 ± 0.13 b | 1.88 ± 0.06 |
| Phloridzin c | 58.2 | 230, 285 | - | 437 | - | 1.62 ± 0.04 |
| Quercetin-sulfate d | 61.6 | 255, 270, 303, 370 | - | 383 | 3.35 ± 0.21 b | 2.28 ± 0.16 |
| Hydroxymatairesinol | 63.2 | 230, 280 | - | 375 | 4.81 ± 0.24 b | 3.38 ± 0.17 |
| Baicalin c | 64.2 | 244, 278, 315 | - | 447 | 4.45 ± 0.28 b | 3.44 ± 0.15 |
| Lariciresinol-sesquilignan | 72.9 | 230, 280 | - | 557 | 5.47 ± 0.28 b | 4.72 ± 0.14 |
| Assay | SsM | SsE | RS c |
|---|---|---|---|
| Trolox equivalent antioxidant capacity (TEAC) | 99.75 a,b (77.29–128.73) | 191.07 b (143.65–254.15) | 4.03 (1.72–9.45) |
| Ferric reducing antioxidant power (FRAP) | 165.72 a,b (137.31–199.99) | 254.90 b (207.04–313.84) | 3.69 (1.61–8.45) |
| 2,2-Diphenyl-1-picrylhydrazyl (DPPH) | 477.30 b (373.40–610.12) | 478.92 b (372.95–614.99) | 10.38 (8.82–12.22) |
| Oxygen radical absorbance capacity (ORAC) | 2.75 b (2.22–3.42) | 4.04 b (3.36–4.85) | 0.67 (0.32–0.88) |
| Iron-chelating activity (ICA) | 129.77 b (104.57–161.04) | 144.24 b (112.47–184.99) | 5.51 (2.46–12.32) |
| β-arotene bleaching (BCB) | 180.96 a,b (147.51–221.98) | 282.57 b (229.77–363.32) | 0.32 (0.15–0.55) |
| Albumin denaturation assay (ADA) | 195.60 a,b (154.03–248.40) | 390.22 b (299.15–509.03) | 11.16 (9.25–13.46) |
| Protease inhibitory activity | 43.48 b (34.99–54.04) | 61.53 b (51.07–74.14) | 18.97 (14.33–25.11) |
| Population | Collection Site | Coordinates | Altitude | Exposure | Substrate | SAF Code |
|---|---|---|---|---|---|---|
| Madonie | Quacella | 37°50′48.61′′ N 14°0′55.02′′ E | 1350 | W | carbonate | 100081 |
| Etna Mt | Piano Provenzana | 37°47′56.53′′ N 15°02′44.88′′ E | 1800 | S | volcanic | 100082 |
Disclaimer/Publisher’s Note: The statements, opinions and data contained in all publications are solely those of the individual author(s) and contributor(s) and not of MDPI and/or the editor(s). MDPI and/or the editor(s) disclaim responsibility for any injury to people or property resulting from any ideas, methods, instructions or products referred to in the content. |
© 2023 by the authors. Licensee MDPI, Basel, Switzerland. This article is an open access article distributed under the terms and conditions of the Creative Commons Attribution (CC BY) license (https://creativecommons.org/licenses/by/4.0/).
Share and Cite
Cornara, L.; Malaspina, P.; Betuzzi, F.; Di Gristina, E.; D’Arrigo, M.; Ingegneri, M.; Trombetta, D.; Smeriglio, A. The Influence of Pedo-Climatic Conditions on the Micromorphological, Phytochemical Features, and Biological Properties of Leaves of Saponaria sicula Raf. Int. J. Mol. Sci. 2023, 24, 11693. https://doi.org/10.3390/ijms241411693
Cornara L, Malaspina P, Betuzzi F, Di Gristina E, D’Arrigo M, Ingegneri M, Trombetta D, Smeriglio A. The Influence of Pedo-Climatic Conditions on the Micromorphological, Phytochemical Features, and Biological Properties of Leaves of Saponaria sicula Raf. International Journal of Molecular Sciences. 2023; 24(14):11693. https://doi.org/10.3390/ijms241411693
Chicago/Turabian StyleCornara, Laura, Paola Malaspina, Federica Betuzzi, Emilio Di Gristina, Manuela D’Arrigo, Mariarosaria Ingegneri, Domenico Trombetta, and Antonella Smeriglio. 2023. "The Influence of Pedo-Climatic Conditions on the Micromorphological, Phytochemical Features, and Biological Properties of Leaves of Saponaria sicula Raf" International Journal of Molecular Sciences 24, no. 14: 11693. https://doi.org/10.3390/ijms241411693