Article

Genome-Wide Identification and Analysis of the Plant Cysteine Oxidase (PCO) Gene Family in Brassica napus and Its Role in Abiotic Stress Response

1
Oil Crops Research Institute, Chinese Academy of Agricultural Sciences, Wuhan 430062, China
2
College of Plant Science and Technology, Huazhong Agricultural University, Wuhan 430070, China
*
Author to whom correspondence should be addressed.
Int. J. Mol. Sci. 2023, 24(14), 11242; https://doi.org/10.3390/ijms241411242
Submission received: 12 May 2023 / Revised: 5 July 2023 / Accepted: 6 July 2023 / Published: 8 July 2023
(This article belongs to the Special Issue Crop Stress Biology and Molecular Breeding 3.0)

Abstract

:
Plant Cysteine Oxidase (PCO) is a plant O2-sensing enzyme catalyzing the oxidation of cysteine to Cys-sulfinic acid at the N-termini of target proteins. To better understand the Brassica napus PCO gene family, PCO genes in B. napus and related species were analyzed. In this study, 20, 7 and 8 PCO genes were identified in Brassica napus, Brassica rapa and Brassica oleracea, respectively. According to phylogenetic analysis, the PCOs were divided into five groups: PCO1, PCO2, PCO3, PCO4 and PCO5. Gene organization and motif distribution analysis suggested that the PCO gene family was relatively conserved during evolution. According to the public expression data, PCO genes were expressed in different tissues at different developmental stages. Moreover, qRT-PCR data showed that most of the Bna/Bra/BoPCO5 members were expressed in leaves, roots, flowers and siliques, suggesting an important role in both vegetative and reproductive development. Expression of BnaPCO was induced by various abiotic stress, especially waterlogging stress, which was consistent with the result of cis-element analysis. In this study, the PCO gene family of Brassicaceae was analyzed for the first time, which contributes to a comprehensive understanding of the origin and evolution of PCO genes in Brassicaceae and the function of BnaPCO in abiotic stress responses.

1. Introduction

Cysteine (Cys) oxidation is an essential post-translational modification (PTM), which controls protein half-life and protein function [1]. It is reported that ROS-mediated hormone signaling can be transduced by cysteine oxidation in plant, which is associated with root growth, pollen tube elongation and various abiotic stress responses [2]. Plant Cysteine Oxidases (PCOs) are the enzymes catalyzing N-terminal cysteinyl residues to sulfinic acid to promote proteasomal degradation in plants [3]. It has been shown that Plant Cysteine Oxidases use molecular oxygen atoms to catalyze dioxygenation of Nt-Cys to Cys-sulfinic acid in ERF-VIIs (ETHYLENE RESPONSE FACTOR group VIIs), as well as other substrates VRN2 and ZPR2 [4,5] for subsequent Nt-arginylation [6,7]. Meanwhile, ERF-VIIs are known as the regulators of hypoxia-regulated transcriptional reprogramming to adapt the environmental change [8,9,10]. PCO activity is sensitive to physiologically relevant fluctuations in O2 availability [11], thus these enzymes can act as plant O2 sensors with a key role in regulating ERF-VII stability. In other words, as an enzyme, Plant Cysteine Oxidases (PCOs) are a direct link between environmental stimuli and molecular physiological outcomes [12].
In Arabidopsis, AtPCOs catalyze the oxidation of cysteine to Cys-sulfinic acid at the N-termini of target proteins, a reaction that co-translational methionine cleavage exposes the N-terminal Cys for oxidation [6,7,11]. Oxidized N-terminal Cys residues are substrates for arginyl transferase enzymes, with the arising arginylated N-termini recognized by ubiquitin ligases [13]. Additionally, then the ubiquitinated protein will be degraded. Therefore, the N-termini is the signal for protein degradation, which is called the N-degron pathway. It is reported that PCOs isolated from Marchantia polymorpha (MpPCO) and Klebsormidium nitens (KnPCO) exhibit cysteine dioxygenase activity, indicating that PCO enzymes are conserved in early land plants and algae [14]. The MpPCO was incubated with the N-termini of MpERF-like (a 14-mer peptide representing the Cys-initiating N-terminus of MpERF-like, CRMNKRLGKGETGL), and MpPCO-catalyzed MpERF-like oxidation reached 89.3% after 1 h. Meanwhile, homologs of arginyl-tRNA transferase (ATE) and E3 N-recognin, PROTEOLYSIS (PRT) 6 can be found in Marchantia polymorpha, suggesting the conserved way of PCO in catalyzing the oxidation of cysteine to Cys-sulfinic acid at the N-termini of target proteins.
As PCOs regulate ERF-VIIs levels by catalyzing cysteine oxidation in N-degron pathway and ERF-VIIs activate the anaerobic gene expression of Alcohol Dehydrogenase (ADH), Pyruvate Decarboxylase (PDC1) and Hypoxia Responsive Attenuator 1 (HRA1), disrupting the N-degron pathway of ERF-VIIs in barley shows altered seed germination and enhanced yield under waterlogging stress. Thus, it is critical to uncover PCO structures to manipulate their enzyme activities for crop improvement [15]. The structures of AtPCO4_1, AtPCO4_2 (two different structures of AtPCO4 from independent crystallization conditions) and AtPCO5 are resolved to 1.82, 1.24 and 1.91 Å resolutions [12]. There is a core double-stranded beta-helix (DSBH) supporting three histidine residues to coordinate the active site metal ions involved in catalysis. To recognize the active site, the Tyr182-Ser183-Ser184-Glu185-His186-Asp187-Arg188-His189-Cys190 fragment is characterized by targeted mutagenesis [12]. AtPCO4 variant C190A shows the same enzymatic activities as the wild type, but the enzyme activities of variants Y182F, H164D and D176N are reduced to 60%, 0, and 5%, respectively. Furthermore, expression of AtPCO4 H164D and D176N lead to strongly increase the anaerobic gene expression, which indicates the catalytic function of enzyme is invalid when the enzyme activity is lower than 5%. Therefore, the sites (amino acid 160–190 position) of PCO4 play an important role in the enzyme activity [12,16,17], and modification of enzyme activity by site-directed mutagenesis of the enzyme active sites can be used for crop improvement.
Studies show that single, double or triple (pco1/2/4) mutants show similar phenotype with wild type and double mutant pco4/5 increases the resistance to anoxic stress in Arabidopsis [18]. However, quadruple pco1/2/4/5 mutant plants (4pco) show pleated, pale leaves with extensive serration and male and female sterility, along with constitutive expression of low-oxygen response genes [5,7,12]. Mutations of AtPCO4 (H164D) and AtPCO4 (D176N), which destroy the chemically reactive residues, fail to reconstitute the wild-type phenotype in 4pco mutant. On the other hand, overexpression of AtPCO1 or AtPCO2 in Arabidopsis show smaller leaves and decreased biomass [7]. It suggests that an appropriate PCO level or enzyme activity is the fundamental to maintain plant growth and development. The PCOs catalyze the reaction of oxygen with the conserved N-terminal cysteine of ERF-VIIs to form cysteine sulfinic acid, triggering degradation under normal conditions. PCO activity decreases under hypoxia conditions and then the stabilized ERF-VIIs activate the expression of anaerobic genes (ADH, PDC1, HRA1) in response to stress [6,19]. Previous studies have shown that aerobic or hypoxia related genes are down-regulated in either AtPCO1 or AtPCO2 over-expressed plants, whereas anaerobic genes are constitutively up-regulated in quadruple pco1/2/4/5 mutants [13]. Compared with wide type, plants over-expressing AtPCO1 or AtPCO2 show sensitive to prolonged submergence stress [7]. Meanwhile, overexpression of the ERF-VII RAP2.12 in Arabidopsis results in improved tolerance to submergence and up-regulation of genes associated with the hypoxic response [10,15]. Therefore, PCOs, as an O2 sensor, play a critical role in stress response, especially in hypoxia stress.
Approximately 7500 years ago, a natural heterotetraploid Brassica napus (AACC, 2n = 38) was formed by the hybridization of Brassica rapa (2n = 20, AA) and Brassica oleracea (2n = 18, CC) [20,21,22]. Rapeseed (Brassica napus) is an important oil crop, with the largest planting area as well as total oil production in China. Rapeseed is mainly distributed in the Yangtze River basin in China and waterlogging, caused by the rainy and humid climate in this region, is a common abiotic stress affecting rapeseed production. The oxygen availability in waterlogging soil is greatly limited and the yield of rapeseed could decrease by 17–42% due to waterlogging stress in China [23]. Research on genetics, evolution and stress response of rapeseed is a good way to improve the quality and yield of rapeseed [24,25,26,27,28]. While AtPCOs are expected to play important roles in stress responses, detailed genome-wide analysis of the PCO gene family in Brassicaceae has not been performed. In this study, we investigated the significant role of PCO genes in Brassicaceae to provide evidence for resistance improvement of rapeseed. As a result, we identified 35 PCO genes of Brassica napus, Brassica rapa and Brassica oleracea, respectively, and characterized the gene structures, chromosomal locations, evolutionary relationships and expression patterns in different tissues and under different abiotic stress treatments with public data analysis. Moreover, we confirmed the BnaPCO gene expression patterns in different tissues and under waterlogging stress by qRT-PCR analysis. Therefore, this study provides a comprehensive understanding of PCOs in development and abiotic stress responses in Brassica napus.

2. Results

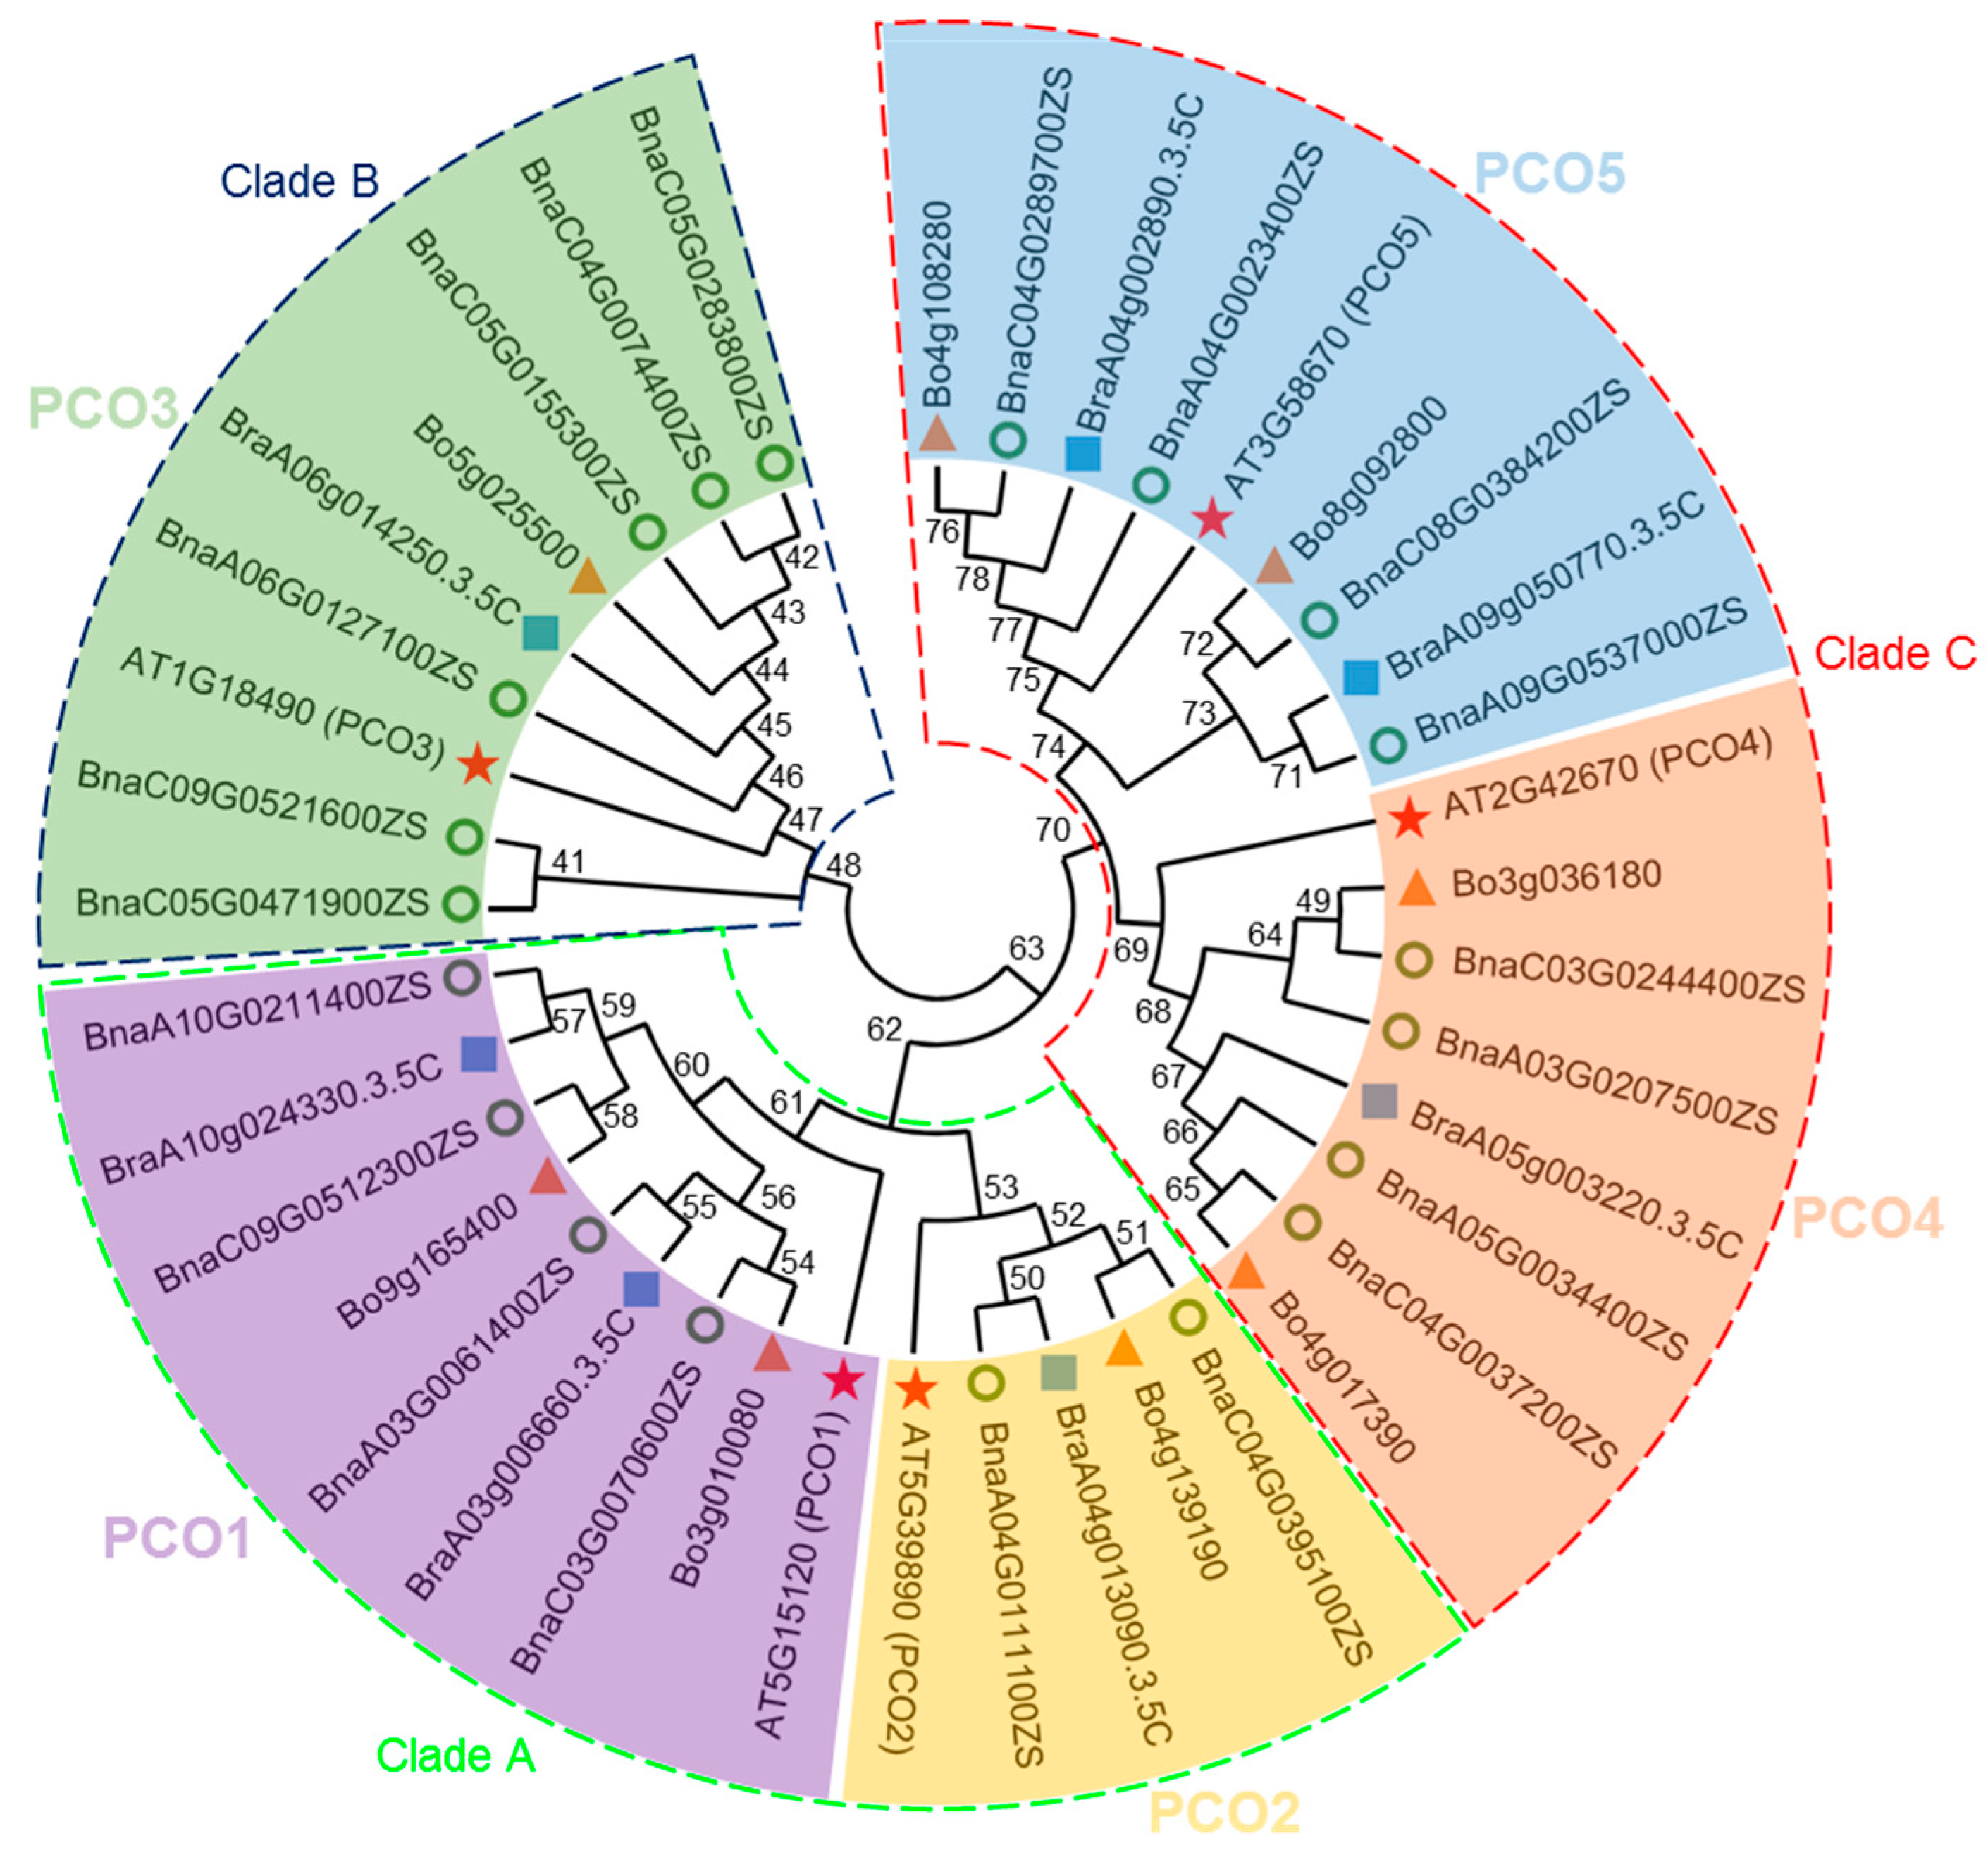
2.1. Identification and Classification of PCO Genes in B. napus, B. oleracea and B. rapa

To identify PCO proteins in B. napus, B. oleracea and B. rapa, we performed a BLASTp search against the annotated proteins of B. napus (Zhongshuang 11 variety), B. oleracea and B. rapa in BRAD (http://www.brassicadb.cn/#/BLAST/, accessed on 10 January 2023) and BnIR (https://yanglab.hzau.edu.cn/BnIR, accessed on 15 June 2022) using Arabidopsis AtPCO protein (AtPCO1, AtPCO2, AtPCO3, AtPCO4 and AtPCO5) sequences as queries. Sets of 20 (4 BnaPCO1, 2 BnaPCO2, 6 BnaPCO3, 4 BnaPCO4 and 4 BnaPCO5), 8 (2 BoPCO1, 1 BoPCO2, 1 BoPCO3, 2 BoPCO4 and 2 BoPCO5) and 7 (2 BraPCO1, 1 BraPCO2, 1 BraPCO3, 1 BraPCO4 and 2 BraPCO5) PCO proteins were identified in B. napus, B. oleracea and B. rapa, respectively (Table 1). All 35 PCOs in B. napus, B. oleracea and B. rapa encoded the amino acids ranging in length from 82 to 308 with the molecular weight from 8650 to 34,180 Dalton. The isoelectric point (pI) of these amino acids ranged from 4.39 to 8.78 (Table 1).
To explore the classification and evolutionary characteristics of the PCO proteins, an unrooted phylogenetic tree based on the 40 PCO protein sequences of B. napus (20), B. oleracea (8) and B. rapa (7) and Arabidopsis (5) was constructed in MEGA 11 (Figure 1). According to the phylogenetic analysis of PCO proteins, there are five groups: PCO1 (homologous to AT5G15120.1/AtPCO1), PCO2 (homologous to AT5G39890.1/AtPCO2), PCO3 (homologous to AT1G18490.1/AtPCO3), PCO4 (homologous to AT2G42670.1/AtPCO4) and PCO5 (homologous to AT3G58670.1/AtPCO5). In addition, according to the phylogenetic tree, PCO proteins can be clearly divided into three clades: PCO1s and PCO2s belong to clade A, PCO3s belong to clade B, and PCO4 and PCO5 belong to clade C, respectively.

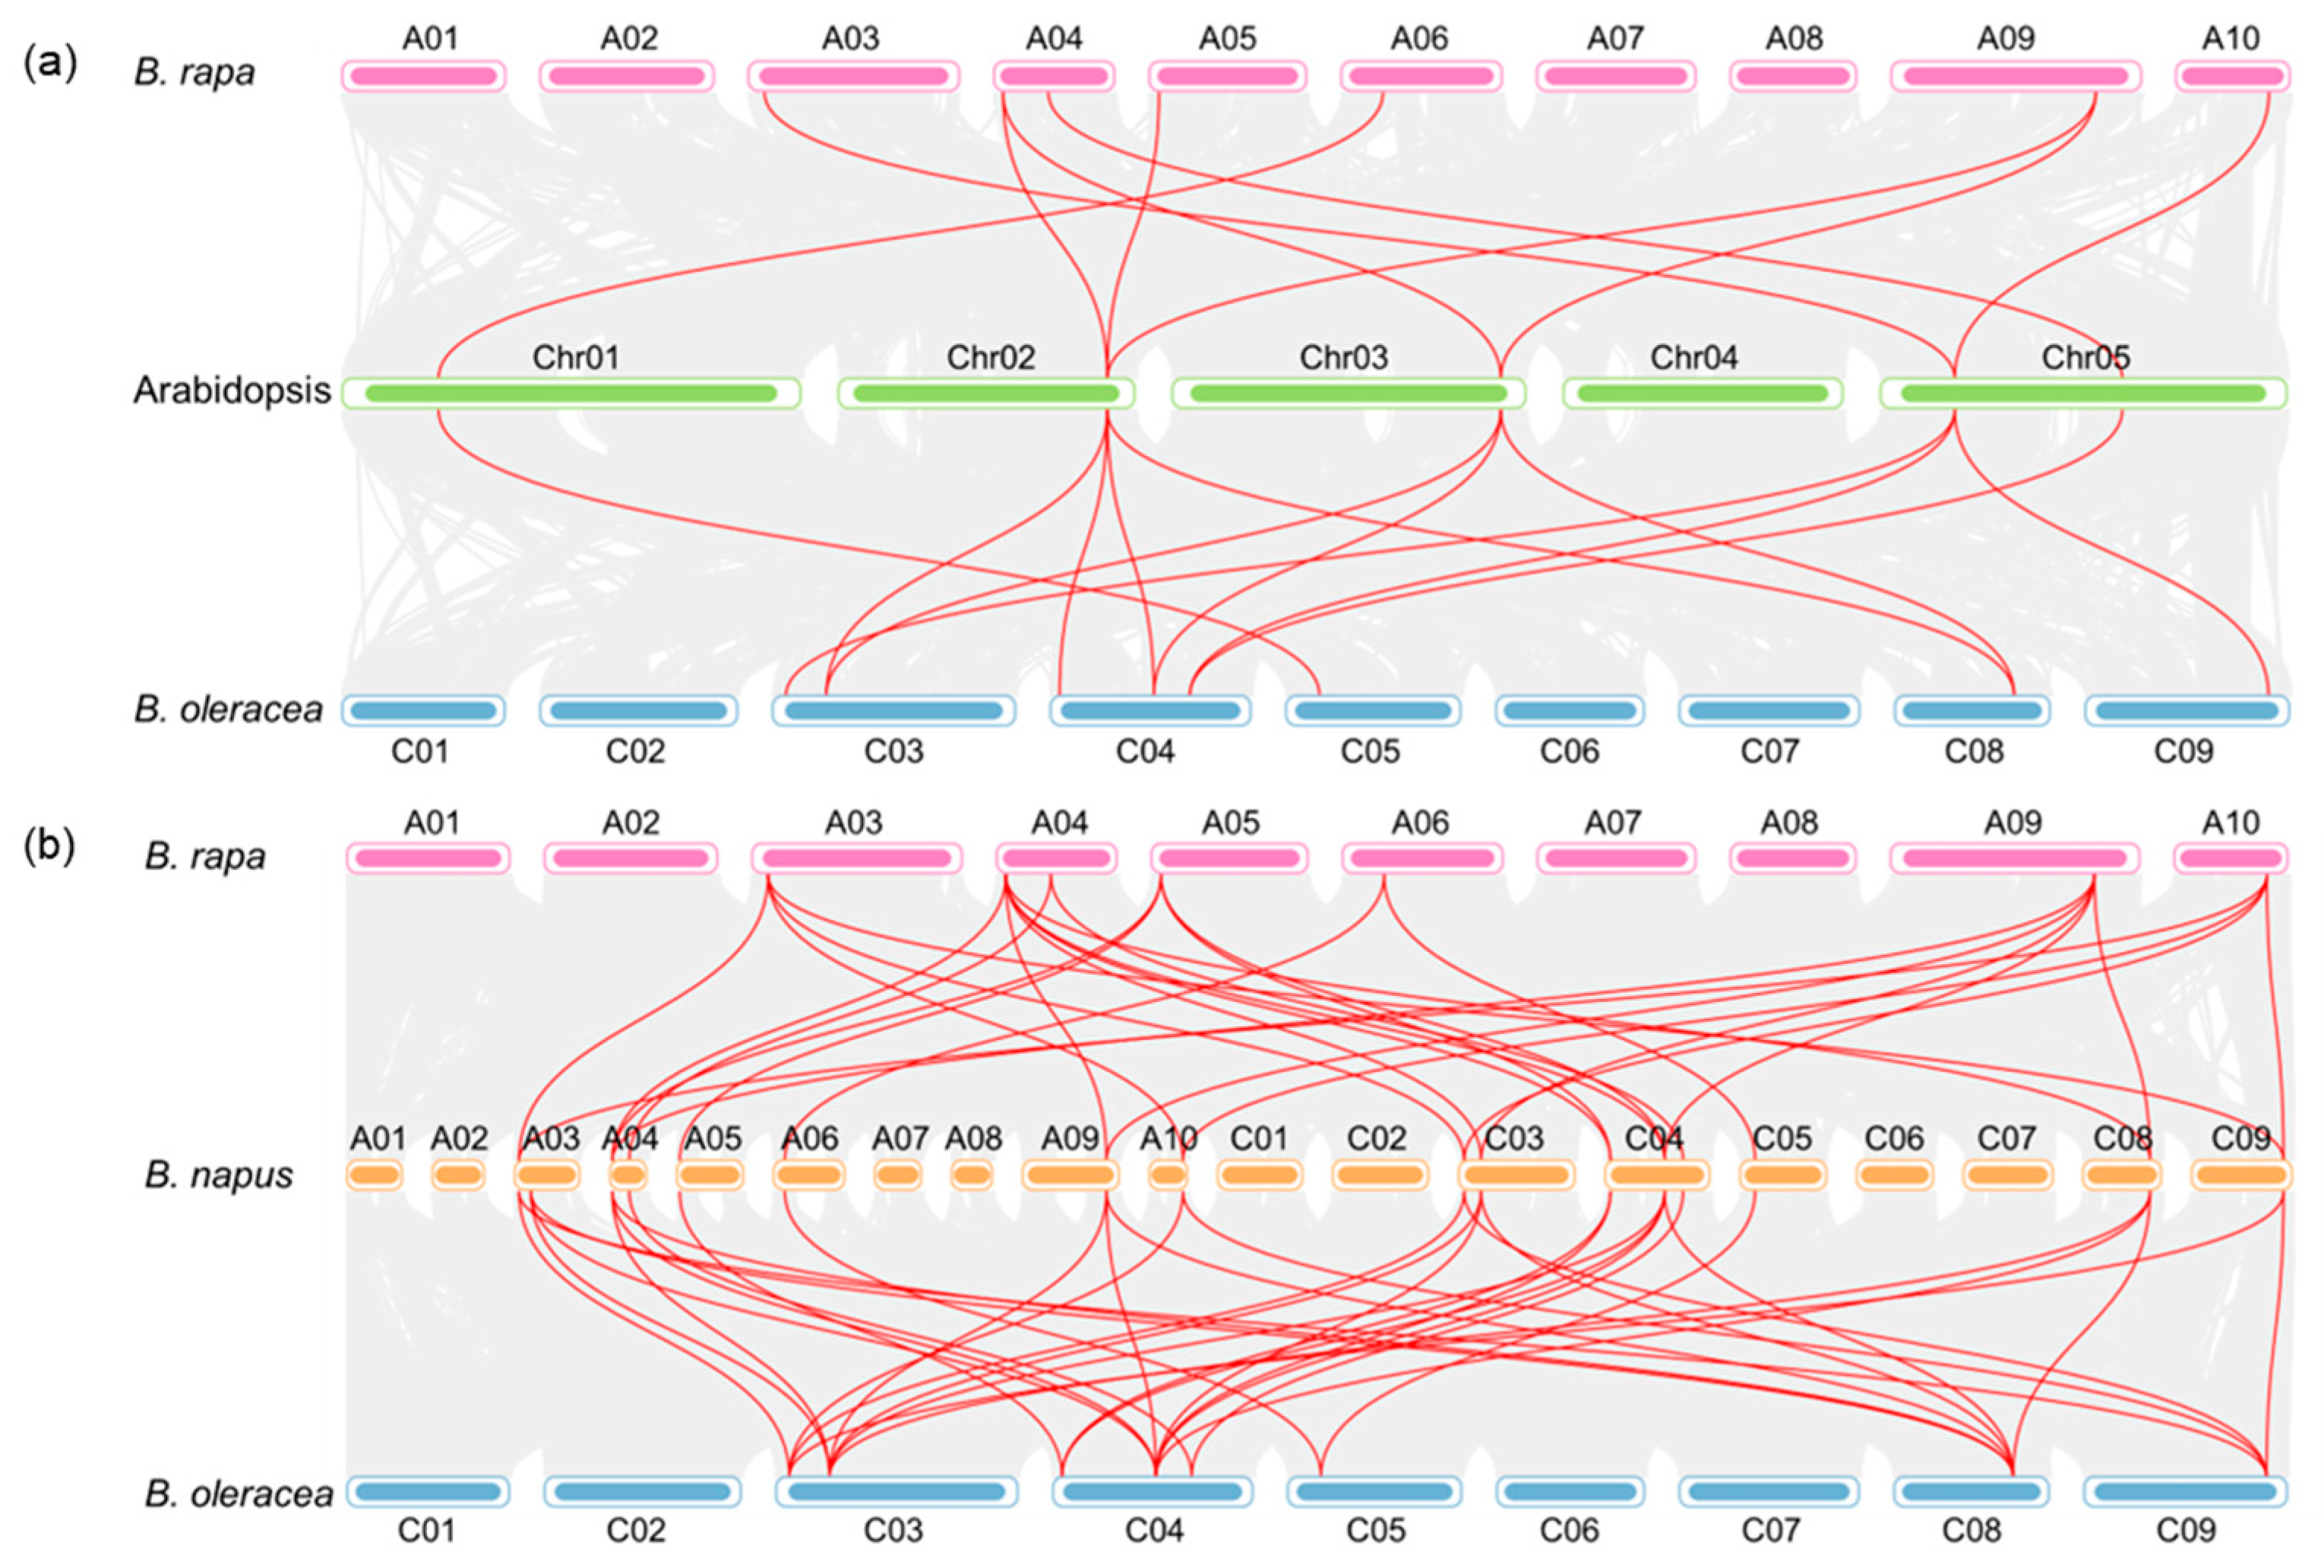
2.2. Chromosomal Distribution and Duplication of BnaPCOs

It was uncovered that B. napus (AnAnCnCn, 2n = 38) originated from the hybridization event between B. rapa (AnAn, n = 10) and B. oleracea (CnCn, n = 9) approximately 7500 years ago [20,21,22], and Brassicaceae species underwent a whole-genome triplication event [20]. As shown in Figure 2a, three genes in B. rapa were oriented from At2G42670, which was consistent with the duplication theory. According to the evolution theory, there are 15, 15 and 30 PCOs in B. rapa, B. oleracea and B. napus expanded from the 5 AtPCOs. However, only 7, 8 and 20 genes were identified in B. rapa, B. oleracea and B.napus, respectively (Table S1). As shown in Figure 2, 7 BraPCOs were scattered on 6 of the 10 B. rapa chromosomes, 8 BoPCOs were scattered on 5 of the 9 B. oleracea chromosomes, 20 BnaPCOs were scattered on 11 of the 19 B. napus chromosomes. The numbers of BnaPCOs on the An-subgenome (8 genes) and the Cn-subgenome (12 genes) showed a biased trend, with more genes on the Cn-subgenome. It was indicated that some PCOs may have been lost during evolution.
Previous study reported that the An and Cn subgenomes of B. napus were collinear with the diploid B. rapa (Ar) and B. oleracea (Co) genomes, and most of the An-Ar and Cn-Co homologous pairs showed similar chromosomal locations [20]. However, the C genome of B. napus had more homologous genes corresponding to the BoPCO3 gene (Bo5G025500), and the A genome had more homologous genes corresponding to the BraPCO4 gene (BraA05G003220), while the homologous genes of PCO1, PCO2 and PCO5 groups were relatively conserved (Table 1). It was inferred that the PCO sequences were mutated or duplicated in the homologous evolution process.

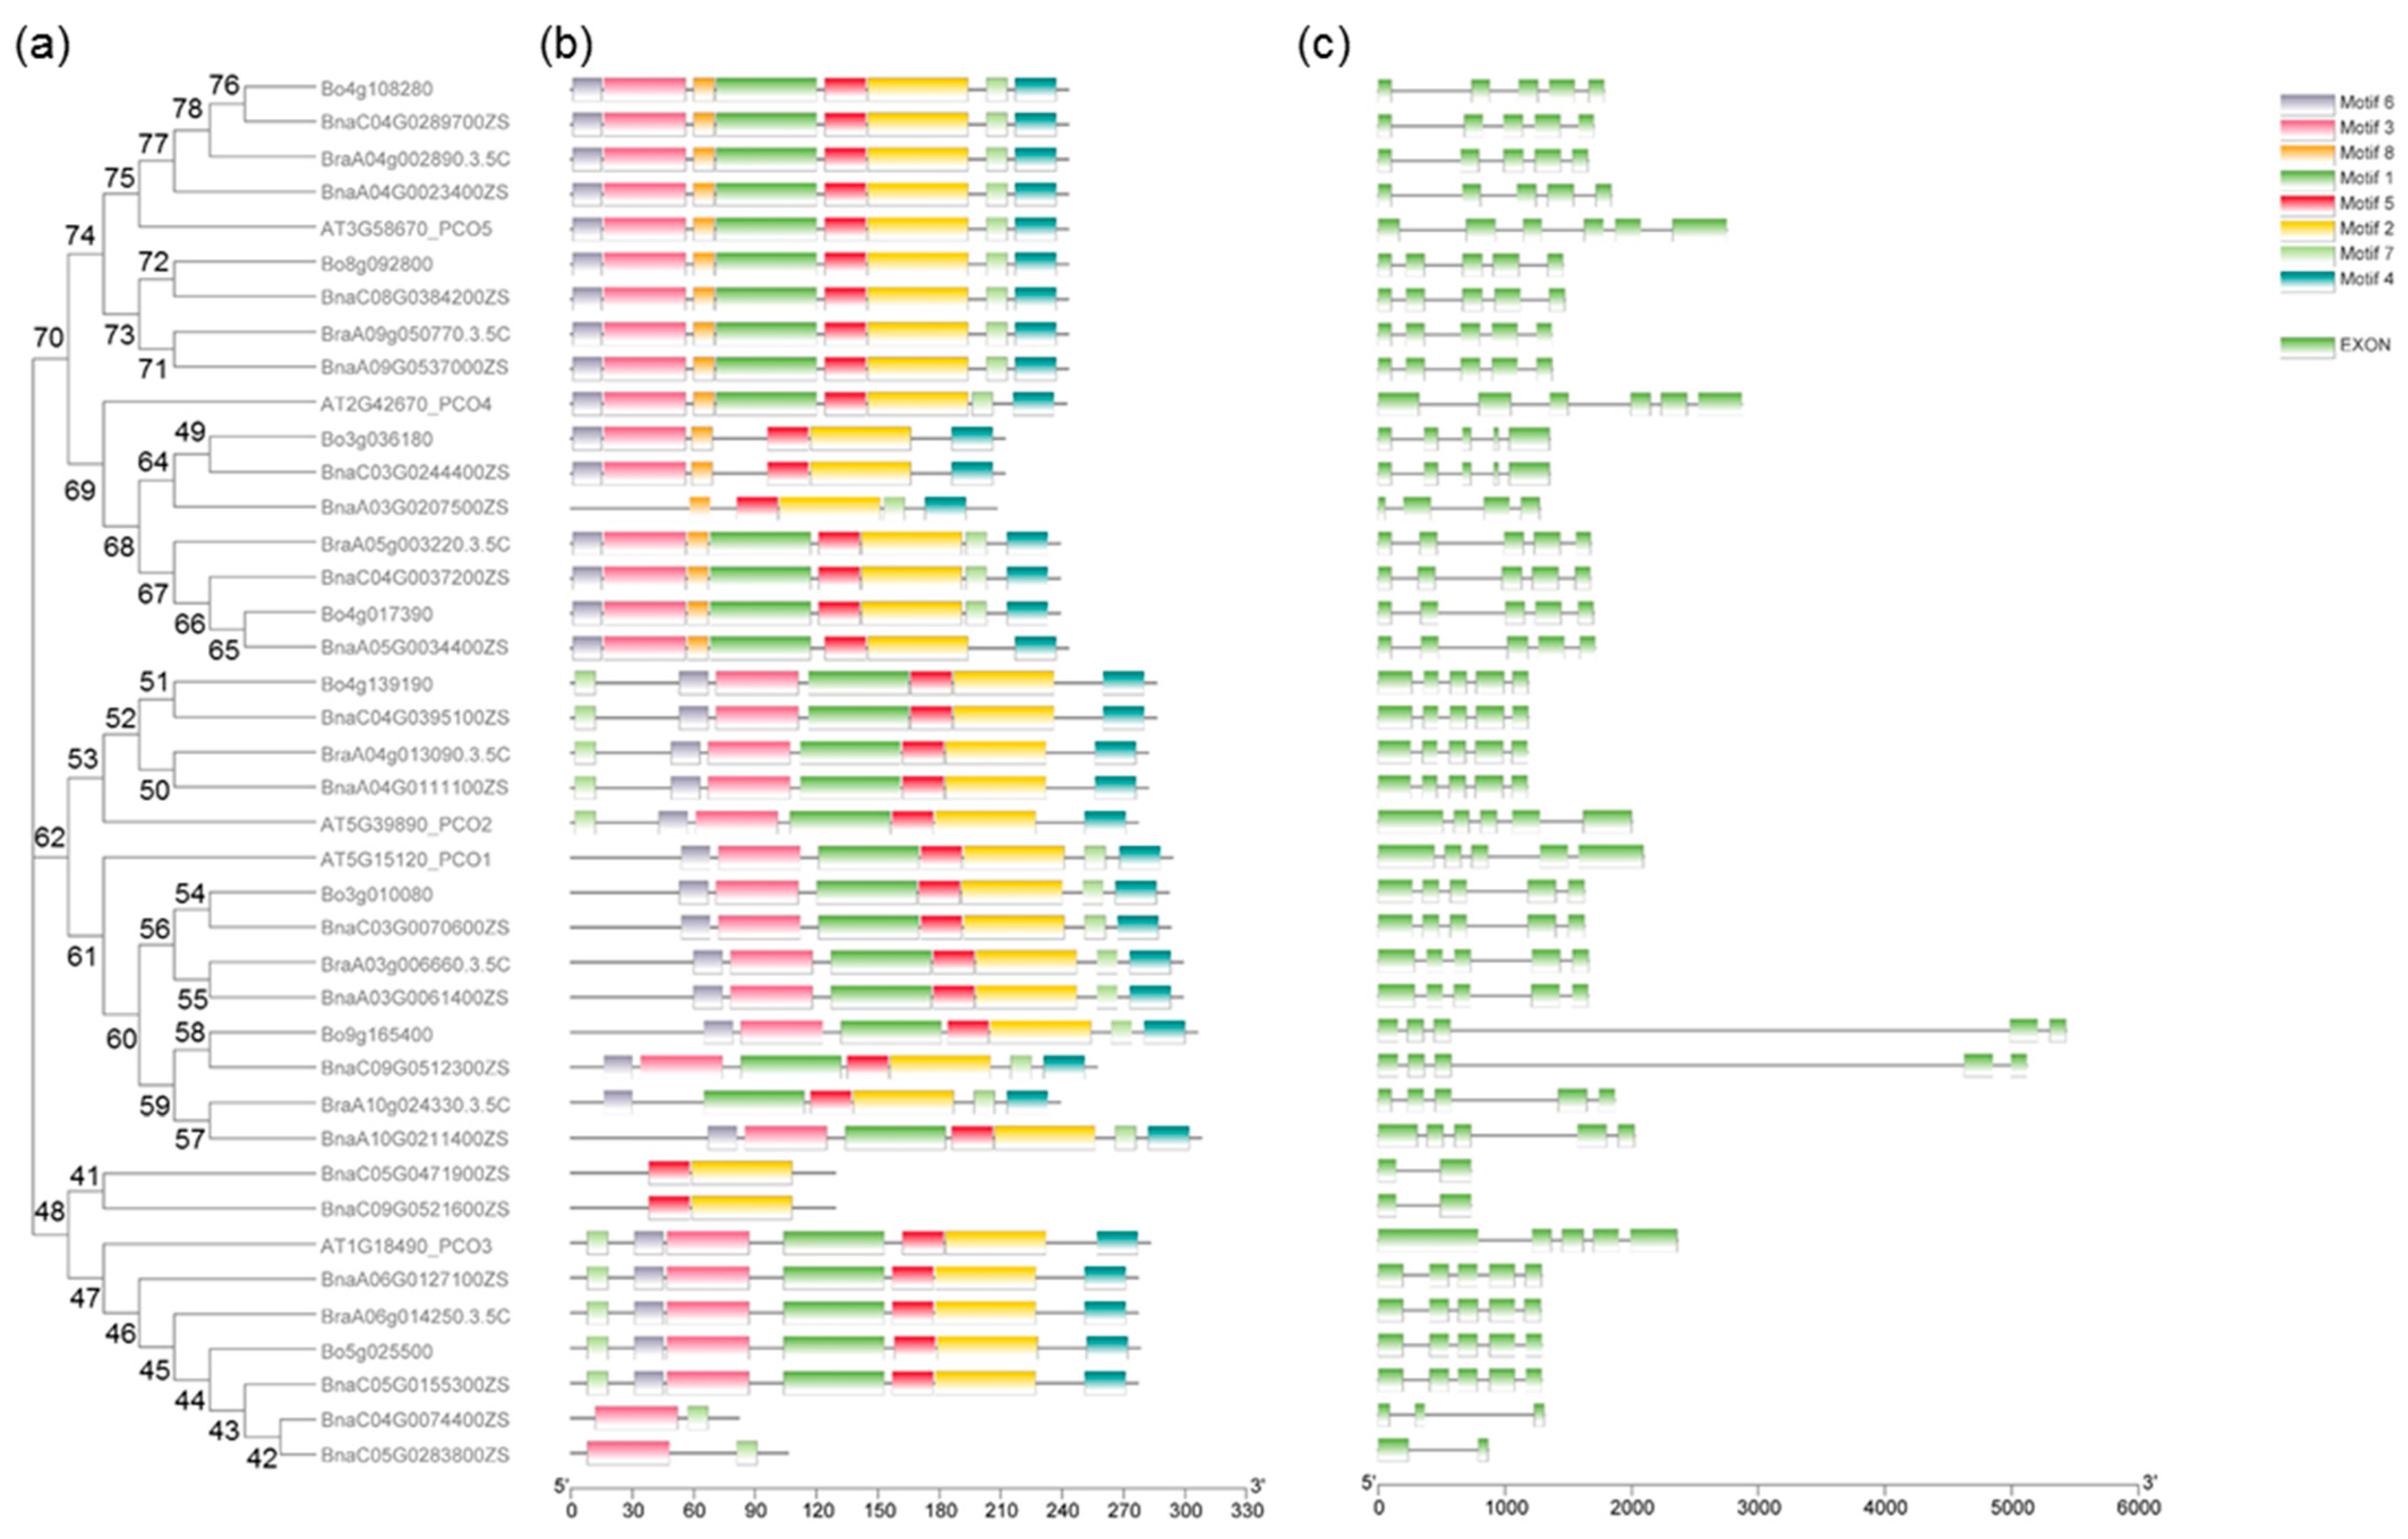
2.3. Gene Structures and Motif Analysis of PCOs in B. napus

In order to study the homology domain and conservation degree of the BnaPCOs, MEME [29] and TBtools [30] were used to predict and visualize their conserved domain and gene organization, respectively. 8 motifs were predicted by MEME (https://meme-suite.org/meme/tools/meme, accessed on 10 April 2023) (Figure S1). As shown in Figure 3, Motif 2 and 5 were the most conserved, with 38 of the 40 genes containing these two motifs. All of the PCO4 and PCO5 proteins contained Motif 8, whereas none of the other genes contained Motif 8. All PCO5 proteins contained eight motifs, of which the Motif 7 was located at the C terminal. However, all PCO2 proteins contained seven motifs in addition to the Motif 8, with the Motif 7 located at the N terminal. Two of the four short abnormal proteins, BnaC05G0471900ZS and BnaC09G0521600ZS, lacked Motif 1-3-4-6-7-8, while BnaC04G0074400ZS and BnaC05G0283800ZS lacked Motif 1-2-4-5-6-8. Further protein analysis exhibited that BnaC05G0471900ZS and BnaC09G0521600ZS aligned C-terminal of BnaPCO3 protein and BnaC04G0074400ZS and BnaC05G0283800ZS aligned N-terminal of BnaPCO3 protein (Figure S8).
It is reported that some introns play an essential role in transcriptional regulation [31]. We also investigated the distribution of introns and exons to study the diversity of gene structure. Five exons and four introns were distributed on most of PCO genes. Additionally, the intron phases of BnaPCOs were highly conserved in the same group, implicating the evolutionary similarity between these members.

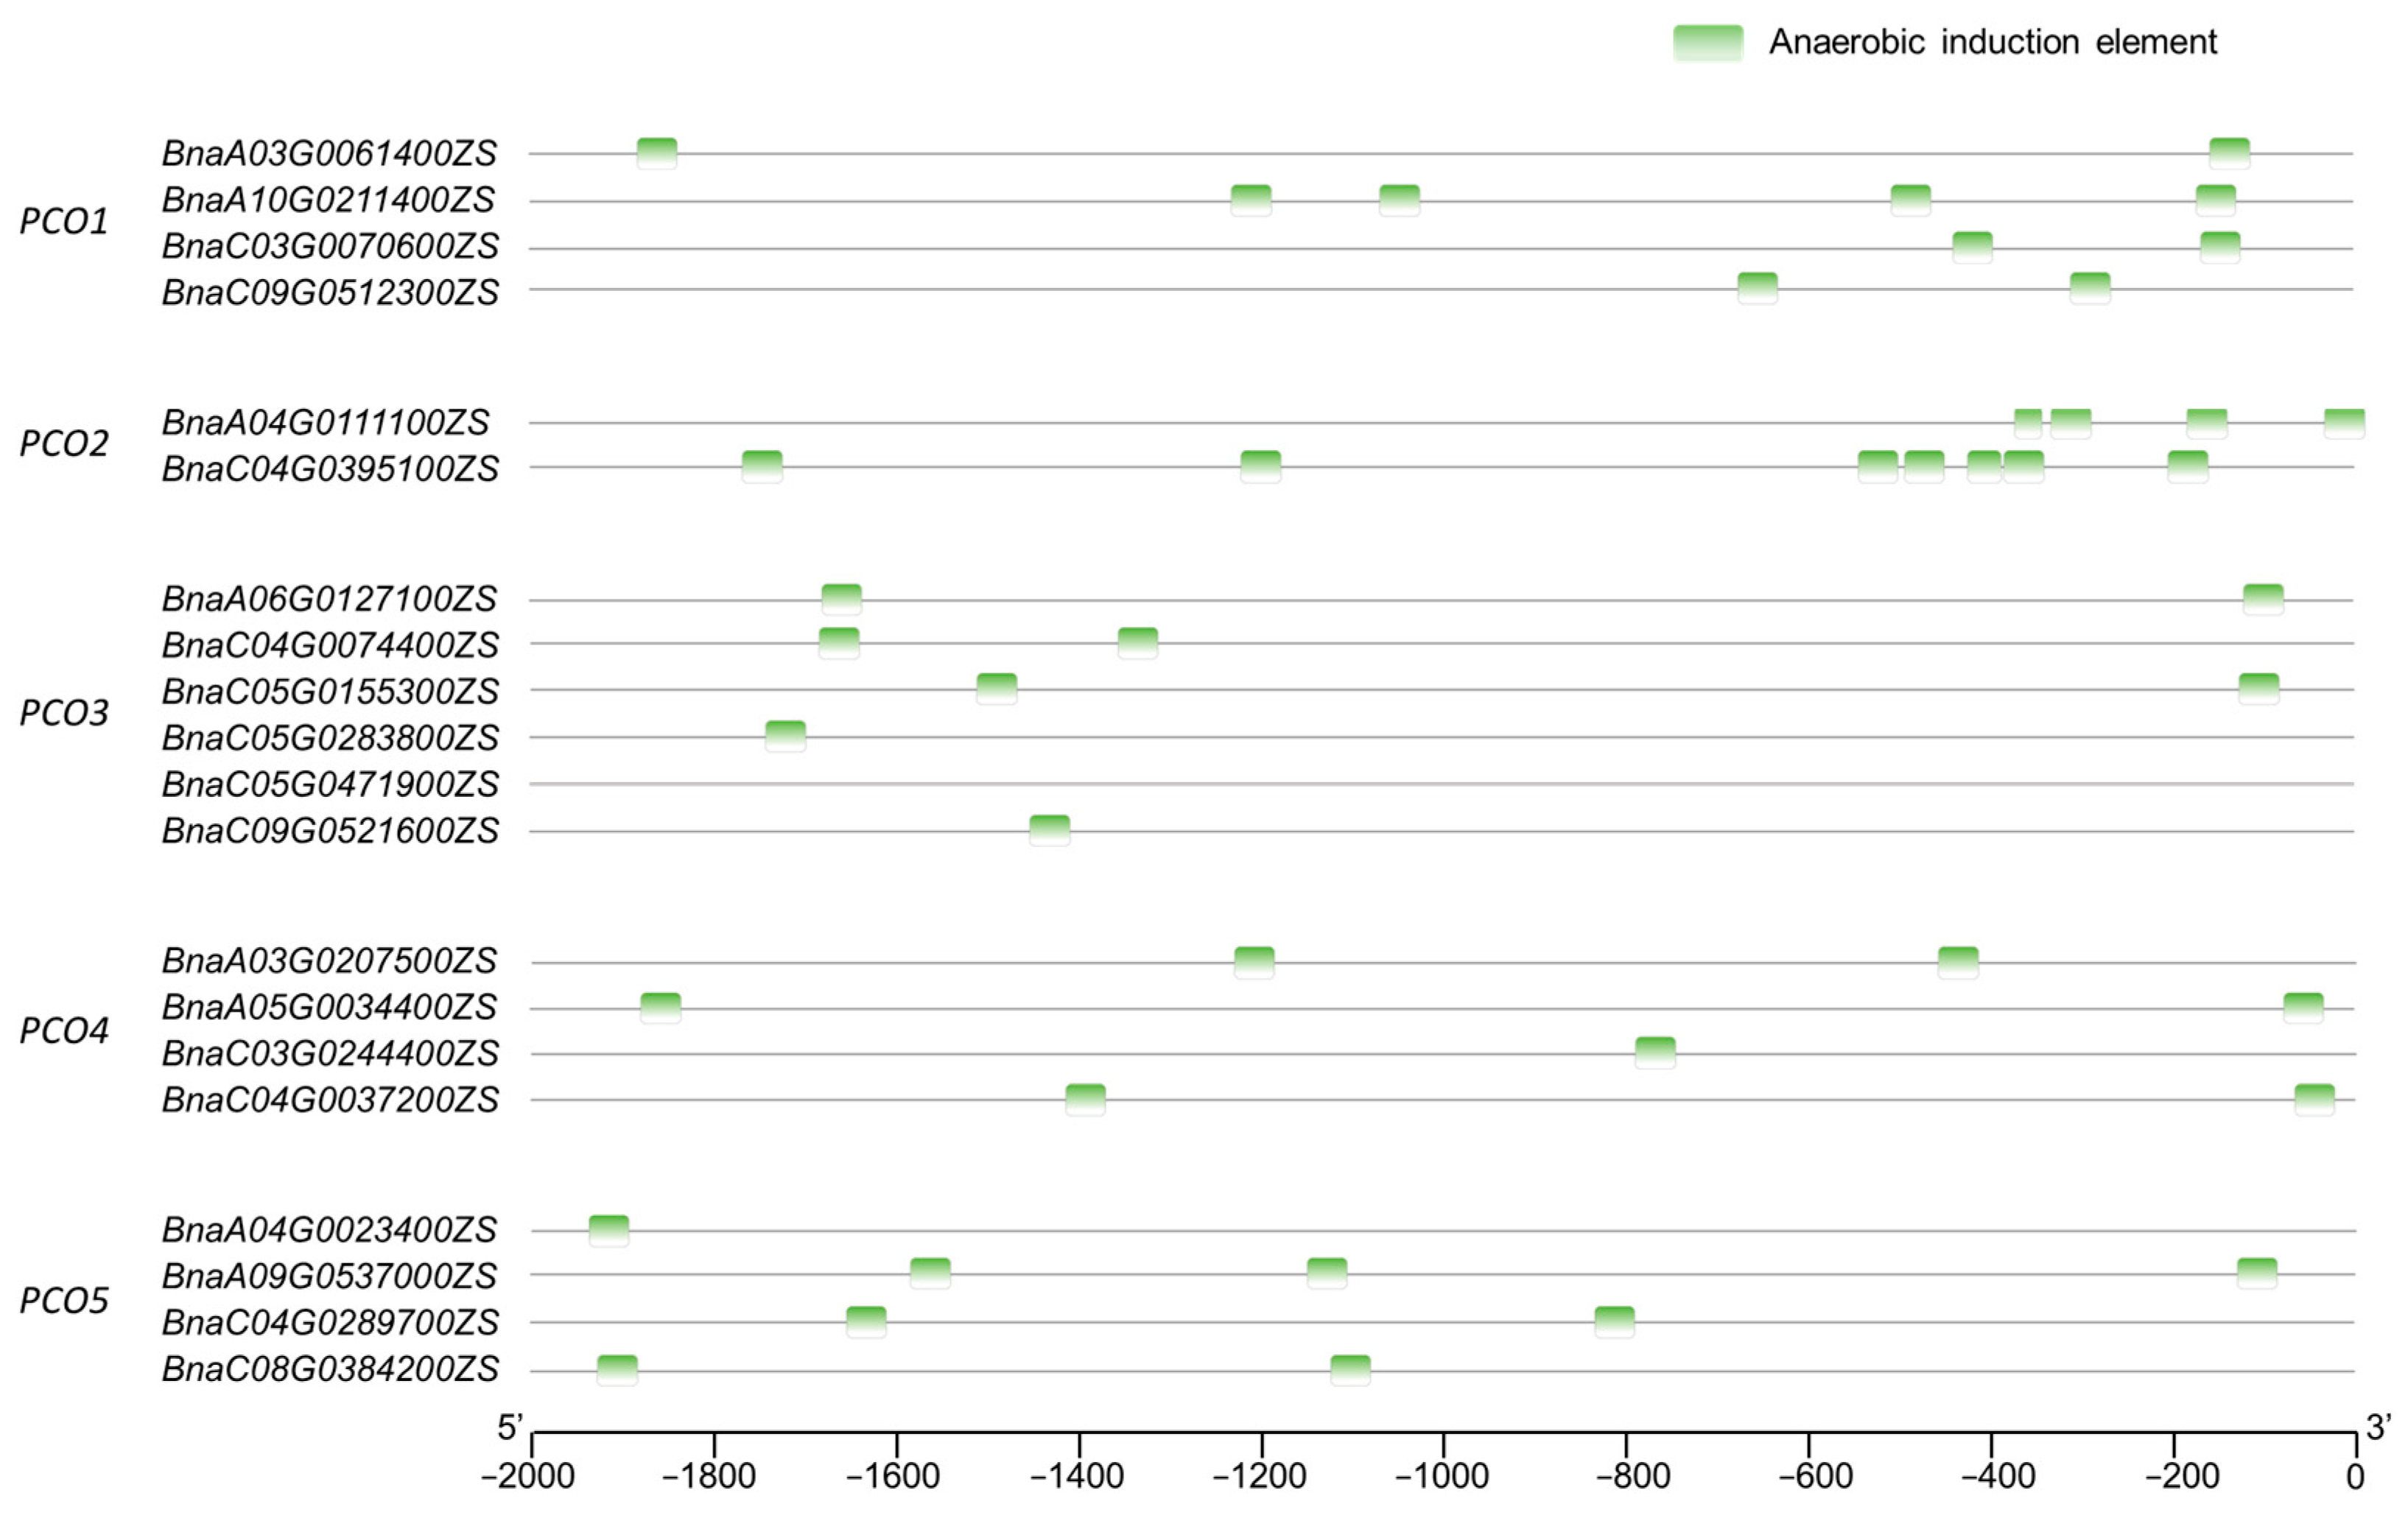
2.4. Cis-Element Analysis of BnaPCOs

Cis-elements regulate the initiation and efficiency of gene transcription by binding to transcription factors [32]. We analyzed the cis-elements of 20 PCOs promoters with PlantCARE [33]. Cis-elements of plant growth and development, hormone response and abiotic stress response were identified in BnaPCOs promoter region (Table S2). The identified environmental stress-related elements included anaerobic induction, circadian control, defense and stress responsive, drought induction, light response, low temperature response, meristem expression, and wound response. Among them, the most common elements were associated with light response and anaerobic induction, indicating that the growth and development of plants regulated by BnaPCOs was affected by light and oxygen. PCOs was known as a sensor of oxygen, which was consistent with the cis-elements result. However, the light response of PCOs needed further study.
In addition, there were more anaerobic-induction elements on PCO2s promoter region compared with other genes and there was no anaerobic-induction elements on the promoter of BnaC05G0471900ZS (belongs to BnaPCO3) (Figure 4). The cis-elements in the upstream promoter region of genes are closely related to the expression and function of downstream genes [34]. Therefore, according to the anaerobic-induction elements result, it indicated that the expression of PCO2s may be highly induced by hypoxia and it also implies the diversification of biological functions of PCO genes in B. napus.

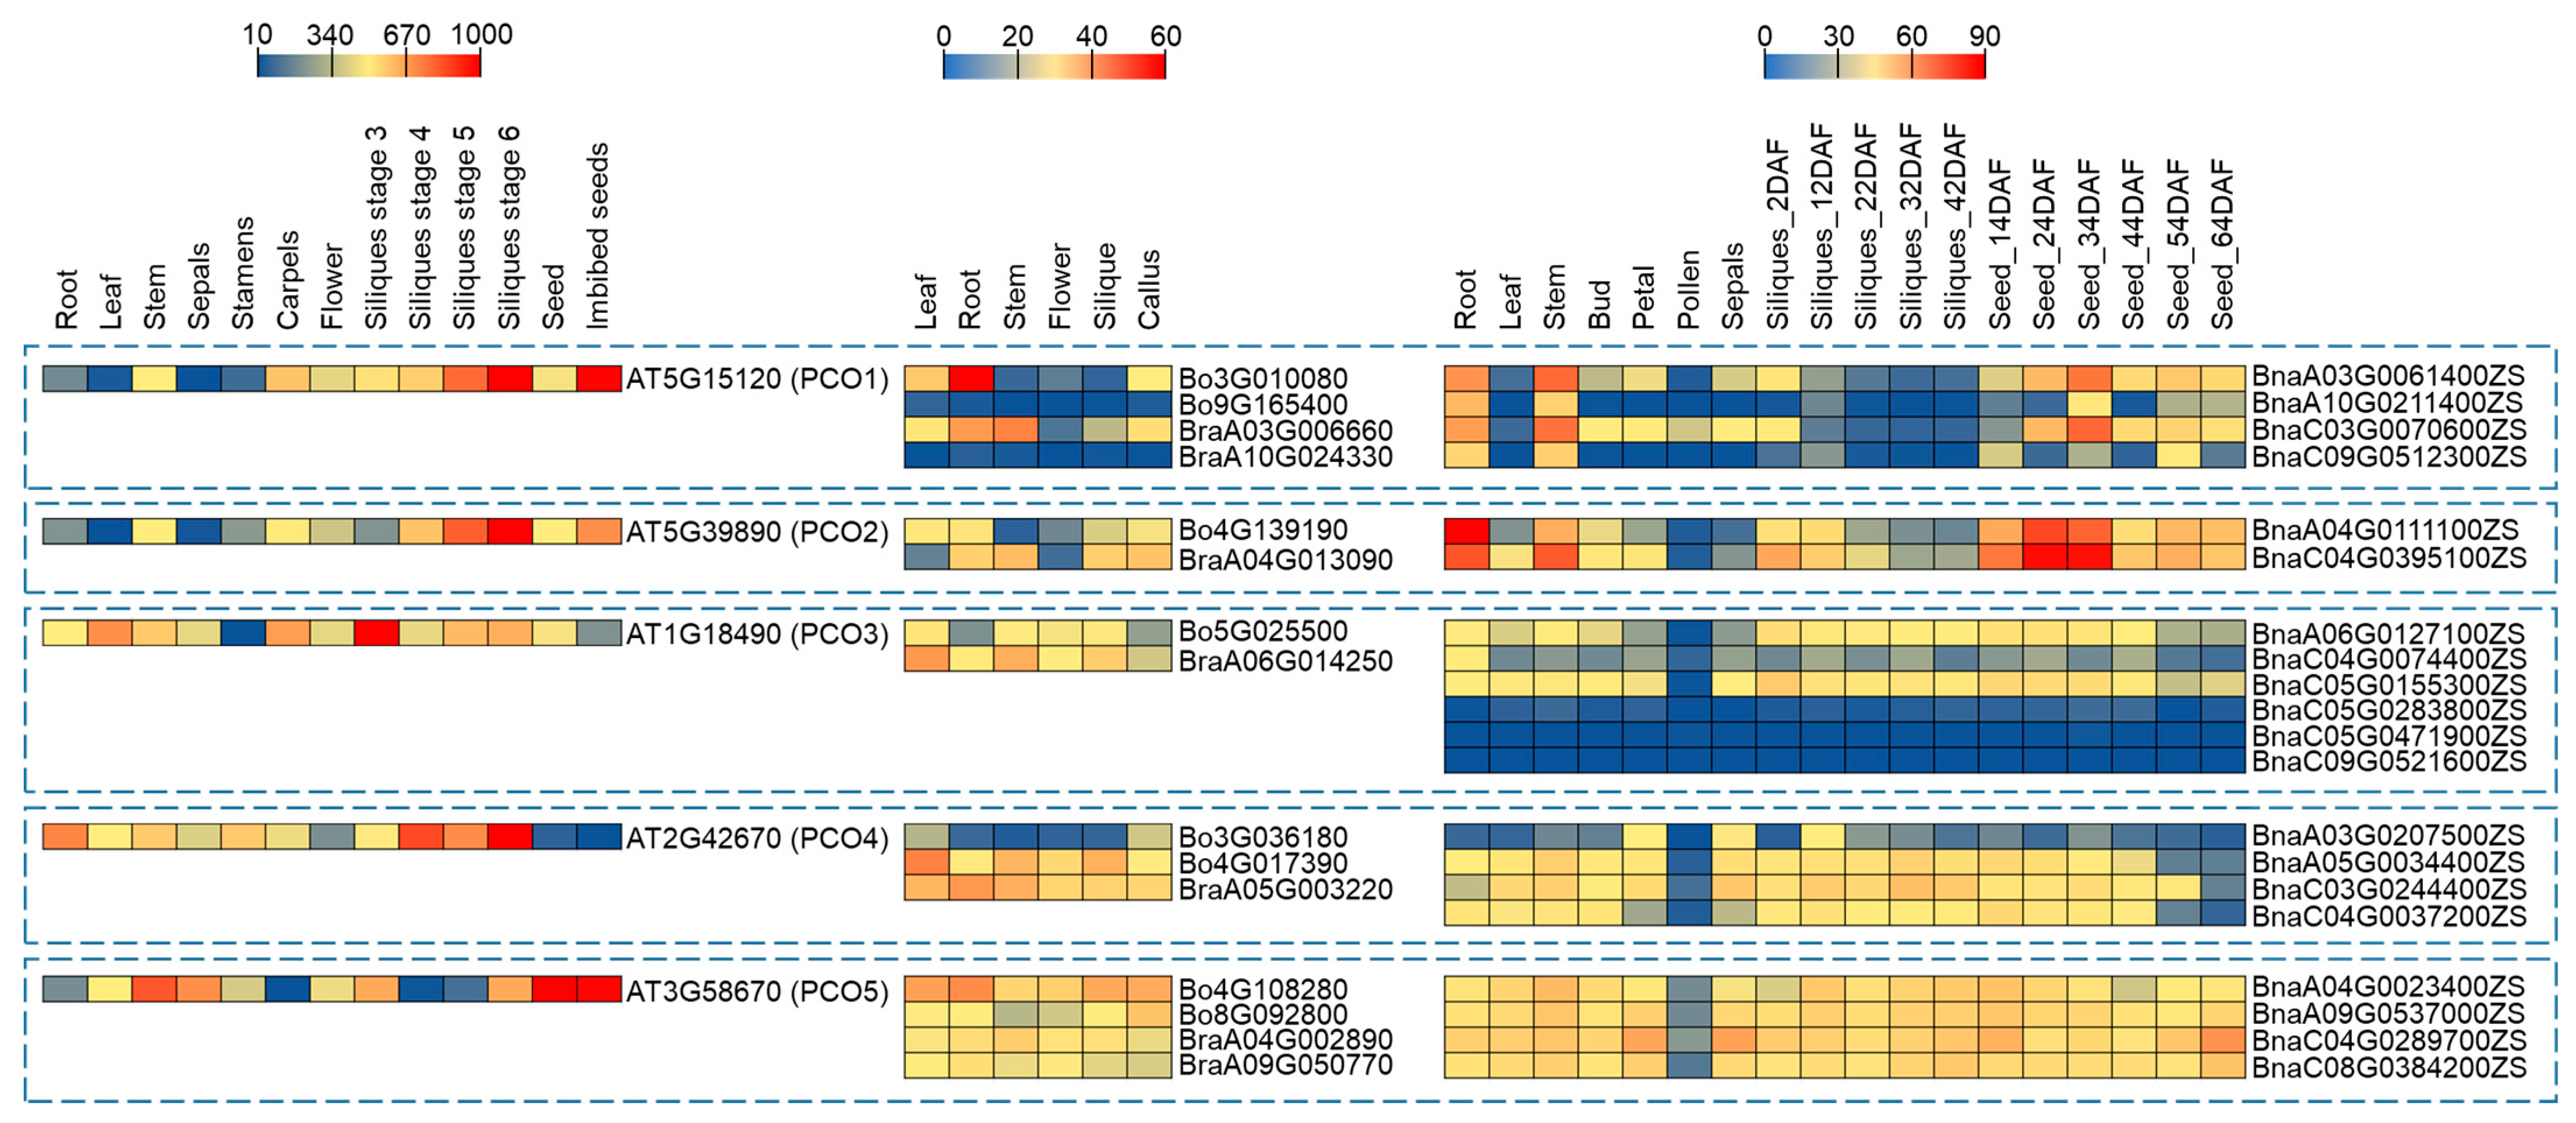
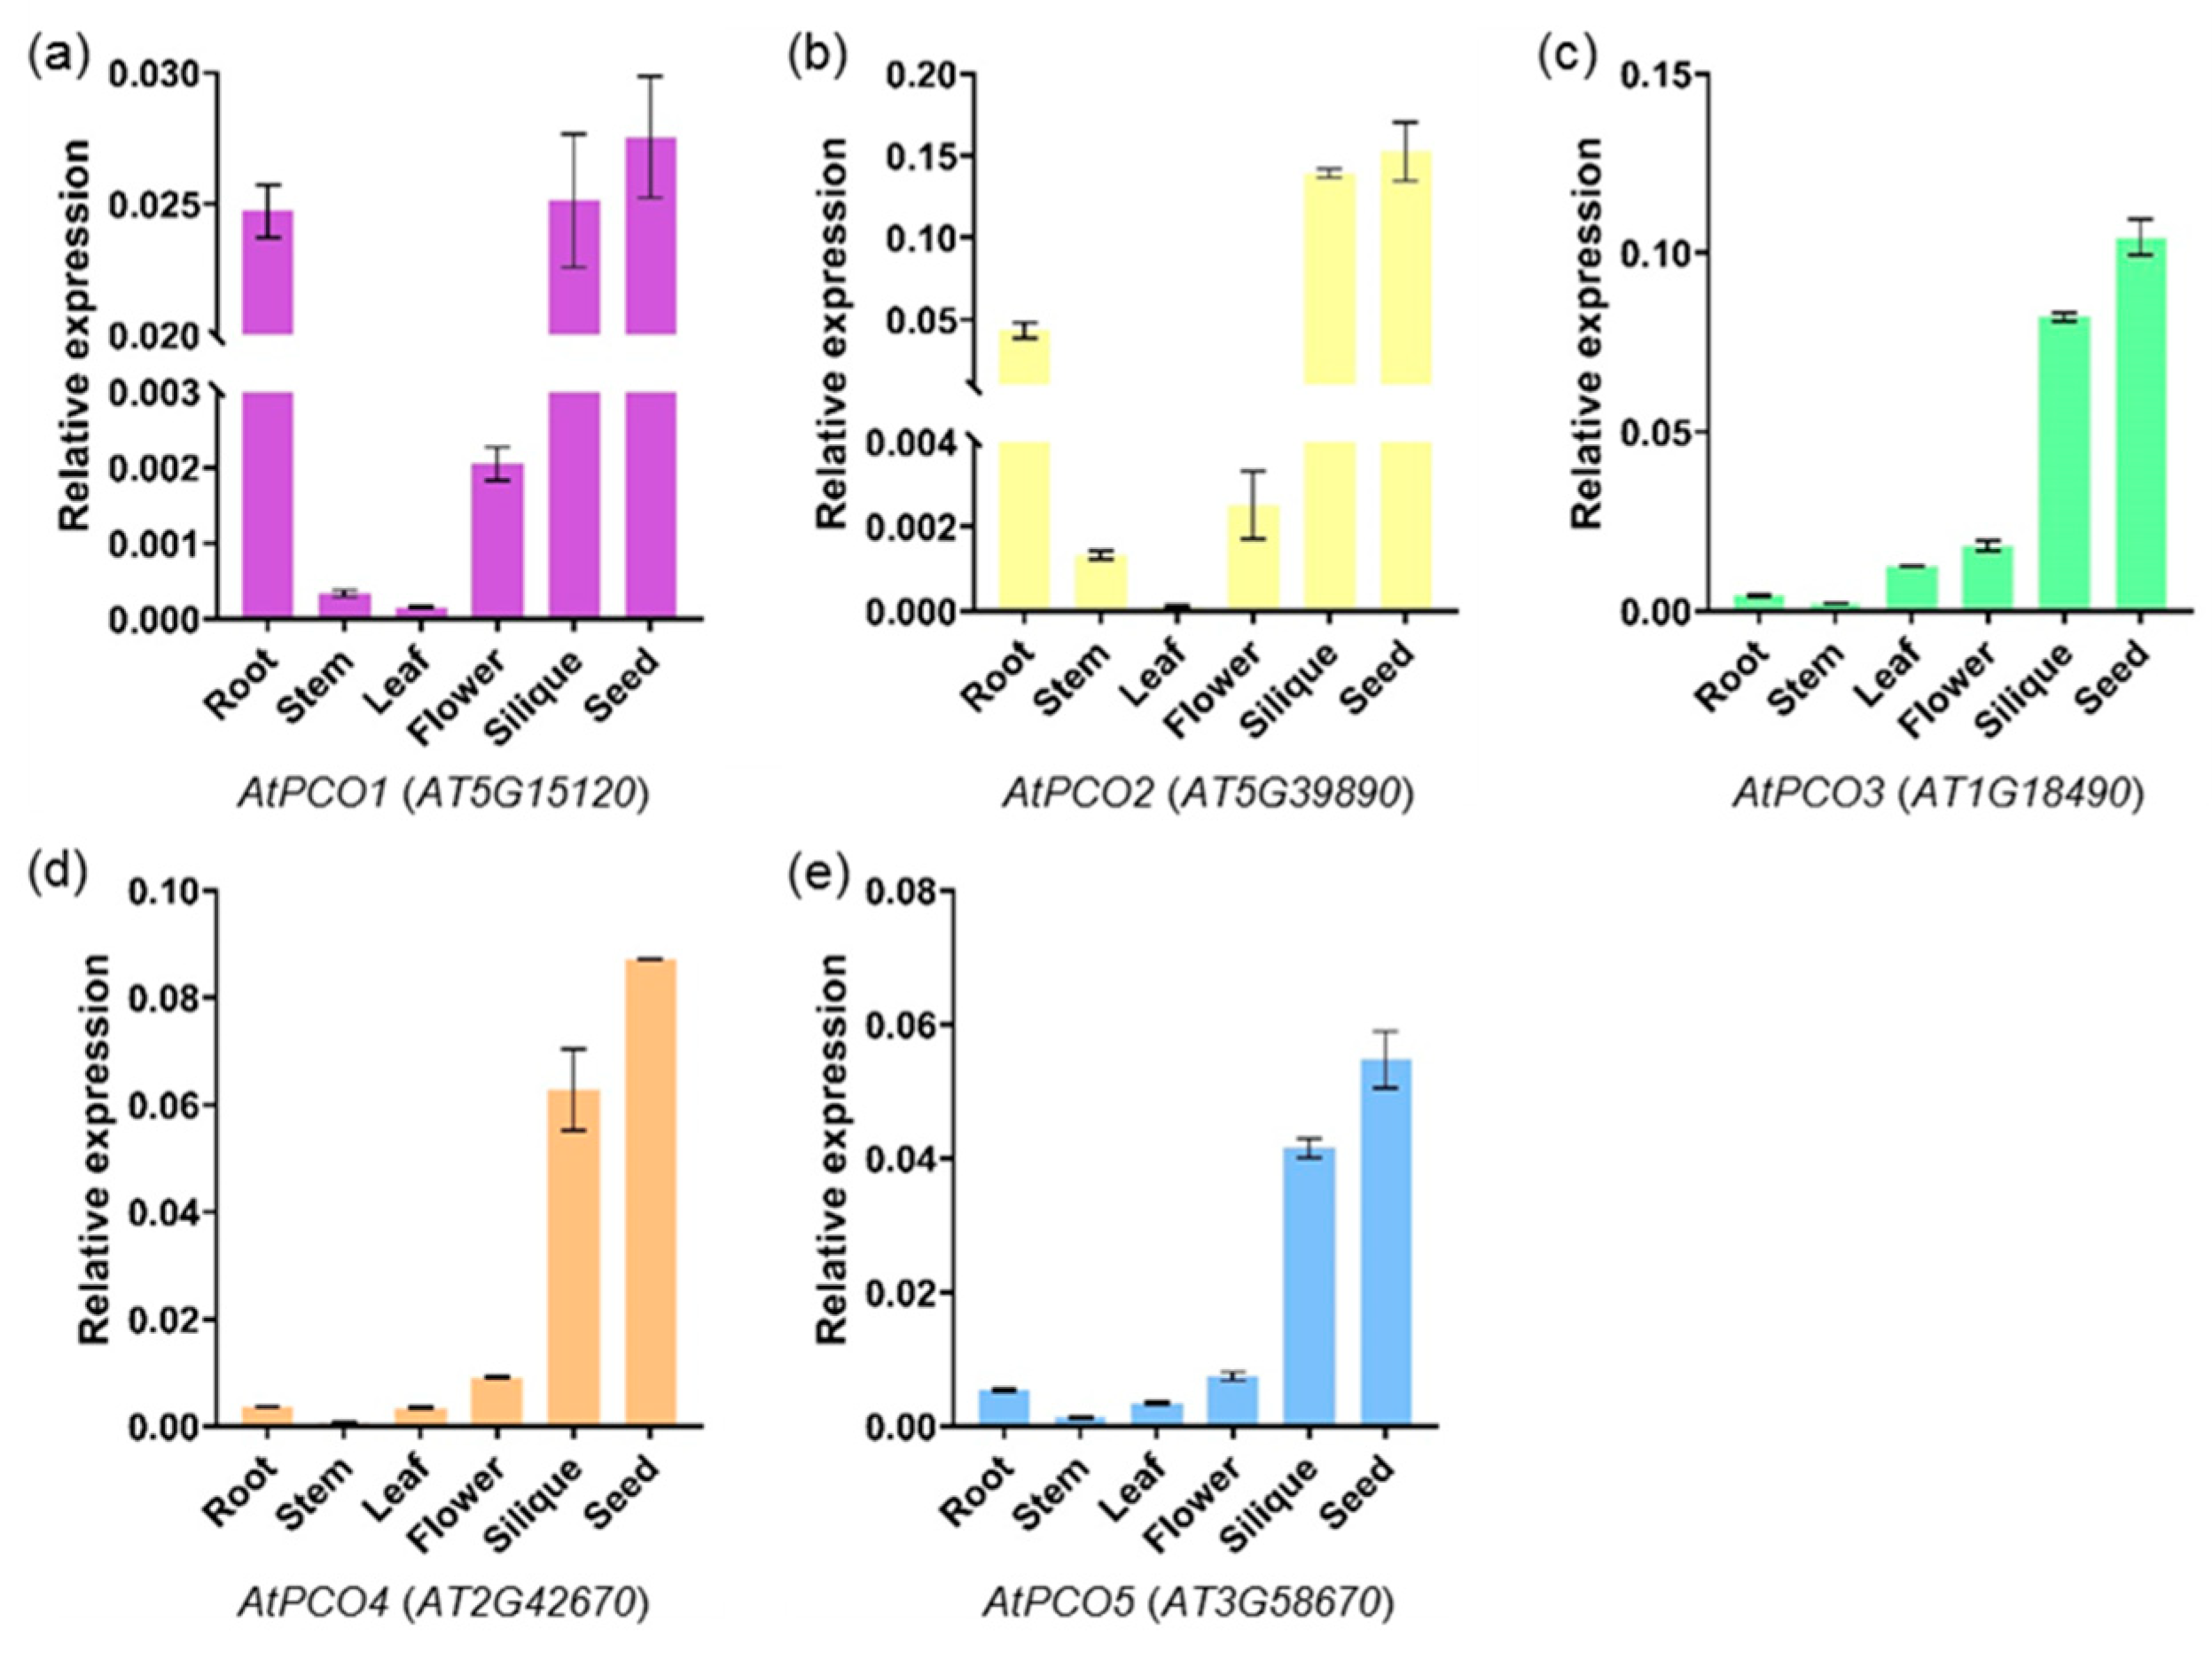
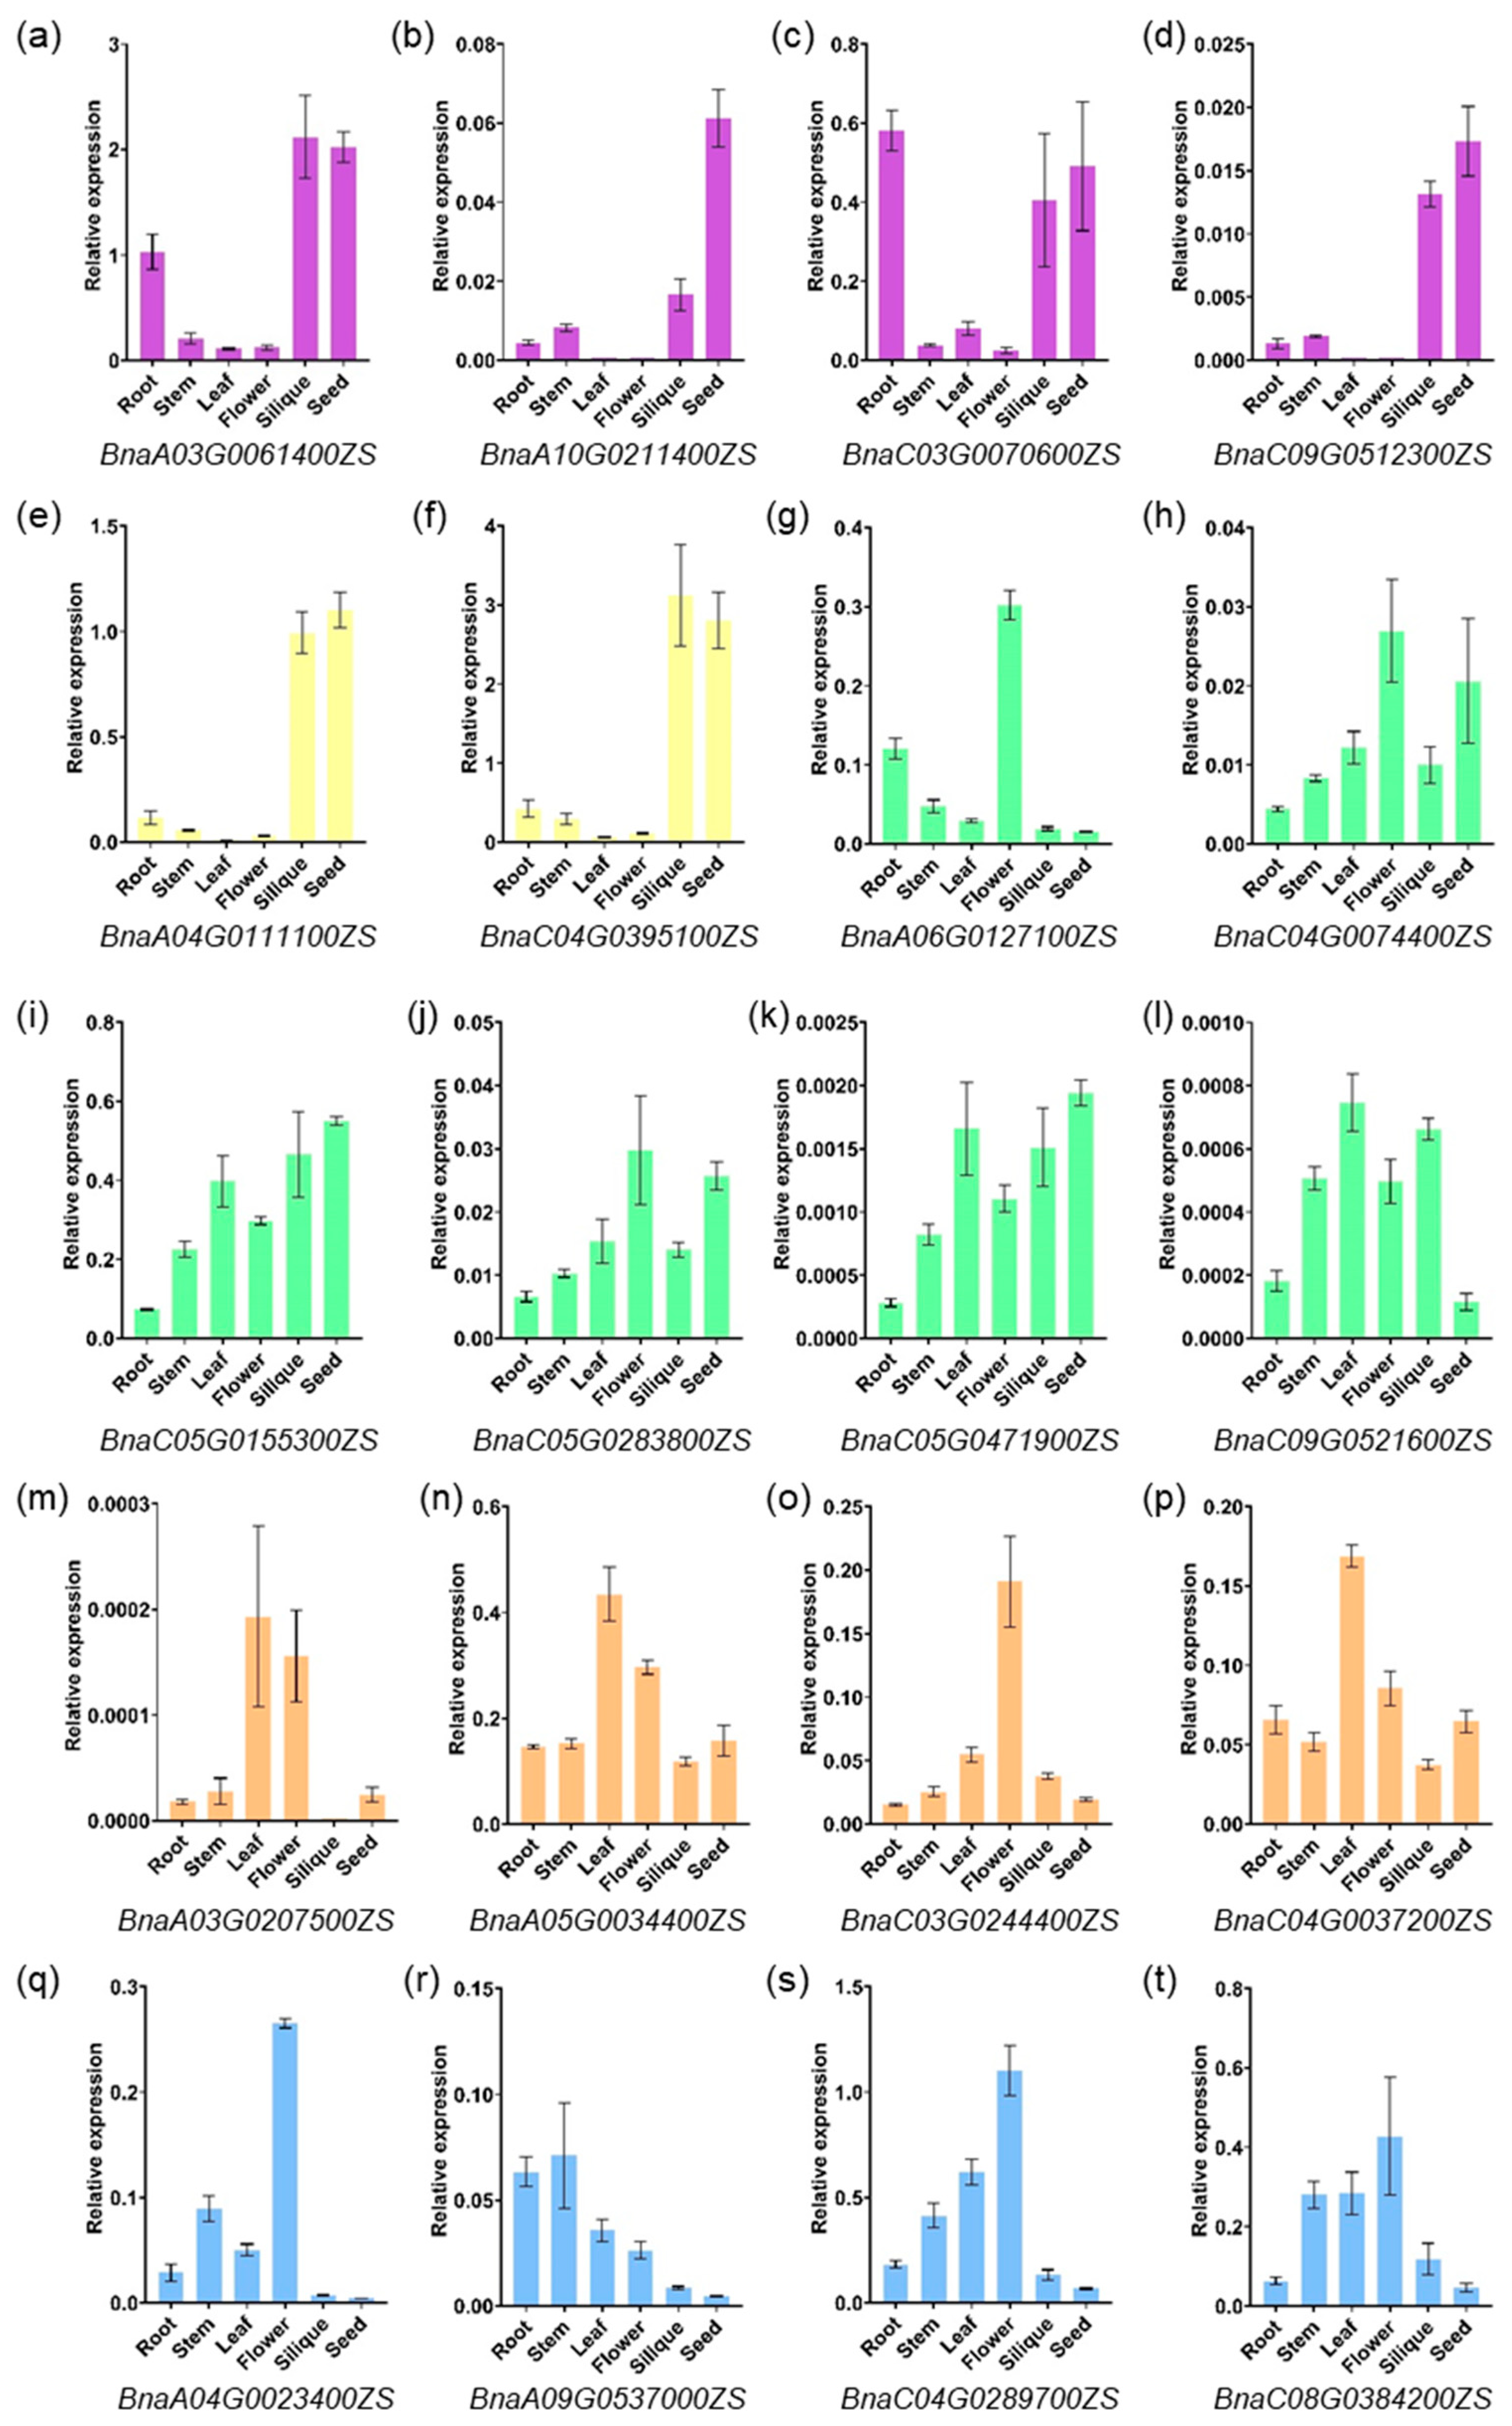
2.5. Expression Profiling of PCO Genes in Different Tissues

Based on Arabidopsis eFP Browser data (http://bar.utoronto.ca/efp/cgi-bin/efpWeb.cgi, accessed on 28 March 2023) and RNA-seq data (B. rapa: GSE43245, B. oleracea: GSE42891 and B. napus: BnIR database) (Table S3), the PCO genes were expressed in different vegetative and reproductive organs of the four species at different developmental stages (Figure 5). qRT-PCR was performed to verify the expression pattern in Arabidopsis, B. rapa, B. oleracea and B. napus (Figure 6, Figure 7 and Figure S9). In general, the expression pattern of PCO differed between groups (Figure 5). Almost all PCOs were weakly expressed in pollen, indicating that PCO expression was down-regulated in sperm cells, presumably due to chromosomal structure or histone modifications. On the other hand, most of PCO5s were expressed in different tissues, indicating that it involved in both vegetative and reproductive development. Compared with the public data, qRT-PCR analysis of BnaPCOs showed the similar results (Figure 7).
There were six PCO3 genes in B. napus, and genes (BnaA06G0127100 and BnaC05G0155300) with higher sequence similarity to ancestral genes (BraA6G014250 and Bo5G025500) had higher expression levels, whereas genes with lower sequence similarity to ancestral genes had lower expression levels (Figure 7 and Figure S4). This suggested that genes with higher sequence similarity to the ancestral genes may play a major role, while the new genes may be pseudogenes that have been amplified during evolution or may be silent under normal conditions and be as a backup for their homolog genes under special conditions.

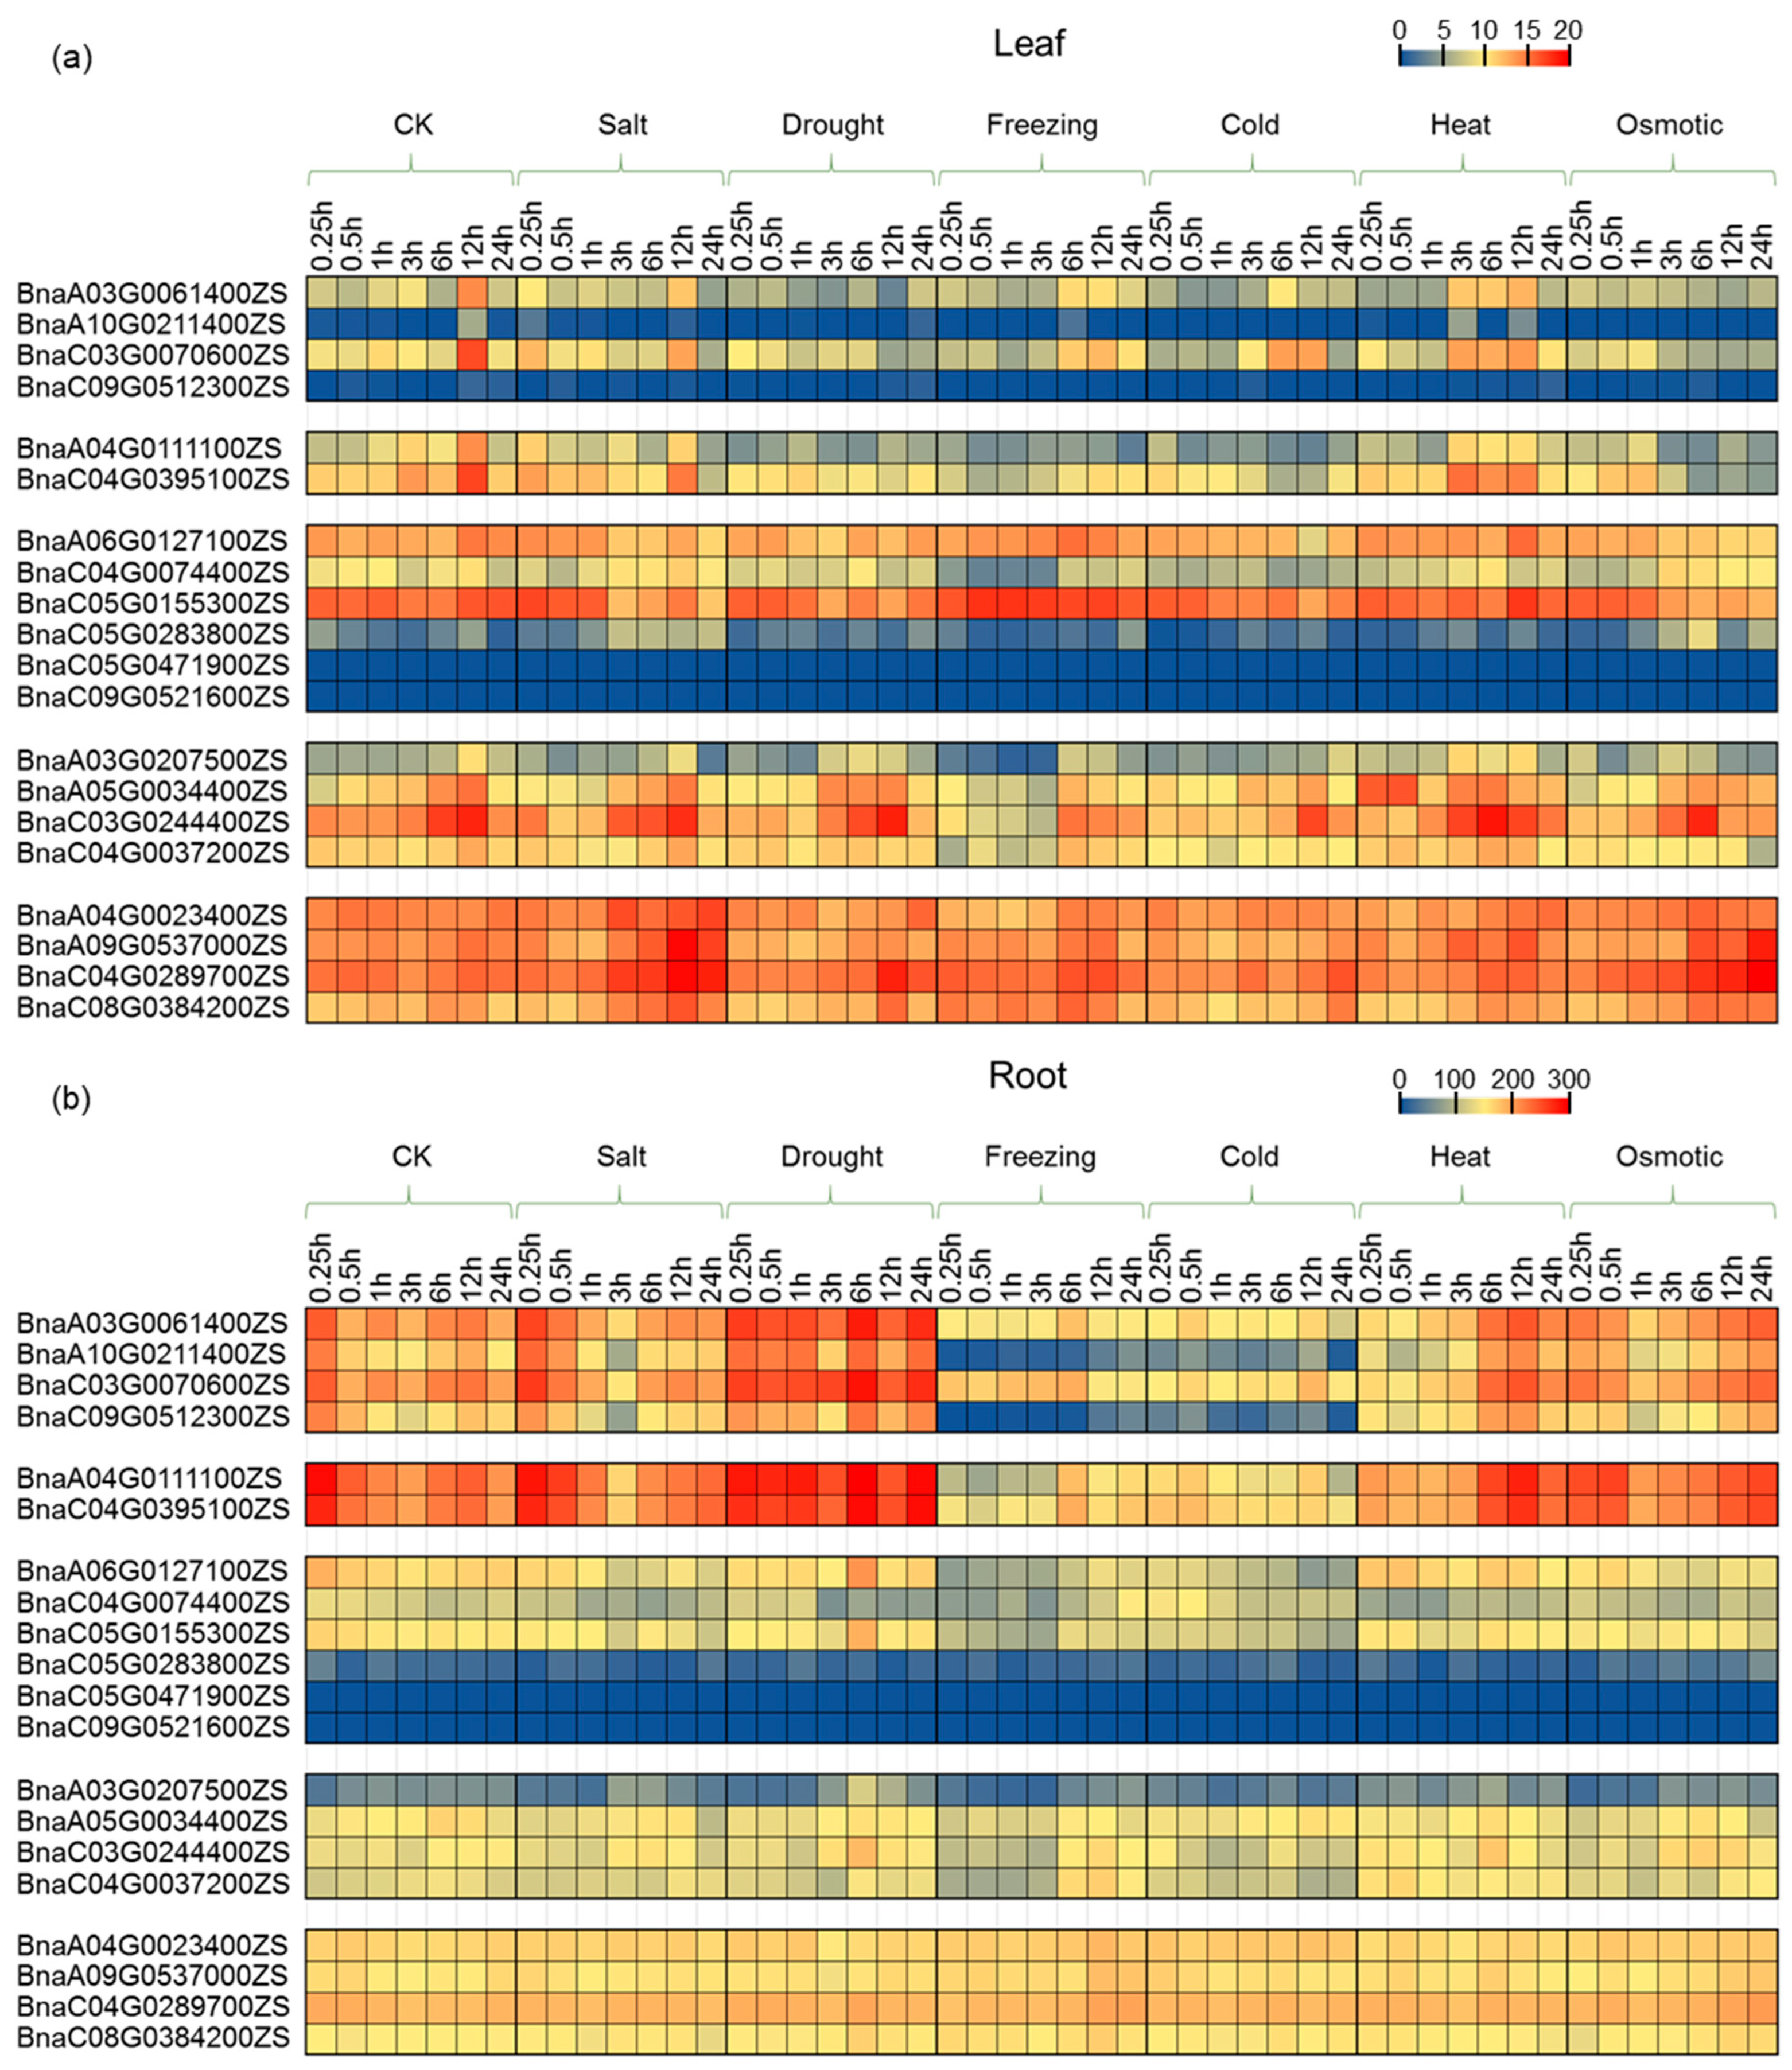
2.6. Expression Profiling of PCO Genes under Abiotic Stress Treatment

To reveal the roles of PCOs in stress response in B. napus, the expression patterns upon various abiotic treatment were investigated (Figure 8, Table S4). In general, the expression of most PCO genes in leaves did not change significantly under various abiotic stress treatments (Figure 8a). In leaves, PCO3 gene expression was strongly induced under freezing stress, and PCO5 gene expression was increased under salt and osmotic stress as well. However, the response of PCO genes to stress was much stronger in roots than in leaves (Figure 8b). In roots, the expression of PCO1 and PCO2 were strongly induced by drought, and the expression of PCO1, PCO2, PCO3 and PCO4 were extremely down-regulated by freezing and cold stress. However, PCO5 gene expression in roots changed weakly under the abiotic stress treatments compared with other PCO genes, which was consistent with the hypothesis that PCO5 worked as a fundamental gene.
Though there were similar motifs of drought-inducible and low-temperature responsive on PCOs promoter region, the gene expression pattern was various under drought, freezing or cold stress treatment. It implied that there were other regulators along with cis-elements to regulate PCO gene expression. It was interesting that PCO3 was up-regulated in leaves and down-regulated in roots after freezing treatment. In other words, PCO3 showed opposite response patterns in leaves and roots under freezing stress treatment. This suggested that PCO3 may play different roles in leaves and roots under freezing stress, and further studies were needed to clarify this.

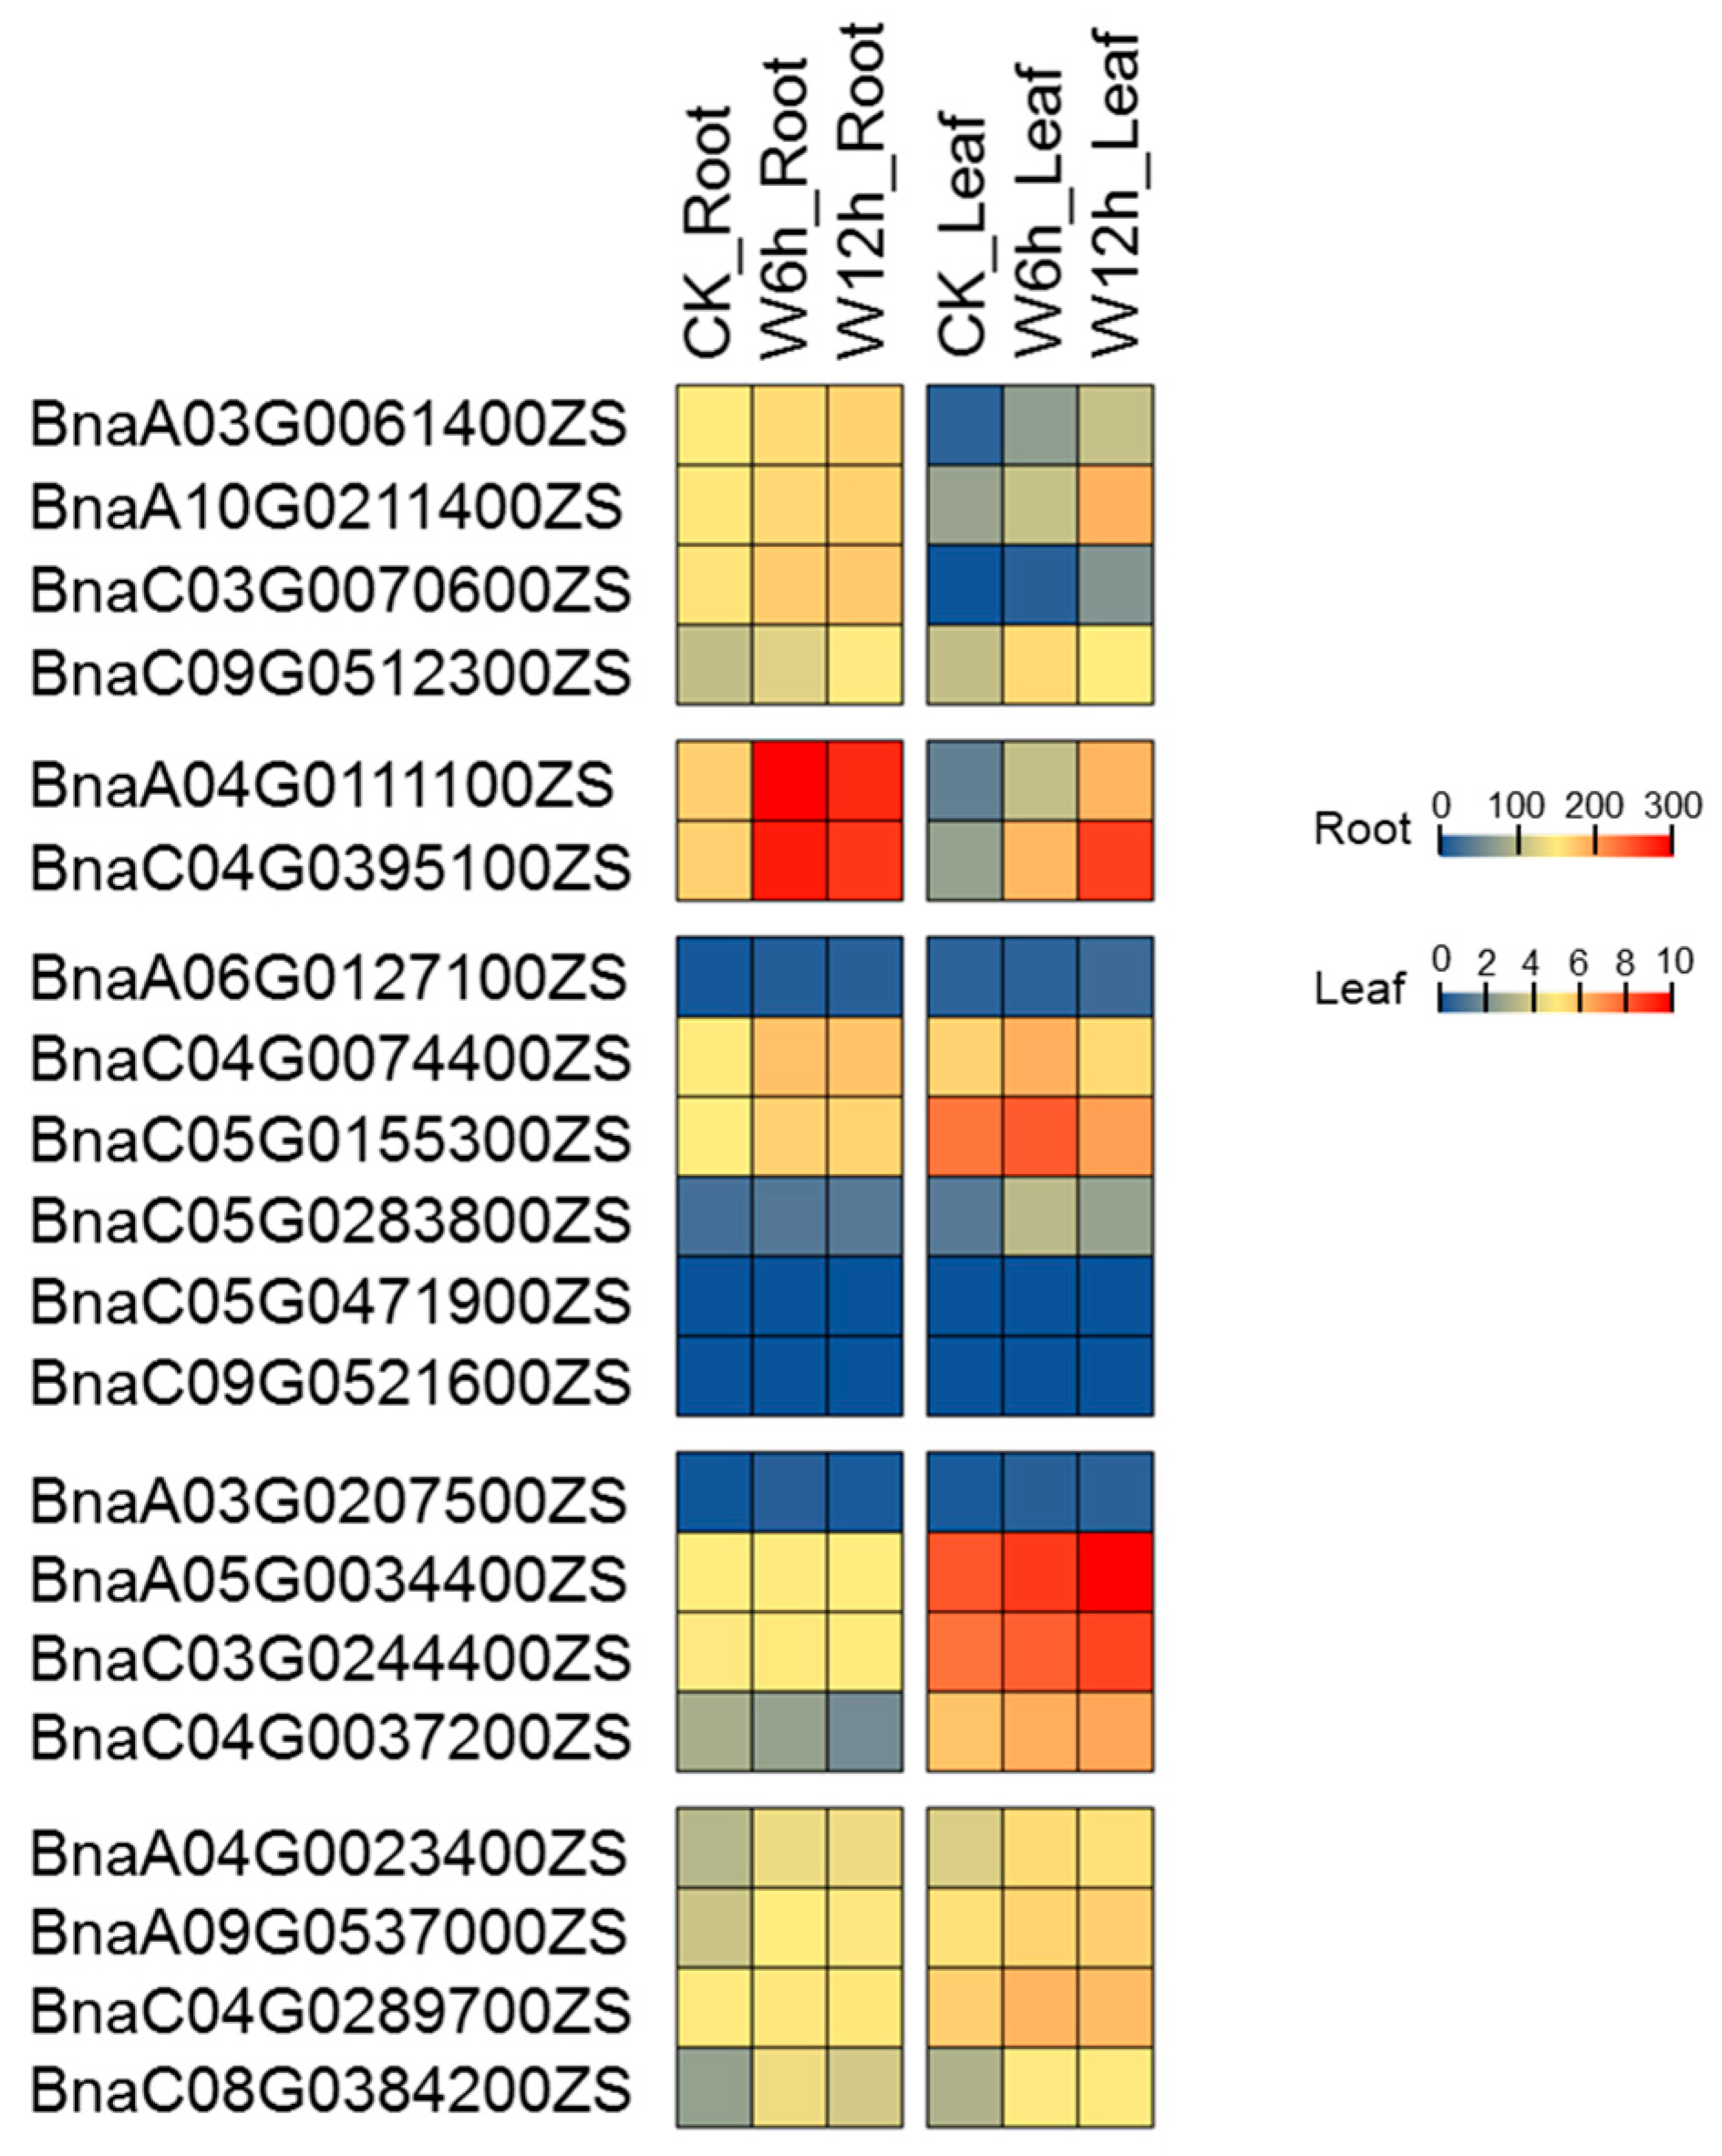
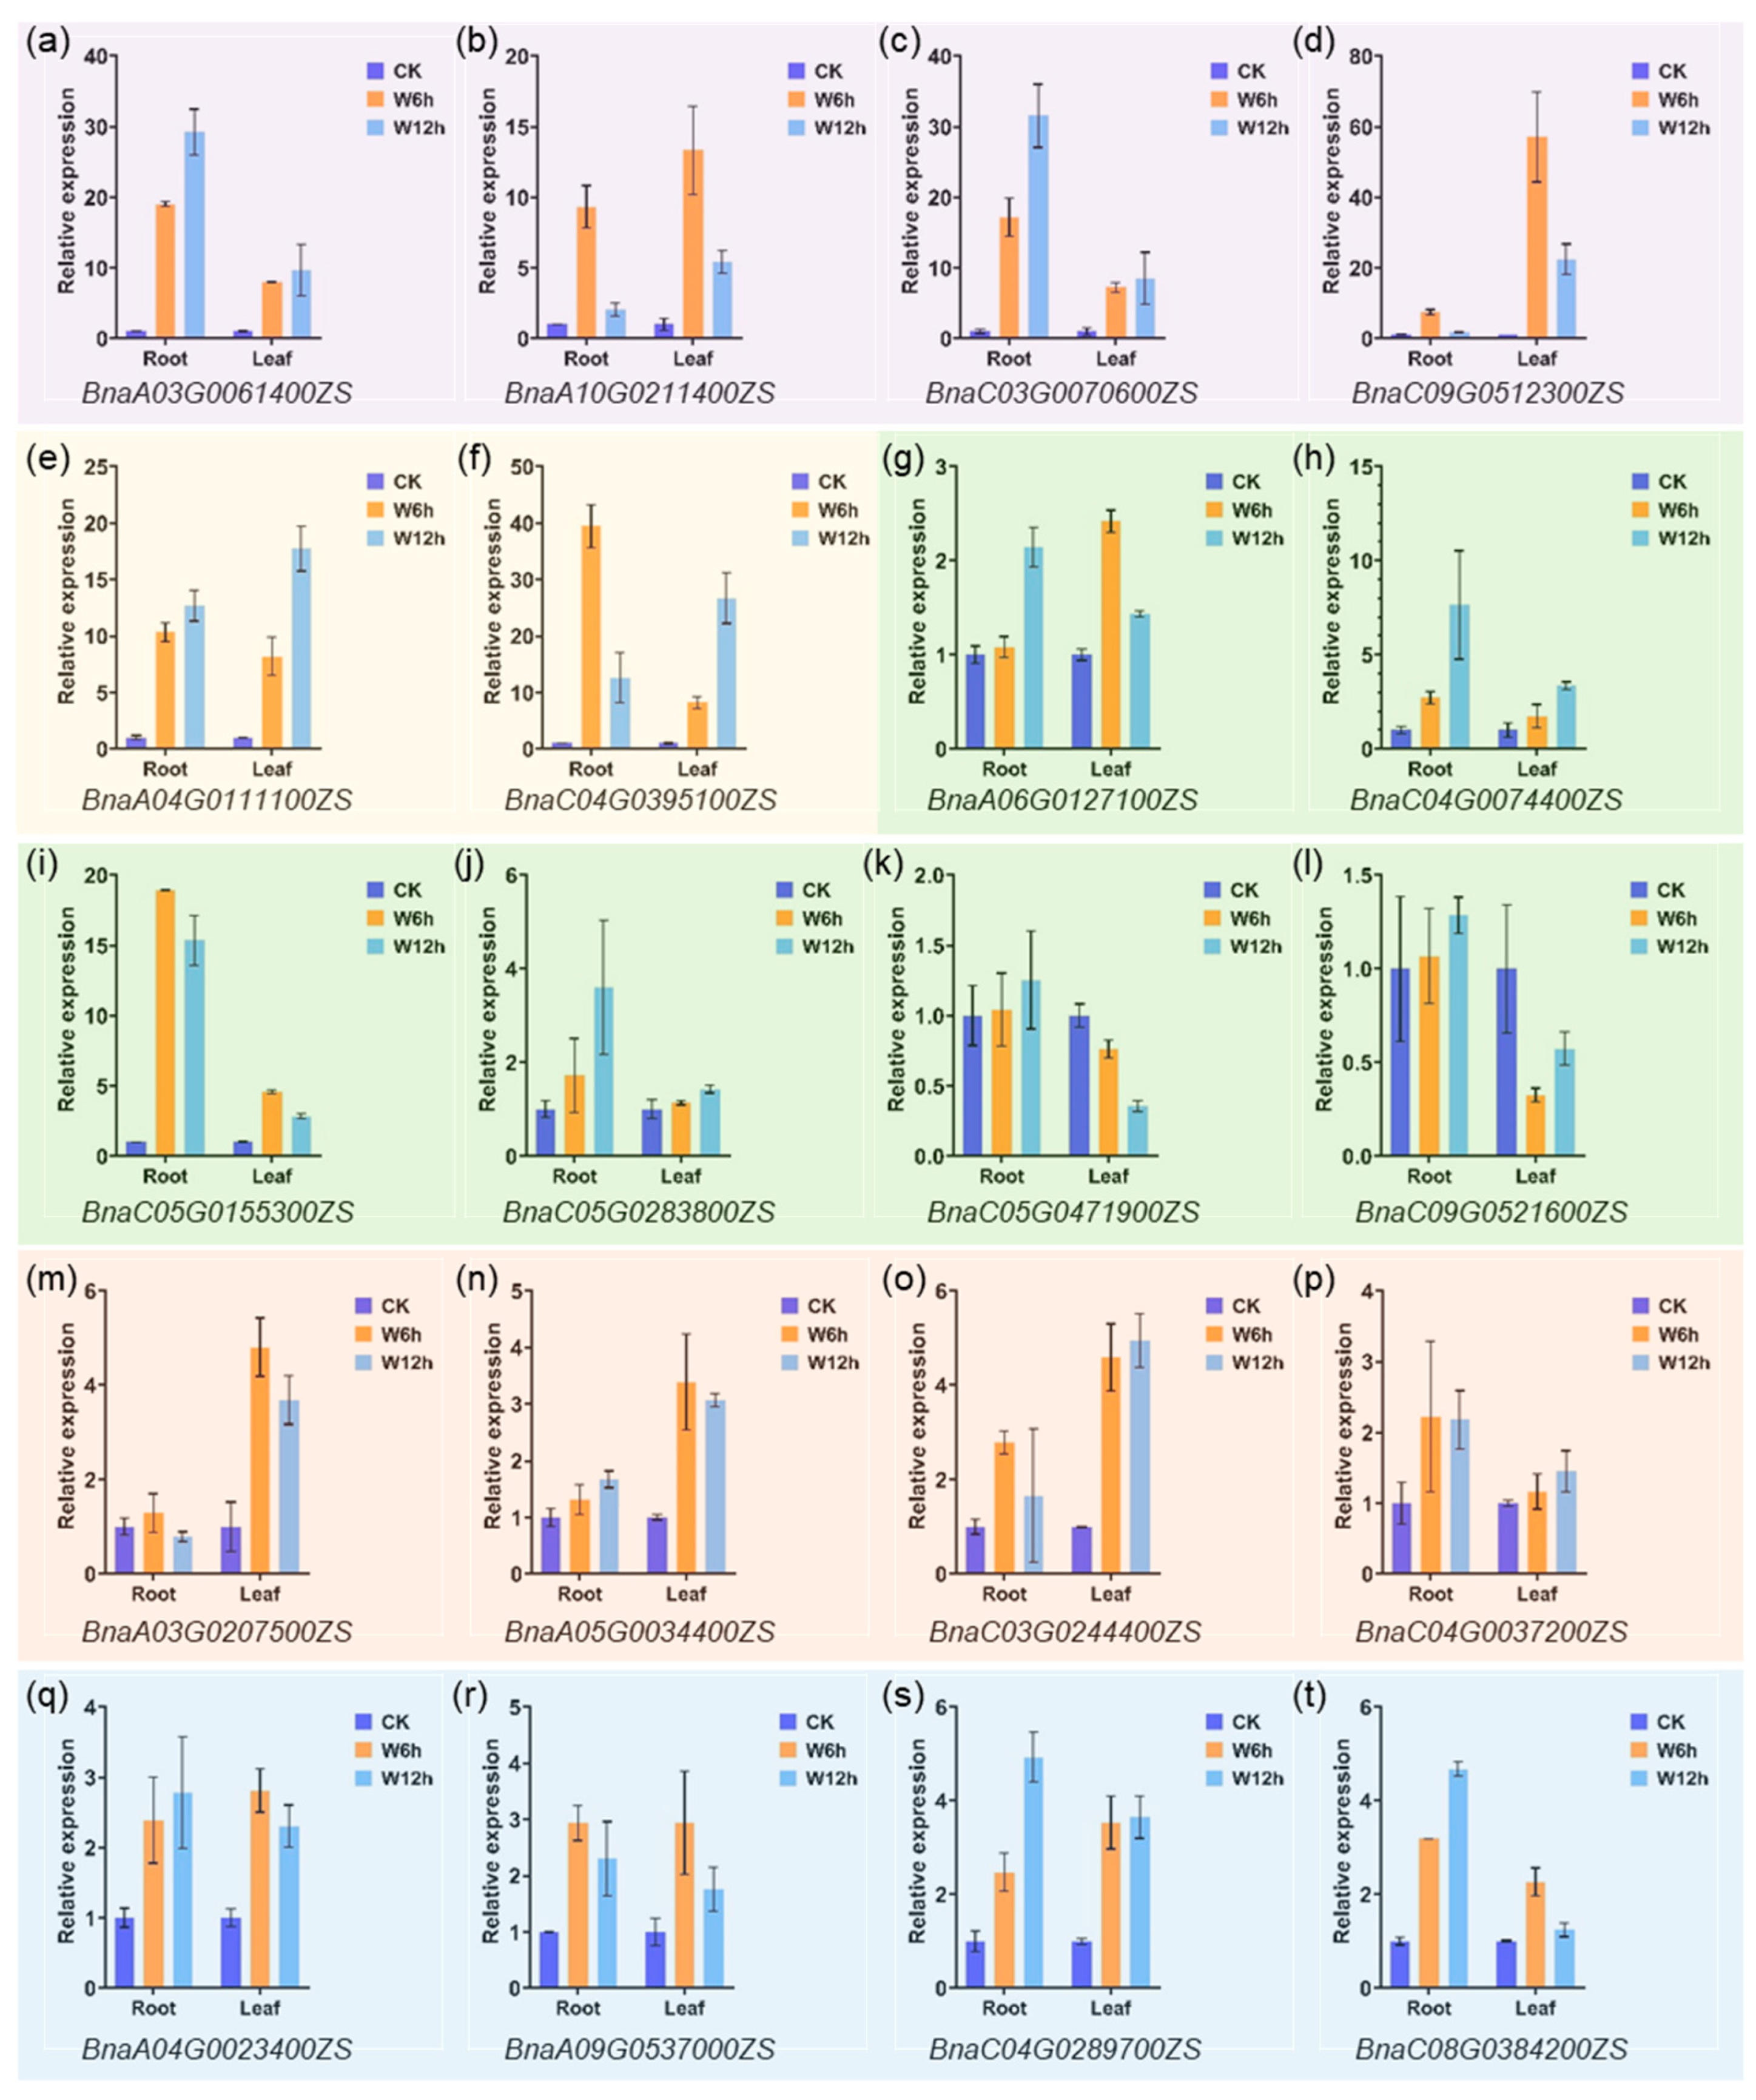
2.7. Expression Profiling of PCO Genes under Waterlogging Stress

Waterlogging removes air from soil leading to a blockage of gas exchange between the soil and the atmosphere [38,39]. Meanwhile, the diffusion rate of oxygen in water is only one tenth of that in air. As a result, oxygen availability in flooded soils is greatly limited, leading to suppression of root respiration. As mentioned before, PCO is an oxygen sensor in plant [11]. Therefore, it is speculated that PCO plays an important role in the hypoxic response induced by waterlogging stress. In order to elucidate the potential function of BnaPCO in response to waterlogging stress, RNA-seq and qRT-PCR assay were performed with leaves and roots after waterlogging stress in B.napus. Transcriptome data and qRT-PCR data (Figure 9 and Figure 10, Table S5) showed that compared with CK, the expression of PCOs was significantly induced by waterlogging stress. Compared to other genes, the expression of PCO2 gene pairs (BnaA04G0111100ZS and BnaC04G0395100ZS) were strongly induced both in leaves and roots, while the expression of PCO4 gene pairs (BnaA05G0034400ZS and BnaC03G0244400ZS) were particularly strongly expressed in leaves. In addition, gene expression of PCO3 (BnaC05G0471900ZS and BnaC09G0521600ZS) were barely detectable in the transcriptome data, which was consistent with the previous result (Figure 5 and Figure 7). According to the expression results, the function of PCO was conserved under hypoxic stress.

3. Discussion

The Plant Cysteine Oxidase family (PCO) is a set of plant O2-sensing enzymes, which catalyze the O2-dependent step [11]. In Arabidopsis, PCO has five members, PCO1, PCO2, PCO3, PCO4 and PCO5. In this study, 20, 8 and 7 PCO genes in B. napus, B. oleracea and B. rapa were identified, respectively (Figure 1). In B. napus, the number of PCO genes in the An subgenome (8) was almost the same as that in the diploid ancestors B. rapa (7) (Table 1). This showed that the An subgenome PCO genes were relatively preserved after the whole-genome duplication event in B. napus. However, PCO3 genes in the Cn subgenome (BnaC04G0074400ZS, BnaC05G0155300ZS, BnaC05G0283800ZS, BnaC05G0471900ZS and BnaC09G0521600ZS) were mutated from the diploid ancestor B. oleracea (Bo5G025500). It suggested that the Cn subgenome was much flexible during the evolution, compared with the An subgenome [40]. PCO sequence alignment (Figures S2–S6) revealed that most PCOs were conserved in Brassicaceae, indicating that these duplicated PCO genes can still retain the function of their ancestors in these species.
The gene expression pattern of duplicated genes with similar functions may change during the formation of allopolyploids, which takes several typical patterns, including transgressive up/down-regulation, unequal parental contributions, and silencing [40,41]. Although PCO3 was expanded in B. napus, half of them were slightly expressed in different tissues or abiotic stress treatment. According to the results of PCO3 alignment (Figure S4), BnaA06G0127100ZS was derived from BraA06G014250, BnaC05G0155300ZS was derived from Bo5G025500, and the remaining four genes may be generated by mutation or amplification of DNA fragments during the evolution of polyploid. The expression patterns of BnaA06G0127100ZS and BnaC05G0155300ZS maintained their expression patterns in two diploid progenitors. In addition, the expression of BnaC04G0074400ZS and BnaC05G0283800ZS responded to abiotic stress (Figure 8, Figure 9 and Figure 10). It indicated that the newly generated genes may contribute to phenotypic differences between allopolyploids and their parental species under abiotic stress conditions.
It has been studied that transcription factors (TFs) bind to cis-regulatory DNA sequences at the 5’ upstream end of genes to activate or repress gene expression [42,43]. In general, genes containing stress response elements in their promoter region are likely to be regulated by stress related TFs [25,31,39,44,45]. It is reported that HSFB2b directly binds to GmC4H and GmCHS3 to regulate the gene expression in response to salt stress, since there are HSEs (Heat Shock Elements) in the promoter regions of the GmC4H and GmCHS3 [46]. It was showed that hormone-responsive elements and environmental stress-related elements were distributed on the BnaPCO promoters (Table S2). Combined with the expression data with abiotic stress treatment, BnaPCO expression was regulated by various stress responses, especially drought, freezing, cold and waterlogging stress (Figure 8, Figure 9 and Figure 10). However, the expression level was different under different stress conditions. For instance, there were seven anaerobic-induction cis-elements on the promoter region of BnaC04G0395100ZS, but the degree of waterlogging induced expression was much different between leaves and roots (Figure 9 and Figure 10). As chromosome structure, histone modification, DNA methylation, transcriptional factors, cis-elements and other regulators work together to regulate gene expression [43], more studies are needed to explore the regulation mechanism of PCO expression under abiotic stress.
Oxygen homeostasis is critical for crop development, and hypoxia in plants is typically a consequence of reduced O2 diffusion under conditions of waterlogging or submergence [24,47,48,49]. The quality and yield of rapeseed are seriously affected by waterlogging stress in China [28,49]. It is reported that the response to hypoxia in rice, Arabidopsis and barley is mediated by the group VII ETHYLENE RESPONSE FACTORs (ERF-VIIs) [4,8,9,10,19]. Moreover, the PCOs directly link O2 availability to ERF-VII stability and anaerobic adaptation, leading to the suggestion that they act as plant O2 sensors [6,7,11]. There were multiple anaerobic-induction cis-elements distributed on the BnaPCO promoters, and BnaPCO expression were induced by waterlogging stress after 6 h treatment both in leaves and roots. According to the expression results (Figure 9 and Figure 10), it suggested that BnaPCO was a vital component, connecting environmental stimulus with cellular and physiological response and BnaPCO2 could be a potential target for improving waterlogging stress tolerance. Furthermore, H164 and D176 were in the AtPCO4 active site [12] and it was conserved in BnaPCO4 as shown in Figure S7. It implied that the function of BnaPCO in catalyzing ERF-VIIs could be conserved and targeting PCOs will be an effective way to improve the rapeseed tolerance to waterlogging stress by manipulating their O2 sensitivity and/or substrate specificity.

4. Materials and Methods

4.1. Identification of the PCO Gene Family

The protein and nucleotide sequences of AtPCOs were obtained with TAIR (https://www.arabidopsis.org/, accessed on 10 June 2022). AtPCO proteins were used as query sequences to search for the PCO proteins of B. napus, B. rapa and B. oleracea using BLASTp (E-value < 1 × 10⁻⁵) in BARD (http://www.brassicadb.cn/#/BLAST/, accessed on 10 January 2023; protein databases were Brana ZS V2.0 pep, Brara Chiifu V3.5 pep and Braol JZS V2.0 pep, respectively). ExPASy [50] was used to investigate the physical and chemical properties of these PCO proteins.

4.2. Phylogenetic Analysis, Chromosomal Locations and Syntenic Relationship

ClustalW was used to align the multiple sequences of all PCO proteins (from Arabidopsis thaliana, B. napus, B. rapa and B. oleracea), and MEGA 11 was used to build a phylogenetic tree using the neighbor-joining (NJ) phylogenetic technique with 1000 bootstrap replicates. Arabidopsis_thaliana.TAIR10.dna (genome) and Arabidopsis_thaliana.TAIR10.gff3 (annotation information) were downloaded from the public database in https://www.arabidopsis.org/ (accessed on 10 January 2023). The genome and annotation information of B. rapa_Chiifu_V3.5, B._oleracea.BOL, and B. napus ZS11 were downloaded from the public database in https://yanglab.hzau.edu.cn/BnIR (accessed on 15 January 2023) [51]. TBtools version 1.116 was used to examine the gene chromosomal localization and syntenic relationship with the genome data, gff3 files and multiple synteny plot tool kit following the software instruction [30].

4.3. Analysis of Gene Structure, Motif Composition and Cis-Element

The motifs of BnaPCO proteins were predicted using the MEME v5.5.2 [29]. The number of motifs should not exceed 8. The distribution of motifs occurs zero or one time in each sequence. In order to investigate the structural characteristics of the BnaPCOs, the gff3 file (ZS11.annotation.gff3) was downloaded from the B. napus database (http://cbi.hzau.edu.cn/cgi-bin/rape/download_ext, accessed on 15 January 2023), which has the annotation information of the B. napus genome. The position information of introns and exons is obtained from the gff3 file. Meanwhile, the motif information was submitted to TBtools to graphically display gene structures and motif distributions.
To identify the cis-element of BnaPCOs, TBtools was used to obtain the 2000 bp sequences in front of the genomic CDS. Then, the PlantCARE [33] was used to predict the cis-elements on these promoters. Thus, the number and types of different cis-acting elements in BnaPCOs were classified and visualized with TBtools.

4.4. Plant Materials and Treatments

Zhongshuang 11 (ZS11, a semi-winter cultivar of Brassica napus is widely planted in Southern China and the genome sequence is available) seeds were germinated on filter paper, and the seedlings were then transplanted into pots with soil and nurtured in a growth chamber for four weeks (23 °C, 16 h light/8 h dark cycle, a relative humidity of 60%, 300 μmol m−2 s−1 light intensity). The waterlogging treatment was performed as previously described [27]. The pots of 4-week-old seedlings were placed in a 28 cm × 14 cm × 14 cm container filled with water and the water level was maintained at approximately 2 cm above the soil surface. Control plants (CK) remained well-watered throughout the experiment.

4.5. RNA-Seq and Heat Map Analysis of the PCO Transcriptome Data

Leaf and root samples of CK, 6 h treatment and 12 h-treatment were collected for RNA isolation and total RNA isolated using Trizol Reagent (Invitrogen, Carlsbad, CA, USA) according to the manufacturer’s introductions. There were three biological replicates for each sample. Total amounts and integrity of RNA were assessed using the RNA Nano 6000 Assay Kit of the Bioanalyzer 2100 system (Agilent Technologies, Santa Clara, CA, USA). A total of 1 µg total RNA per sample was used as input material for the lncRNA library preparation. Strand-specific libraries were generated using NEBNext® UltraTM RNA Library Prep Kit for Illumina® (NEB, Ipswich, MA, USA) following the manufacturer’s recommendations and index codes were added to attribute sequences to each sample. RNA Sequencing was performed by the Illumina NovaSeq 6000 (Novogene, Beijing, China). Hisat2 v2.0.5 was used to map the reads to the reference genome and the gene expression level was determined by FPKM (number of Fragments Per Kilobase of transcript sequence per Millions base pairs sequenced) calculation [52]. Differential expression analysis between CK and waterlogging treatment was performed using the edgeR R package. The p values were adjusted using the Benjamini and Hochberg method. Significantly differential expression genes were screened based on the following criteria: Corrected p-value < 0.05.
The expression patterns of BnaPCOs in different tissues and other abiotic stress treatment were obtained from the BnTIR (Brassica napus transcriptome information resource) database [37]. The public expression data of AtPCOs, BraPCOs and BoPCOs were obtained from Arabidopsis eFP Browser data, RNA-seq data of B. rapa (GSE43245) [35] and RNA-seq data of B. oleracea (GSE42891) [36]. All the expression data were standardized based on a log2 scale, and clustered and visualized with TBtools.

4.6. Quantitative Real-Time RT-PCR (qRT-PCR) Analysis

To verify the PCO gene expression in different tissues, samples of root, stem, leaf, flower, silique and seed from Arabidopsis and B. napus, and samples of root, stem and leaf from B. rapa and B. oleracea were collected. Leaf and root samples of B. napus under waterlogging stress treatment with 6 h and 12 h were collected as well. Total RNA was extracted using MolPure® Plant RNA Kit according to manufacturer instructions (Yeasen, Shanghai, China). The first strand cDNA was synthesized by Hifair® III 1st Strand cDNA Synthesis SuperMix for qPCR (gDNA digester plus) (Yeasen, Shanghai, China). Then, the gene relative expression was detected by qRT-PCR assay using PerfectStart® Green qPCR SuperMix (TransGen, Beijing, China) and a CFX96™ Real-Time PCR Detection System (BIO-RAD, Hercules, CA, USA). Gene expression was normalized to AtActin2, BraGAPDH, BoActin and BnaActin7, respectively [27,53,54,55]. Relative gene expression values were calculated with the ΔΔCt method. Experiments were performed with three biological replicates. Primers for qRT-PCR were listed in Table S6.

5. Conclusions

In this study, we identified 20, 7 and 8 PCO (Plant Cysteine Oxidase) proteins in B. napus, B. rapa and B. oleracea, respectively, by exploring the important role of PCO genes in Brassicaceae plants. Collinearity analysis shows that the PCO gene family was relatively conserved in evolution of B. rapa, B. oleracea, Arabidopsis, and B. napus. However, there were mutations or duplications of PCO3 and PCO4 during homologous evolution process. The cis-elements that regulate hormone response and response to abiotic stresses were found in the BnaPCO promoters. In addition, we found that the Bna/Bra/BoPCO genes were expressed differently in different tissues at different developmental stages. Remarkably, BnaPCO2s were significantly induced after waterlogging treatment, which was consistent with the cis-element analysis and previous studies. BnaPCO2 could be the potential target for waterlogging tolerance improvement. This study provides a foundation for further understanding the biology and stress response functions of PCO family genes in B. napus.

Supplementary Materials

The following supporting information can be downloaded at: https://www.mdpi.com/article/10.3390/ijms241411242/s1.

Author Contributions

X.B. conducted the experiment, analyzed the data, and drafted the manuscript. Y.C. and X.Z. conducted the experiment. N.M. designed the experiment and modified the manuscript. All authors have read and agreed to the published version of the manuscript.

Funding

This research was funded by the Agricultural Science and Technology Innovation Project of Chinese Academy of Agricultural Science (CAAS-ASTIP-2021-OCRI) and the National Natural Science Foundation of China (31971855).

Institutional Review Board Statement

Not applicable.

Informed Consent Statement

Not applicable.

Data Availability Statement

The clean reads of RNA-seq in this paper have been deposited in the National Genomics Data Center [56,57] (GSA: CRA010912). All relevant data are available from the corresponding author on request (mani@caas.cn).

Acknowledgments

We thank the Rapeseed Germplasm Innovation Team at Oil Crops Research Insititute CAAS for providing seeds of B. rapa and B. oleracea.

Conflicts of Interest

The authors declare no conflict of interest.

References

  1. Chung, H.S.; Wang, S.B.; Venkatraman, V.; Murray, C.I.; Van, E.J.E. Cysteine oxidative posttranslational modifications: Emerging regulation in the cardiovascular system. Circ. Res. 2013, 112, 382–392. [Google Scholar] [CrossRef] [Green Version]
  2. Romero, L.C.; Aroca, M.Á.; Laureano-Marín, A.M.; Moreno, I.; García, I.; Gotor, C. Cysteine and cysteine-related signaling pathways in Arabidopsis thaliana. Mol. Plant 2014, 7, 264–276. [Google Scholar] [CrossRef] [PubMed] [Green Version]
  3. Heo, A.J.; Kim, S.B.; Ji, C.H.; Han, D.; Lee, S.J.; Lee, S.H.; Lee, M.J.; Lee, J.S.; Ciechanover, A.; Kim, B.Y.; et al. The N-terminal cysteine is a dual sensor of oxygen and oxidative stress. Proc. Natl. Acad. Sci. USA 2021, 118, e2107993118. [Google Scholar] [CrossRef] [PubMed]
  4. Gibbs, D.J.; Tedds, H.M.; Labandera, A.M.; Bailey, M.; White, M.D.; Hartman, S.; Sprigg, C.; Mogg, S.L.; Osborne, R.; Dambire, C.; et al. Oxygen-dependent proteolysis regulates the stability of angiosperm polycomb repressive complex 2 subunit VERNALIZATION 2. Nat. Commun. 2018, 9, 5438. [Google Scholar] [CrossRef] [Green Version]
  5. Weits, D.A.; Kunkowska, A.B.; Kamps, N.C.W.; Portz, K.M.S.; Packbier, N.K.; Nemec, V.Z.; Gaillochet, C.; Lohmann, J.U.; Pedersen, O.; Dongen, J.T.; et al. An apical hypoxic niche sets the pace of shoot meristem activity. Nature 2019, 569, 714–717. [Google Scholar] [CrossRef]
  6. White, M.D.; Klecker, M.; Hopkinson, R.J.; Weits, D.A.; Mueller, C.; Naumann, C.; O’Neill, R.; Wickens, J.; Yang, J.; Brooks-Bartlett, J.C.; et al. Plant cysteine oxidases are dioxygenases that directly enable arginyl transferase-catalysed arginylation of N-end rule targets. Nat. Commun. 2017, 8, 14690. [Google Scholar] [CrossRef] [Green Version]
  7. Weits, D.A.; Giuntoli, B.; Kosmacz, M.; Parlanti, S.; Hubberten, H.M.; Riegler, H.; Hoefgen, R.; Perata, P.; Dongen, J.T.; Licausi, F. Plant cysteine oxidases control the oxygen-dependent branch of the N-end-rule pathway. Nat. Commun. 2014, 5, 3425. [Google Scholar] [CrossRef] [Green Version]
  8. Licausi, F.; Dongen, J.T.; Giuntoli, B.; Novi, G.; Santaniello, A.; Geigenberger, P.; Perata, P. HRE1 and HRE2, two hypoxia-inducible ethylene response factors, affect anaerobic responses in Arabidopsis thaliana. Plant J. 2010, 62, 302–315. [Google Scholar] [CrossRef]
  9. Hattori, Y.; Nagai, K.; Furukawa, S.; Song, X.J.; Kawano, R.; Sakakibara, H.; Wu, J.; Matsumoto, T.; Yoshimura, A.; Kitano, H.; et al. The ethylene response factors SNORKEL1 and SNORKEL2 allow rice to adapt to deep water. Nature 2009, 460, 1026–1030. [Google Scholar] [CrossRef] [PubMed]
  10. Hinz, M.; Wilson, I.W.; Yang, J.; Buerstenbinder, K.; Llewellyn, D.; Dennis, E.S.; Sauter, M.; Dolferus, R. Arabidopsis RAP2.2: An ethylene response transcription factor that is important for hypoxia survival. Plant Physiol. 2010, 153, 757–772. [Google Scholar] [CrossRef] [PubMed] [Green Version]
  11. White, M.D.; Kamps, J.J.A.G.; East, S.; Taylor, K.L.J.; Flashman, E. The plant cysteine oxidases from Arabidopsis thaliana are kinetically tailored to act as oxygen sensors. J. Biol. Chem. 2018, 293, 11786–11795. [Google Scholar] [CrossRef] [PubMed] [Green Version]
  12. White, M.D.; Dalle, C.L.; Lavilla, P.M.; Iacopino, S.; Edwards, M.; Dunne, K.; Pires, E.; Levy, C.; McDonough, M.A.; Licausi, F.; et al. Structures of Arabidopsis thaliana oxygen-sensing plant cysteine oxidases 4 and 5 enable targeted manipulation of their activity. Proc. Natl. Acad. Sci. USA 2020, 117, 23140–23147. [Google Scholar] [CrossRef]
  13. Masson, N.; Keeley, T.P.; Giuntoli, B.; White, M.D.; Puerta, M.L.; Perata, P.; Hopkinson, R.J.; Flashman, E.; Licausi, F.; Ratcliffe, P.J. Conserved N-terminal cysteine dioxygenases transduce responses to hypoxia in animals and plants. Science 2019, 365, 65–69. [Google Scholar] [CrossRef] [PubMed]
  14. Taylor-Kearney, L.J.; Madden, S.; Wilson, J.; Myers, W.K.; Gunawardana, D.M.; Pires, E.; Holdship, P.; Tumber, A.; Rickaby, R.E.M.; Flashman, E. Plant cysteine oxidase oxygen-sensing function is conserved in early land plants and algae. ACS Bio Med. Chem. Au 2022, 2, 521–528. [Google Scholar] [CrossRef]
  15. Taylor-Kearney, L.J.; Flashman, E. Targeting plant cysteine oxidase activity for improved submergence tolerance. Plant J. 2022, 109, 779–788. [Google Scholar] [CrossRef]
  16. Dirr, A.; Gunawardana, D.M.; Flashman, E. Kinetic measurements to investigate the oxygen-sensing properties of plant cysteine oxidases. Methods Mol. Biol. 2023, 2648, 207–230. [Google Scholar] [PubMed]
  17. Chen, Z.; Guo, Q.; Wu, G.; Wen, J.; Liao, S.; Xu, C. Molecular basis for cysteine oxidation by plant cysteine oxidases from Arabidopsis thaliana. J. Struct. Biol. 2021, 213, 107663. [Google Scholar] [CrossRef]
  18. Weits, D.A.; Zhou, L.; Giuntoli, B.; Carbonare, L.D.; Iacopino, S.; Piccinini, L.; Lombardi, L.; Shukla, V.; Bui, L.T.; Novi, G.; et al. Acquisition of hypoxia inducibility by oxygen sensing N-terminal cysteine oxidase in spermatophytes. Plant Cell Environ. 2023, 46, 322–338. [Google Scholar] [CrossRef]
  19. Xu, K.; Xu, X.; Fukao, T.; Canlas, P.; Maghirang-Rodriguez, R.; Heuer, S.; Ismail, A.M.; Bailey-Serres, J.; Ronald, P.C.; Mackill, D.J. Sub1A is an ethylene-response-factor-like gene that confers submergence tolerance to rice. Nature 2006, 442, 705–708. [Google Scholar] [CrossRef] [Green Version]
  20. Cheng, F.; Wu, J.; Wang, X. Genome triplication drove the diversification of Brassica plants. Hortic. Res. 2014, 1, 14024. [Google Scholar] [CrossRef] [Green Version]
  21. Hu, J.; Chen, B.; Zhao, J.; Zhang, F.; Xie, T.; Xu, K.; Gao, G.; Yan, G.; Li, H.; Li, L.; et al. Genomic selection and genetic architecture of agronomic traits during modern rapeseed breeding. Nat. Genet. 2022, 54, 694–704. [Google Scholar] [CrossRef] [PubMed]
  22. Chalhoub, B.; Denoeud, F.; Liu, S.; Parkin, I.A.; Tang, H.; Wang, X.; Chiquet, J.; Belcram, H.; Tong, C.; Samans, B.; et al. Plant genetics. Early allopolyploid evolution in the post-Neolithic Brassica napus oilseed genome. Science 2014, 345, 950–953. [Google Scholar] [CrossRef] [Green Version]
  23. Tian, X.; Li, Z.; Liu, Y.; Li, W. Role of tillage measures in mitigating waterlogging damage in rapeseed. BMC Plant Biol. 2023, 23, 231. [Google Scholar] [CrossRef] [PubMed]
  24. Kayum, M.A.; Park, J.I.; Nath, U.K.; Biswas, M.K.; Kim, H.T.; Nou, I.S. Genome-wide expression profiling of aquaporin genes confer responses to abiotic and biotic stresses in Brassica rapa. BMC Plant Biol. 2017, 17, 23. [Google Scholar] [CrossRef] [PubMed] [Green Version]
  25. Ma, L.; Wu, J.; Qi, W.; Coulter, J.A.; Fang, Y.; Li, X.; Liu, L.; Jin, J.; Niu, Z.; Yue, J.; et al. Screening and verification of reference genes for analysis of gene expression in winter rapeseed (Brassica rapa L.) under abiotic stress. PLoS ONE 2020, 15, e0236577. [Google Scholar] [CrossRef]
  26. Tan, X.; Long, W.; Zeng, L.; Ding, X.; Cheng, Y.; Zhang, X.; Zou, X. Melatonin-induced transcriptome variation of rapeseed seedlings under salt stress. Int. J. Mol. Sci. 2019, 20, 5355. [Google Scholar] [CrossRef] [Green Version]
  27. Tong, J.; Walk, T.C.; Han, P.; Chen, L.; Shen, X.; Li, Y.; Gu, C.; Xie, L.; Hu, X.; Liao, X.; et al. Genome-wide identification and analysis of high-affinity nitrate transporter 2 (NRT2) family genes in rapeseed (Brassica napus L.) and their responses to various stresses. BMC Plant Biol. 2020, 20, 464. [Google Scholar] [CrossRef]
  28. Wang, Z.; Han, Y.; Luo, S.; Rong, X.; Song, H.; Jiang, N.; Li, C.; Yang, L. Calcium peroxide alleviates the waterlogging stress of rapeseed by improving root growth status in a rice-rape rotation field. Front. Plant Sci. 2022, 13, 1048227. [Google Scholar] [CrossRef]
  29. Bailey, T.L.; Johnson, J.; Grant, C.E.; Noble, W.S. The MEME suite. Nucleic Acids Res. 2015, 43, 39–49. [Google Scholar] [CrossRef] [Green Version]
  30. Chen, C.; Chen, H.; Zhang, Y.; Thomas, H.R.; Frank, M.H.; He, Y.; Xia, R. TBtools: An integrative toolkit developed for interactive analyses of big biological data. Mol. Plant 2020, 13, 1194–1202. [Google Scholar] [CrossRef]
  31. Zhao, J.; Favero, D.S.; Qiu, J.; Roalson, E.H.; Neff, M.M. Insights into the evolution and diversification of the AT-hook Motif Nuclear Localized gene family in land plants. BMC Plant Biol. 2014, 14, 266. [Google Scholar] [CrossRef] [Green Version]
  32. Maire, P.; Wuarin, J.; Schibler, U. The role of cis-acting promoter elements in tissue-specific albumin gene expression. Science 1989, 244, 343–346. [Google Scholar] [CrossRef] [PubMed]
  33. Lescot, M.; Déhais, P.; Thijs, G.; Marchal, K.; Moreau, Y.; Peer, Y.; Rouzé, P.; Rombauts, S. PlantCARE, a database of plant cis-acting regulatory elements and a portal to tools for in silico analysis of promoter sequences. Nucleic Acids Res. 2002, 30, 325–327. [Google Scholar] [CrossRef] [PubMed]
  34. Chow, C.N.; Chiang-Hsieh, Y.F.; Chien, C.H.; Zheng, H.Q.; Lee, T.Y.; Wu, N.Y.; Tseng, K.C.; Hou, P.F.; Chang, W.C. Delineation of condition specific Cis- and Trans-acting elements in plant promoters under various Endo- and exogenous stimuli. BMC Genom. 2018, 19, 85. [Google Scholar] [CrossRef] [PubMed] [Green Version]
  35. Tong, C.; Wang, X.; Yu, J.; Wu, J.; Li, W.; Huang, J.; Dong, C.; Hua, W.; Liu, S. Comprehensive analysis of RNA-seq data reveals the complexity of the transcriptome in Brassica rapa. BMC Genom. 2013, 14, 689. [Google Scholar] [CrossRef] [Green Version]
  36. Liu, S.; Liu, Y.; Yang, X.; Tong, C.; Edwards, D.; Parkin, I.A.; Zhao, M.; Ma, J.; Yu, J.; Huang, S.; et al. The Brassica oleracea genome reveals the asymmetrical evolution of polyploid genomes. Nat. Commun. 2014, 5, 3930. [Google Scholar] [CrossRef] [Green Version]
  37. Liu, D.; Yu, L.; Wei, L.; Yu, P.; Wang, J.; Zhao, H.; Zhang, Y.; Zhang, S.; Yang, Z.; Chen, G.; et al. BnTIR: An online transcriptome platform for exploring RNA-seq libraries for oil crop Brassica napus. Plant Biotechnol. J. 2021, 19, 1895–1897. [Google Scholar] [CrossRef]
  38. Mendiondo, G.M.; Gibbs, D.J.; Szurman-Zubrzycka, M.; Korn, A.; Marquez, J.; Szarejko, I.; Maluszynski, M.; King, J.; Axcell, B.; Smart, K.; et al. Enhanced waterlogging tolerance in barley by manipulation of expression of the N-end rule pathway E3 ligase PROTEOLYSIS6. Plant Biotechnol. J. 2016, 14, 40–50. [Google Scholar] [CrossRef]
  39. Klok, E.J.; Wilson, I.W.; Wilson, D.; Chapman, S.C.; Ewing, R.M.; Somerville, S.C.; Peacock, W.J.; Dolferus, R.; Dennis, E.S. Expression profile analysis of the low-oxygen response in Arabidopsis root cultures. Plant Cell 2002, 14, 2481–2494. [Google Scholar] [CrossRef] [Green Version]
  40. Jackson, S.; Chen, Z.J. Genomic and expression plasticity of polyploidy. Curr. Opin. Plant Biol. 2010, 13, 153–159. [Google Scholar] [CrossRef] [Green Version]
  41. Li, M.; Wang, R.; Wu, X.; Wang, J. Homoeolog expression bias and expression level dominance (ELD) in four tissues of natural allotetraploid Brassica napus. BMC Genom. 2020, 21, 330. [Google Scholar] [CrossRef] [PubMed]
  42. Hernandez-Garcia, C.M.; Finer, J.J. Identification and validation of promoters and cis-acting regulatory elements. Plant Sci. 2014, 217–218, 109–119. [Google Scholar] [CrossRef] [Green Version]
  43. Lu, L.; Wei, W.; Tao, J.J.; Lu, X.; Bian, X.H.; Hu, Y.; Cheng, T.; Yin, C.C.; Zhang, W.K.; Chen, S.Y.; et al. Nuclear factor Y subunit GmNFYA competes with GmHDA13 for interaction with GmFVE to positively regulate salt tolerance in soybean. Plant Biotechnol. J. 2021, 19, 2362–2379. [Google Scholar] [CrossRef] [PubMed]
  44. Kumari, A.; Dogra, V.; Joshi, R.; Kumar, S. Stress-responsive cis-regulatory elements underline podophyllotoxin biosynthesis and better performance of Sinopodophyllum hexandrum under water deficit conditions. Front. Plant Sci. 2021, 12, 751846. [Google Scholar] [CrossRef] [PubMed]
  45. Raza, A.; Su, W.; Gao, A.; Mehmood, S.S.; Hussain, M.A.; Nie, W.; Lv, Y.; Zou, X.; Zhang, X. Catalase (CAT) Gene Family in Rapeseed (Brassica napus L.): Genome-wide analysis, identification, and expression pattern in response to multiple hormones and abiotic stress conditions. Int. J. Mol. Sci. 2021, 22, 4281. [Google Scholar] [CrossRef]
  46. Bian, X.H.; Li, W.; Niu, C.F.; Wei, W.; Hu, Y.; Han, J.Q.; Lu, X.; Tao, J.J.; Jin, M.; Qin, H.; et al. A class B heat shock factor selected for during soybean domestication contributes to salt tolerance by promoting flavonoid biosynthesis. New Phytol. 2020, 225, 268–283. [Google Scholar] [CrossRef] [Green Version]
  47. Bailey-Serres, J.; Fukao, T.; Gibbs, D.J.; Holdsworth, M.J.; Lee, S.C.; Licausi, F.; Perata, P.; Voesenek, L.A.; Dongen, J.T. Making sense of low oxygen sensing. Trends Plant Sci. 2012, 17, 129–138. [Google Scholar] [CrossRef]
  48. Ambros, S.; Kotewitsch, M.; Wittig, P.R.; Bammer, B.; Mustroph, A. Transcriptional response of two Brassica napus cultivars to short-term hypoxia in the root zone. Front. Plant Sci. 2022, 13, 897673. [Google Scholar] [CrossRef]
  49. Hong, B.; Zhou, B.; Peng, Z.; Yao, M.; Wu, J.; Wu, X.; Guan, C.; Guan, M. Tissue-specific transcriptome and metabolome analysis reveals the response mechanism of Brassica napus to waterlogging stress. Int. J. Mol. Sci. 2023, 24, 6015. [Google Scholar] [CrossRef]
  50. Gasteiger, E.; Gattiker, A.; Hoogland, C.; Ivanyi, I.; Appel, R.D.; Bairoch, A. ExPASy: The proteomics server for in-depth protein knowledge and analysis. Nucleic Acids Res. 2003, 31, 3784–3788. [Google Scholar] [CrossRef] [Green Version]
  51. Yang, Z.; Wang, S.; Wei, L.; Huang, Y.; Liu, D.; Jia, Y.; Luo, C.; Lin, Y.; Liang, C.; Hu, Y.; et al. BnIR: A multi-omics database with various tools for Brassica napus research and breeding. Mol. Plant 2023, 16, 775–789. [Google Scholar] [CrossRef]
  52. Mortazavi, A.; Williams, B.A.; McCue, K.; Schaeffer, L.; Wold, B. Mapping and quantifying mammalian transcriptomes by RNA-Seq. Nat. Methods 2008, 5, 621–628. [Google Scholar] [CrossRef] [PubMed]
  53. Li, Q.T.; Lu, X.; Song, Q.X.; Chen, H.W.; Wei, W.; Tao, J.J.; Bian, X.H.; Shen, M.; Ma, B.; Zhang, W.K.; et al. Selection for a zinc-finger protein contributes to seed oil increase during soybean domestication. Plant Physiol. 2017, 173, 2208–2224. [Google Scholar] [CrossRef] [Green Version]
  54. Xi, X.; Wei, K.; Gao, B.; Liu, J.; Liang, J.; Cheng, F.; Wang, X.; Wu, J. BrFLC5: A weak regulator of flowering time in Brassica rapa. Theor. Appl. Genet. 2018, 131, 2107–2116. [Google Scholar] [CrossRef]
  55. Ridge, S.; Brown, P.H.; Hecht, V.; Driessen, R.G.; Weller, J.L. The role of BoFLC2 in cauliflower (Brassica oleracea var. botrytis L.) reproductive development. J. Exp. Bot. 2015, 66, 125–135. [Google Scholar] [CrossRef] [PubMed] [Green Version]
  56. Chen, T.; Chen, X.; Zhang, S.; Zhu, J.; Tang, B.; Wang, A.; Dong, L.; Zhang, Z.; Yu, C.; Sun, Y.; et al. The genome sequence archive family: Toward explosive data growth and diverse data types. Genom. Proteom. Bioinform. 2021, 19, 578–583. [Google Scholar] [CrossRef]
  57. CNCB-NGDC Members and Partners. Database resources of the National Genomics Data Center, China National Center for Bioinformation in 2022. Nucleic Acids Res. 2022, 50, 27–38. [Google Scholar] [CrossRef] [PubMed]
Figure 1. Phylogenetic analysis of 40 PCO proteins from B. napus (20), B. rapa (7), B. oleracea (8) and Arabidopsis (5). The green circle represents the protein from B. napus. The blue square represents the protein from B. rapa. The yellow triangle represents the protein from B. oleracea. The red star represents the protein from Arabidopsis.
Ijms 24 11242 g001
Figure 2. Syntenic relationship of PCO genes in B.napus and three ancestral plant species. (a) Syntenic relationship of PCO genes in Arabidopsis, B. rapa and B. oleracea. (b) Syntenic relationship of PCO genes in B. napus, B. rapa and B. oleracea. Grey lines in the background show the collinear blocks within rapeseed and other plant genomes, while the red lines highlight the syntenic PCO gene pairs.
Ijms 24 11242 g002
Figure 3. Phylogenetic tree (a), gene motif (b) and gene structure (c) of PCO of Arabidopsis, B. napus, B. rapa and B. oleracea. (a) Neighbor-joining phylogenetic tree showing the relationship among 5 Arabidopsis, 20 B. napus, 7 B. rapa and 8 B. oleracea PCO proteins. (b) Eight motifs in PCO proteins were identified by MEME tools. (c) Green box indicates the exon regions on PCO genes.
Ijms 24 11242 g003
Figure 4. Anaerobic-induction cis-elements distributed on the BnaPCOs promoter regions. Cis-elements were identified by PlantCARE.
Ijms 24 11242 g004
Figure 5. Expression of AtPCO, BraPCO, BoPCO and BnaPCO (TPM values, Transcripts Per Kilobase Million, public expression data [35,36,37]) in different tissues. The expression levels of PCO genes are indicated by differently colored rectangles. DAF represents day after flower.
Ijms 24 11242 g005
Figure 6. Expression pattern of AtPCOs in different tissues by qRT-PCR assays. AtPCO1 ((a), purple), AtPCO2 ((b), yellow), AtPCO3 ((c), green), AtPCO4 ((d), orange) and AtPCO5 ((e), blue) are represented in different colors. The mRNA levels were normalized to AtActin2. Bars indicate ± SD (n = 3).
Ijms 24 11242 g006
Figure 7. Expression pattern of BnaPCOs in different tissues by qRT-PCR assays. BnaPCO1 ((ad), purple), BnaPCO2 ((e,f), yellow), BnaPCO3 ((gl), green), BnaPCO4 ((mp), orange) and BnaPCO5 ((qt), blue) are represented in different colors. The mRNA levels were normalized to BnaActin7. Bars indicate ± SD (n = 3).
Ijms 24 11242 g007
Figure 8. Expression of BnaPCO genes under different abiotic stress treatments. The expression levels (TPM values, Transcripts Per Kilobase Million, public expression data [37]) of BnaPCO genes are indicated by differently colored rectangles. (a) Gene expression represents the expression in leaves. (b) Gene expression represents the expression in roots.
Ijms 24 11242 g008
Figure 9. Expression of BnaPCO genes (FPKM, RNA-seq data) under waterlogging stress treatment for 6 h and 12 h. The expression levels of BnaPCO genes are indicated by differently colored rectangles. CK represents normal conditions. W represents waterlogging stress treatment.
Ijms 24 11242 g009
Figure 10. BnaPCO gene expression after waterlogging stress treatment for 6 h and 12 h by qRT-PCR assays. Genes with purple, yellow, green, orange and blue background represent BnaPCO1 ((ad)), BnaPCO2 (e,f), BnaPCO3 ((gl)), BnaPCO4 ((mp)) and BnaPCO5 ((qt)) genes, respectively. CK represents normal conditions. W represents waterlogging stress treatment. The mRNA level (relative to BnaActin7) of each gene in CK-Root or CK-Leaf was set to 1. Bars indicate ± SD (n = 3).
Ijms 24 11242 g010
Table 1. List of PCO genes identified in B. rape, B. oleracea and B. napus.
Gene IDNucleotide Length (bp)Amino AcidMolecular Weight (KD)PIGenome LocationNumber of IntronsNumber of Exons
PCO1BnaA03G0061400ZS89729933.227.5ChrA03: 2,917,715–2,919,51845
BnaA10G0211400ZS92430834.188.01ChrA10: 22,378,464–22,380,48645
BnaC03G0070600ZS87929332.757.77ChrC03: 3,619,461–3,621,08945
BnaC09G0512300ZS77125728.665.91ChrC09: 61,478,635–61,483,75545
Bo3G01008087629232.627.523,923,348–3,924,99245
Bo9G16540091830633.968.7860,734,007–60,728,41945
BraA03G00666089729933.37.52,874,949–2,876,80345
BraA10G02433071723926.635.1416,636,583–16,634,71445
PCO2BnaA04G0111100ZS84628231.358.21ChrA04: 12,952,829–12,954,00645
BnaC04G0395100ZS85828631.758.21ChrC04: 52,079,647–52,080,83045
Bo4G13919085828631.758.2146,652,407–46,653,59045
BraA04G01309084628231.348.029,741,294–9,742,75245
PCO3BnaA06G0127100ZS83127730.615ChrA06: 7,448,257–7,449,54645
BnaC04G0074400ZS246828.654.39ChrC04: 6,512,883–6,514,19123
BnaC05G0155300ZS83127730.625.01ChrC05: 9,956,060–9,957,35145
BnaC05G0283800ZS31810611.584.17ChrC05: 24,420,297–24,421,16312
BnaC05G0471900ZS38712914.38.6ChrC05: 52,043,598–52,044,33212
BnaC09G0521600ZS38712914.238.37ChrC09: 62,173,896–62,174,63012
Bo5G02550083427830.675.019,490,230–9,491,52145
BraA06G01425083127730.554.897,467,637–7,469,10845
PCO4BnaA03G0207500ZS62420823.516.5ChrA03: 10,842,878–10,844,15134
BnaA05G0034400ZS72924327.116.03ChrA05: 1,925,460–1,927,17345
BnaC03G0244400ZS63621223.548.04ChrC03: 14,957,859–14,959,21045
BnaC04G0037200ZS71723926.816.42ChrC04: 3,448,037–3,452,96745
Bo3G03618063621223.538.0415,839,677–15,841,02845
Bo4G01739071723926.756.233,496,211–3,497,88445
BraA05G00322071723926.726.421,719,860–1,722,37745
PCO5BnaA04G0023400ZS72924327.236.84ChrA04: 1,525,382–1,527,22245
BnaA09G0537000ZS72924327.136.59ChrA09: 56,193,470–56,194,84145
BnaC04G0289700ZS72924327.226.78ChrC04: 39,729,996–39,732,40445
BnaC08G0384200ZS72924327.26.5ChrC08: 44,790,558–44,792,02945
Bo4G10828072924327.226.7834,730,028–34,731,72945
Bo8G09280072924327.26.541,444,747–41,446,18445
BraA04G00289072924327.226.991,612,409–1,614,77545
BraA09G05077072924327.126.5936,671,235–36,668,98545
Disclaimer/Publisher’s Note: The statements, opinions and data contained in all publications are solely those of the individual author(s) and contributor(s) and not of MDPI and/or the editor(s). MDPI and/or the editor(s) disclaim responsibility for any injury to people or property resulting from any ideas, methods, instructions or products referred to in the content.

