
A Pectate Lyase Gene Plays a Critical Role in Xylem Vascular Development in Arabidopsis
 , , and
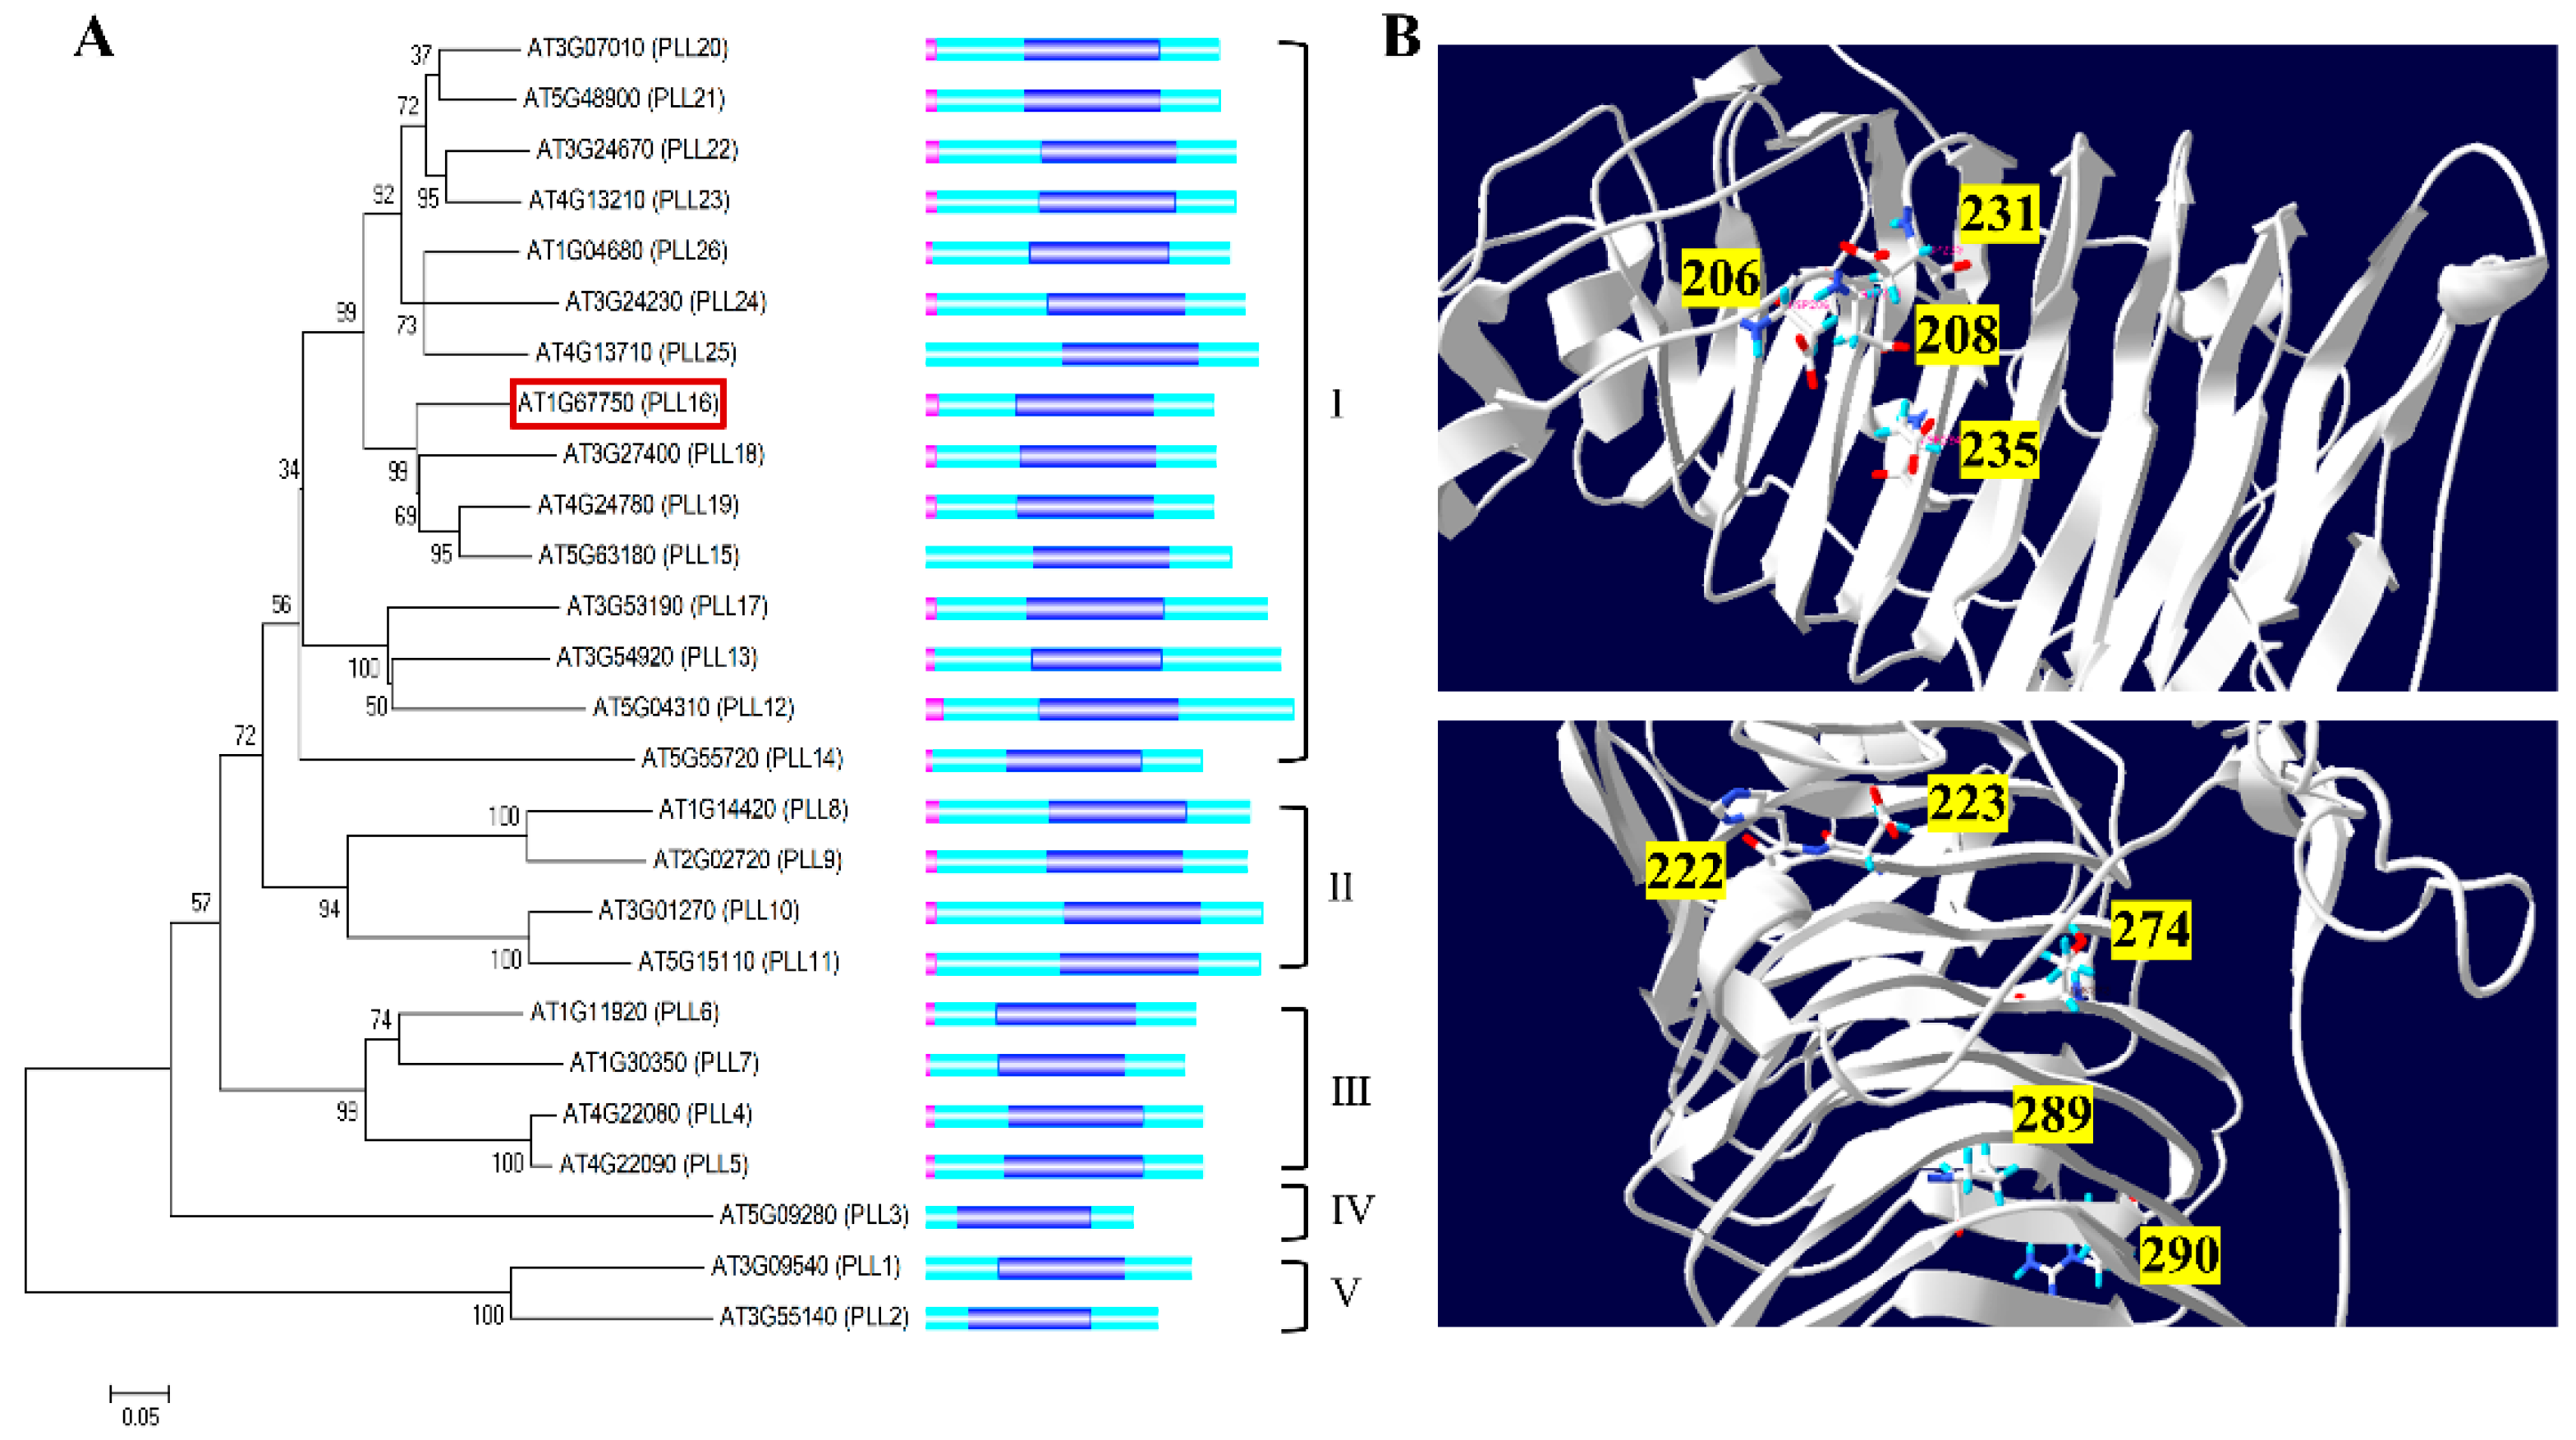
Abstract
:1. Introduction
2. Results
2.1. Bioinformatics Analysis of the PLL Family Genes in Arabidopsis
2.2. In Silico Analysis for Selection of Xylem-Specific AtPLL Genes
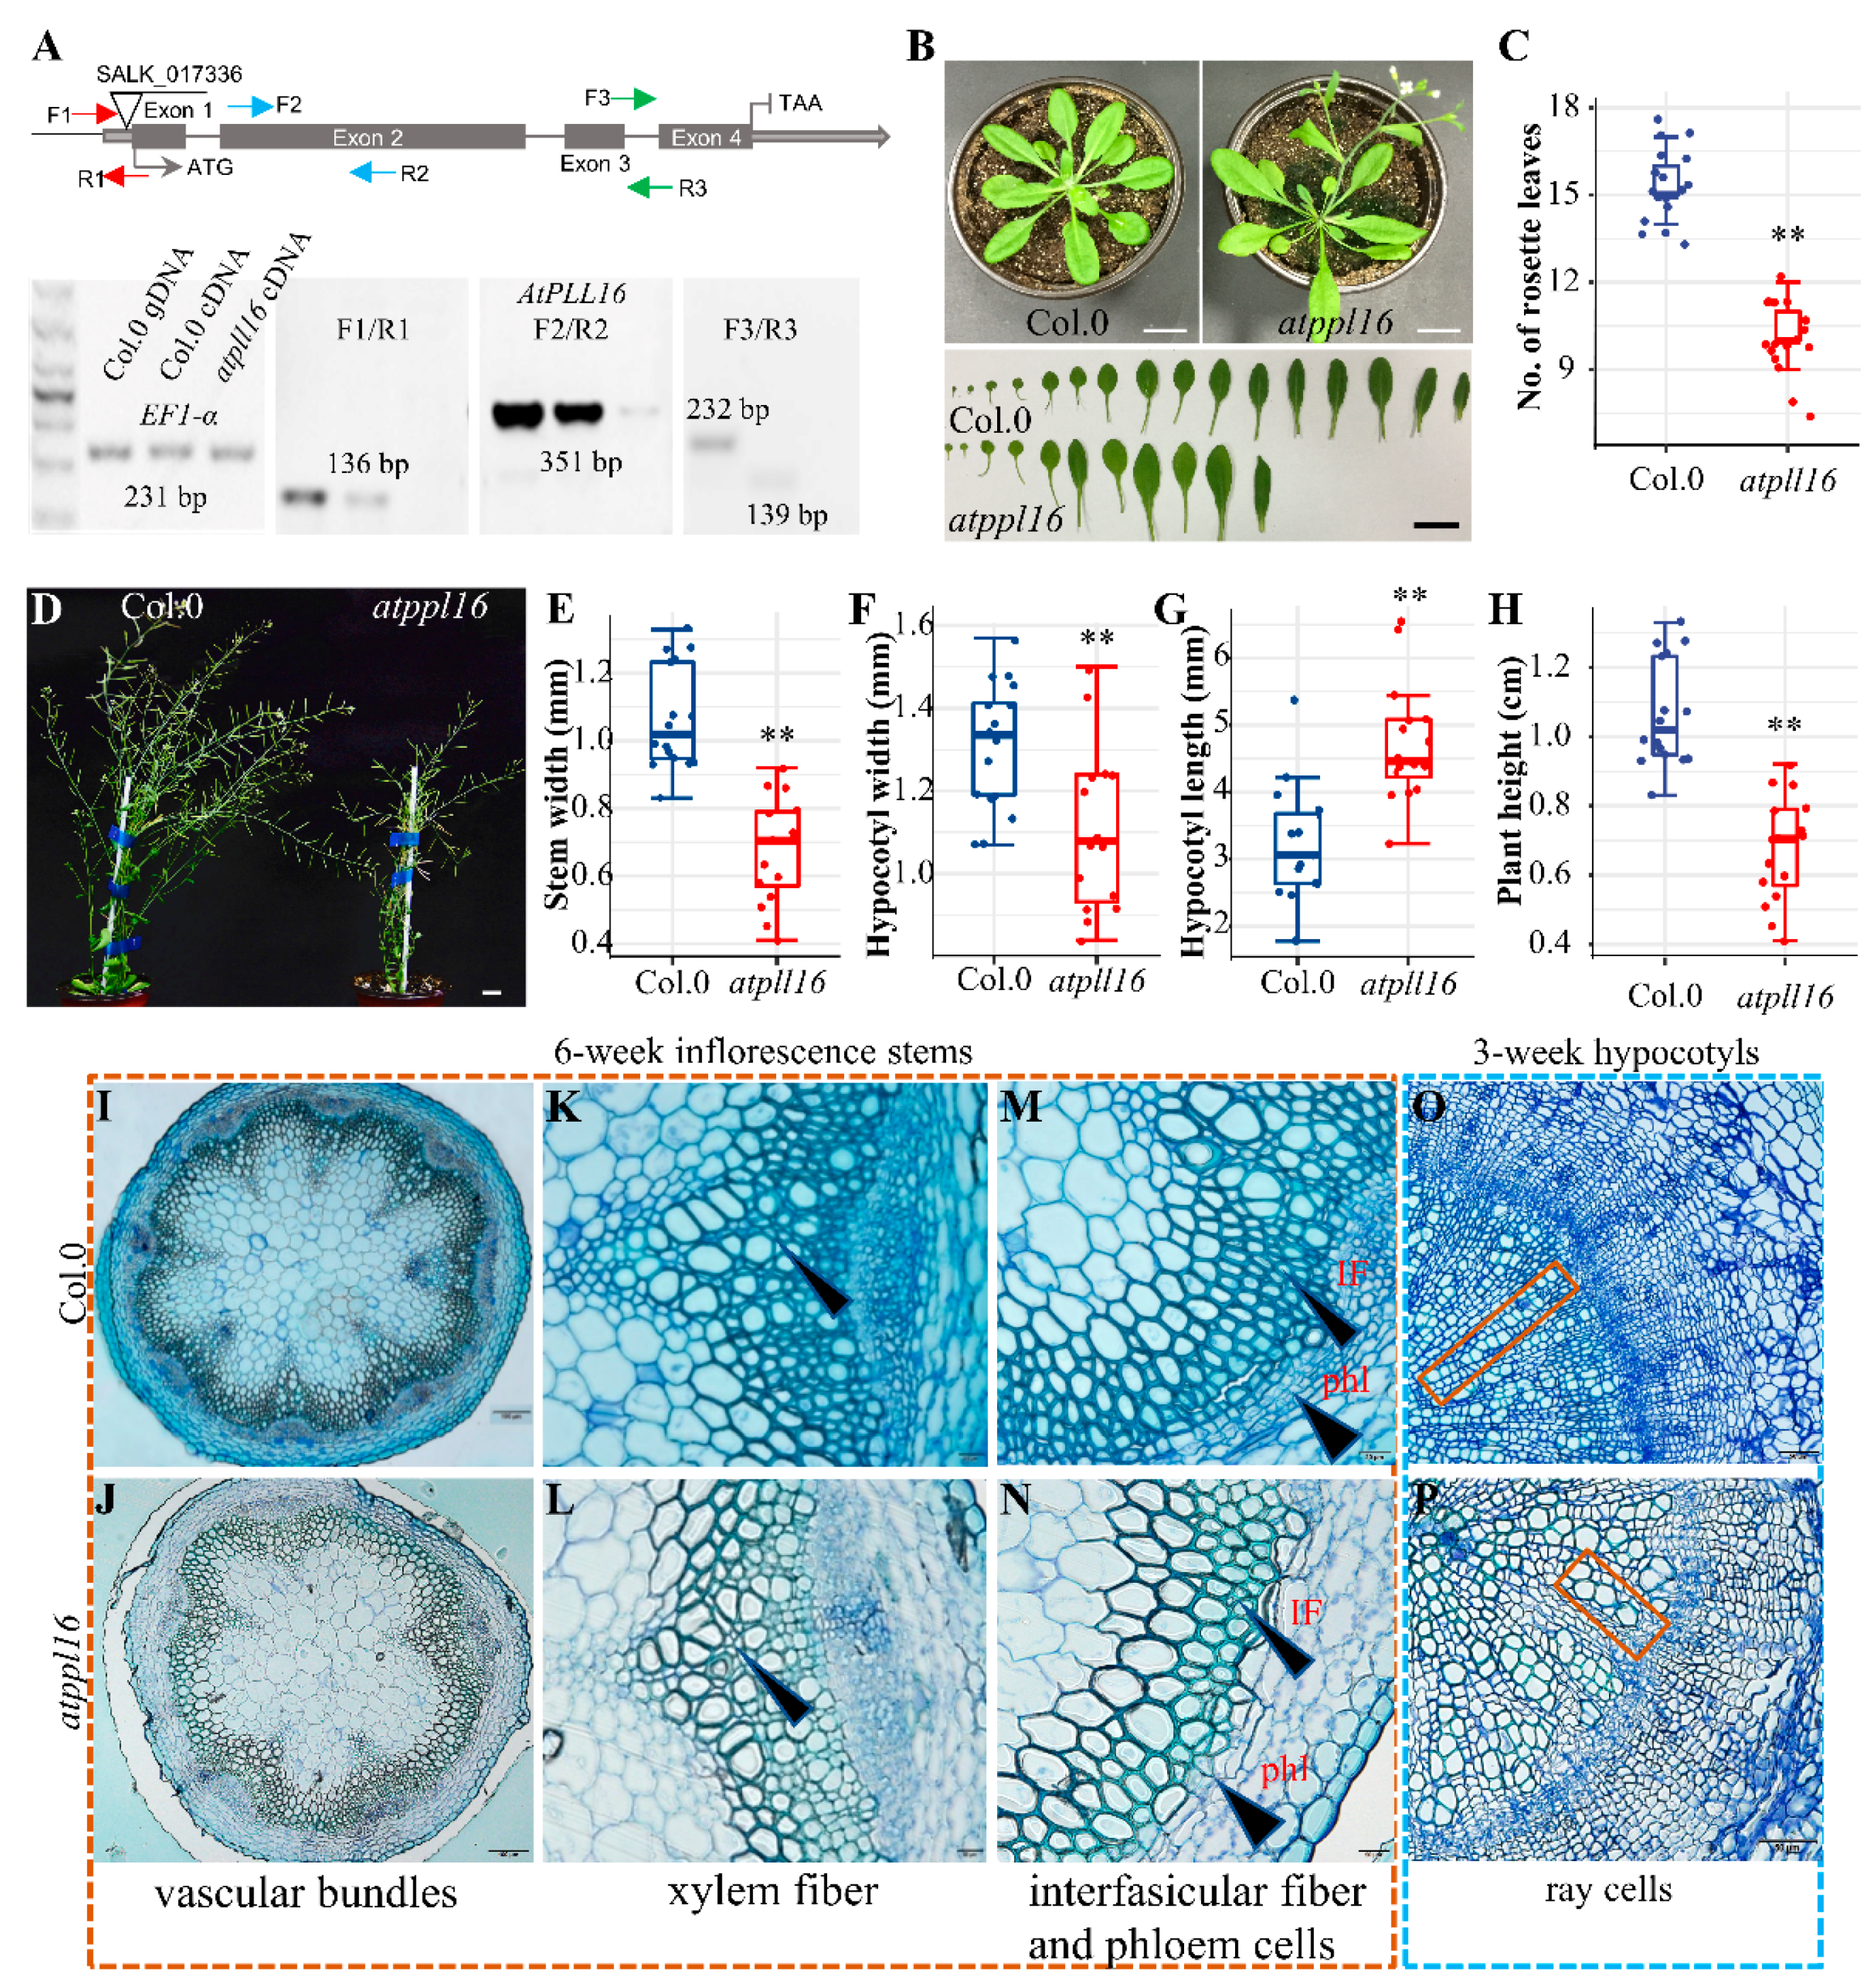
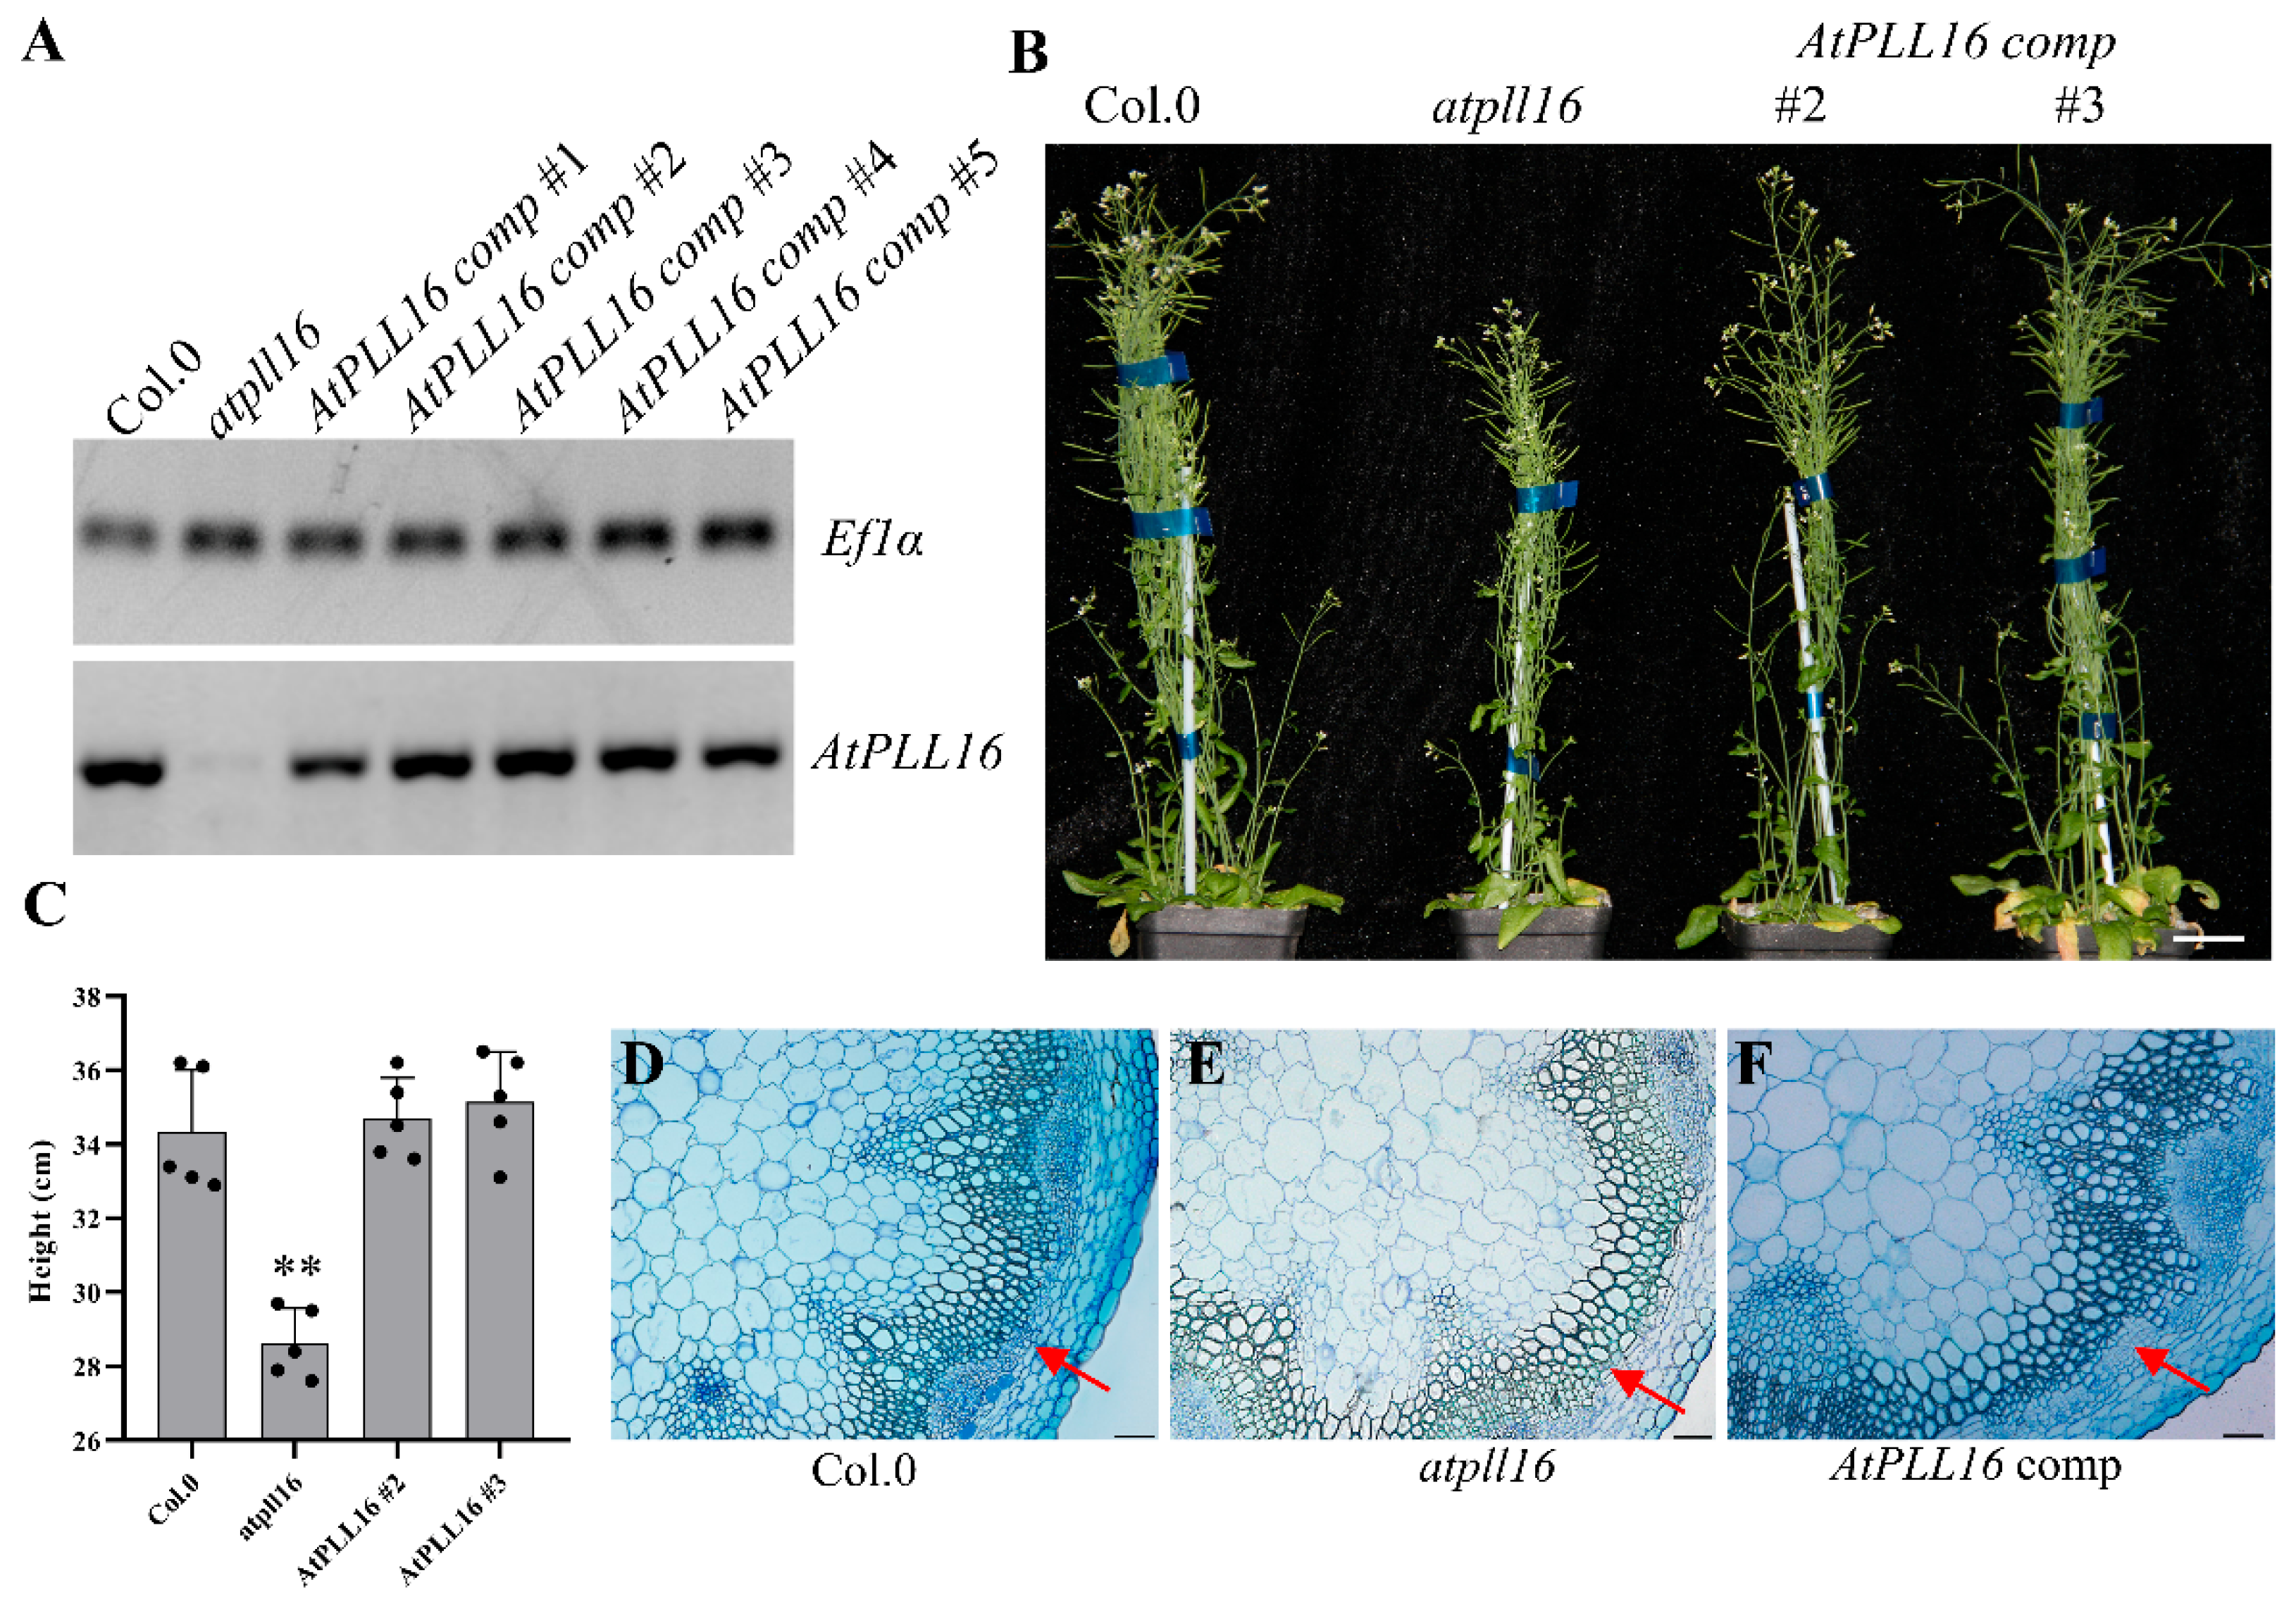
2.3. Knock-Out of Xylem-Specific AtPLLs Results in a Thinner Hypocotyl and a Drastic Loss of Trachery Elements, Xylem, and Interfascicular Fiber Cells
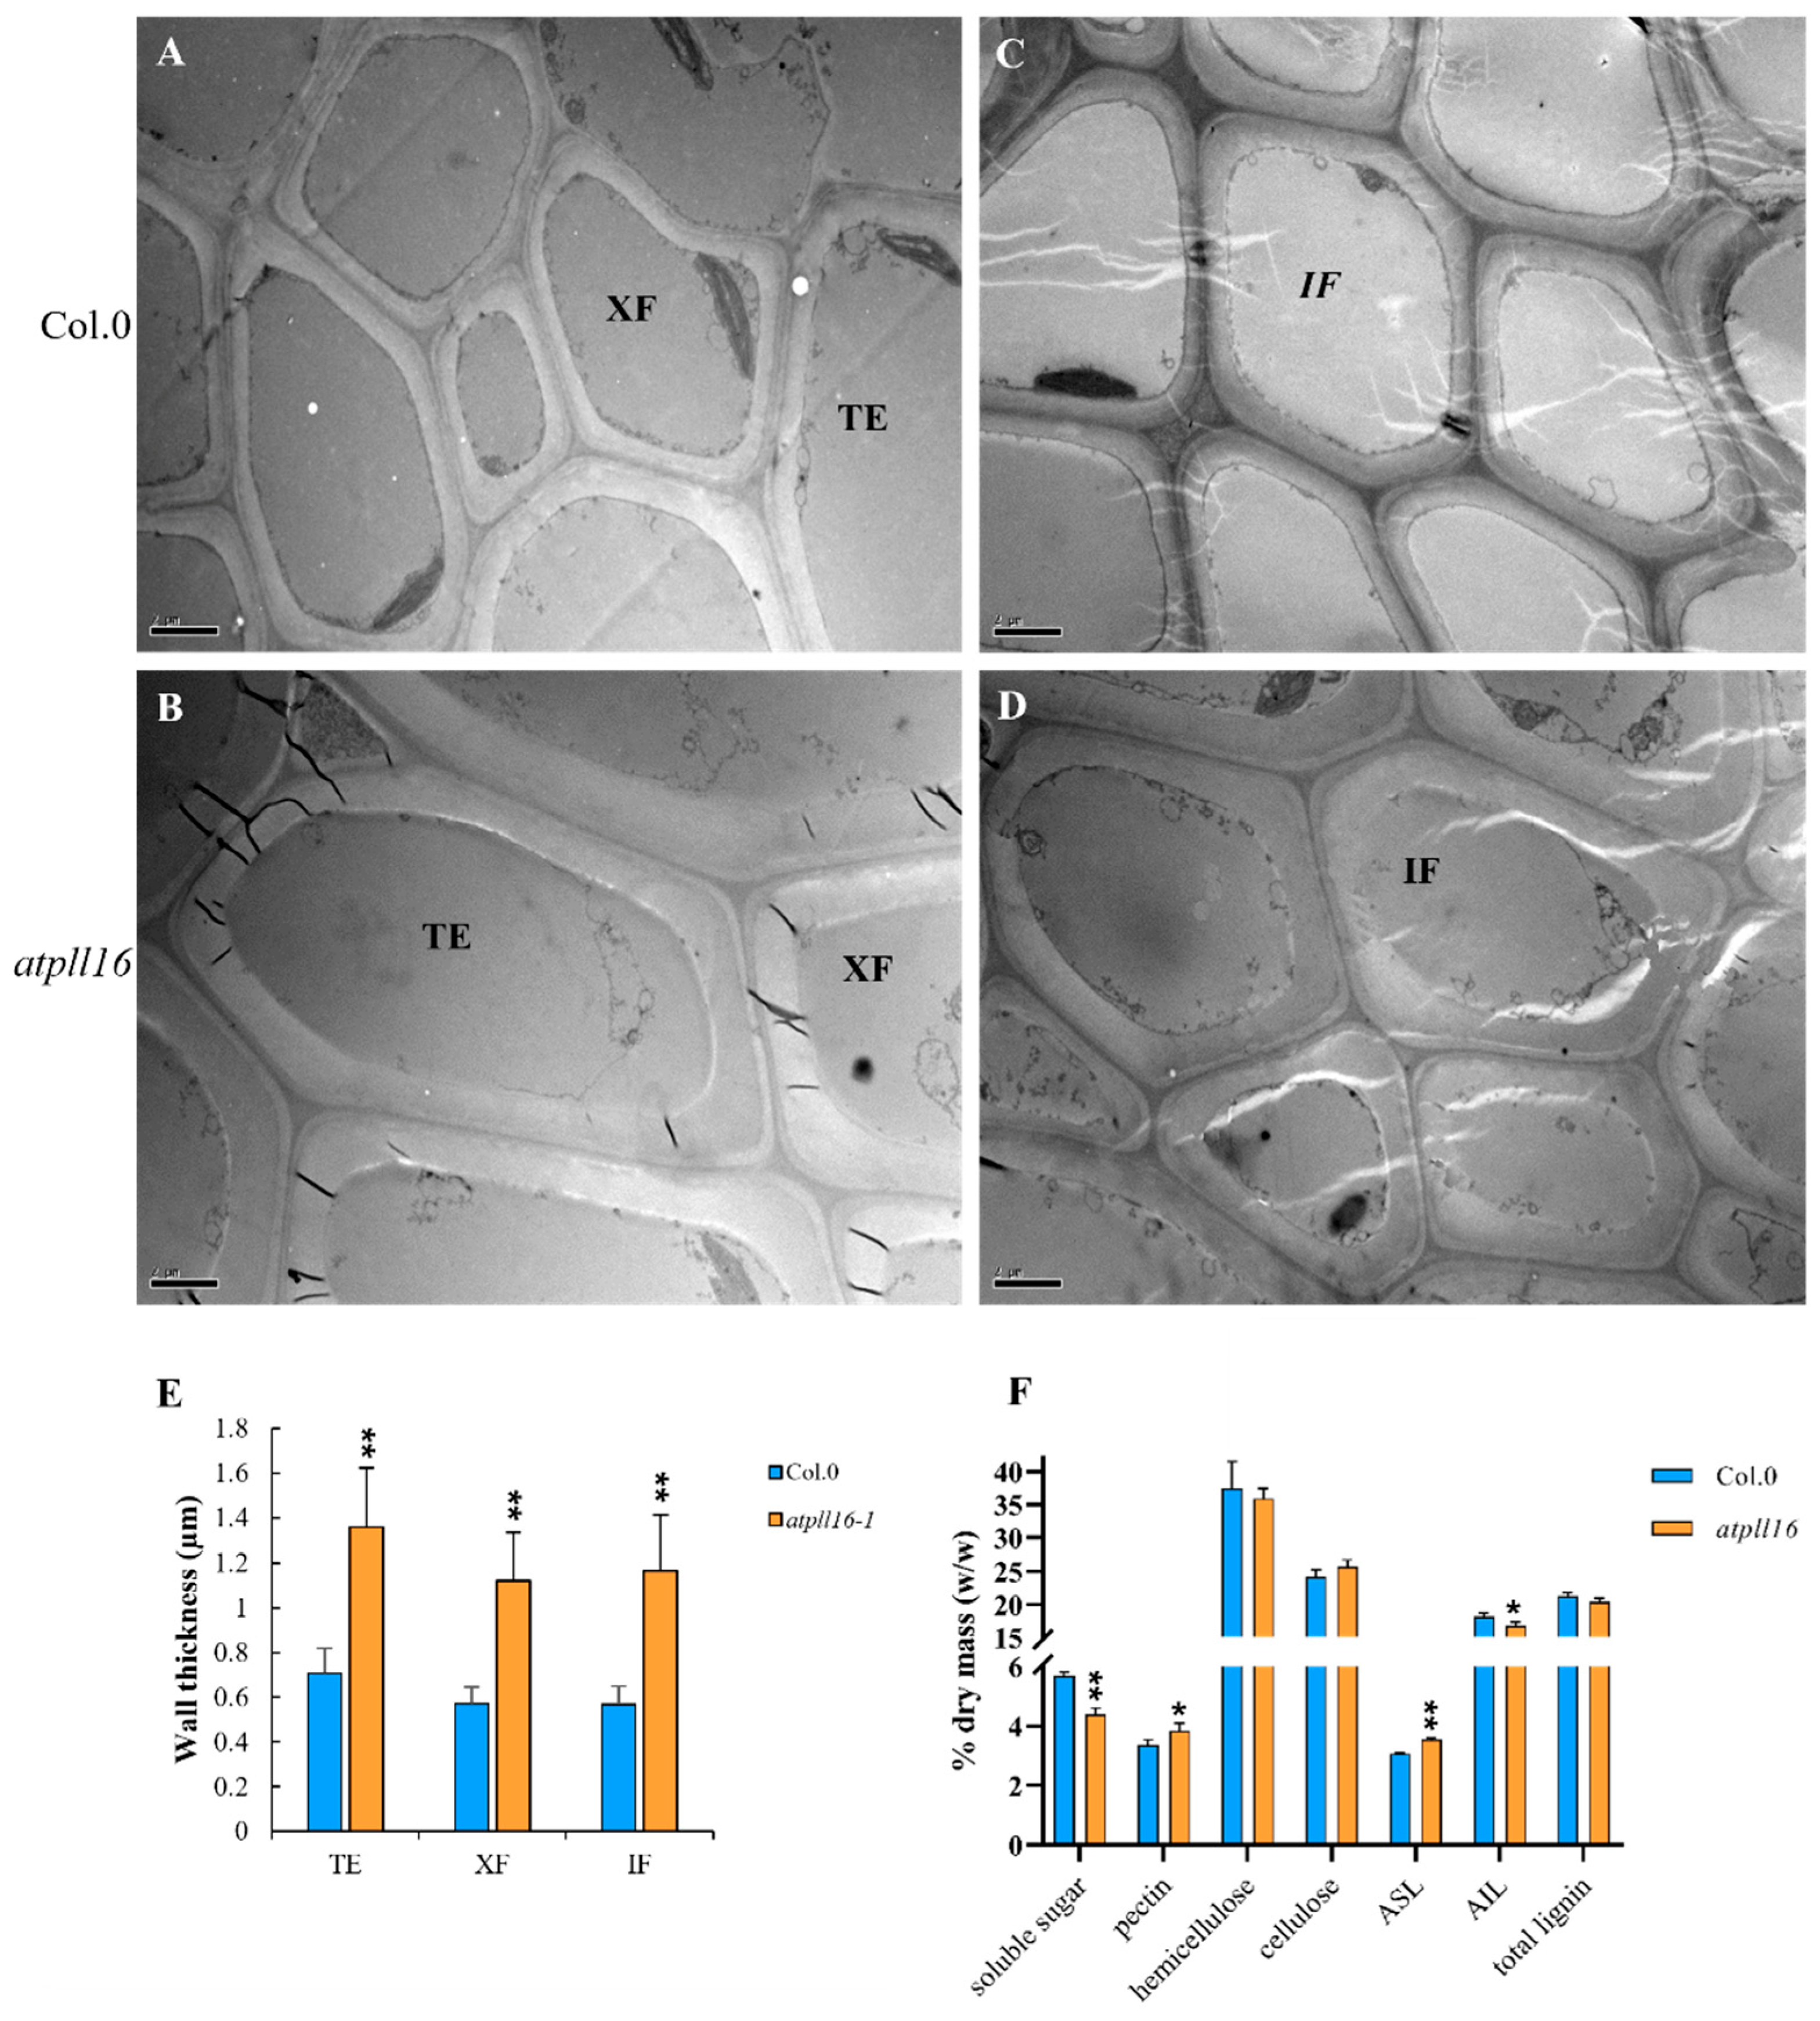
2.4. The atpll16 Mutant Had More Pectin and a Thicker Secondary Cell Wall
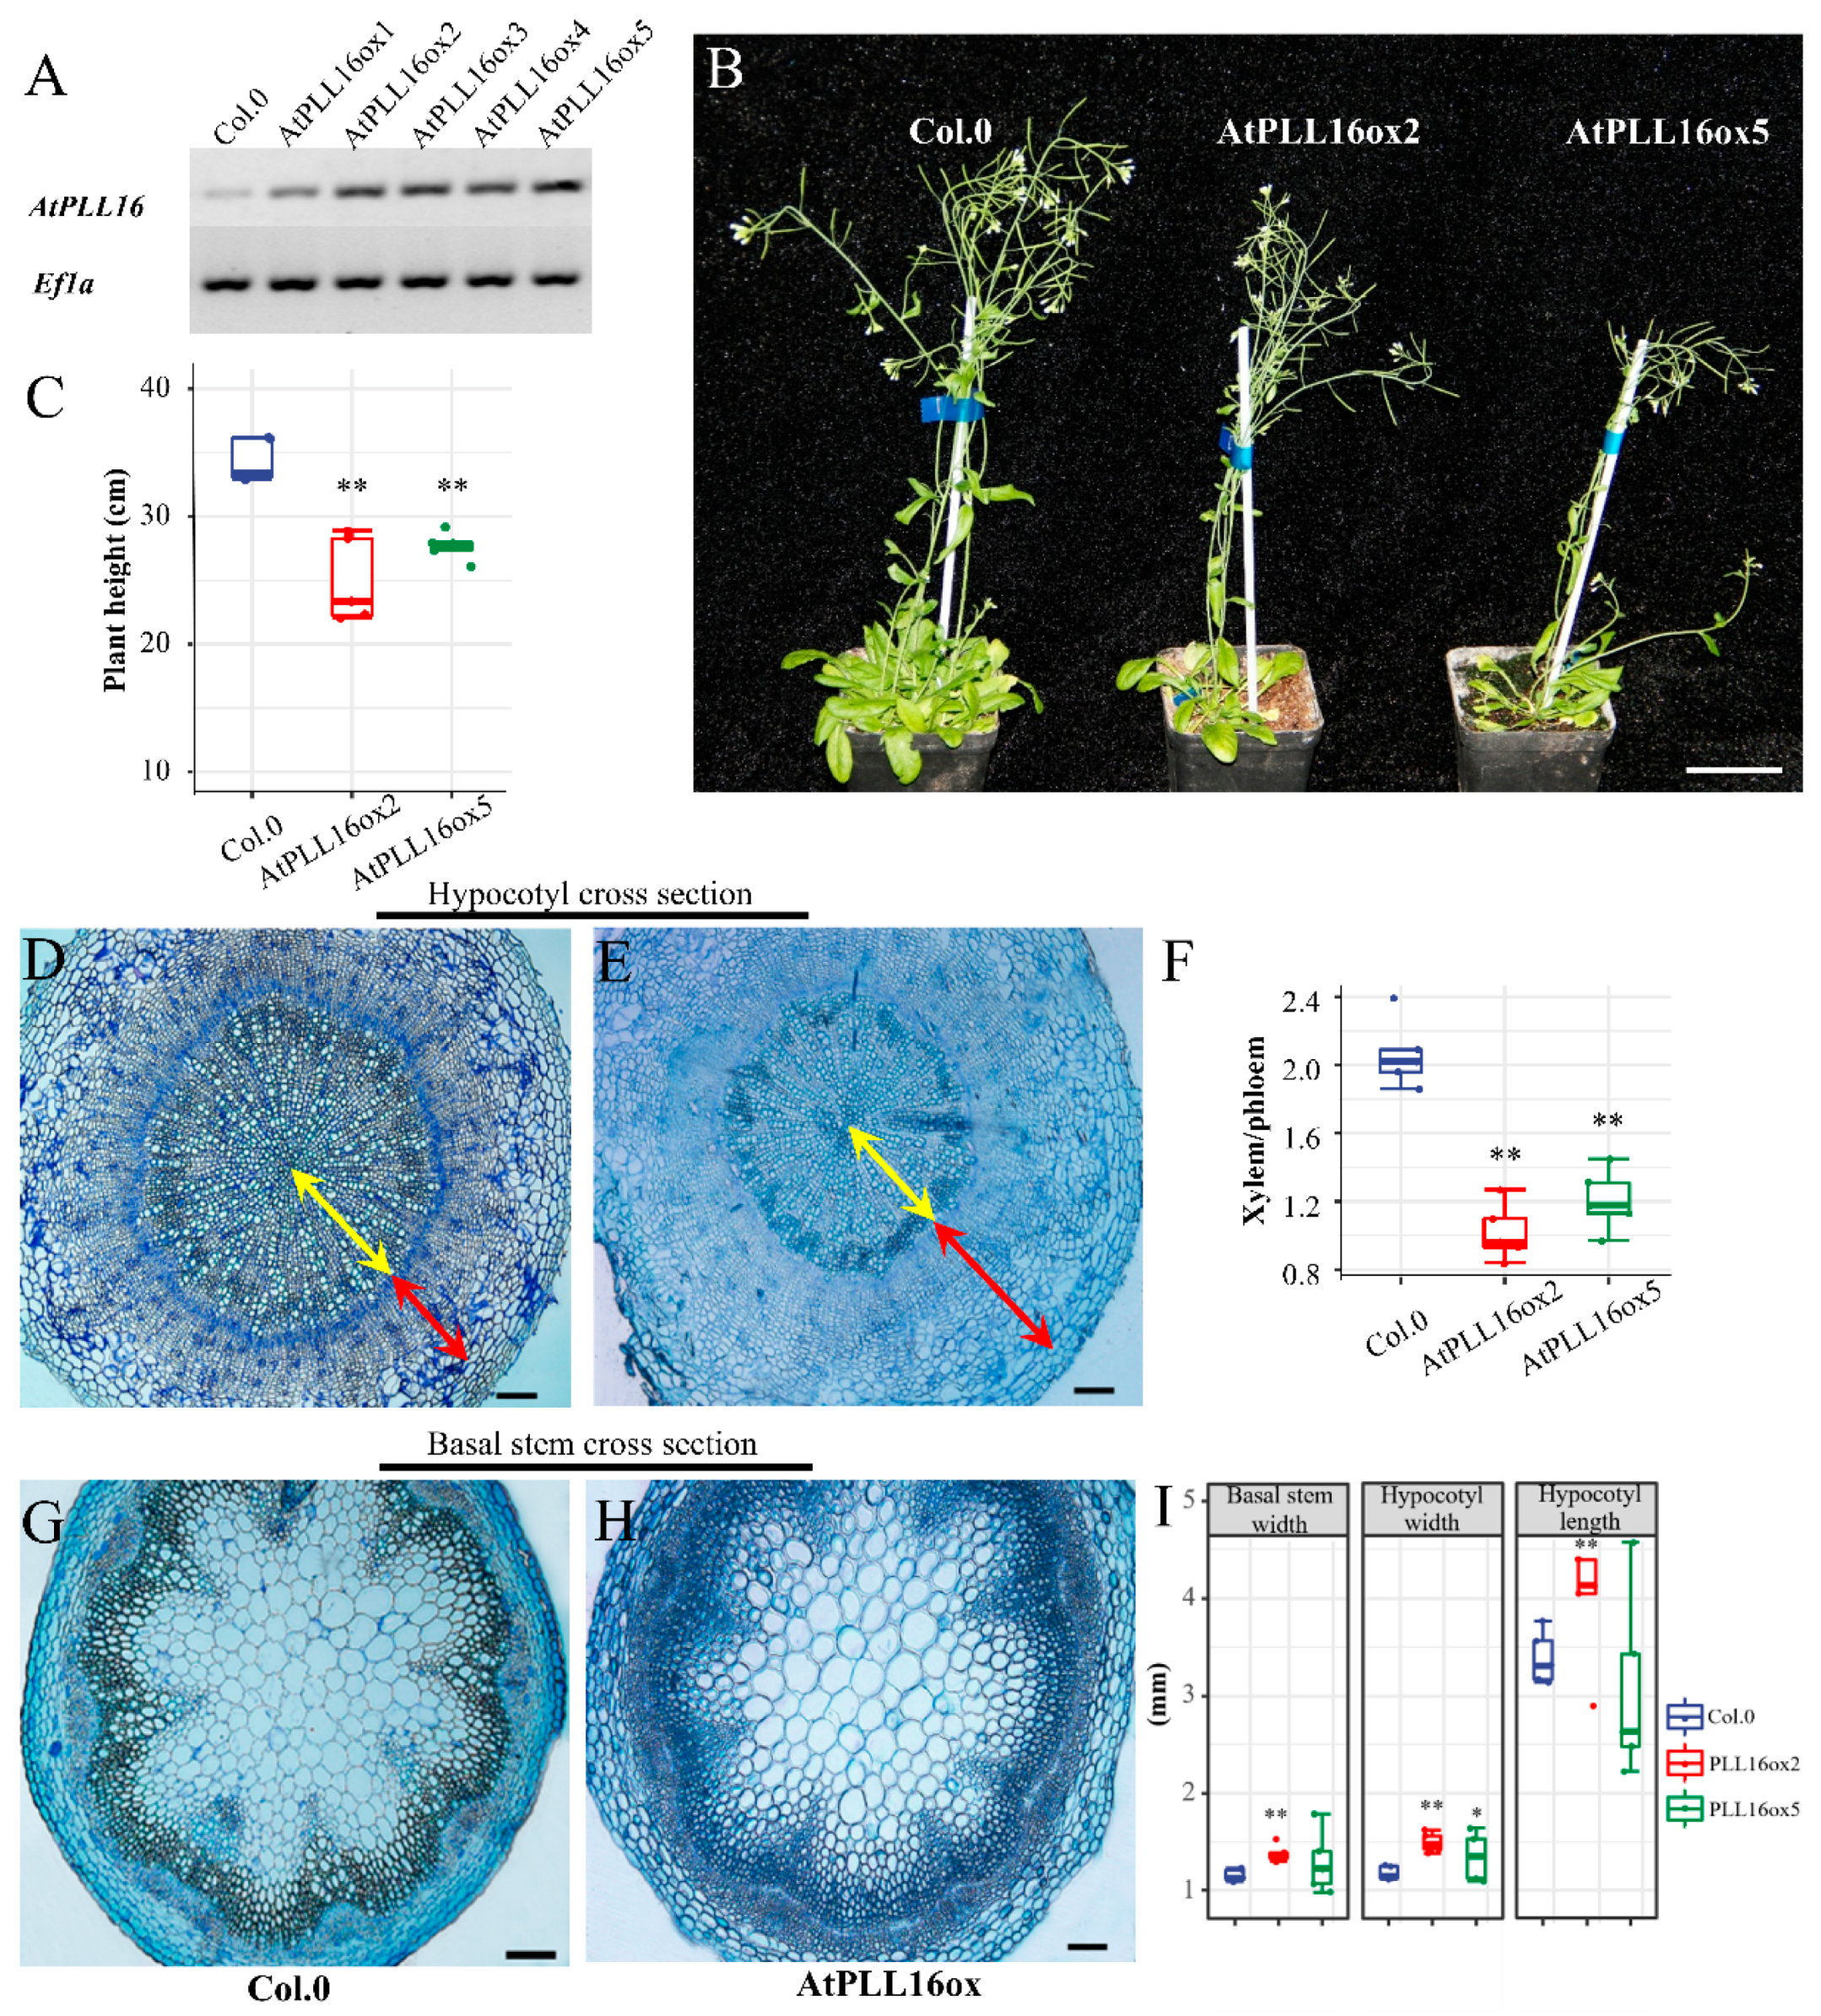
2.5. AtPLL16 Overexpression Led to an Imbalance in Phloem Expansion at the Expense of Xylem Reduction
3. Discussion
4. Materials and Methods
4.1. Source Material and Growth Conditions
4.2. Bioinformatics Analysis of Arabidopsis PLL Genes
4.3. Molecular Cloning Procedures
4.4. Sectioning of Arabidopsis Hypocotyl or Inflorescence Stem for Observation of Vascular Development
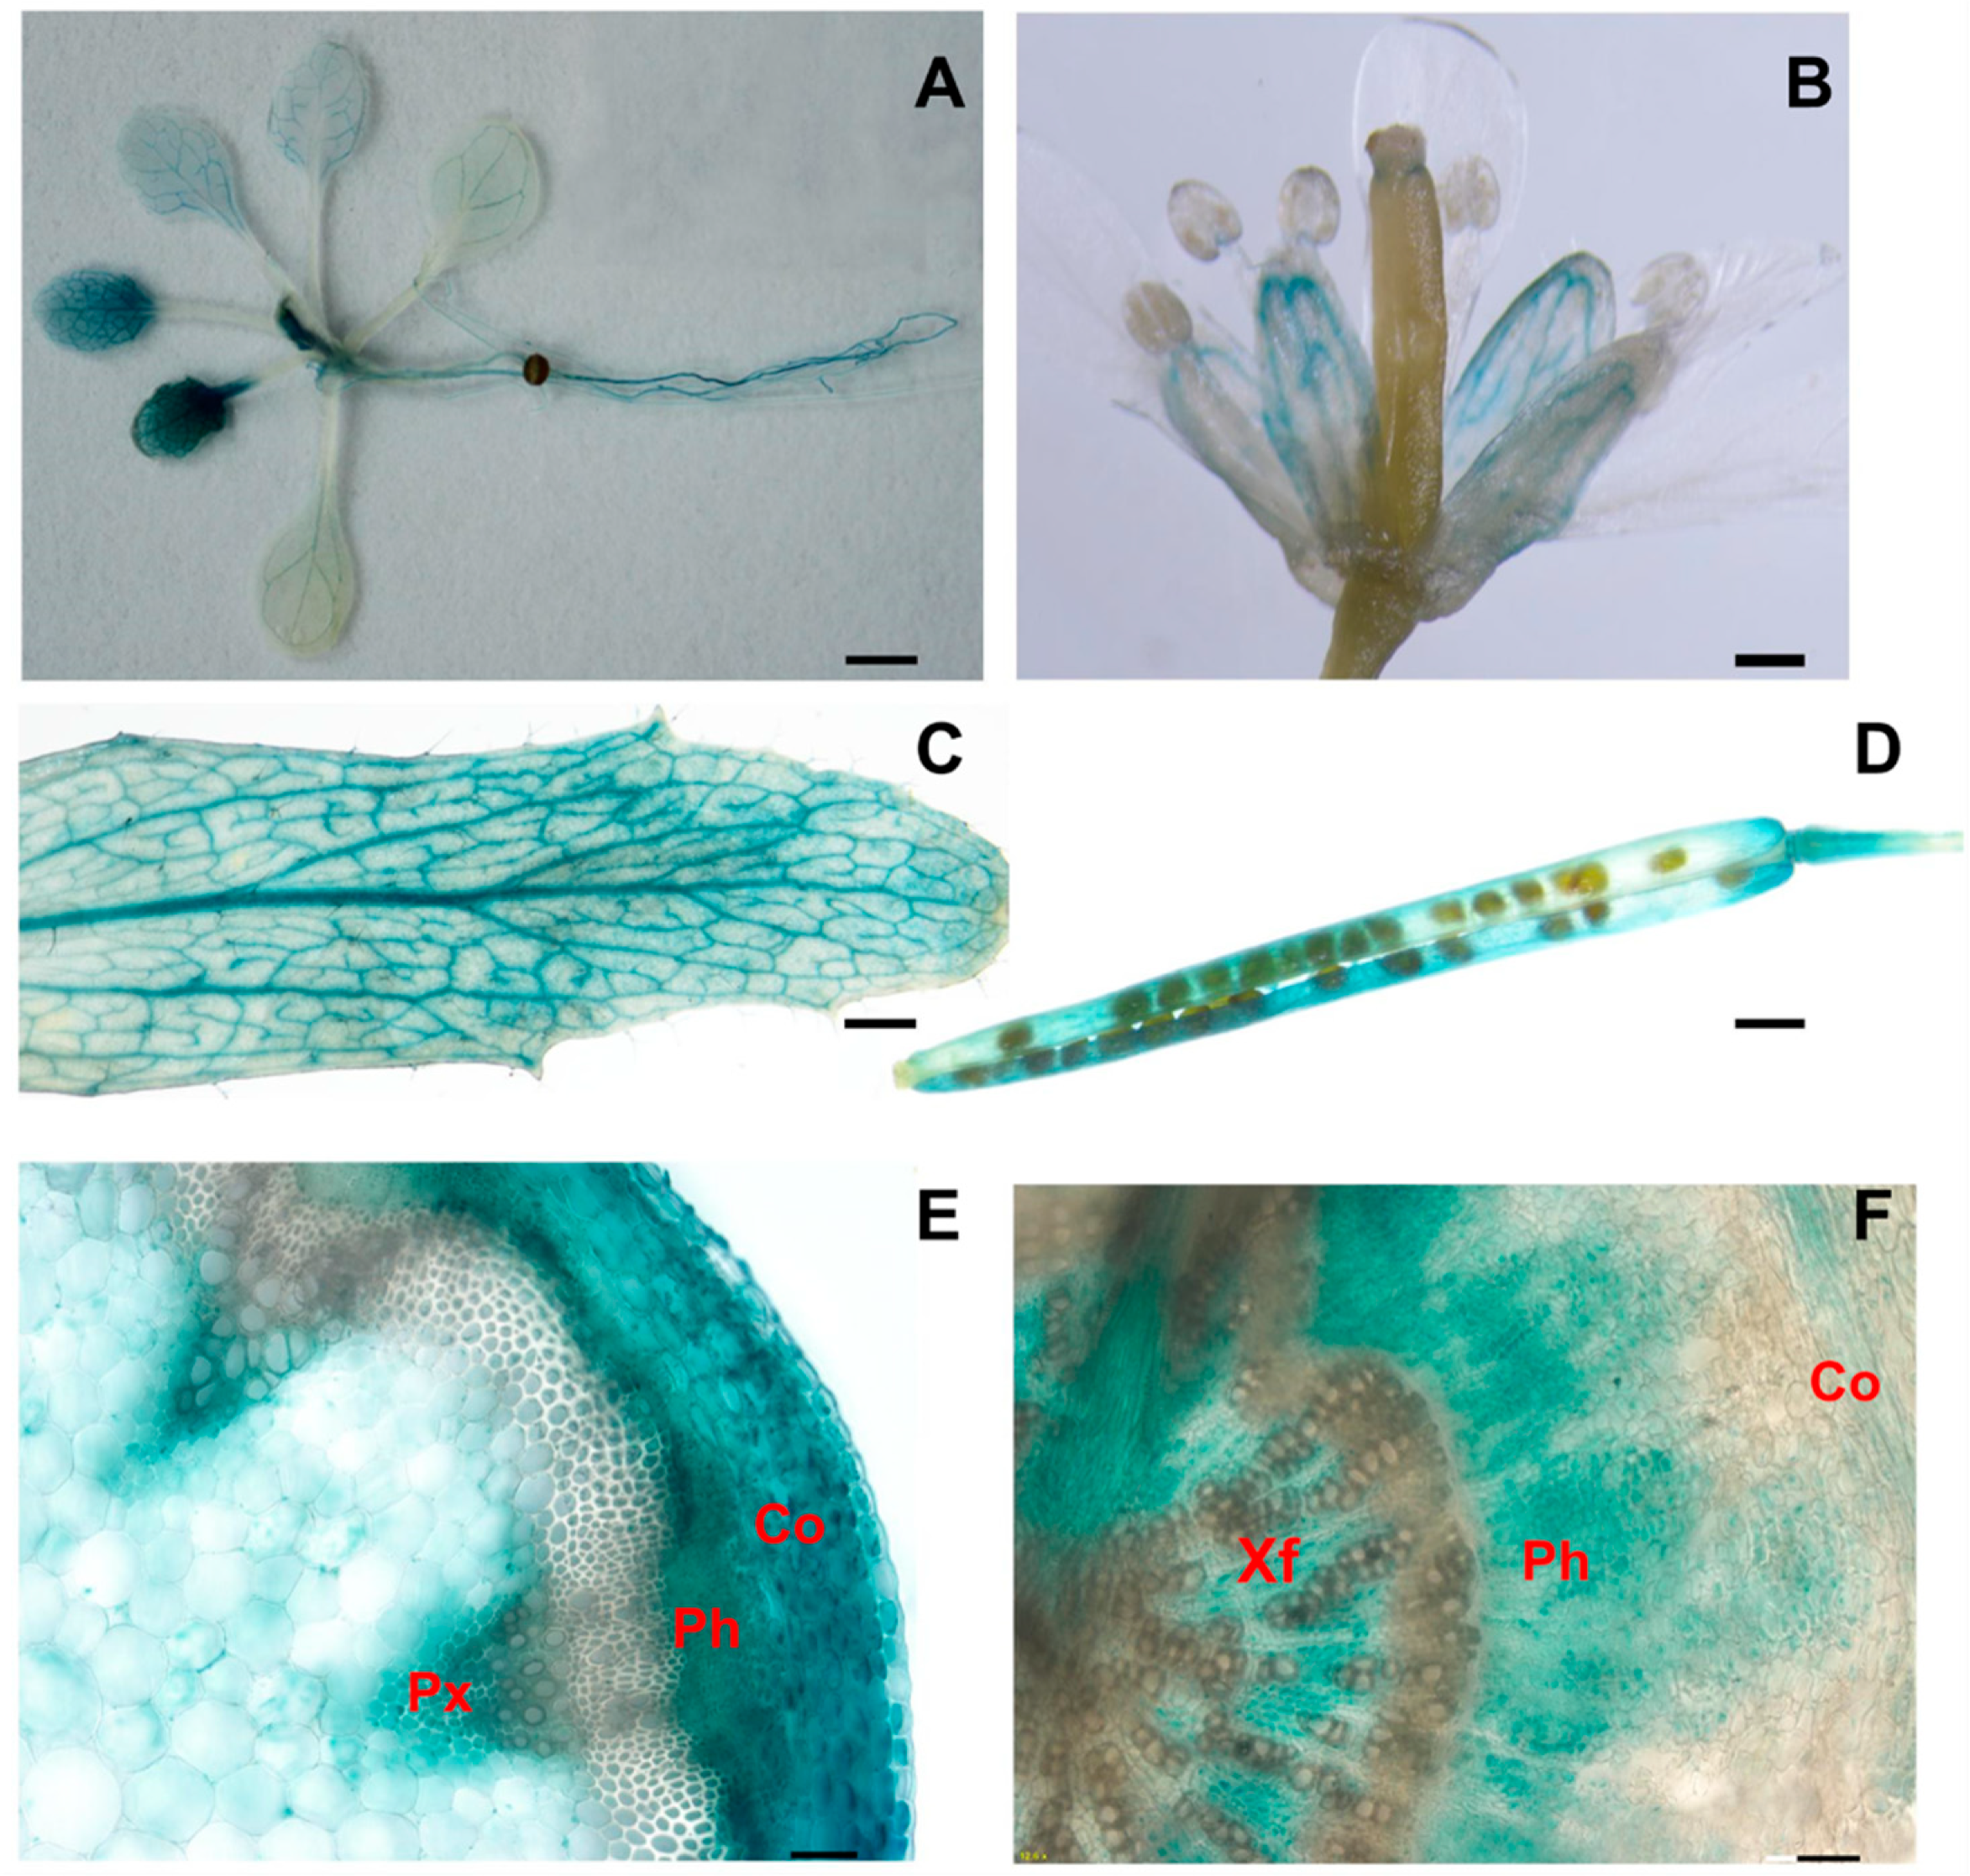
4.5. Promoter-GUS Activity Assay
4.6. RNA Extraction and qRT PCR
4.7. Quantification of Wall Polymer Contents by Step-Wise Extraction
4.8. Statistical Analysis
Supplementary Materials
Author Contributions
Funding
Institutional Review Board Statement
Informed Consent Statement
Data Availability Statement
Acknowledgments
Conflicts of Interest
References
- Mellerowicz, E.J.; Sundberg, B. Wood cell walls: Biosynthesis, developmental dynamics and their implications for wood properties. Curr. Opin. Plant Biol. 2008, 11, 293–300. [Google Scholar] [CrossRef] [PubMed]
- Hofte, H.; Voxeur, A. Plant cell walls. Curr. Biol. 2017, 27, R865–R870. [Google Scholar] [CrossRef] [PubMed] [Green Version]
- Vogel, J. Unique aspects of the grass cell wall. Curr. Opin. Plant Biol. 2008, 11, 301–307. [Google Scholar] [CrossRef] [PubMed]
- Mohnen, D. Pectin structure and biosynthesis. Curr. Opin. Plant Biol. 2008, 11, 266–277. [Google Scholar] [CrossRef] [PubMed]
- Moore, G.R.; Raine, C.S. Immunogold localization and analysis of IgG during immune-mediated demyelination. Lab. Investig. 1998, 59, 641–648. [Google Scholar] [CrossRef]
- Moore, P.J.; Swords, K.M. Spatial organization of the assembly pathways of glycoproteins and complex polysaccharides in the Golgi apparatus of plants. J. Cell Biol. 1991, 112, 589–602. [Google Scholar] [CrossRef]
- Harholt, J.; Suttangkakul, A. Biosynthesis of pectin. Plant Physiol. 2010, 153, 384–395. [Google Scholar] [CrossRef] [Green Version]
- Marin-Rodriguez, M.C.; Orchard, J. Pectate lyases, cell wall degradation and fruit softening. J. Exp. Bot. 2002, 53, 2115–2119. [Google Scholar] [CrossRef]
- Yadav, S.; Yadav, P.K. Pectin lyase: A review. Process Biochem. 2009, 44, 1–10. [Google Scholar] [CrossRef]
- Wolf, S.; Mouille, G. Homogalacturonan methyl-esterification and plant development. Mol. Plant 2009, 2, 851–860. [Google Scholar] [CrossRef]
- Hongo, S.; Sato, K. Demethylesterification of the primary wall by PECTIN METHYLESTERASE35 provides mechanical support to the Arabidopsis stem. Plant Cell 2012, 24, 2624–2634. [Google Scholar] [CrossRef] [Green Version]
- Nishikubo, N.; Takahashi, J. Xyloglucan endo-transglycosylase-mediated xyloglucan rearrangements in developing wood of hybrid aspen. Plant Physiol. 2011, 155, 399–413. [Google Scholar] [CrossRef] [Green Version]
- Goulao, L.F.; Vieira-Silva, S. Association of hemicellulose- and pectin-modifying gene expression with Eucalyptus globulus secondary growth. Plant Physiol. Bioch. 2011, 49, 873–881. [Google Scholar] [CrossRef]
- Sexton, T.R.; Henry, R.J. Pectin Methylesterase genes influence solid wood properties of Eucalyptus pilularis. Plant Physiol. 2012, 158, 531–541. [Google Scholar] [CrossRef] [Green Version]
- Siedlecka, A.; Wiklund, S. Pectin methyl esterase inhibits intrusive and symplastic cell growth in developing wood cells of Populus. Plant Physiol. 2008, 146, 554–565. [Google Scholar] [CrossRef] [Green Version]
- Koizumi, K.; Yokoyama, R. Mechanical load induces upregulation of transcripts for a set of genes implicated in secondary wall formation in the supporting tissue of Arabidopsis thaliana. J. Plant Res. 2009, 122, 651–659. [Google Scholar] [CrossRef]
- Mellerowicz, E.J.; Gorshkova, T.A. Tensional stress generation in gelatinous fibres: A review and possible mechanism based on cell-wall structure and composition. J. Exp. Bot. 2012, 63, 551–565. [Google Scholar] [CrossRef] [Green Version]
- Wang, J.; Kucukoglu, M. The Arabidopsis LRR-RLK, PXC1, is a regulator of secondary wall formation correlated with the TDIF-PXY/TDR-WOX4 signaling pathway. BMC Plant Biol. 2013, 13, 94. [Google Scholar] [CrossRef] [Green Version]
- Biswal, A.K.; Soeno, K. Aspen pectate lyase PtxtPL1-27 mobilizes matrix polysaccharides from woody tissues and improves saccharification yield. Biotechnol. Biofuels 2014, 7, 11. [Google Scholar] [CrossRef] [Green Version]
- Geisler-Lee, J.; Geisler, M. Poplar carbohydrate-active enzymes. Gene identification and expression analyses. Plant Physiol. 2006, 140, 946–962. [Google Scholar] [CrossRef] [Green Version]
- Jiang, J.; Yao, L. Genome-wide characterization of the pectate Lyase-like (PLL) genes in Brassica rapa. Mol. Genet. Genom. 2013, 288, 601–614. [Google Scholar] [CrossRef] [PubMed]
- Palusa, S.G.; Golovkin, M. Organ-specific, developmental, hormonal and stress regulation of expression of putative pectate lyase genes in Arabidopsis. New Phytol. 2007, 174, 537–550. [Google Scholar] [CrossRef] [PubMed]
- Sun, L.; van Nocker, S. Analysis of promoter activity of members of the PECTATE LYASE-LIKE (PLL) gene family in cell separation in Arabidopsis. BMC Plant Biol. 2010, 10, 152. [Google Scholar] [CrossRef] [PubMed] [Green Version]
- Wing, R.A.; Yamaguchi, J. Molecular and genetic characterization of two pollen-expressed genes that have sequence similarity to pectate lyases of the plant pathogen Erwinia. Plant Mol. Biol. 1990, 14, 17–28. [Google Scholar] [CrossRef] [PubMed]
- Barras, F.; van Gijsegem, F. Extracellular enzymes and pathogenesis of soft-rot Erwinia. Annu. Rev. Phytopathol. 1994, 32, 201–234. [Google Scholar] [CrossRef]
- Fagard, M.; Dellagi, A. Arabidopsis thaliana expresses multiple lines of defense to counterattack Erwinia chrysanthemi. Mol. Plant-Microbe Interact. 2007, 20, 794–805. [Google Scholar] [CrossRef] [Green Version]
- Kulikauskas, R.; McCormick, S. Identification of the tobacco and Arabidopsis homologues of the pollen-expressed LAT59 gene of tomato. Plant Mol. Biol. 1997, 34, 809–814. [Google Scholar] [CrossRef]
- Wu, Y.; Qiu, X. PO149, a new member of pollen pectate lyase-like gene family from alfalfa. Plant Mol. Biol. 1996, 32, 1037–1042. [Google Scholar] [CrossRef]
- Domingo, C.; Roberts, K. A pectate lyase from Zinnia elegans is auxin inducible. Plant J. 1998, 13, 17–28. [Google Scholar] [CrossRef]
- Milioni, D.; Sado, P.E. Differential expression of cell-wall-related genes during the formation of tracheary elements in the Zinnia mesophyll cell system. Plant Mol. Biol. 2001, 47, 221–238. [Google Scholar] [CrossRef]
- Pilatzke-Wunderlich, I.; Nessler, C.L. Expression and activity of cell-wall-degrading enzymes in the latex of opium poppy, Papaver somniferum L. Plant Mol. Biol. 2001, 45, 567–576. [Google Scholar] [CrossRef]
- Wang, H.; Guo, Y. The essential role of GhPEL gene, encoding a pectate lyase, in cell wall loosening by depolymerization of the de-esterified pectin during fiber elongation in cotton. Plant Mol. Biol. 2010, 72, 397–406. [Google Scholar] [CrossRef]
- Marin-Rodriguez, M.C.; Smith, D.L. Pectate lyase gene expression and enzyme activity in ripening banana fruit. Plant Mol. Biol. 2003, 51, 851–857. [Google Scholar] [CrossRef]
- Bai, Y.; Wu, D. Characterization and functional analysis of the poplar pectate lyase-like gene PtPL1-18 reveal its role in the development of vascular tissues. Front Plant Sci. 2017, 8, 1123. [Google Scholar] [CrossRef] [Green Version]
- Kalmbach, L.; Bourdon, M. Putative pectate lyase PLL12 and callose deposition through polar CALS7 are necessary for long-distance phloem transport in Arabidopsis. Curr. Biol. 2023, 33, 926–939. [Google Scholar] [CrossRef]
- Bush, M.; Sethi, V. A Phloem-Expressed PECTATE LYASE-LIKE Gene Promotes Cambium and Xylem Development. Front. Plant Sci. 2022, 13, 888201. [Google Scholar] [CrossRef]
- Chen, Y.T.; Li, W.L. PECTATE LYASE LIKE12 patterns the guard cell wall to coordinate turgor pressure and wall mechanics for proper stomatal function in Arabidopsis. Plant Cell 2021, 33, 3134–3150. [Google Scholar] [CrossRef]
- Basu, S.; Roy, A. Arg(235) is an essential catalytic residue of Bacillus pumilus DKS1 pectate lyase to degum ramie fibre. Biodegradation 2011, 22, 153–161. [Google Scholar] [CrossRef]
- Etchells, J.P.; Turner, S.R. The PXY-CLE41 receptor ligand pair defines a multifunctional pathway that controls the rate and orientation of vascular cell division. Development 2010, 137, 767–774. [Google Scholar] [CrossRef] [Green Version]
- Etchells, J.P.; Smit, M.E. A brief history of the TDIF-PXY signalling module: Balancing meristem identity and differentiation during vascular development. New Phytol. 2016, 209, 474–484. [Google Scholar] [CrossRef] [Green Version]
- Tamura, K.; Dudley, J. MEGA4: Molecular Evolutionary Genetics Analysis (MEGA) software version 4.0. Mol. Biol. Evol. 2007, 24, 1596–1599. [Google Scholar] [CrossRef] [PubMed]
- Petersen, T.N.; Brunak, S. SignalP 4.0: Discriminating signal peptides from transmembrane regions. Nat. Methods 2011, 8, 785–786. [Google Scholar] [CrossRef] [PubMed]
- Emanuelsson, O.; Nielsen, H. Predicting subcellular localization of proteins based on their N-terminal amino acid sequence. J. Mol. Biol. 2000, 300, 1005–1016. [Google Scholar] [CrossRef] [PubMed] [Green Version]
- Biasini, M.; Bienert, S. SWISS-MODEL: Modelling protein tertiary and quaternary structure using evolutionary information. Nucleic Acids Res. 2014, 42, W252–W258. [Google Scholar] [CrossRef] [PubMed]
- Johansson, M.U.; Zoete, V. Defining and searching for structural motifs using DeepView/Swiss-PdbViewer. BMC Bioinform. 2012, 13, 173. [Google Scholar] [CrossRef] [Green Version]
- Winter, D.; Vinegar, B. An “Electronic Fluorescent Pictograph” browser for exploring and analyzing large-scale biological data sets. PLoS ONE 2007, 2, e718. [Google Scholar] [CrossRef]
- Howe, E.; Holton, K. MeV: Multiexperiment viewer. In Biomedical Informatics for Cancer Research; Ochs, M., Casagrande, J., Eds.; Springer: Boston, MA, USA, 2010; pp. 267–277. [Google Scholar]
- Lee, T.; Lee, I. AraNet: A network biology server for Arabidopsis thaliana and other non-model plant species. In Plant Gene Regulatory Networks; Kaufmann, K., Mueller-Roeber, B., Eds.; Humana Press: New York, NY, USA, 2017; Volume 1629, pp. 225–238. [Google Scholar]
- Mutwil, M.; Obro, J. GeneCAT—Novel webtools that combine BLAST and co-expression analyses. Nucleic Acids Res. 2008, 36, W320–W326. [Google Scholar] [CrossRef]
- Song, D.; Shen, J. Characterization of cellulose synthase complexes in Populus xylem differentiation. New Phytol. 2010, 187, 777–790. [Google Scholar] [CrossRef]
- Wu, Z.L.; Zhang, M.L. Biomass digestibility is predominantly affected by three factors of wall polymer features distinctive in wheat accessions and rice mutants. Biotechnol. Biofuels 2013, 6, 183. [Google Scholar] [CrossRef] [Green Version]
- Xu, N.; Zhang, W. Hemicelluloses negatively affect lignocellulose crystallinity for high biomass digestibility under NaOH and H2SO4 pretreatments in Miscanthus. Biotechnol. Biofuels 2012, 5, 58. [Google Scholar] [CrossRef] [Green Version]
- Fry, S.C. The Growing Plant Cell Wall: Chemical and Metabolic Analysis; Longman: London, UK, 1988; pp. 97–99. [Google Scholar]


Disclaimer/Publisher’s Note: The statements, opinions and data contained in all publications are solely those of the individual author(s) and contributor(s) and not of MDPI and/or the editor(s). MDPI and/or the editor(s) disclaim responsibility for any injury to people or property resulting from any ideas, methods, instructions or products referred to in the content. |
© 2023 by the authors. Licensee MDPI, Basel, Switzerland. This article is an open access article distributed under the terms and conditions of the Creative Commons Attribution (CC BY) license (https://creativecommons.org/licenses/by/4.0/).
Share and Cite
Bai, Y.; Tian, D.; Chen, P.; Wu, D.; Du, K.; Zheng, B.; Shi, X. A Pectate Lyase Gene Plays a Critical Role in Xylem Vascular Development in Arabidopsis. Int. J. Mol. Sci. 2023, 24, 10883. https://doi.org/10.3390/ijms241310883
Bai Y, Tian D, Chen P, Wu D, Du K, Zheng B, Shi X. A Pectate Lyase Gene Plays a Critical Role in Xylem Vascular Development in Arabidopsis. International Journal of Molecular Sciences. 2023; 24(13):10883. https://doi.org/10.3390/ijms241310883
Chicago/Turabian StyleBai, Yun, Dongdong Tian, Peng Chen, Dan Wu, Kebing Du, Bo Zheng, and Xueping Shi. 2023. "A Pectate Lyase Gene Plays a Critical Role in Xylem Vascular Development in Arabidopsis" International Journal of Molecular Sciences 24, no. 13: 10883. https://doi.org/10.3390/ijms241310883