

Injection-Molded Isotactic Polypropylene Colored with Green Transparent and Opaque Pigments

Abstract
:1. Introduction
2. Results and Discussion
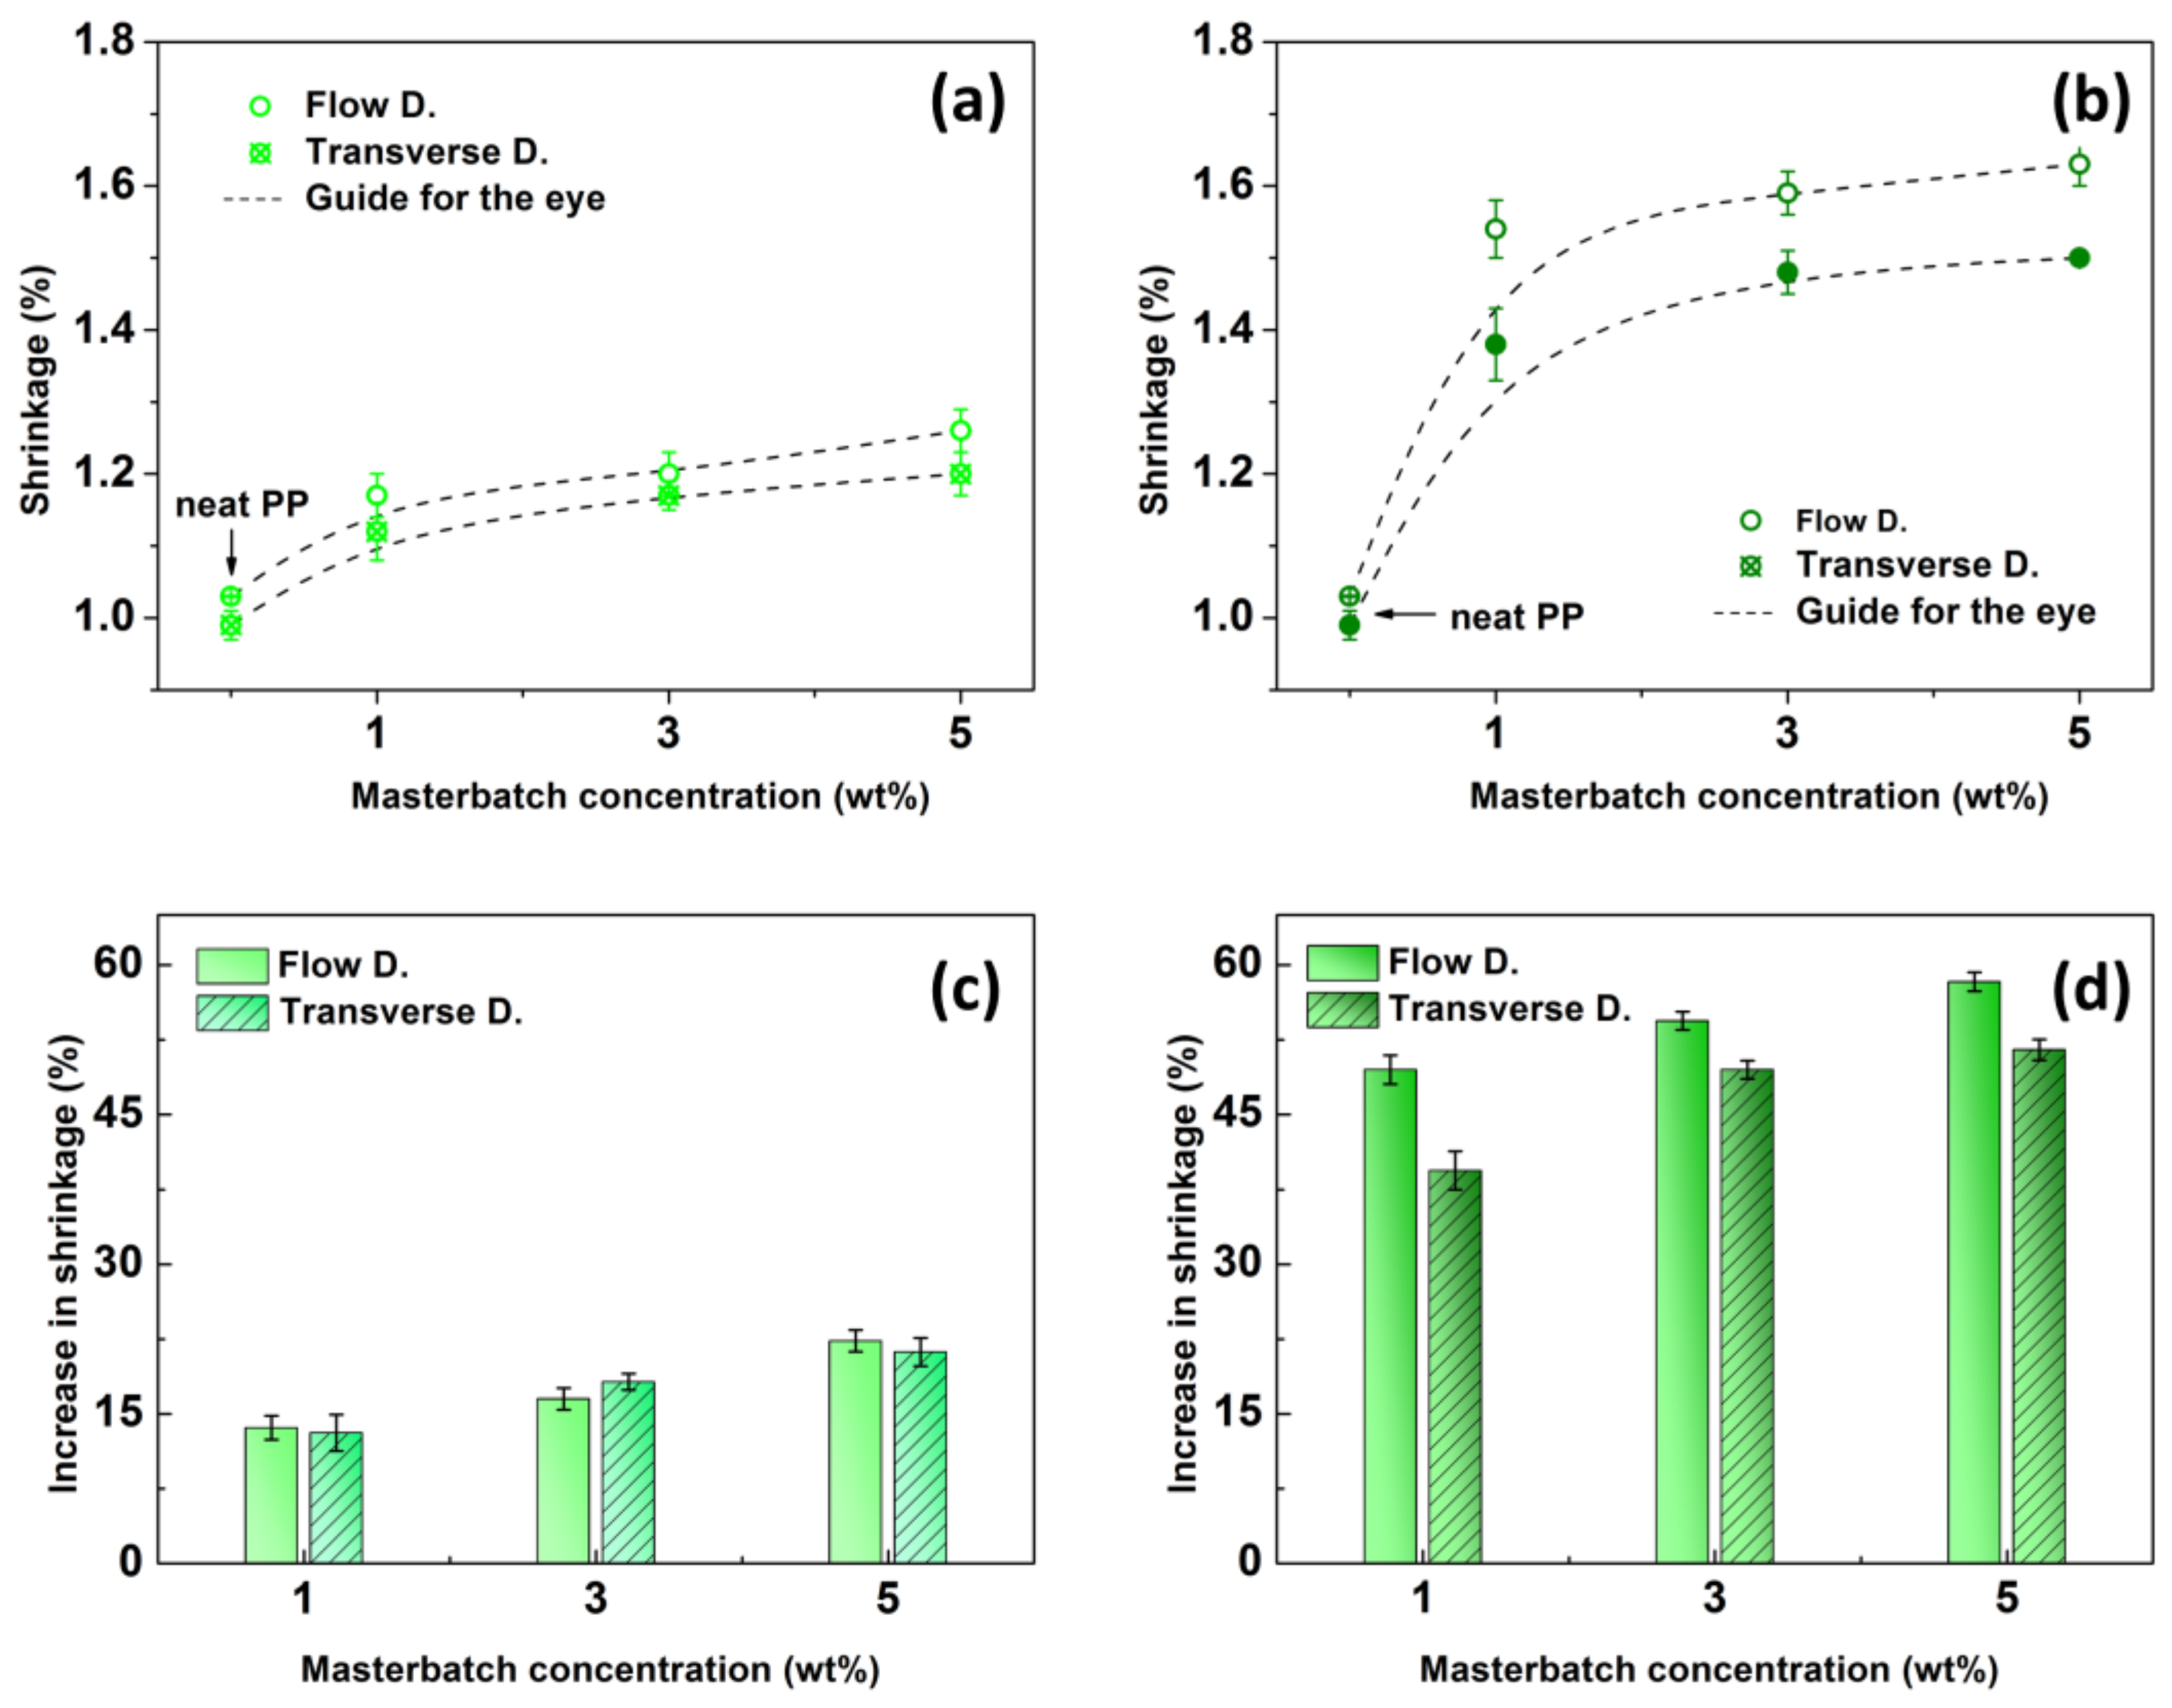
2.1. Shrinkage Evaluation
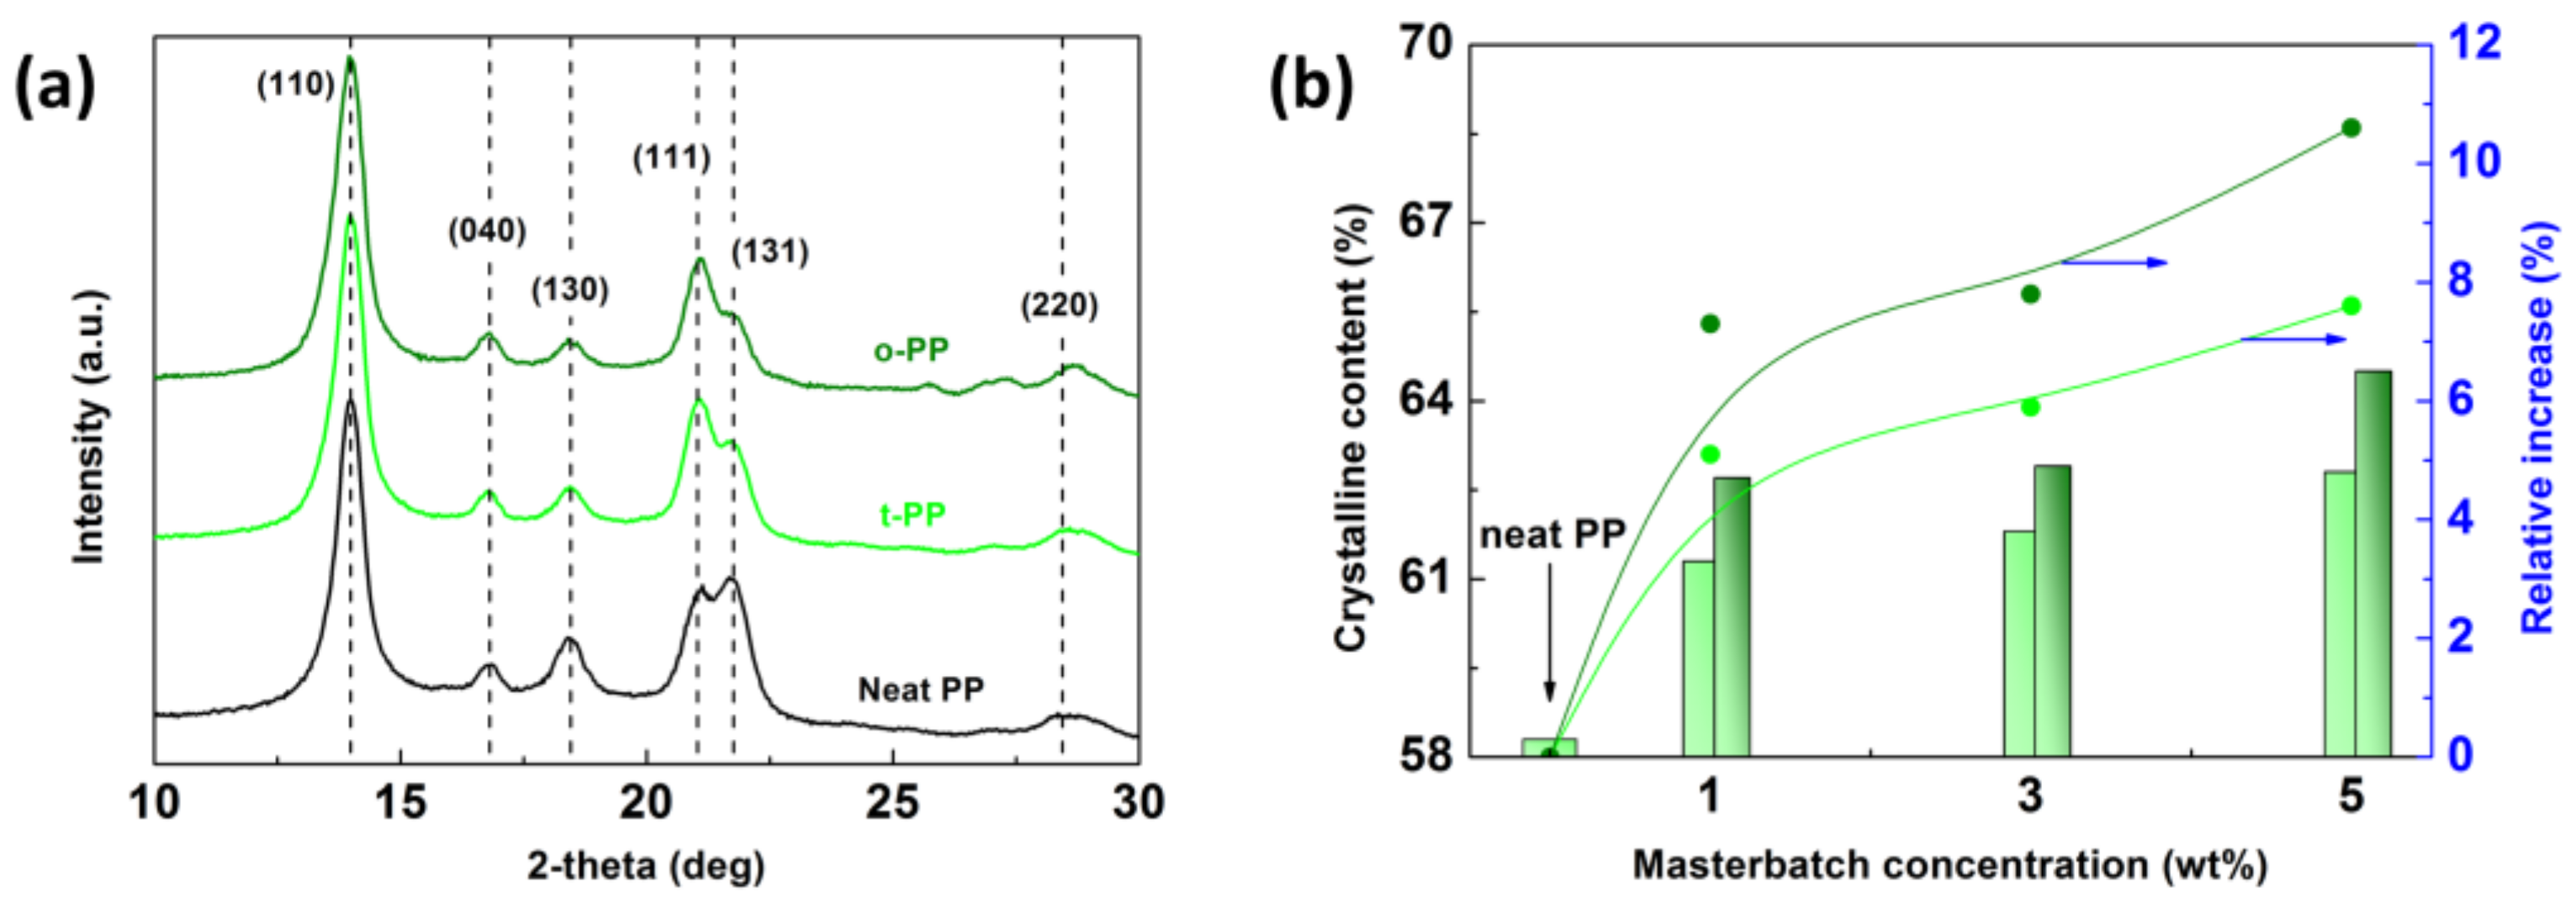
2.2. Crystallinity Evaluation
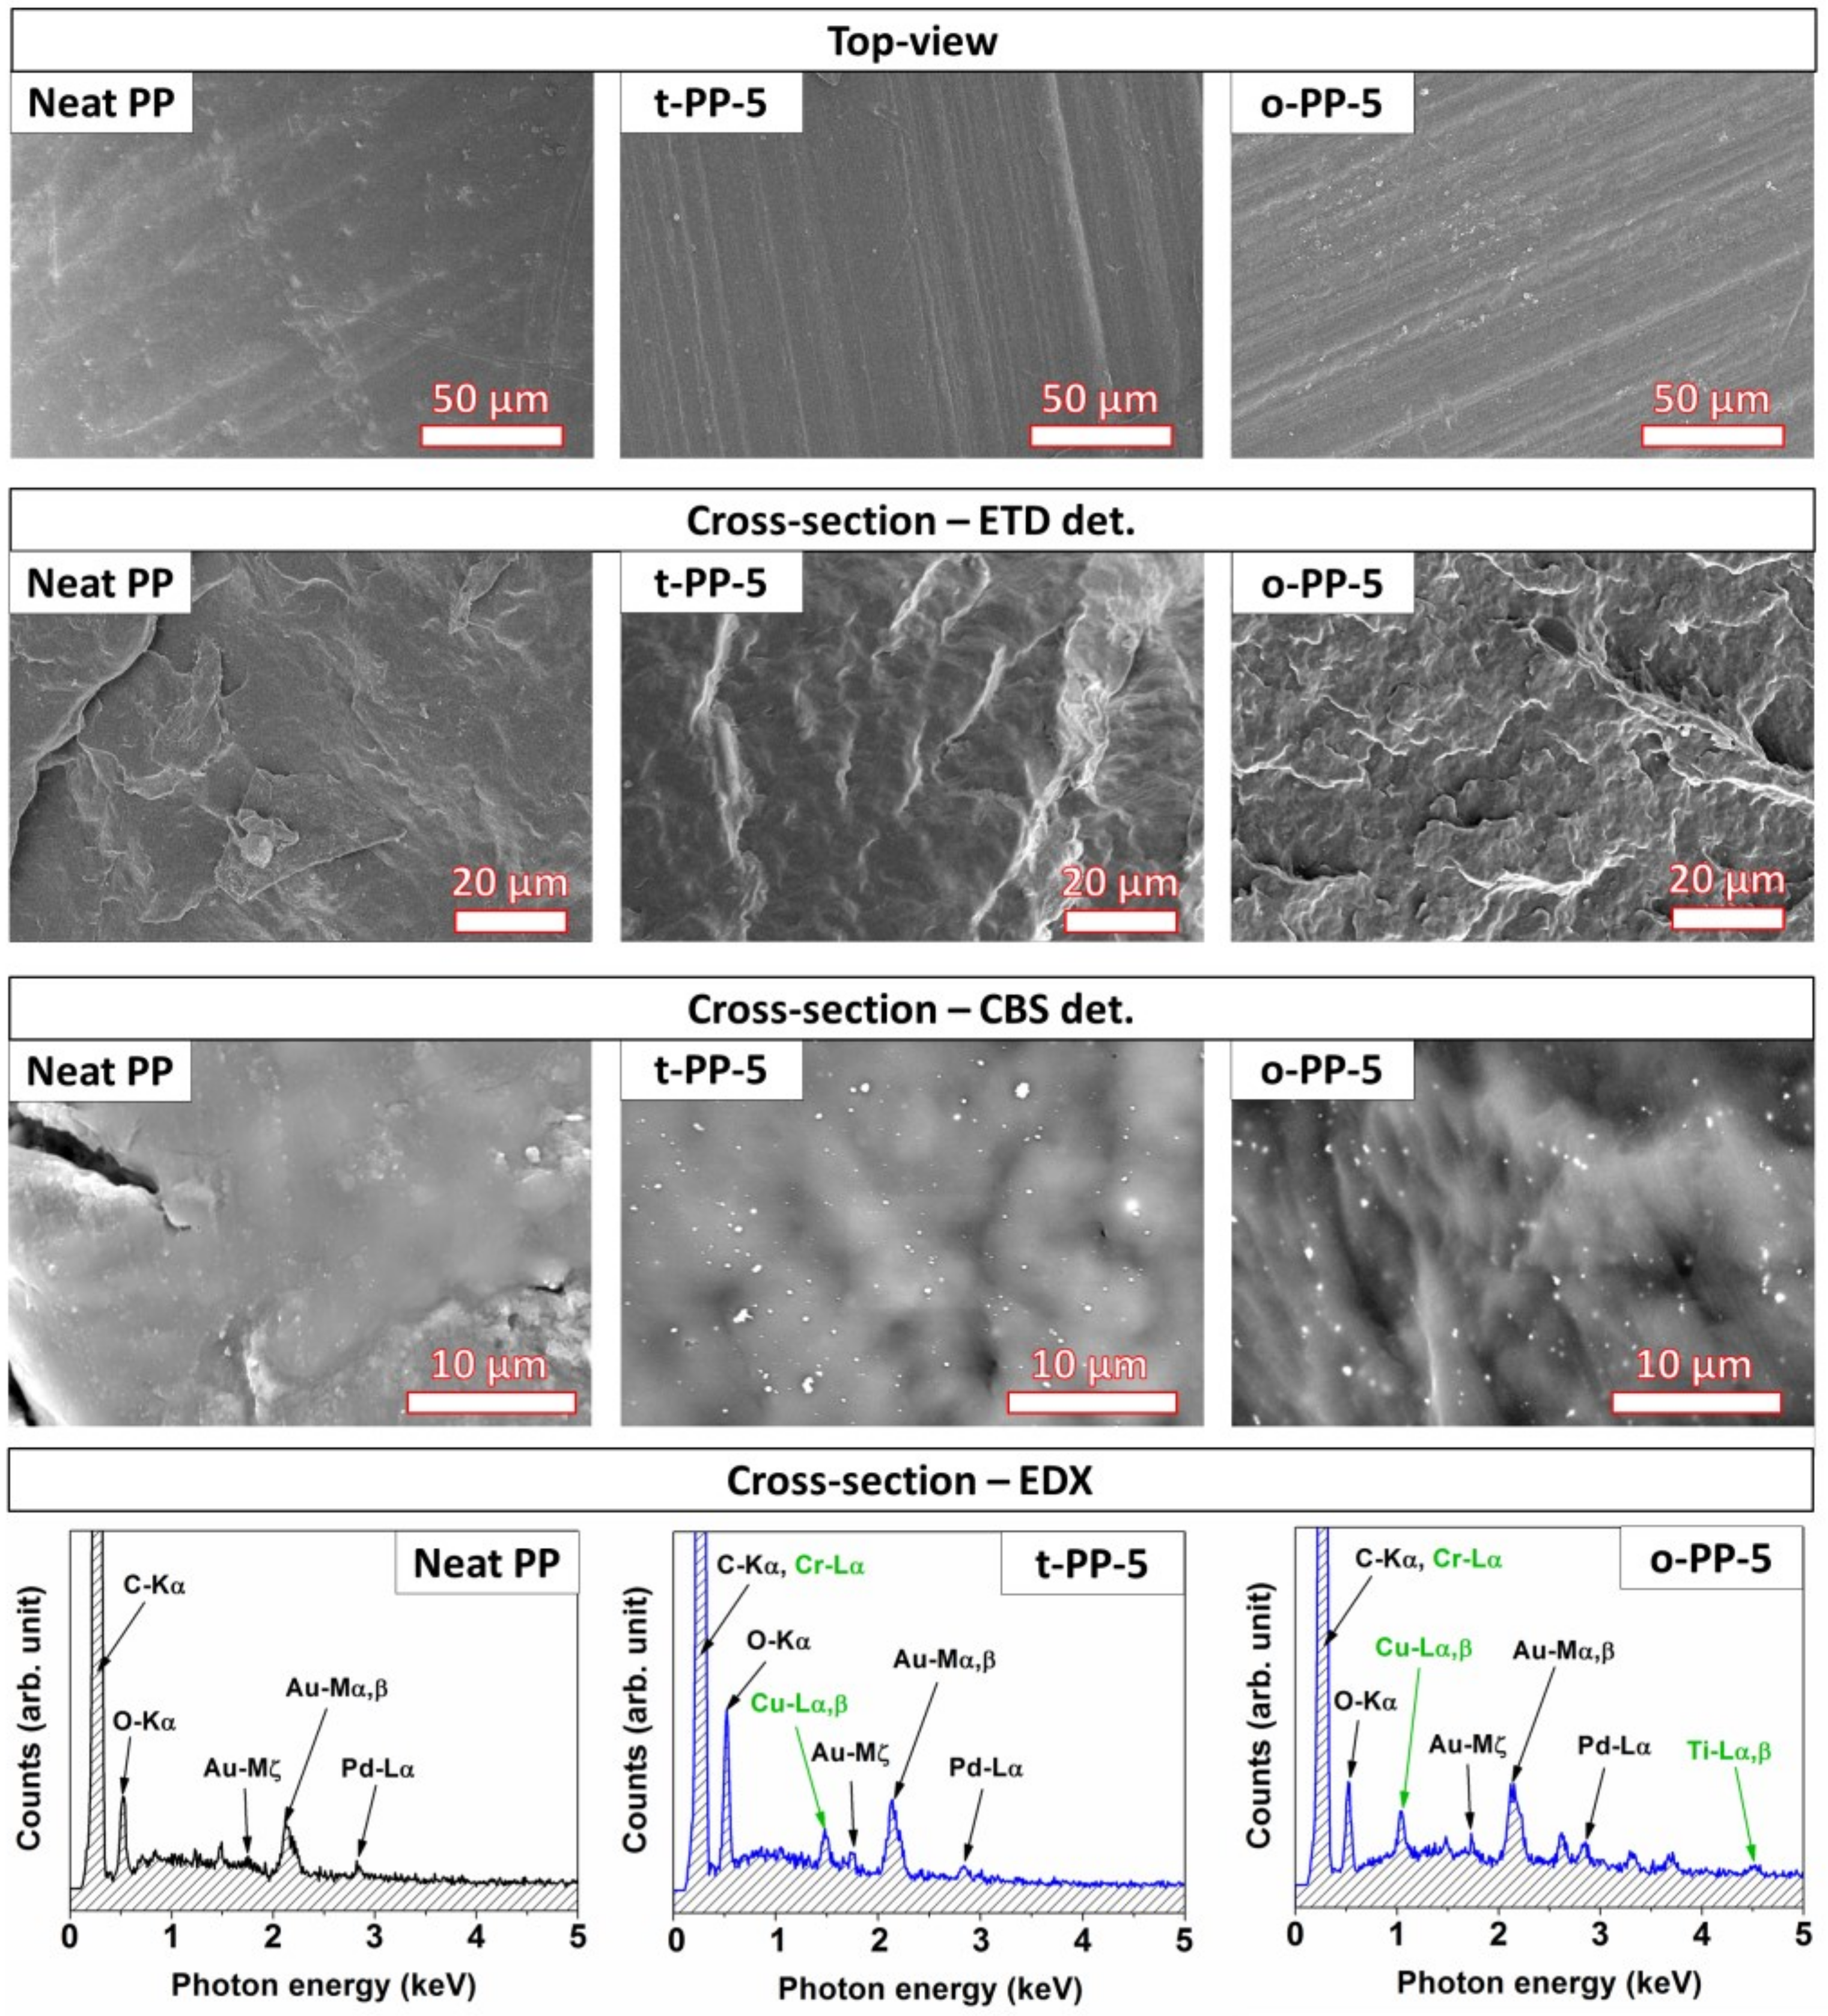
2.3. Microstructure Analysis
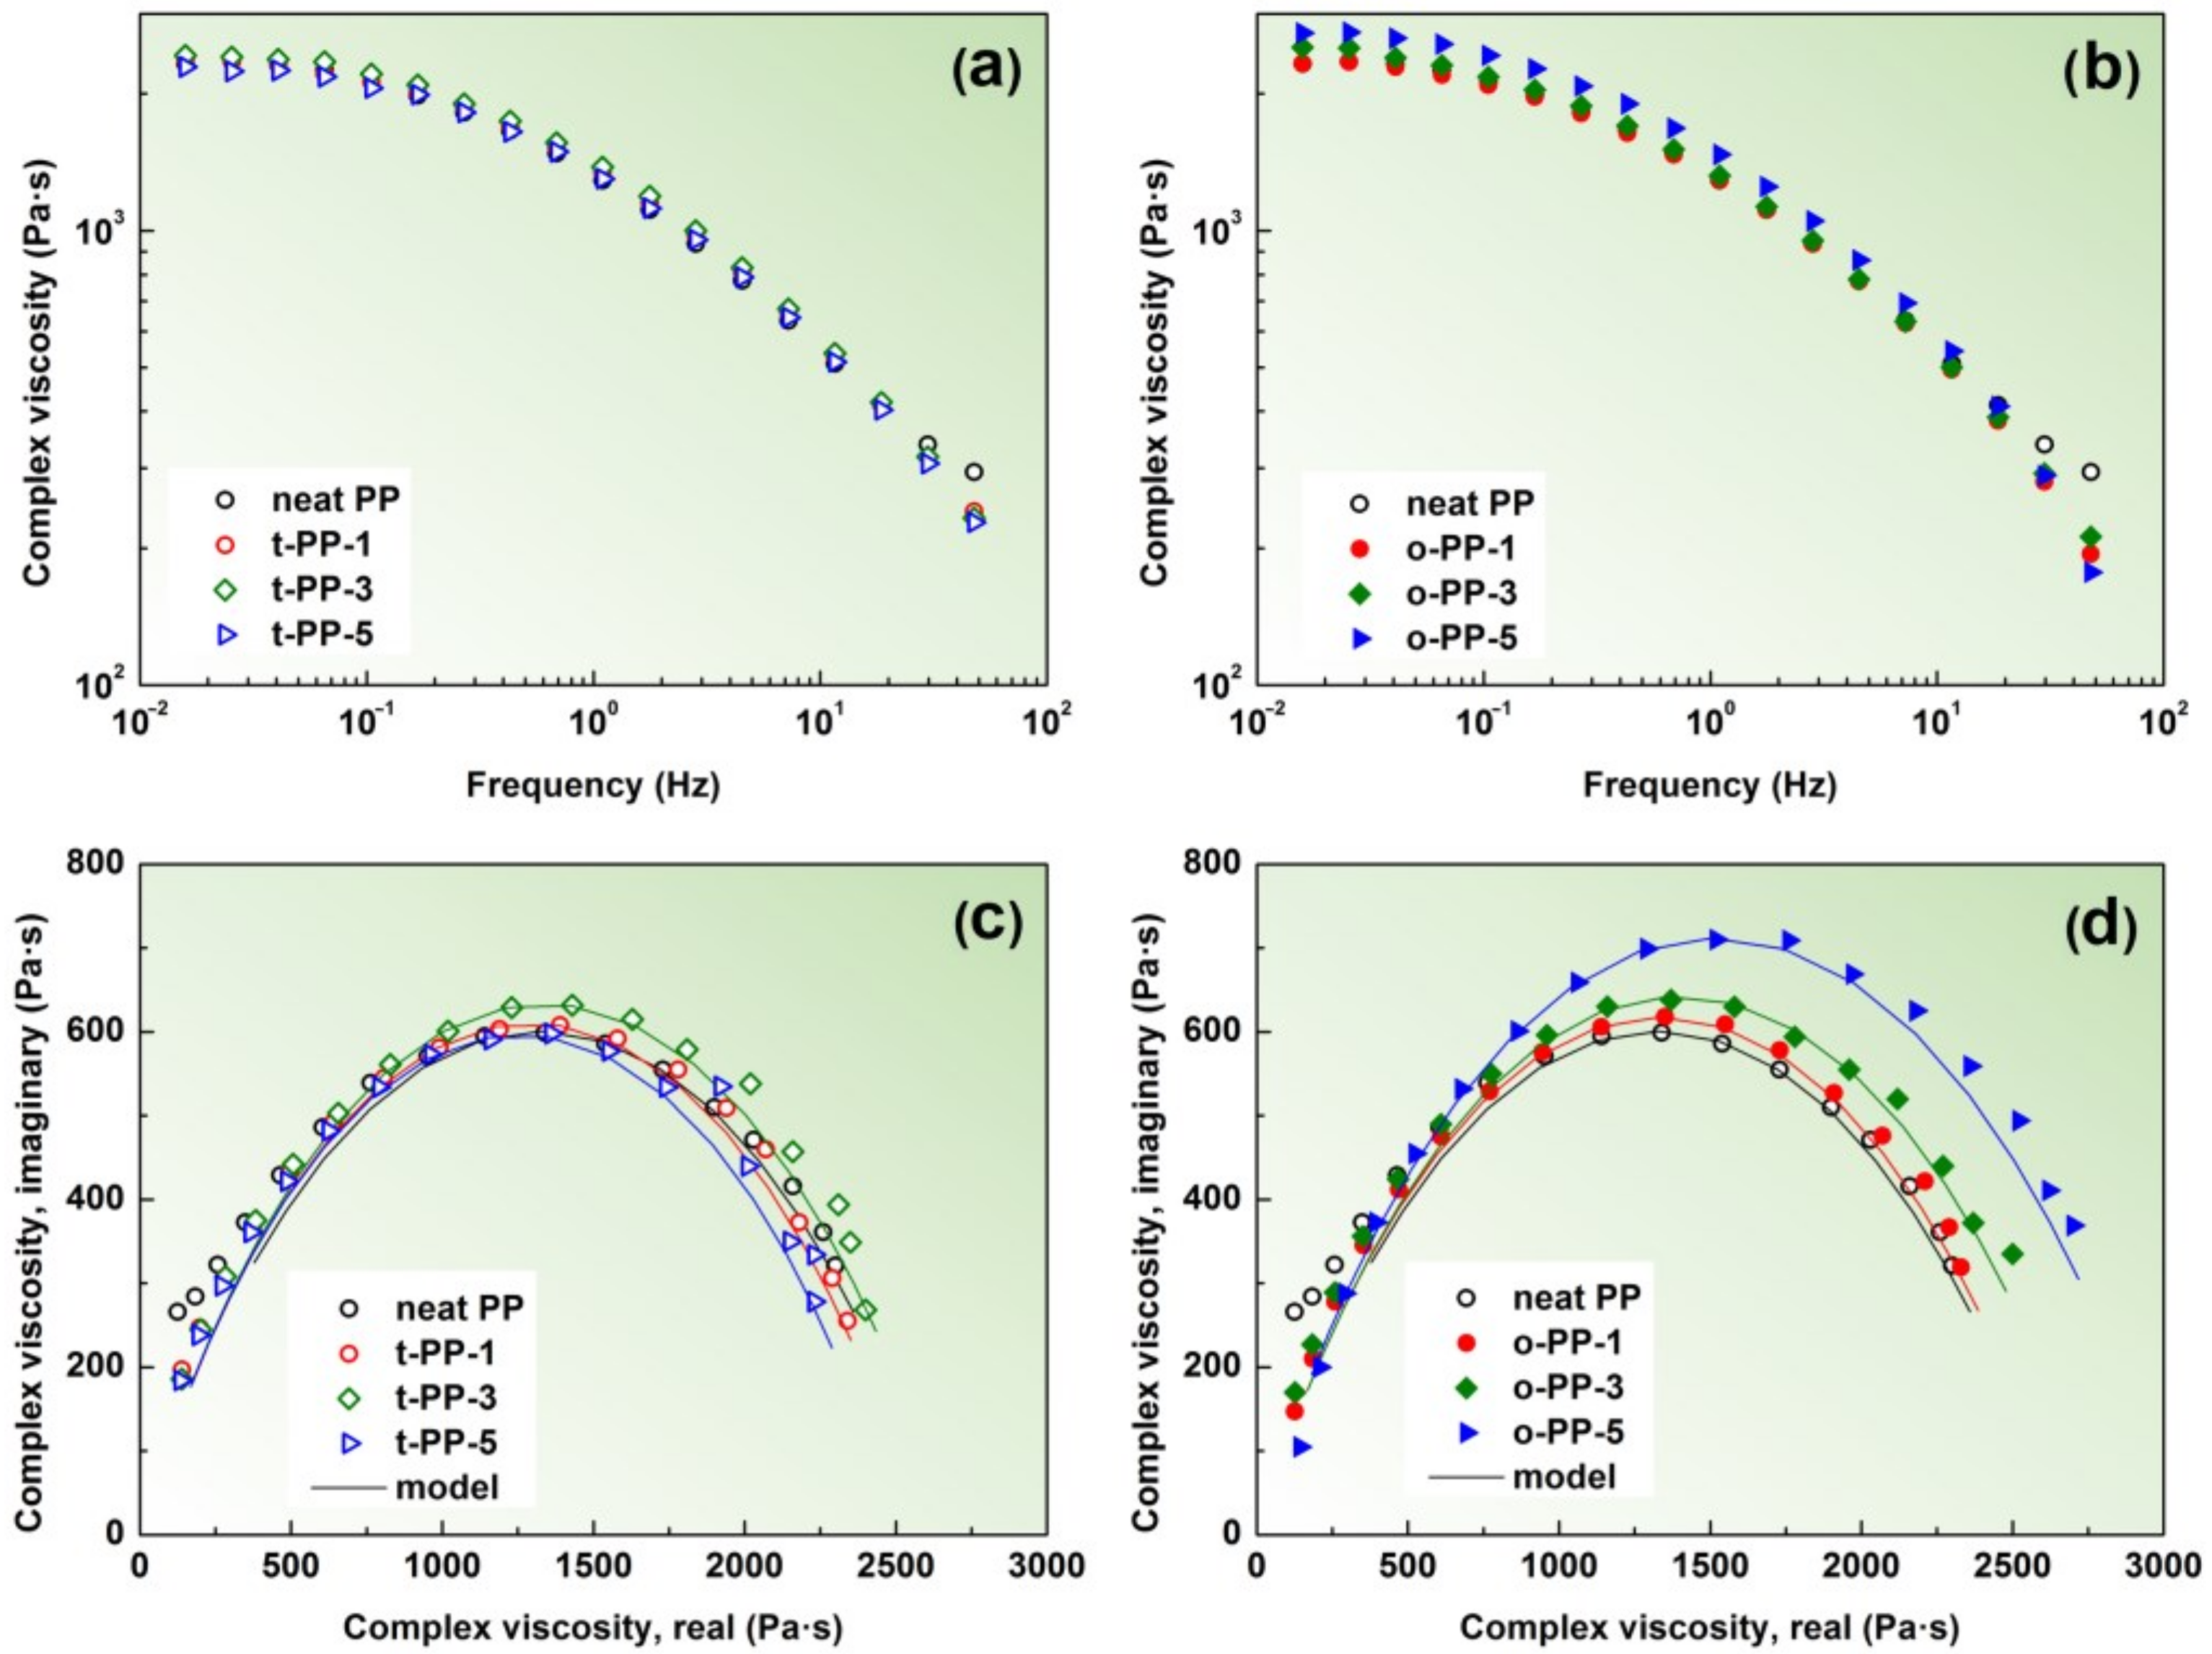
2.4. Rheological Properties
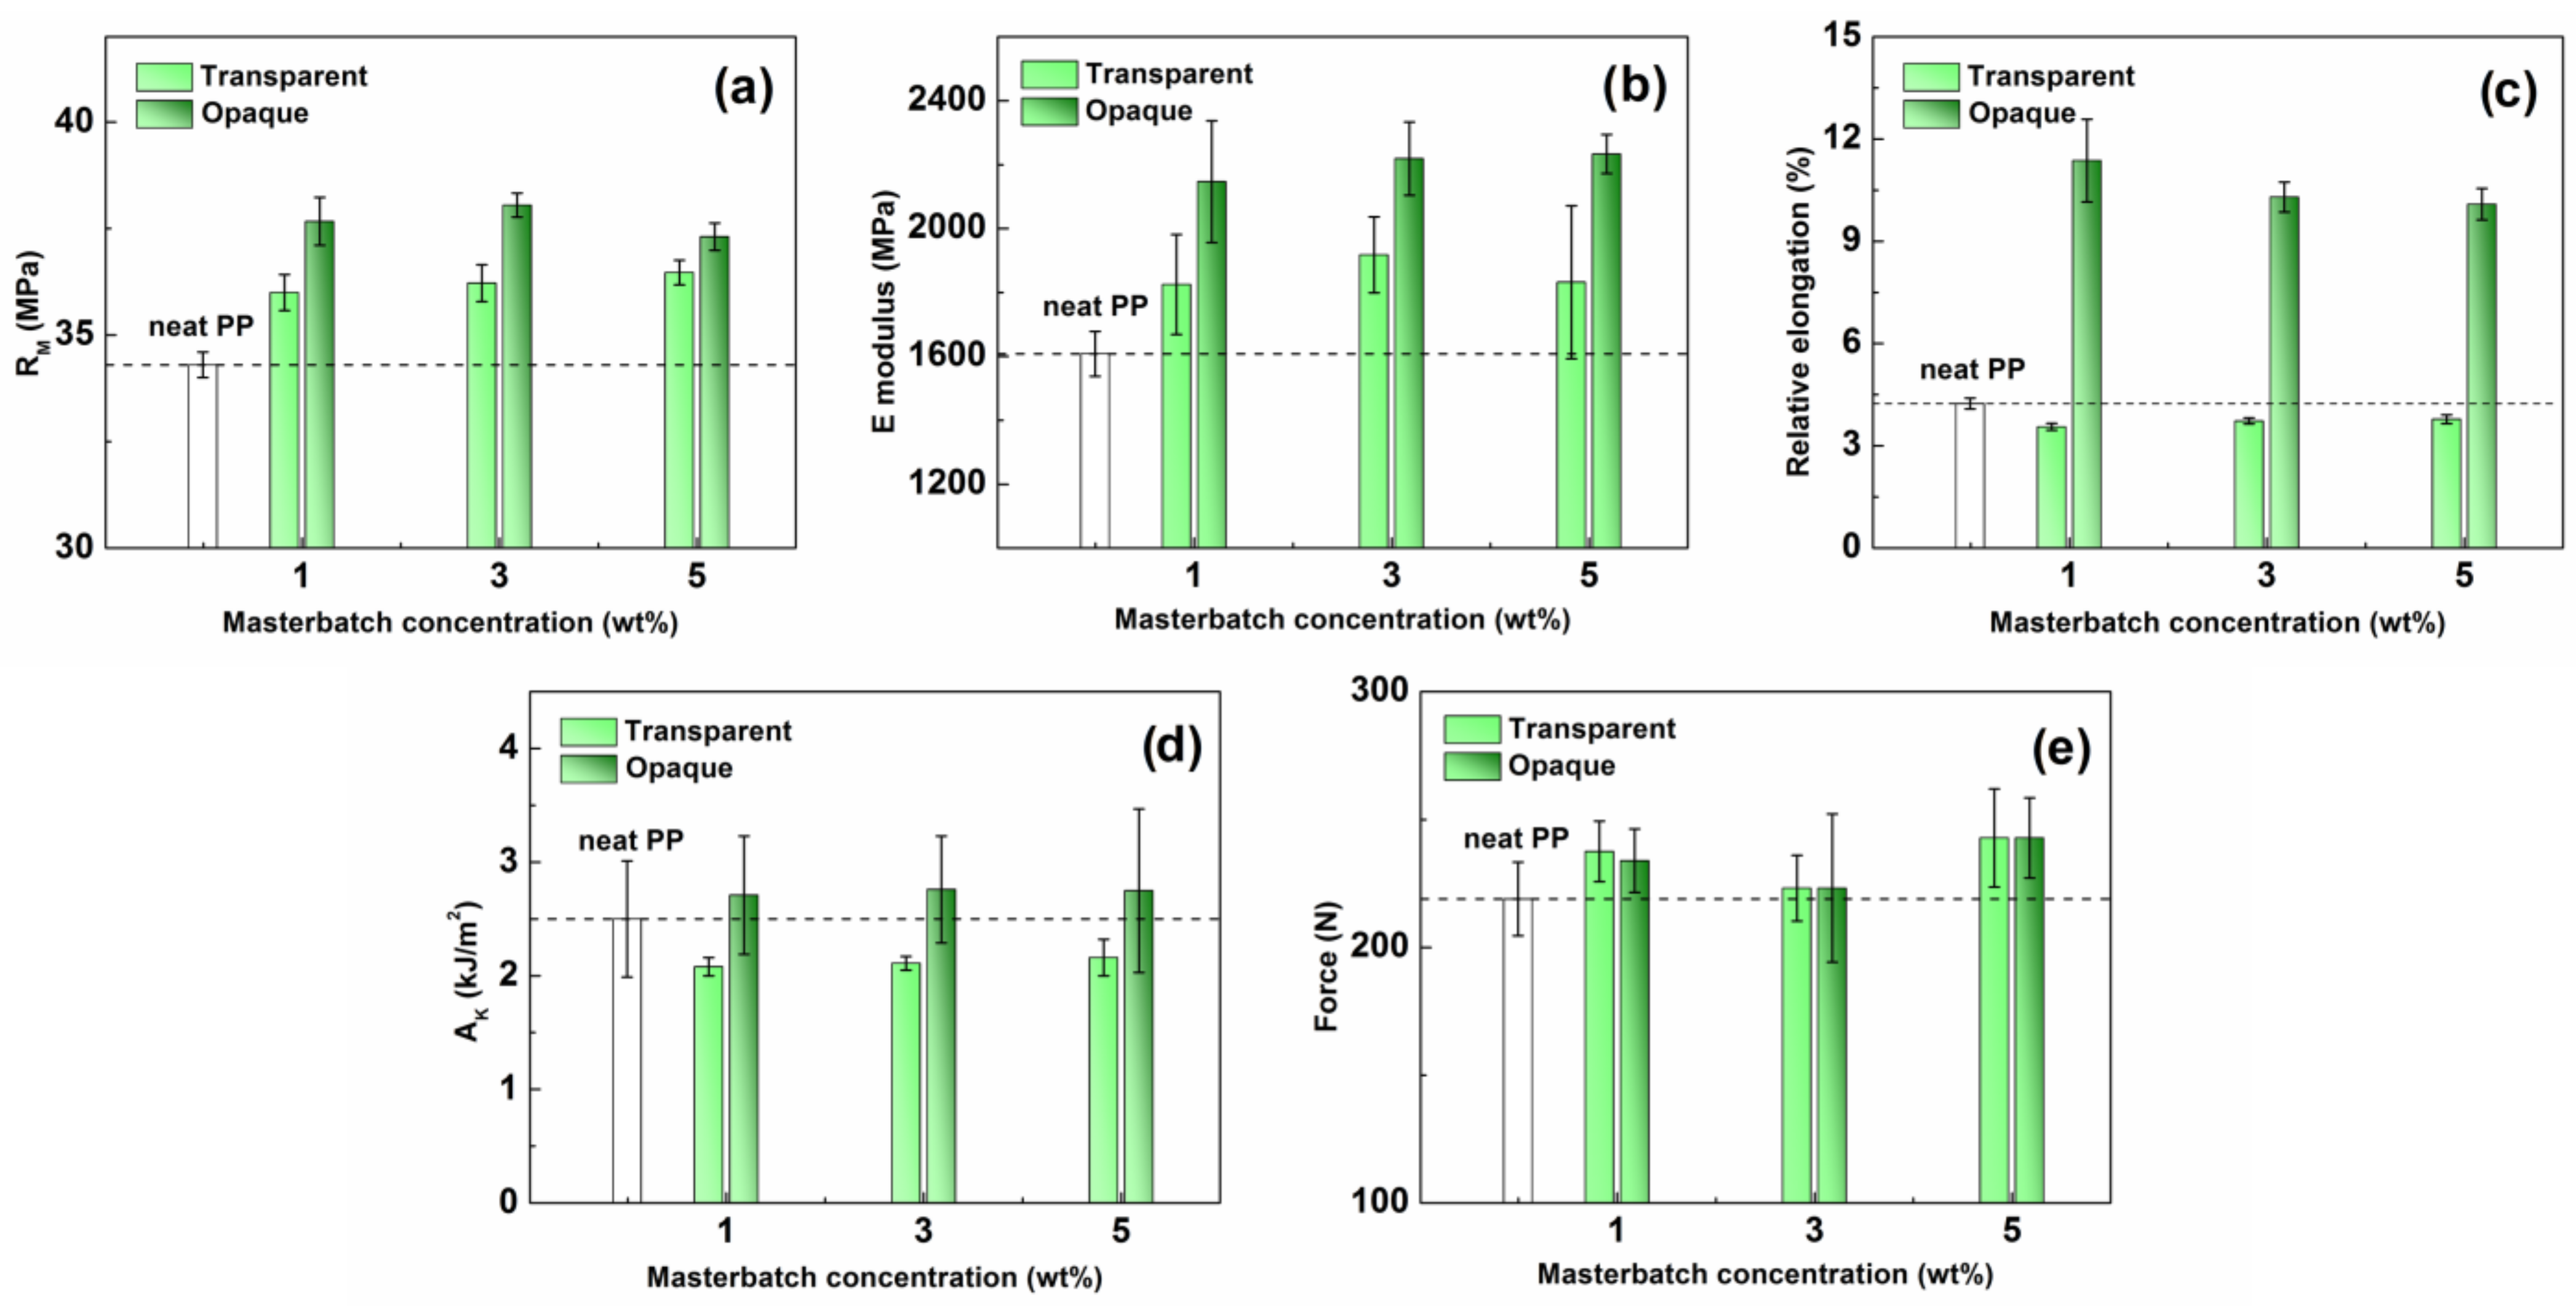
2.5. Mechanical Properties
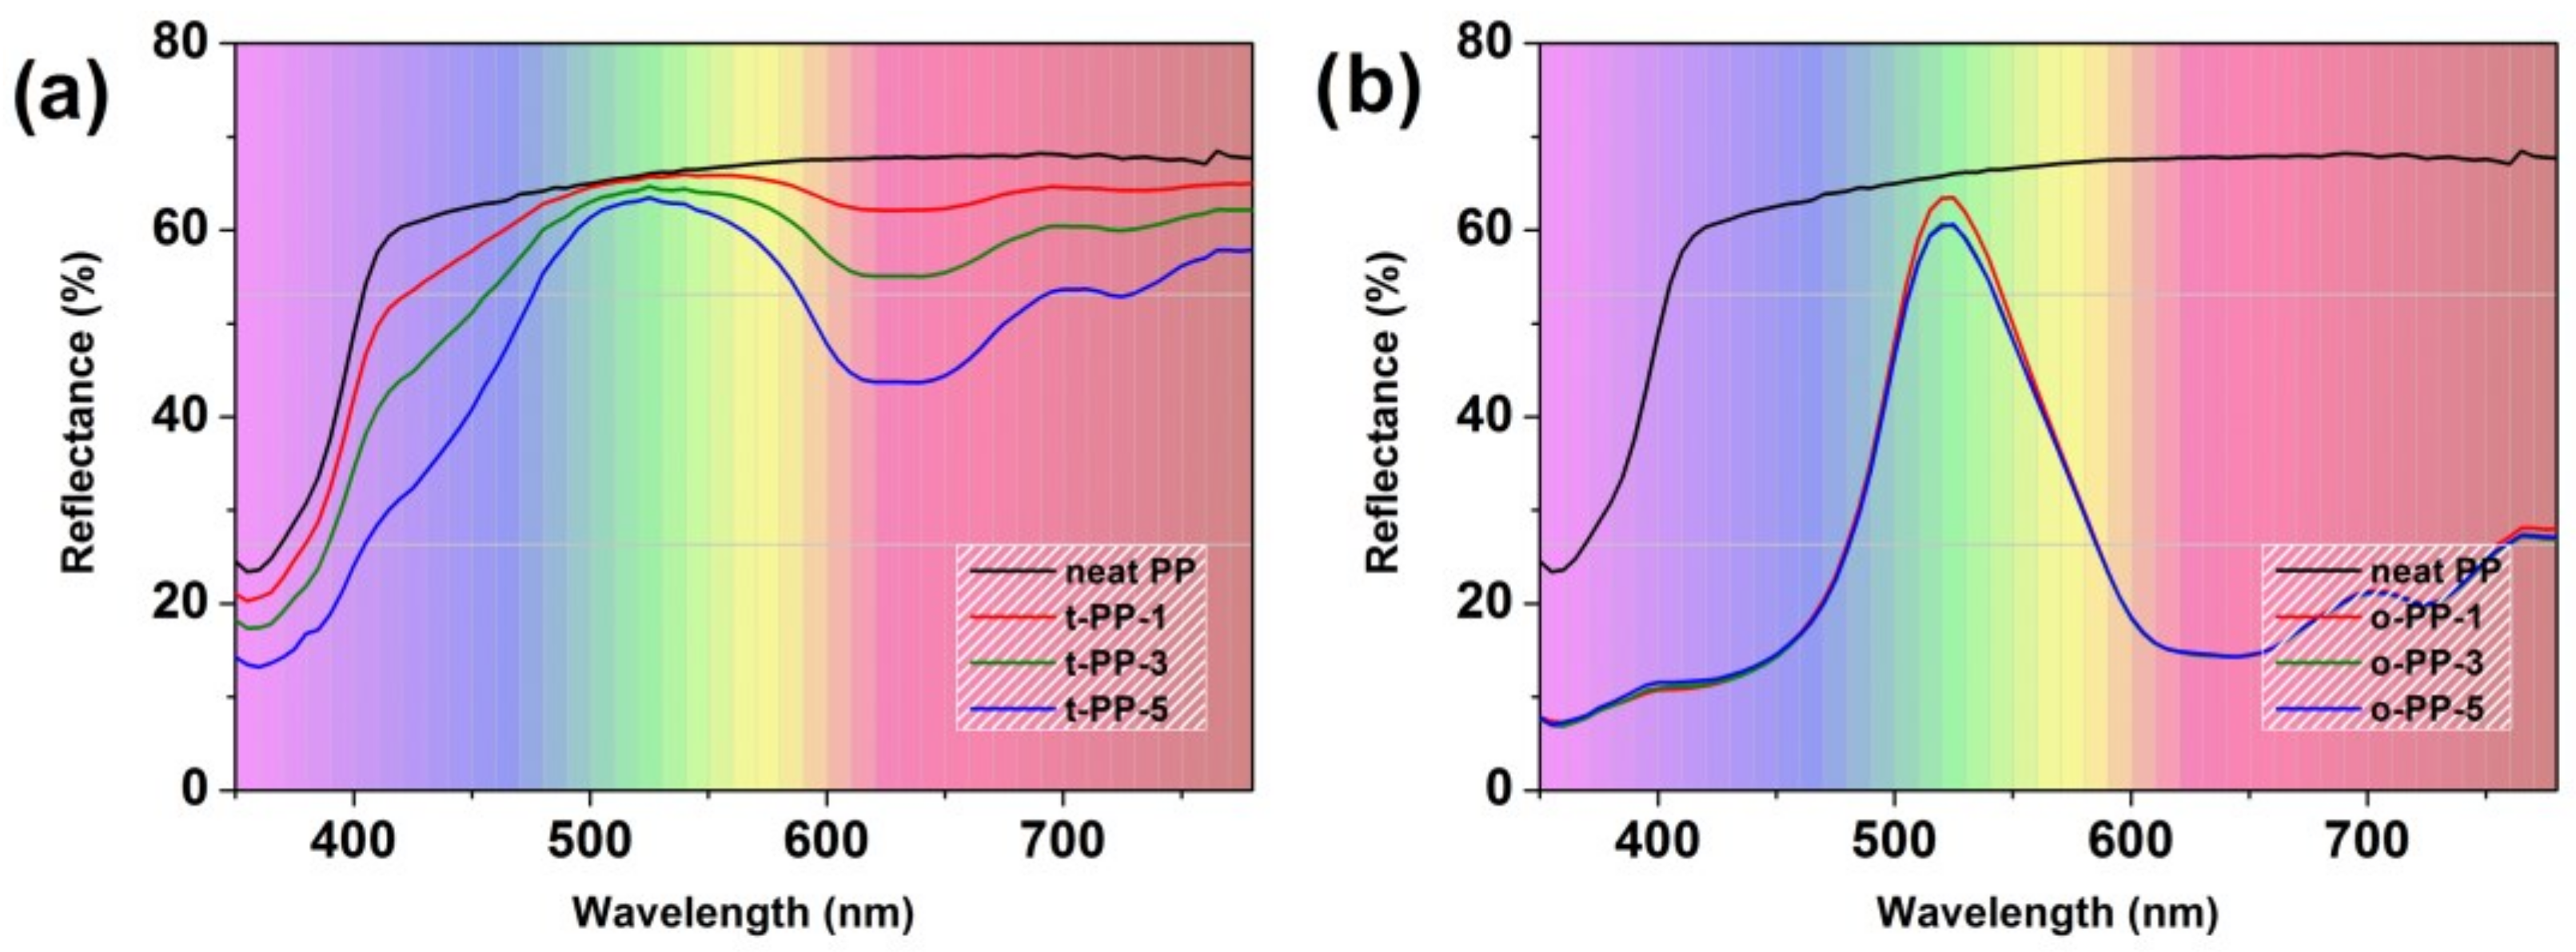
2.6. Color Characteristics
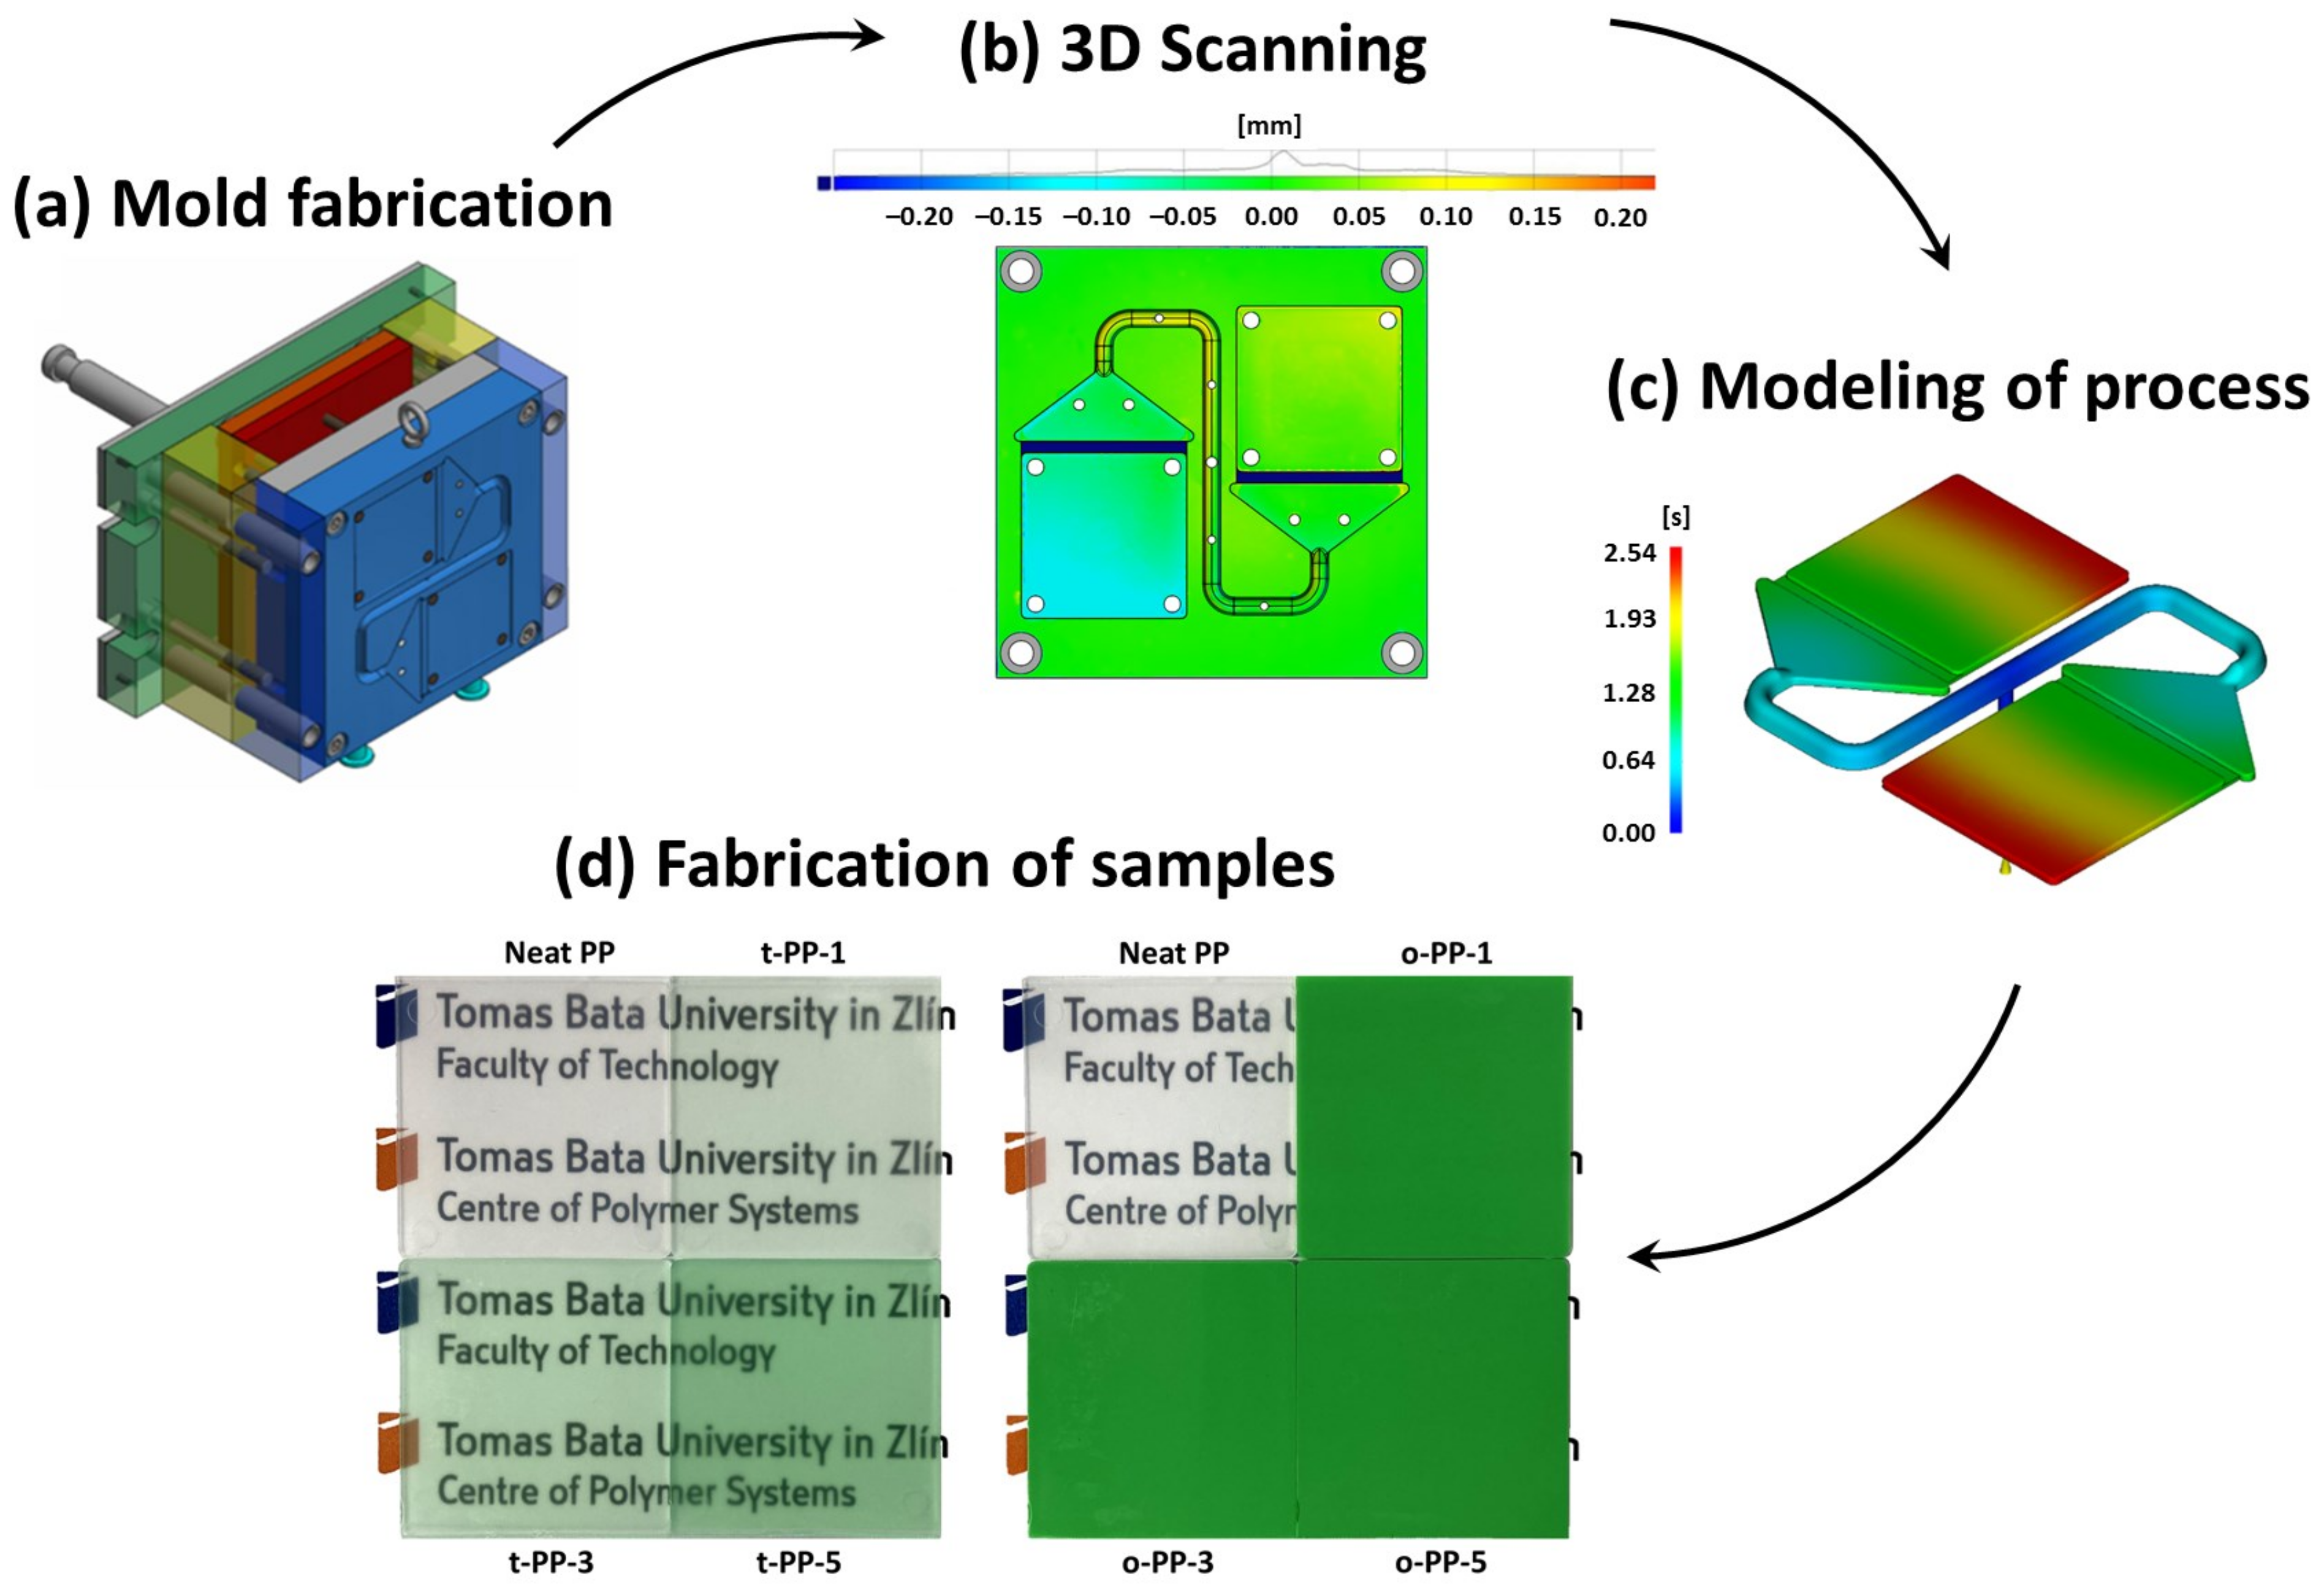
3. Materials and Methods
3.1. Materials
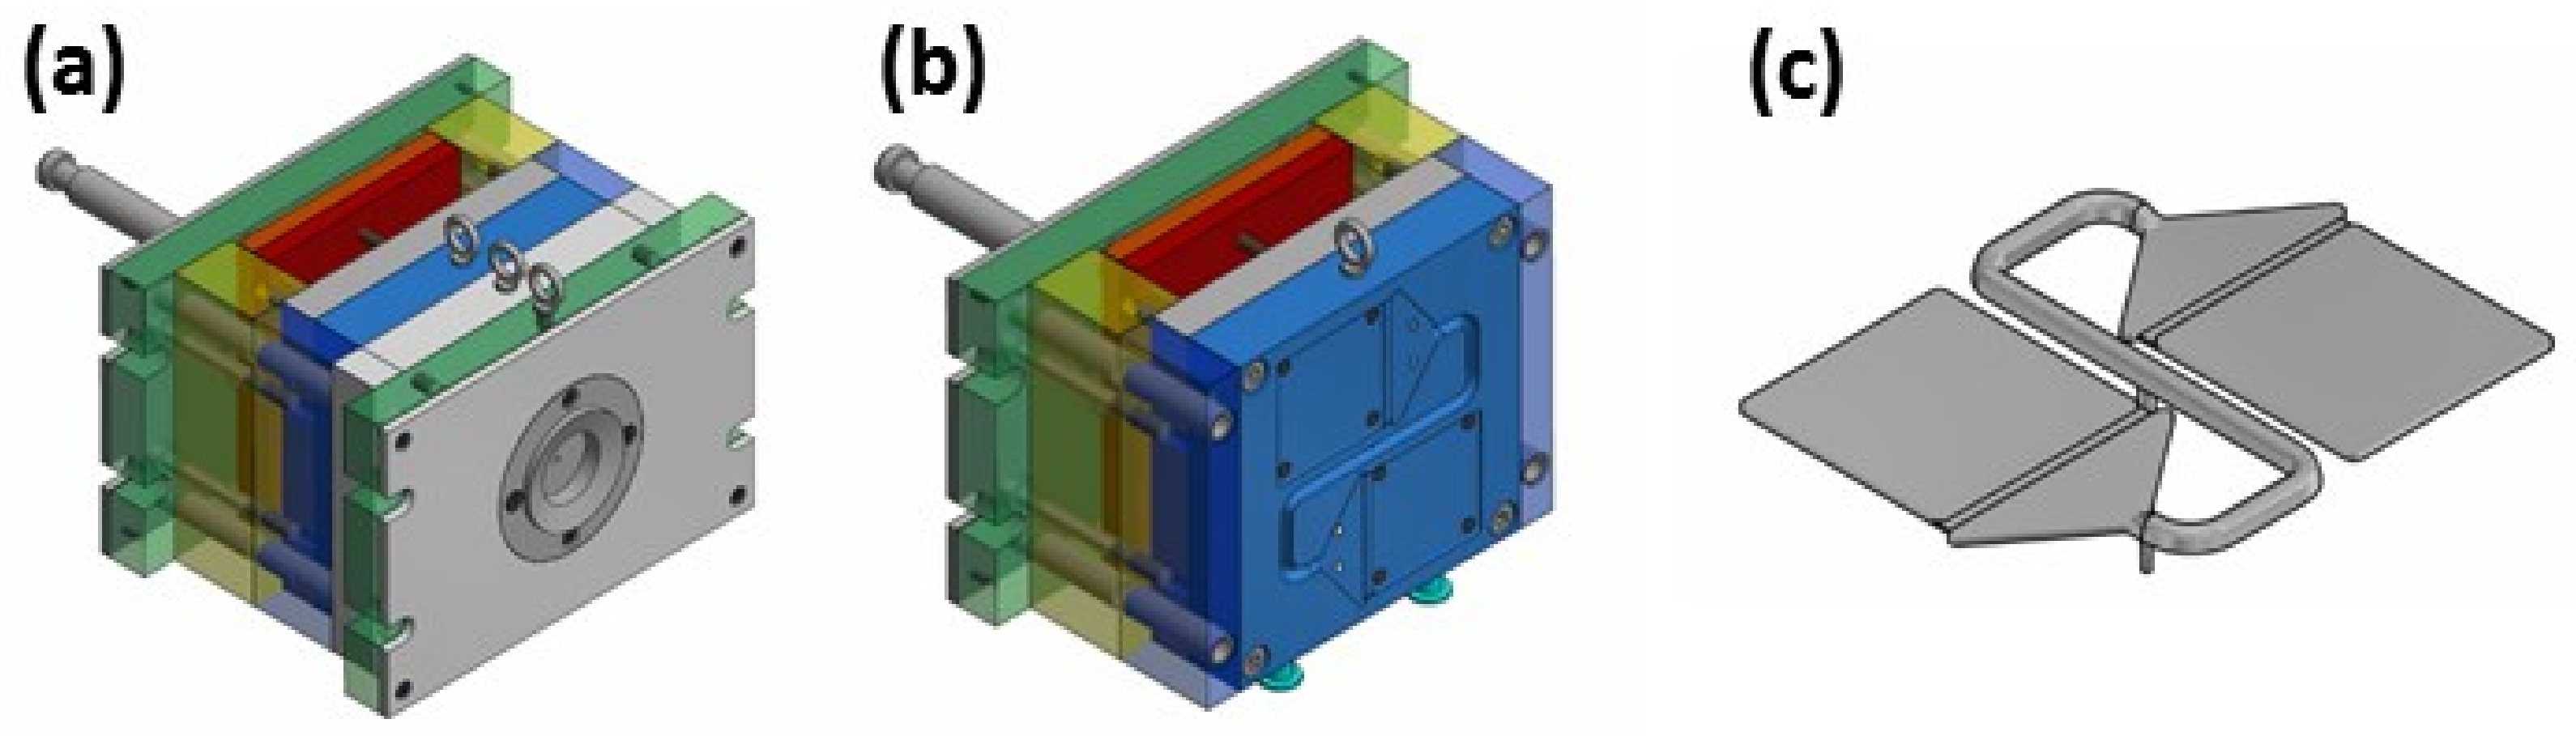
3.2. Mold Design
3.3. Inspection of Cavity’s Dimensions
3.4. Formation of Basic Mixtures
3.5. Fabrication of the Samples
3.6. Shrinkage Determination
3.7. X-ray Diffraction Analysis
3.8. Scanning Electron Microscopy and Energy-Dispersive X-ray Spectrometry
3.9. Melt Rheology
3.10. Tensile Properties
3.11. Impact Toughness
3.12. Colorimetric Measurements
4. Conclusions
Author Contributions
Funding
Institutional Review Board Statement
Informed Consent Statement
Data Availability Statement
Conflicts of Interest
References
- Suzuki, S.; Mizuguchi, J. Pigment-Induced Crystallization in Colored Plastics Based on Partially Crystalline Polymers. Dye. Pigm. 2004, 61, 69–77. [Google Scholar] [CrossRef] [Green Version]
- De Santis, F.; Pantani, R.; Speranza, V.; Titomanlio, G. Analysis of Shrinkage Development of a Semicrystalline Polymer during Injection Molding. Ind. Eng. Chem. Res. 2010, 49, 2469–2476. [Google Scholar] [CrossRef]
- Broda, J. Polymorphic Composition of Colored Polypropylene Fibers. Cryst. Growth Des. 2004, 4, 1277–1282. [Google Scholar] [CrossRef]
- Broda, J. Nucleating Activity of the Quinacridone and Phthalocyanine Pigments in Polypropylene Crystallization. J. Appl. Polym. Sci. 2003, 90, 3957–3964. [Google Scholar] [CrossRef]
- Haastrup, S.; Yu, D.; Broch, T.; Larsen, K.L. Comparison of the Performance of Masterbatch and Liquid Color Concentrates for Mass Coloration of Polypropylene. Color. Res. Appl. 2016, 41, 484–492. [Google Scholar] [CrossRef]
- Kc, B.; Faruk, O.; Agnelli, J.A.M.; Leao, A.L.; Tjong, J.; Sain, M. Sisal-Glass Fiber Hybrid Biocomposite: Optimization of Injection Molding Parameters Using Taguchi Method for Reducing Shrinkage. Compos. Part A Appl. Sci. Manuf. 2016, 83, 152–159. [Google Scholar] [CrossRef] [Green Version]
- Zeppenfeld, M.; Müller, B.; Heyl, S. Influence of Insert Component Position and Geometry on Shrinkage in Thermoplastic Insert Molding. AIP Conf. Proc. 2019, 2139, 030005. [Google Scholar]
- Kościuszko, A.; Marciniak, D.; Sykutera, D. Post-Processing Time Dependence of Shrinkage and Mechanical Properties of Injection-Molded Polypropylene. Materials 2020, 14, 22. [Google Scholar] [CrossRef]
- Wang, J.; Mao, Q. A Novel Process Control Methodology Based on the PVT Behavior of Polymer for Injection Molding. Adv. Polym. Technol. 2013, 32, E474–E485. [Google Scholar] [CrossRef]
- Rojo, E.; Fernández, M.; Muñoz, M.E.; Santamaría, A. Relation between PVT Measurements and Linear Viscosity in Isotactic and Syndiotactic Polypropylenes. Polymer 2006, 47, 7853–7858. [Google Scholar] [CrossRef]
- Mohan, M.; Ansari, M.N.M.; Shanks, R.A. Review on the Effects of Process Parameters on Strength, Shrinkage, and Warpage of Injection Molding Plastic Component. Polym. Plast. Technol. Eng. 2017, 56, 1–12. [Google Scholar] [CrossRef]
- Bensingh, R.J.; Boopathy, S.R.; Jebaraj, C. Minimization of Variation in Volumetric Shrinkage and Deflection on Injection Molding of Bi-Aspheric Lens Using Numerical Simulation. J. Mech. Sci. Technol. 2016, 30, 5143–5152. [Google Scholar] [CrossRef]
- Ryu, Y.; Sohn, J.; Kweon, B.; Cha, S. Shrinkage Optimization in Talc- and Glass-Fiber-Reinforced Polypropylene Composites. Materials 2019, 12, 764. [Google Scholar] [CrossRef] [Green Version]
- Mulle, M.; Wafai, H.; Yudhanto, A.; Lubineau, G.; Yaldiz, R.; Schijve, W.; Verghese, N. Influence of Process-Induced Shrinkage and Annealing on the Thermomechanical Behavior of Glass Fiber-Reinforced Polypropylene. Compos. Sci. Technol. 2019, 170, 183–189. [Google Scholar] [CrossRef]
- Chen, W.C.; Nguyen, M.H.; Chiu, W.H.; Chen, T.N.; Tai, P.H. Optimization of the Plastic Injection Molding Process Using the Taguchi Method, RSM, and Hybrid GA-PSO. Int. J. Adv. Manuf. Technol. 2016, 83, 1873–1886. [Google Scholar] [CrossRef]
- Dimla, D.E.; Camilotto, M.; Miani, F. Design and Optimisation of Conformal Cooling Channels in Injection Moulding Tools. J. Mater. Process. Technol. 2005, 164–165, 1294–1300. [Google Scholar] [CrossRef]
- Guo, W.; Hua, L.; Mao, H.; Meng, Z. Prediction of Warpage in Plastic Injection Molding Based on Design of Experiments. J. Mech. Sci. Technol. 2012, 26, 1133–1139. [Google Scholar] [CrossRef]
- Chang, T.C.; Faison, E. Shrinkage Behavior and Optimization of Injection Molded Parts Studied by the Taguchi Method. Polym. Eng. Sci. 2001, 41, 703–710. [Google Scholar] [CrossRef]
- Abasalizadeh, M.; Hasanzadeh, R.; Mohamadian, Z.; Azdast, T.; Rostami, M. Experimental Study to Optimize Shrinkage Behavior of Semi-Crystalline and Amorphous Thermoplastics. Iran. J. Mater. Sci. Eng. 2018, 15, 41–51. [Google Scholar] [CrossRef]
- Nicolazo, C.; Vachot, P.; Sarda, A.; Deterre, R. Shrinkage Kinetics and Thermal Behaviour of Injection Moulded Polymers. Int. J. Mater. Form. 2008, 1, 1035–1038. [Google Scholar] [CrossRef]
- Wu, Y.; Gong, Y.; Cha, K.J.; Park, J.M. Effect of Microstructures on the Shrinkage of Injection Molding Product. J. Mech. Sci. Technol. 2019, 33, 1357–1363. [Google Scholar] [CrossRef]
- Janostik, V.; Stanek, M.; Senkerik, V.; Fluxa, P.; Hylova, L. Effect of the Pigment Concentration on the Dimensional Stability and the Melt Flow Index of Polycarbonate. Manuf. Technol. 2019, 19, 404–408. [Google Scholar] [CrossRef]
- Broda, J. Structure of Polypropylene Fibres Coloured with a Mixture of Pigments with Different Nucleating Ability. Polymer 2003, 44, 6943–6949. [Google Scholar] [CrossRef]
- Ariyoshi, S.; Hashimoto, S.; Ohnishi, S.; Negishi, S.; Mikami, H.; Hayashi, K.; Tanaka, S.; Hiroshiba, N. Broadband Terahertz Spectroscopy of Cellulose Nanofiber-Reinforced Polypropylenes. Mater. Sci. Eng. B 2021, 265, 115000. [Google Scholar] [CrossRef]
- Broda, J.; Baczek, M.; Fabia, J.; Binias, D.; Fryczkowski, R. Nucleating Agents Based on Graphene and Graphene Oxide for Crystallization of the β-Form of Isotactic Polypropylene. J. Mater. Sci. 2020, 55, 1436–1450. [Google Scholar] [CrossRef] [Green Version]
- Gregory, P. Industrial Applications of Phthalocyanines. J. Porphyr. Phthalocyanines 2000, 04, 432–437. [Google Scholar] [CrossRef]
- Vahur, S.; Teearu, A.; Leito, I. ATR-FT-IR Spectroscopy in the Region of 550–230 cm−1 for Identification of Inorganic Pigments. Spectrochim. Acta A Mol. Biomol. Spectrosc. 2010, 75, 1061–1072. [Google Scholar] [CrossRef]
- Müller, A. Introduction. In Coloring of Plastics; Carl Hanser Verlag GmbH & Co. KG: Munich, Germany, 2003; pp. 1–2. [Google Scholar]
- Kharchenko, S.B.; Douglas, J.F.; Obrzut, J.; Grulke, E.A.; Migler, K.B. Flow-Induced Properties of Nanotube-Filled Polymer Materials. Nat. Mater. 2004, 3, 564–568. [Google Scholar] [CrossRef]
- Marks, A.F.; Orr, P.; Mcnally, G.M.; Murphy, W.R. Effect of Pigment Type and Concentration on the Rheological Properties of Polypropylene. Dev. Chem. Eng. Miner. Process. 2008, 11, 127–136. [Google Scholar] [CrossRef]
- Cvek, M.; Paul, U.C.; Zia, J.; Mancini, G.; Sedlarik, V.; Athanassiou, A. Biodegradable Films of PLA/PPC and Curcumin as Packaging Materials and Smart Indicators of Food Spoilage. ACS Appl. Mater. Interfaces 2022, 14, 14654–14667. [Google Scholar] [CrossRef]
- Swilem, A.E.; Stloukal, P.; Abd El-Rehim, H.A.; Hrabalikova, M.; Sedlarik, V. Influence of Gamma Rays on the Physico-Chemical, Release and Antibacterial Characteristics of Low-Density Polyethylene Composite Films Incorporating an Essential Oil for Application in Food-Packaging. Food Packag. Shelf Life 2019, 19, 131–139. [Google Scholar] [CrossRef]
- Jain, S.; Goossens, J.G.P.; Peters, G.W.M.; Van Duin, M.; Lemstra, P.J. Strong Decrease in Viscosity of Nanoparticle-Filled Polymer Melts through Selective Adsorption. Soft Matter 2008, 4, 1848–1854. [Google Scholar] [CrossRef]
- Verney, V.; Michel, A. Representation of the Rheological Properties of Polymer Melts in Terms of Complex Fluidity. Rheol. Acta 1989, 28, 54–60. [Google Scholar] [CrossRef]
- Sinha Ray, S.; Okamoto, M. Polymer/Layered Silicate Nanocomposites: A Review from Preparation to Processing. Prog. Polym. Sci. 2003, 28, 1539–1641. [Google Scholar] [CrossRef]
- Alexandre, M.; Dubois, P. Polymer-Layered Silicate Nanocomposites: Preparation, Properties and Uses of a New Class of Materials. Mater. Sci. Eng. R Rep. 2000, 28, 1–63. [Google Scholar] [CrossRef]
- Kim, M.H.; Park, C.I.; Choi, W.M.; Lee, J.W.; Lim, J.G.; Park, O.O.; Kim, J.M. Synthesis and Material Properties of Syndiotactic Polystyrene/Organophilic Clay Nanocomposites. J. Appl. Polym. Sci. 2004, 92, 2144–2150. [Google Scholar] [CrossRef]
- Tyan, H.L.; Liu, Y.C.; Wei, K.H. Thermally and Mechanically Enhanced Clay/Polyimide Nanocomposite via Reactive Organoclay. Chem. Mater. 1999, 11, 1942–1947. [Google Scholar] [CrossRef]
- Cho, J.W.; Paul, D.R. Nylon 6 Nanocomposites by Melt Compounding. Polymer 2001, 42, 1083–1094. [Google Scholar] [CrossRef]
- Fu, S.-Y.; Lauke, B. Characterization of Tensile Behaviour of Hybrid Short Glass Fibre/Calcite Particle/ABS Composites. Compos. Part A Appl. Sci. Manuf. 1998, 29, 575–583. [Google Scholar] [CrossRef]
- Carli, L.N.; Crespo, J.S.; Mauler, R.S. PHBV Nanocomposites Based on Organomodified Montmorillonite and Halloysite: The Effect of Clay Type on the Morphology and Thermal and Mechanical Properties. Compos. Part A Appl. Sci. Manuf. 2011, 42, 1601–1608. [Google Scholar] [CrossRef]
- Zare, Y.; Rhee, K.Y. Multistep Modeling of Young’s Modulus in Polymer/Clay Nanocomposites Assuming the Intercalation/Exfoliation of Clay Layers and the Interphase between Polymer Matrix and Nanoparticles. Compos. Part A Appl. Sci. Manuf. 2017, 102, 137–144. [Google Scholar] [CrossRef]
- Lau, K.-T.; Gu, C.; Hui, D. A Critical Review on Nanotube and Nanotube/Nanoclay Related Polymer Composite Materials. Compos. B Eng. 2006, 37, 425–436. [Google Scholar] [CrossRef]
- Liu, X.; Qin, Y.; Zhao, S.; Dong, J.-Y. Nanocomposites-Turned-Nanoalloys Polypropylene/Multiwalled Carbon Nanotubes-Graft-Polystyrene: Synthesis and Polymer Nanoreinforcement. Ind. Eng. Chem. Res. 2021, 60, 10167–10179. [Google Scholar] [CrossRef]
- Zhang, W.; Zhang, G.; Lu, X.; Wang, J.; Wu, D. Cellulosic Nanofibers Filled Poly(β-Hydroxybutyrate): Relations between Viscoelasticity of Composites and Aspect Ratios of Nanofibers. Carbohydr. Polym. 2021, 265, 118093. [Google Scholar] [CrossRef]
- Kaur, S.; Gallei, M.; Ionescu, E. Polymer–Ceramic Nanohybrid Materials. In Organic-Inorganic Hybrid Nanomaterials; Springer: Cham, Switzerland, 2014; pp. 143–185. [Google Scholar]
- Xie, X.L.; Mai, Y.W.; Zhou, X.P. Dispersion and Alignment of Carbon Nanotubes in Polymer Matrix: A Review. Mater. Sci. Eng. R Rep. 2005, 49, 89–112. [Google Scholar] [CrossRef]
- Fu, S.Y.; Feng, X.Q.; Lauke, B.; Mai, Y.W. Effects of Particle Size, Particle/Matrix Interface Adhesion and Particle Loading on Mechanical Properties of Particulate-Polymer Composites. Compos. B Eng. 2008, 39, 933–961. [Google Scholar] [CrossRef]
- Nemati Giv, A.; Ayatollahi, M.R.; Ghaffari, S.H.; da Silva, L.F.M. Effect of Reinforcements at Different Scales on Mechanical Properties of Epoxy Adhesives and Adhesive Joints: A Review. J. Adhes. 2018, 94, 1082–1121. [Google Scholar] [CrossRef]
- Zambrano, O.A. A Review on the Effect of Impact Toughness and Fracture Toughness on Impact-Abrasion Wear. J. Mater. Eng. Perform. 2021, 30, 7101–7116. [Google Scholar] [CrossRef]
- Christie, R.; Abel, A. Phthalocyanine Green Pigments. Phys. Sci. Rev. 2021, 6, 665–669. [Google Scholar] [CrossRef]
- ISO 294-4; Plastics—Injection Moulding of Test Specimens of Thermoplastic Materials, Part 4: Determination of Moulding Shrinkage. European Committee for Standardization: Bruxelles, Belgium, 2003.


| Sample ID | D65/10° | Color (Hex) | ||
|---|---|---|---|---|
| L* | a* | b* | ||
| Neat PP | 85.20 | −0.20 | 3.41 | #F5F4F3 |
| t-PP-1 | 84.52 | −3.37 | 5.59 | #E7EAE3 |
| t-PP-3 | 82.87 | −8.46 | 9.24 | #E1E9DE |
| t-PP-5 | 80.20 | −15.99 | 14.40 | #D8E7D5 |
| o-PP-1 | 68.91 | −47.58 | 33.92 | #68C87E |
| o-PP-3 | 68.40 | −46.58 | 33.40 | #60C375 |
| o-PP-5 | 68.35 | −42.23 | 33.26 | #5DBA67 |
Disclaimer/Publisher’s Note: The statements, opinions and data contained in all publications are solely those of the individual author(s) and contributor(s) and not of MDPI and/or the editor(s). MDPI and/or the editor(s) disclaim responsibility for any injury to people or property resulting from any ideas, methods, instructions or products referred to in the content. |
© 2023 by the authors. Licensee MDPI, Basel, Switzerland. This article is an open access article distributed under the terms and conditions of the Creative Commons Attribution (CC BY) license (https://creativecommons.org/licenses/by/4.0/).
Share and Cite
Janostik, V.; Senkerik, V.; Manas, L.; Stanek, M.; Cvek, M. Injection-Molded Isotactic Polypropylene Colored with Green Transparent and Opaque Pigments. Int. J. Mol. Sci. 2023, 24, 9924. https://doi.org/10.3390/ijms24129924
Janostik V, Senkerik V, Manas L, Stanek M, Cvek M. Injection-Molded Isotactic Polypropylene Colored with Green Transparent and Opaque Pigments. International Journal of Molecular Sciences. 2023; 24(12):9924. https://doi.org/10.3390/ijms24129924
Chicago/Turabian StyleJanostik, Vaclav, Vojtech Senkerik, Lukas Manas, Michal Stanek, and Martin Cvek. 2023. "Injection-Molded Isotactic Polypropylene Colored with Green Transparent and Opaque Pigments" International Journal of Molecular Sciences 24, no. 12: 9924. https://doi.org/10.3390/ijms24129924