Article

A Network Pharmacology and Multi-Omics Combination Approach to Reveal the Effect of Strontium on Ca2+ Metabolism in Bovine Rumen Epithelial Cells

College of Veterinary Medicine, Northwest A&F University, Yangling 712100, China
*
Authors to whom correspondence should be addressed.
These authors contributed equally to this study.
Int. J. Mol. Sci. 2023, 24(11), 9383; https://doi.org/10.3390/ijms24119383
Submission received: 31 March 2023 / Revised: 10 May 2023 / Accepted: 21 May 2023 / Published: 27 May 2023

Abstract

:
Strontium (Sr) belongs to the same group in the periodic table as calcium (Ca). Sr level can serve as an index of rumen Ca absorption capacity; however, the effects of Sr on Ca2+ metabolism are unclear. This study aims to investigate the effect of Sr on Ca2+ metabolism in bovine rumen epithelial cells. The bovine rumen epithelial cells were isolated from the rumen of newborn Holstein male calves (n = 3, 1 day old, 38.0 ± 2.8 kg, fasting). The half maximal inhibitory concentration (IC50) of Sr-treated bovine rumen epithelial cells and cell cycle were used to establish the Sr treatment model. Transcriptomics, proteomics, and network pharmacology were conducted to investigate the core targets of Sr-mediated regulation of Ca2+ metabolism in bovine rumen epithelial cells. The data of transcriptomics and proteomics were analyzed using bioinformatic analysis (Gene Ontology and Kyoto Encyclopedia of genes/protein). Quantitative data were analyzed using one-way ANOVA in GraphPad Prism 8.4.3 and the Shapiro–Wilk test was used for the normality test. Results presented that the IC50 of Sr treatment bovine rumen epithelial cells for 24 h was 43.21 mmol/L, and Sr increased intracellular Ca2+ levels. Multi-omics results demonstrated the differential expression of 770 mRNAs and 2436 proteins after Sr treatment; network pharmacology and reverse transcriptase polymerase chain reaction (RT-PCR) revealed Adenosylhomocysteine hydrolase-like protein 2 (AHCYL2), Semaphoring 3A (SEMA3A), Parathyroid hormone-related protein (PTHLH), Transforming growth factor β2 (TGF-β2), and Cholesterol side-chain cleavage enzyme (CYP11A1) as potential targets for Sr-mediated Ca2+ metabolism regulation. Together these results will improve the current comprehension of the regulatory effect of Sr on Ca2+ metabolism and pave a theoretical basis for Sr application in bovine hypocalcemia.

1. Introduction

Sr, as an alkaline-earth metal, is one of the essential trace elements in the body, which plays a key role in osteoporosis treatment and prevention [1,2]. Sr belonging to the same group in the periodic table as Ca exhibits similar physicochemical characteristics but distinct bone-seeking properties [2,3,4]. Numerous studies have suggested that Sr increases bone mineral density by preventing osteoclast activation and promoting osteoblast differentiation [3,5,6]. The team’s previous research found that Sr promoted proliferation and inhibited differentiation of bovine primary chondrocytes via the TGFβ/SMAD pathway [7]. Sr plays different roles in the presence of various concentrations of Ca2+; for instance, Sr inhibits bone regeneration at low Ca2+ concentration but enhances bone regeneration under high Ca2+ concentration [8]. A previous study showed that a Ca-free medium was more efficient for bovine oocyte activation with Sr [9]. While Sr is an agonist of the calcium-sensing receptor (CaSR) and has a lower affinity than Ca2+ [10], whether it affects Ca2+ homeostasis is yet unclear.
At the onset of lactation, many cows are unable to adapt efficiently to the sudden increase in Ca demand, leading to blood Ca concentration decreases and causing hypocalcemia, thereby reducing cow performance and increasing the risk of other health disorders, such as metritis and ketosis [11,12,13,14]. In ruminants, Ca2+ homeostasis is mainly dependent on the regulation of intestinal Ca absorption, bone Ca resorption, and renal Ca reabsorption [15,16]. Ca absorption from the alimentary tract occurs in the small intestine as well as in the rumen [17]. The rumen and intestinal Ca absorption pathways are the major routes for obtaining Ca in vitro [18]. Given its chemical similarity with Ca, Sr has a similar transport and distribution pathway as Ca in the body; Sr can replace Ca in some physiological processes such as muscle contraction, blood clotting, and secretion of certain hormones [19,20]. Sr has been used as a Ca marker to measure intestinal Ca absorption [21,22]. Sr concentration in the blood plasma after an oral dose of strontium chloride (SrCl2) into the rumen can serve as an index of rumen Ca absorption capacity under different states of Ca homeostasis in sheep and dairy cows [19,23]. However, no study has investigated the effect of Sr on Ca absorption in the bovine rumen.
To explore the effect of Sr on Ca2+ metabolism in bovine rumen epithelial cells, a model of Sr treatment in bovine rumen epithelial cells was established in the present study. RNA-sequencing-based transcriptomic profiles and DIA-based proteomic profiles were used to analyze the effect of Sr on bovine rumen epithelial cells in vitro, and network pharmacology was explored to investigate its effect on Ca2+ metabolism in bovine rumen epithelial cells.

2. Results

2.1. Effect of Sr on Viability of Rumen Epithelial Cells

Rumen epithelial cells were successfully dissociated (Figure S1A) and identified by the positive expression of cytokeratin 18 (CK18) and E-cadherin (Figure S1B). The Lactate dehydrogenase (LDH) activity of cell culture supernatant was the highest on day 5, gradually decreased after day 6, and did not significantly change on day 7 (Figure S1C). This trend in the change of LDH activity correlated with the growth of rumen epithelial cells.
After treatment with different doses of Sr for 24 h, the IC50 value of rumen epithelial cells was 43.21 mmol/L (Figure 1A). Cell cycle analysis results showed that the proliferation index (PI) value was significantly increased in the 20 mmol/L doses of Sr compared to the 0 mmol/L Sr group (p < 0.01) (Figure 1B,C). Hence, the 0, 1, 10, and 20 mmol/L Sr concentrations were used for subsequent experiments.

2.2. Effect of Sr on Intracellular Ca2+ Level in Rumen Epithelial Cells

The Ca2+ staining fluorescence value was significantly increased in the 20 mmol/L Sr treatment group compared to the 0 mmol/L Sr group (p < 0.05) (Figure 1D), suggesting that the intracellular Ca2+ level had an increasing trend with increasing Sr doses.

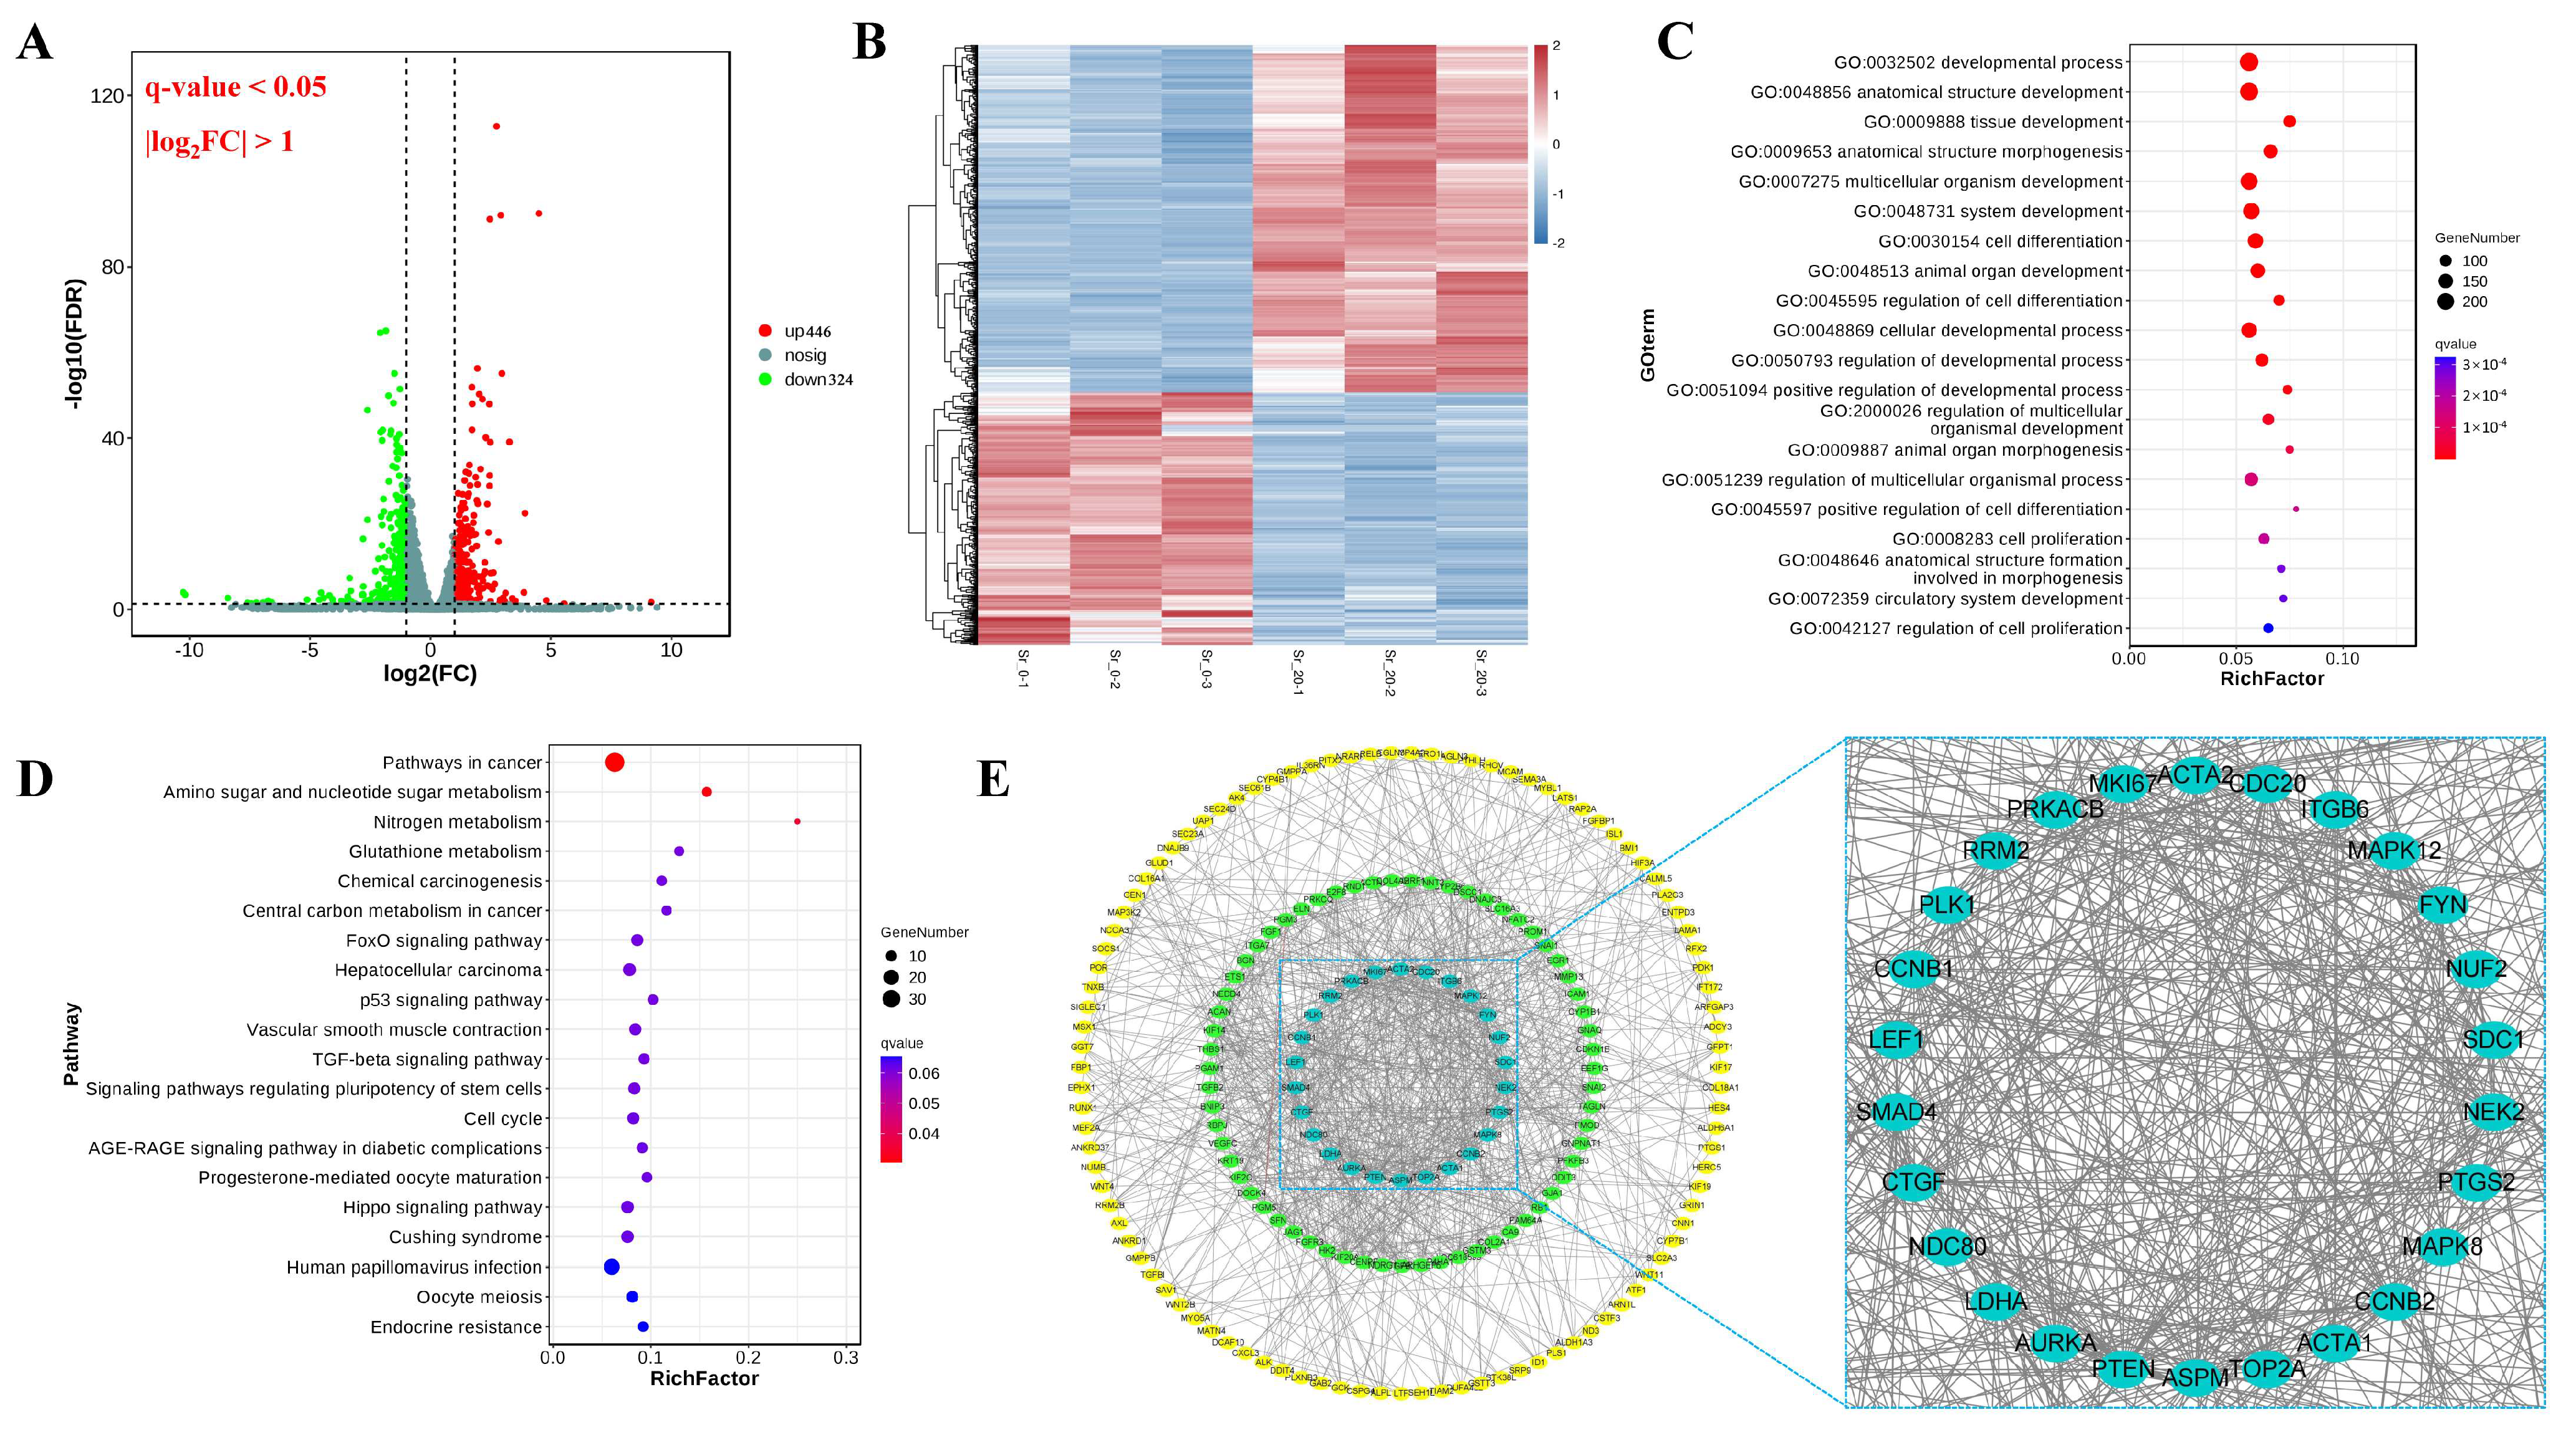
2.3. Analysis of Differentially Expressed Genes (DEGs)

After treatment with Sr, the DEGs in rumen epithelial cells were visualized using volcano plots and hierarchical clustering. In total, 770 DEGs comprising 446 upregulated and 324 downregulated genes were recorded (Figure 2A,B).
The DEGs were analyzed by Gene Ontology (GO) functional enrichment; a total of 235 GO terms were found to be significantly enriched (q-value < 0.05). The top 20 GO terms were all biological processes, such as developmental process, anatomical structure development, tissue development, anatomical structure morphogenesis, multicellular organism development, system development, and cell differentiation (Figure 2C). Kyoto Encyclopedia of Genes and Genomes database (KEGG) pathway analysis of DEGs showed that the most enriched pathways were those involved in pathways in cancer, amino sugar and nucleotide sugar metabolism, and nitrogen metabolism (q-value < 0.05) (Figure 2D). Protein-protein interaction network (PPI) analysis of the DEGs showed that a total of 130 core targets as selected by STRING and Cytoscape software (version 3.8.2) based on “betweenness”, “closeness”, and “degree” (Figure 2E).

2.4. Analysis of Differentially Expressed Proteins (DEPs)

The DEPs of rumen epithelial cells were visualized using volcano plots and hierarchical clustering, and 2436 DEPs were observed, including 1846 upregulated and 590 downregulated proteins (Figure 3A,B).
GO analysis showed that the DEPs in the Sr-treated and untreated cells were significantly enriched in 245 GO terms (q-value < 0.05). The top 20 GO terms mainly involved cellular components, including cytosol, cytoplasm, proteasome complex, cytoplasmic part, proteasome core complex, exocyst, proteasome accessory complex, and cell-substrate junction (Figure 3C). KEGG pathway analysis showed a total of 631 significantly enriched pathways (q-value < 0.05). The top 20 pathways included proteasome, purine metabolism, biosynthesis of amino acids, cysteine and methionine metabolism, amino sugar and nucleotide sugar metabolism, glycolysis/gluconeogenesis, fructose and mannose metabolism, metabolic pathways, alanine, aspartate and glutamate metabolism, and necroptosis (q-value < 0.05) (Figure 3D). The PPI of the DEPs showed a total of 400 core targets selected by STRING and Cytoscape software (version 3.8.2) based on “betweenness”, “closeness”, and “degree” (Figure 3E).

2.5. Association Analysis of the Transcriptome and Proteome

A total of 665 DEGs and 725 DEPs were displayed, including 69 molecules that were differentially expressed both at mRNA and protein levels, such as PTHLH, CA2, TGFBI, and WWC2 (Figure 4A). The number of proteins and genes enriched was the highest in quadrant 5, followed by quadrants 6, 4, 2, and 8. The proteins and genes enriched in quadrant 5 were commonly expressed without any differences. The proteins and genes enriched in quadrants 4 and 6 might be associated with post-transcriptional or translation-level regulation. DEGs and DEPs in quadrants 3 and 7 showed similar expression patterns, which might be related to the genes that were not regulated or less regulated at the level of translation after transcription. A small number of proteins and genes showed lower abundance in quadrants 1 and 9. The association analysis of transcriptome and proteome data revealed a Pearson’s correlation coefficient of 0.1869 (p-value = 0). These results explained that the abundance of most DEPs did not correlate with the corresponding transcriptional levels (Figure 4B).
The DEGs and DEPs were analyzed by GO functional enrichment, and a total of 24 GO terms were significantly enriched (q-value < 0.05). The top 20 GO terms mainly involved biological processes such as nucleotide-sugar biosynthetic process, UDP-N-acetylglucosamine biosynthetic process, amino sugar biosynthetic process, UDP-N-acetylglucosamine metabolic process, nucleotide-sugar metabolic process, and amino sugar metabolic process (Figure 4C). KEGG pathway analysis showed that the DEGs and DEPs were significantly enriched in three pathways (q-value < 0.05), including amino sugar and nucleotide sugar metabolism, metabolic pathways, and fructose and mannose metabolism (Figure 4D).

2.6. Networks and Enriched Functions in Ca2+ Metabolism-Associated Genes

A total of 1143 Ca2+ metabolism-associated genes were identified, and 9 common targets were identified between hypocalcemia, transcriptome, and proteome profiles (Figure 5A). These common targets were considered as core targets of Sr action on Ca2+ metabolism. Among these targets, the expression levels of AHCYL2, WW-and-C2-domain-containing protein 2 (WWC2), SEMA3A, PTHLH, and Carbonic anhydrase II (CA2) were significantly upregulated, and CYP11A1, Uroplakin 1b (UPK1B), TGF-β2, and Transforming growth factor, β-induced (TGFBI) were significantly downregulated in transcriptomics and proteomics (Figure 5B). These core targets showed a positive correlation in transcriptomics and proteomics (R2 = 0.9420, p < 0.01) (Figure 5C).

2.7. RT-PCR Analysis of the Effect of Sr on Targets Changes

As shown in Figure 5E, the mRNA expression levels of AHCYL2, WWC2, SEMA3A, PTHLH, and TGFBI significantly increased with the Sr concentration increase (p < 0.05, p < 0.01) at 10 and 20 mmol/L Sr doses, and the expression of UPK1B significantly increased at 1 and 10 mmol/L Sr doses (p < 0.01). The CYP11A1 expression was significantly upregulated at 1 mmol/L Sr doses (p < 0.05) and, in contrast, significantly decreased at 20 mmol/L Sr doses (p < 0.05). The TGF-β2 mRNA expression level was significantly downregulated (p < 0.01) at 10 and 20 mmol/L Sr doses (p < 0.01), while the CA2 expression level did not change significantly after Sr treatment. The RT-PCR results of CYP11A1, AHCYL2, WWC2, SEMA3A, PTHLH, and TGF-β2 were consistent with transcriptomics results. Transcriptome results of CYP11A1, AHCYL2, SEMA3A, PTHLH, and TGF-β2 were positively correlated with RT-PCR results (R2 = 0.7785, p < 0.05) (Figure 5D). The normality test results of CYP11A1, AHCYL2, UPK1B, WWC2, TGF-β2, SEMA3A, PTHLH, CA2, and TGFBI were not significantly changed (p > 0.05), and were normally distributed (Table S1). These results proved that the core targets identified by association analysis between network pharmacology, transcriptomics, and proteomics were reliable.

3. Discussion

Hypocalcemia is a metabolic disease caused by the homeostatic imbalance of blood Ca2+ concentration in cows, which impacts their health, future milk production, and reproductive performance [24,25]. Research suggests that blood plasma Sr level can be used as an index of rumen Ca absorption capacity in sheep and dairy cows [19,23]. A few studies have shown that Sr causes intracellular Ca2+ concentration oscillations generation in rats and mice [26,27]. In the present study, a model of Sr treatment bovine rumen epithelial cells was established in vitro. The intracellular Ca2+ concentration significantly increased in bovine rumen epithelial cells treated with 20 mmol/L Sr. To further explore the effect of Sr on Ca2+ homeostasis in rumen epithelial cells, the characteristics and differences of each group were comprehensively analyzed using RNA-sequencing-based transcriptomics and DIA-based proteomics. Additionally, 770 DEGs and 2436 DEPs were found in an analysis of differential expression between the control and 20 mmol/L Sr group, including 69 differential expressions molecular both in gene and protein levels; these overlapping DEGs/DEPs were mainly related to the cellular metabolism. Furthermore, the number of DEPs was more than the number of DEGs in quadrants 4 and 6, and the association between transcriptome and proteome was weak, this result suggests that the effect of Sr on rumen epithelial cells might be regulated by post-transcriptional modifications [28].
In ruminants, the maintenance of blood Ca2+ concentration mainly relies on the regulation of intestinal Ca absorption, bone Ca resorption, and renal Ca reabsorption [29]. Intestinal Ca absorption is a major pathway for external Ca intake [18]. Sr and Ca have the same mechanisms for absorption from the gastrointestinal tract and bone accumulation in the human body [29]. Stimulation of Ca absorption via transcellular transport gains can counteract hypocalcemia at the onset of lactation. Ca absorption and transport are mainly active and transcellular transport in the rumen. Transcellular transport in the epithelium is regulated by calbindin-D9K, transient receptor potential cation channel subfamily V member 5 (TRPV5), TRPV6, plasma membrane Na+/Ca2+ exchanger (NCX1), and plasma membrane Ca2+ ATPase 1b (PMCA1b). The vitamin D metabolite, 1,25-dihydroxy vitamin D3 [1,25-(OH)2D3], parathyroid hormone (PTH), and fibroblast growth factor 23 (FGF23) are prominent hormones controlling the Ca2+ balance [30,31]. In the rumen of goat, sheep, and bovine, the calbindin-D9K, TRPV5, and TRPV6 expression levels are weak or have no expression [18,32,33]. To further screen the core targets of Sr-mediated regulation of Ca2+ metabolism, in the present study, the combination of network pharmacology and multi-omics have obtained 9 cores targets as follows: PTHLH, SEMA3A, TGF-β2, TGFBI, CA2, CYP11A1, WWC2, UPK1B, and AHCYL2.
PTHLH (also called the PTHrP) is a key component in Ca2+ metabolism during pregnancy [34]. PTHLH increases chondrocyte sensitivity to 1,25(OH)2D3 by enhancing vitamin D receptor (VDR) production [35,36]. The change in PTHrP expression level was correlated with the changes in Ca2+ concentration in goat mammary epithelial cells and serum [37,38]. SEMA3A is a secreted glycoprotein that functions as a potent osteoprotective factor by synchronously inhibiting bone resorption and promoting bone formation [39]. SEMA3A treatment induces Ca2+ elevation in neurons [40,41]. TGF-β2 plays a vital role in maintaining the homeostasis of cartilage tissue and regulating chondrocyte proliferation, differentiation, and apoptosis [42]. The presence of TGF-β2 stimulates FGF23 expression and induces cellular Orai1-mediated calcium influx from extracellular space in UMR106 cells [42]. TGFBI (also known as βig-h3) is a secretory extracellular matrix protein induced by TGF-β [43], the reduction in the level of TGFBI indirectly increased the concentration of extracellular Ca2+ [44]. CA2 acts as a mediator of hormones that stimulate bone resorption and osteoclast differentiation [45]. Calcitonin increased the CA2 activity and PTH had opposite effects in the human erythrocyte [46]. The expression level of CA2 was stimulated by PTH and 1,25-(OH)2D3 [47,48]. CYP11A1, also known as cytochrome P450scc, is a member of the cytochrome P450 family of heme-containing enzymes that plays an important role in steroidogenesis [49]. CYP11A1 activates vitamin D3 to produce noncalcemic products, such as 20(OH)D3 [50]. Intracellular Ca2+ levels has negatively correlated with CYP11A1 [51]. There is no published literature on how WWC2, UPK1B, and AHCYL2 regulate Ca2+ metabolism. In this study, PTHLH, SEMA3A, CYP11A1, and TGF-β2 expression was consistent in RT-PCR and transcriptomics, the UPK1B, CA2, and TGFBI expression levels are incompatible with transcriptomics, probably owing to the interference of duplication on the quantitative results of sequencing. The differences in AHCYL2, SEMA3A, PTHLH, TGF-β2, and CYP11A1 gene expression levels and coefficients between the RNA-sequencing and RT-PCR results may reflect the underlying targets of Sr-mediated Ca2+ metabolism regulation. The molecular mechanisms of these molecules mediated by Sr in Ca2+ metabolism regulation require further investigation.
In conclusion, the RNA-sequencing-based transcriptomic profiles and DIA-based proteomics profiles of Sr-treated bovine rumen epithelial cells revealed 770 DEGs and 2436 DEPs. The most highly expressed genes and proteins were involved in metabolism. The combined network pharmacology analysis and RT-PCR validation revealed 5 core targets that were potentially involved in the Sr-mediated Ca2+ metabolism regulation, namely, AHCYL2, SEMA3A, PTHLH, TGF-β2, and CYP11A1. The results of this study will help to understand the regulatory effect of Sr on Ca2+ metabolism and provide a theoretical basis for Sr application in bovine hypocalcemia.

4. Materials and Methods

4.1. Isolation and Culture of Primary Bovine Rumen Epithelial Cells

The rumen tissue was collected from newborn Holstein male calves (n = 3, 38.0 ± 2.8 kg body weight) within 15 min after euthanasia, serial trypsin digestions were used to isolate primary bovine ruminal epithelial cells as previously described [52,53]. The collected rumen tissue was washed several times with ice-cold 0.9% (w/v) sodium chloride (NaCl, pH 7.0) until no visible rumen contents remained. The rumen epithelium was bluntly dissected, washed twice with phosphate-buffered saline (PBS) containing penicillin (2500 U/mL) and streptomycin (2500 mg/mL) for 30 min at 37 °C, and then washed with PBS containing amphotericin B (1000 U/mL) and gentamicin (12 µg/mL) for 30 min at 37 °C. The rumen epithelium was aseptically cut into small pieces (3–4 cm2), washed with PBS, and subjected to serial trypsinization (Sigma, St. Louis, MO, USA) with trypsin-ethylenediaminetetraacetic acid (EDTA) solution (0.25% trypsin and 0.02% EDTA-Na2) at 37 °C. The trypsin-EDTA solution was freshly replaced every 8 min; the first fraction of the supernatant was discarded, and the subsequent four fractions were separately strained through 50-mesh and centrifuged for 10 min at 180× g at 25 °C. The obtained ruminal epithelium cell pellets were resuspended in Dulbecco’s modified eagle medium (DMEM) and analyzed for cell viability using trypan blue. Finally, the cell density was adjusted to 1 × 10⁶ cells/mL, and the cells were seeded into 6-well cell culture plates (2 mL per well), 96-well cell culture plates (0.1 mL per well), and 24-well cell culture plates (1 mL per well) and incubated at 37 °C in 5% CO2 in a humidified incubator (Thermo Fisher Scientific, Waltham, MA, USA). The medium was replaced every 2 days. The animal experimental protocol adopted in this study was approved by the Ethics Committee on the Use and Care of Animals at Northwest A&F University (Yangling, China) and was conducted in accordance with the university’s guidelines for animal research (Approval No. 2021049).

4.2. Identification of Primary Bovine Rumen Epithelial Cells

The cells were grown at 50–60% confluency on the coverslips and then fixed with 4% paraformaldehyde, washed thrice with PBS, permeabilized with 0.02% Triton X-100, and blocked for 40 min with bovine serum albumin. The coverslips were washed thrice and incubated with primary antibodies specific for CK18 (BOSTER, Wuhan, China) and E-cadherin (Abways, Shanghai, China) overnight at 4 °C. Following incubation, the coverslips were probed with suitable secondary antibodies for 4 h at 25 °C, washed thrice with PBS, and strained with 4′,6-diamidino-2-phenylindole (DAPI, Sigma, St. Louis, MO, USA) nuclear stain. The coverslips were rinsed again, sealed with an anti-fluorescence quencher, and photographed using a fluorescence microscope (Nikon, Ni-U, Nagasaki, Japan).

4.3. LDH Activities Analysis

Membrane integrity was assessed by LDH activity [54]. After the cells were seeded into 24-well plates, the medium was collected daily for 7 consecutive days. The absorbance was measured at 450 nm wavelength according to the manufacturer’s protocol (Nanjing Jiancheng, Nanjing, China), and the LDH activity was calculated according to the following equation: LDH activity (U/L) = (ODexperiment − ODcontrol)/(ODstandard − ODblank) × standard sample concentration × 1000.

4.4. Cell Viability Analysis

Primary bovine rumen epithelial cells were cultured up to 80% confluency, and the medium was replaced with fresh medium containing different doses of Sr (0, 0.1, 0.5, 1, 5, 10, 20, 50, 100, and 300 mmol/L) for 24 h at 37 °C in a 5% CO2 atmosphere. Each well was then treated with Cell Counting Kit-8 (CCK-8, ZETA LIFE, Menlo Park, CA, USA) at 37 °C in a 5% CO2 atmosphere for 4 h, and the absorbance was measured at 450 nm. The cell inhibition was calculated according to the following formula: cell inhibition = 1 − [(ODdrug − ODblank/ODcontrol − ODblank) × 100%]. The IC50 value was calculated by using the GraphPad Prism 8.4.3.

4.5. Cell Cycle Analysis

After treatment with Sr, bovine rumen epithelial cells were harvested with 0.25% trypsin-EDTA and fixed with 70% ethyl alcohol overnight at −20 °C; then, the cells were stained with 0.5 mL of propidium iodide/RNase staining buffer (BD Pharmingen™, Franklin Lakes, NJ, USA) for 15 min at 25 °C. Stained cells were immediately analyzed for propidium iodide fluorescence using flow cytometry (Coulter-XL). Cell cycle analysis was performed using the Cell Cycle platform in ModFit 3.0, and the PI was calculated according to the following formula: PI = (S + G2/M)/(S + G2/M + G0/G1) [55].

4.6. Intracellular Ca2+ Analysis

After treatment with Sr, bovine rumen epithelial cells were washed thrice with PBS and incubated with Fluo-4 AM (2 μm, Beyotime, Shanghai, China) for 4 h at 37 °C; then, the cells were incubated for 4 h at 37 °C after being washed thrice. Finally, fluorescence was measured on a multimode microplate reader (Tecan Spark, Männedorf, Switzerland).

4.7. RNA Extraction and RNA-Sequencing

Total RNA was extracted using the TRIzol reagent kit (Invitrogen, Carlsbad, CA, USA) from bovine rumen epithelial cells according to the manufacturer’s protocol. RNA quality was assessed on an Agilent 2100 Bioanalyzer (Agilent Technologies, Palo Alto, CA, USA) and checked using an RNase-free agarose gel. Total RNA was used to prepare a separate Poly-A isolated, strand-specific cDNA Library using NEBNext Ultra RNA Library Prep Kit (NEB #7530, New England Biolabs, Ipswich, MA, USA). The prepared cDNA was purified with AMPure XP Beads (1.0×) and sequenced on Illumina Novaseq6000 by Gene Denovo Biotechnology Co., (Guangzhou, China). The raw Illumina sequencing data were archived in the National Centre for Biotechnology Information-Sequence Read Archive (NCBI SRA, https://www.ncbi.nlm.nih.gov/sra accessed on 30 October 2022) under the accession number SUB12106664.

4.8. Protein Extraction and DIA Labelling

Total proteins were extracted from bovine rumen epithelial cells by the cold acetone treatment method, and protein quality was determined by the bicinchoninic acid (BCA) protein assay kit and examined using sodium dodecyl sulfate-polyacrylamide gel electrophoresis (SDS-PAGE). The proteins extracted from cells were reduced by dithiothreitol at 55 °C for 1 h, alkylated by iodoacetamide in the dark at 37 °C for 1 h, and digested to peptides at 37 °C for 16 h. The peptide mixture was re-dissolved in solvent A (A: 0.1% formic acid in water) and analyzed by on-line nano spray liquid chromatography-tandem mass spectrometry (LC-MS/MS) on an Orbitrap Fusion Lumos coupled to EASY-nLC 1200 system (Thermo Fisher Scientific, Waltham, MA, USA); the peptide sample was loaded onto an analytical column (Acclaim PepMap C18, 75 μm × 25 cm) with a 120 min gradient from 5% to 35% B (B: 0.1% formic acid in ACN). Finally, the column flow rate was maintained at 200 nL/min at a column temperature of 40 °C, and the electrospray voltage of 2 kV versus the inlet of the mass spectrometer was used. The mass spectrometer was run under a data-independent acquisition mode and automatically switched between MS and MS/MS mode. These experimental procedures and data analysis were performed by Gene Denovo Biotechnology Co., (Guangzhou, China).

4.9. Identification of Ca2+ Metabolism-Related Targets

With hypocalcemia as the keywords, Ca2+ metabolism-related targets were obtained from the GeneCards database (https://www.genecards.org/ accessed on 20 May 2022), Online Mendelian Inheritance in Man (OMIM) database (https://omim.org/ accessed on 20 May 2022), Therapeutic Target Database (TTD) (http://db.idrblab.net/ttd/ accessed on 20 May 2022), and DisGeNET database (https://www.disgenet.org/ accessed on 20 May 2022). The core targets of Ca2+ metabolism were obtained from transcriptome, proteome, and network pharmacology analyses.

4.10. Real-Time Polymerase Chain Reaction (RT-PCR)

Total RNA was extracted from Sr-treated cells using TRIzol reagent, and its concentration and purity were measured by an ultra-micro ultraviolet spectrophotometer (NanoDrop one, Thermo, Waltham, MA, USA). Then, cDNA was synthesized from total RNA by using reverse transcriptase. RT-PCR was performed with SYBR® Premix Ex Taq™ (Perfect Real Time) Kit using CFX Connect Real-Time PCR System (Bio-Rad, Hercules, CA, USA). All primers were designed to span an exon-exon junction to avoid genomic DNA. The primers information is shown in Table 1. The 2−ΔΔCT method was used to analyze the relative expression levels of genes.

4.11. Statistical Analysis

Differential expression for gene and protein obtained: clean data (clean reads) were obtained by fastp (version 0.18.0), and aligned with the reference genome mapped to the Bos taurus reference genome (Ensembl_release104) using HISAT2. 2.4 software (http://www.ccb.jhu.edu/software/hisat/ accessed on 15 August 2021). The mapped reads of each sample were assembled using StringTie v1.3.1 (https://ccb.jhu.edu/software/stringtie/ accessed on 15 August 2021) in a reference-based approach. For each transcription region, a fragment per kilobase of transcript per million mapped reads (FPKM) value was calculated to quantify its expression abundance and variations, using RSEM software [56]. RNA differential expression analysis was performed with DESeq2 (version 1.40. 1) software between the 0 mmol/L (Sr-0) and 20 mmol/L (Sr-20) Sr treatment groups. DEGs were identified with a false discovery rate (FDR, q-value) < 0.05 and log2 fold change (FC) (|log2FC| > 1). Statistically significant DEGs were illustrated using volcano plot analysis and visualized by hierarchical clustering analysis.
Raw DIA-MS data were processed and analyzed by Spectronaut X software (Biognosys AG, Switzerland) with default parameters. The retention time prediction type was set to dynamic iRT. The protein was qualitatively analyzed using a 1% q-value (FDR) cutoff on precursor and protein levels, and quantitative analyzed using the 1% q-value cutoff on the average top three filtered peptides. DEPs were analyzed by the Student’s t-test and Benjamini–Hochberg (BH), according to an absolute FC > 1.5 and q-value < 0.05 (Student’s t-test) as the screening criteria. The R package was used to generate Venn, heatmaps, and hierarchically clustered differential proteins based on normalized values.
GO and KEGG pathway enrichment analyses: gene function enrichment analysis (http://www.omicshare.com/ accessed on 23 August 2021) was performed using GO and Kyoto Encyclopedia of KEGG by the cluster Profiler R package, and q-value < 0.05 was used to indicate significantly enriched GO functions and KEGG pathways.
Enrichment analysis of DEPs was based on KEGG and GO databases (http://www.omicshare.com/ accessed on 10 September 2021), and a q-value < 0.05 indicated significantly enriched GO functions and KEGG pathways. The Rich factor in gene function enrichment analysis was calculated according to the number of genes in each category divided by the total number of genes in the category.
A PPI was generated using STRING (https://cn.string-db.org/ accessed on 10 September 2022) and Cytoscape software (version 3.8.2) to present the core and the biological interaction of hub genes.
Quantitative data analysis: statistical analyses were performed using one-way analysis of variance (ANOVA). The Shapiro–Wilk test was used for the normality test. All data are presented as the mean ± standard error of means (SEM). p < 0.05 was considered statistically significant. Each experiment was independently repeated at least thrice.

5. Conclusions

This study found the underlying targets of Sr-mediated Ca2+ metabolism regulation, namely, AHCYL2, SEMA3A, PTHLH, TGF-β2, and CYP11A1. These results will improve the current understanding of the regulatory effect of Sr on Ca2+ metabolism and provide a theoretical basis for Sr application in bovine hypocalcemia.

Supplementary Materials

The supporting information can be downloaded at: https://www.mdpi.com/article/10.3390/ijms24119383/s1.

Author Contributions

P.T.: designed and performed the experiments, and wrote the original draft; Z.Z., L.M. and F.Z.: performed and assisted with the experiment. Y.K., Y.W. and Y.D.: analyzed data; C.Z., B.Z. and J.W.: designed the experiments and revised the manuscript. All authors have read and agreed to the published version of the manuscript.

Funding

This work was supported by the National Natural Science Foundation of China (grant numbers 32273085, 32102742) and the Key Research and Development Program of Shaanxi (grant numbers 2021NY-022).

Institutional Review Board Statement

The animal experimental protocol adopted in this study was approved by the Ethics Committee on the Use and Care of Animals at Northwest A&F University (Yangling, China) and was conducted in accordance with the university’s guidelines for animal research (Approval No. 2021049).

Informed Consent Statement

Not applicable.

Data Availability Statement

The datasets presented in this study can be found in online repositories. The names of the National Centre for Biotechnology Information-Sequence Read Archive (NCBI SRA) can be found below: https://www.ncbi.nlm.nih.gov/sra (accessed on 30 October 2022), SUB12106664.

Acknowledgments

The authors would like to thank the support of the China National Natural Science Foundation and Department of Science and Technology of Shaanxi Province, and thank the editors and reviewers for their critical reading and constructive suggestions.

Conflicts of Interest

The authors declare no conflict of interest.

References

  1. Peng, Y.; Ma, F.; Hu, L.; Deng, Y.; He, W.; Tang, B. Strontium based Astragalus polysaccharides promote osteoblasts differentiation and mineralization. Int. J. Biol. Macromol. 2022, 205, 761–771. [Google Scholar] [CrossRef] [PubMed]
  2. You, J.; Zhang, Y.; Zhou, Y. Strontium Functionalized in Biomaterials for Bone Tissue Engineering: A Prominent Role in Osteoimmunomodulation. Front. Bioeng. Biotechnol. 2022, 10, 928799. [Google Scholar] [CrossRef] [PubMed]
  3. Cheshmedzhieva, D.; Ilieva, S.; Permyakov, E.A.; Permyakov, S.E.; Dudev, T. Ca2+/Sr2+ Selectivity in Calcium-Sensing Receptor (CaSR): Implications for Strontium’s Anti-Osteoporosis Effect. Biomolecules 2021, 11, 1576. [Google Scholar] [CrossRef]
  4. Petar Jovanović, S.R.; Roitman, N.; Erel, R. Strontium as a tracer for calcium: Uptake, transport and partitioning within tomato plants. Plant Soil. 2021, 466, 303–316. [Google Scholar] [CrossRef]
  5. Vologzhannikova, A.A.; Shevelyova, M.P.; Kazakov, A.S.; Sokolov, A.S.; Borisova, N.I.; Permyakov, E.A.; Kircheva, N.; Nikolova, V.; Dudev, T.; Permyakov, S.E. Strontium Binding to alpha-Parvalbumin, a Canonical Calcium-Binding Protein of the “EF-Hand” Family. Biomolecules 2021, 11, 1158. [Google Scholar] [CrossRef]
  6. Wu, Q.; Hu, L.; Yan, R.; Shi, J.; Gu, H.; Deng, Y.; Jiang, R.; Wen, J.; Jiang, X. Strontium-incorporated bioceramic scaffolds for enhanced osteoporosis bone regeneration. Bone Res. 2022, 10, 55. [Google Scholar] [CrossRef]
  7. Liu, S.; Shen, B.; Loor, J.J.; Jiang, Q.; Yuan, Y.; Kong, Y.; Tan, P.; Zeng, F.; Zhao, C.; Zhu, X.; et al. Strontium Regulates the Proliferation and Differentiation of Isolated Primary Bovine Chondrocytes via the TGFβ/SMAD Pathway. Front. Pharmacol. 2022, 13, 925302. [Google Scholar] [CrossRef]
  8. Xie, H.; Gu, Z.; He, Y.; Xu, J.; Xu, C.; Li, L.; Ye, Q. Microenvironment construction of strontium-calcium-based biomaterials for bone tissue regeneration: The equilibrium effect of calcium to strontium. J. Mater. Chem. B 2018, 6, 2332–2339. [Google Scholar] [CrossRef]
  9. Meo, S.C.; Yamazaki, W.; Leal, C.L.V.; de Oliveira, J.A.; Garcia, J.M. Use of strontium for bovine oocyte activation. Theriogenology. 2005, 63, 2089–2102. [Google Scholar] [CrossRef]
  10. Coulombe, J.; Faure, H.; Robin, B.; Ruat, M. In vitro effects of strontium ranelate on the extracellular calcium-sensing receptor. Biochem. Biophys. Res. Commun. 2004, 323, 1184–1190. [Google Scholar] [CrossRef] [PubMed]
  11. Nedic, S.; Palamarevic, M.; Arsic, S.; Jovanovic, L.; Prodanovic, R.; Kirovski, D.; Vujanac, I. Parathyroid hormone response in treatment of subclinical hypocalcemia in postpartum dairy cows. Res. Vet. Sci. 2020, 132, 351–356. [Google Scholar] [CrossRef] [PubMed]
  12. Fu, Y.; Colazo, M.G.; De Buck, J. Development of a blood calcium test for hypocalcemia diagnosis in dairy cows. Res. Vet. Sci. 2022, 147, 60–67. [Google Scholar] [CrossRef] [PubMed]
  13. Barraclough, R.A.C.; Shaw, D.J.; Thorup, V.M.; Haskell, M.J.; Lee, W.; Macrae, A.I. The behavior of dairy cattle in the transition period: Effects of blood calcium status. J. Dairy. Sci. 2020, 103, 10604–10613. [Google Scholar] [CrossRef] [PubMed]
  14. Hendriks, S.J.; Huzzey, J.M.; Kuhn-Sherlock, B.; Turner, S.A.; Mueller, K.R.; Phyn, C.V.C.; Donaghy, D.J.; Roche, J.R. Associations between lying behavior and activity and hypocalcemia in grazing dairy cows during the transition period. J. Dairy Sci. 2020, 103, 10530–10546. [Google Scholar] [CrossRef] [PubMed]
  15. Serrenho, R.C.; DeVries, T.J.; Duffield, T.F.; LeBlanc, S.J. Graduate Student Literature Review: What do we know about the effects of clinical and subclinical hypocalcemia on health and performance of dairy cows? J. Dairy Sci. 2021, 104, 6304–6326. [Google Scholar] [CrossRef]
  16. Hernandez-Castellano, L.E.; Hernandez, L.L.; Bruckmaier, R.M. Review: Endocrine pathways to regulate calcium homeostasis around parturition and the prevention of hypocalcemia in periparturient dairy cows. Animal 2020, 14, 330–338. [Google Scholar] [CrossRef]
  17. Wadhwa, D.R.; Care, A.D. Effects of strontium on the absorption of calcium, magnesium and phosphate ions from the ovine reticulo-rumen. J. Comp. Physiol. B 2000, 170, 225–229. [Google Scholar] [CrossRef]
  18. Wilkens, M.R.; Mrochen, N.; Breves, G.; Schroder, B. Gastrointestinal calcium absorption in sheep is mostly insensitive to an alimentary induced challenge of calcium homeostasis. Comp. Biochem. Phys. B 2011, 158, 199–207. [Google Scholar] [CrossRef]
  19. Hyde, M.L.; Fraser, D.R. In vivo measurement of the absorption of strontium in the rumen and small intestine of sheep as an index of calcium absorption capacity. Br. J. Nutr. 2014, 112, 718–724. [Google Scholar] [CrossRef]
  20. Kolodziejska, B.; Stepien, N.; Kolmas, J. The Influence of Strontium on Bone Tissue Metabolism and Its Application in Osteoporosis Treatment. Int. J. Mol. Sci. 2021, 22, 6564. [Google Scholar] [CrossRef]
  21. Dijkgraaf-ten Bolscher, M.; Netelenbos, J.C.; Barto, R.; van der Vijgh, W.J.F. Strontium as a marker for intestinal calcium absorption: The stimulatory effect of calcitriol. Clin. Chem. 2000, 46, 248–251. [Google Scholar] [CrossRef] [PubMed]
  22. Vezzoli, G.; Baragetti, I.; Zerbi, S.; Caumo, A.; Soldati, L.; Bellinzoni, P.; Centemero, A.; Rubinacci, A.; Moro, G.; Bianchi, G. Strontium absorption and excretion in normocalciuric subjects: Relation to calcium metabolism. Clin. Chem. 1998, 44, 586–590. [Google Scholar] [CrossRef]
  23. Hyde, M.L.; Wilkens, M.R.; Fraser, D.R. In vivo measurement of strontium absorption from the rumen of dairy cows as an index of calcium absorption capacity. J. Dairy Sci. 2019, 102, 5699–5705. [Google Scholar] [CrossRef] [PubMed]
  24. Suzuki, K.; Kondo, N.; Takagi, K.; Nishikawa, A.; Murakami, Y.; Otsuka, M.; Tsukano, K.; Ikeda, K.; Funakura, H.; Yasutomi, I.; et al. Validation of the bovine blood calcium checker as a rapid and simple measuring tool for the ionized calcium concentration in cattle. J. Vet. Med. Sci. 2021, 83, 767–774. [Google Scholar] [CrossRef] [PubMed]
  25. Ceciliani, F.; Lecchi, C.; Urh, C.; Sauerwein, H. Proteomics and metabolomics characterizing the pathophysiology of adaptive reactions to the metabolic challenges during the transition from late pregnancy to early lactation in dairy cows. J. Proteom. 2018, 178, 92–106. [Google Scholar] [CrossRef]
  26. Tomashov-Matar, R.; Tchetchik, D.; Eldar, A.; Kaplan-Kraicer, R.; Oron, Y.; Shalgi, R. Strontium-induced rat egg activation. Reproduction 2005, 130, 467–474. [Google Scholar] [CrossRef]
  27. Storey, A.; Elgmati, K.; Wang, Y.; Knaggs, P.; Swann, K. The role of ATP in the differential ability of Sr2+ to trigger Ca2+ oscillations in mouse and human eggs. Mol. Hum. Reprod. 2021, 27, gaaa086. [Google Scholar] [CrossRef]
  28. Wang, G.; Li, H.; Wang, K.; Yang, J.; Duan, M.; Zhang, J.; Ye, N. Regulation of gene expression involved in the remobilization of rice straw carbon reserves results from moderate soil drying during grain filling. Plant J. 2020, 101, 604–618. [Google Scholar] [CrossRef]
  29. Coelho, I.; Castanheira, I.; Bordado, J.M.; Donard, O.; Silva, J.A.L. Recent developments and trends in the application of strontium and its isotopes in biological related fields. Trac-Trend Anal. Chem. 2017, 90, 45–61. [Google Scholar] [CrossRef]
  30. Meyer-Binzegger, M.; Ollagnier, C.; Eggerschwiler, L.; Buhler, K.; Meylan, M.; Schlegel, P. Potential of a rumen bolus containing 1,25-dihydroxyvitamin D3 glycosides for the prevention of hypocalcaemia in primiparous and multiparous dairy cows. Animal 2022, 16, 100414. [Google Scholar] [CrossRef]
  31. Chuang, G.T.; Liu, P.H.; Chyan, T.W.; Huang, C.H.; Huang, Y.Y.; Lin, C.H.; Lin, J.W.; Hsu, C.N.; Tsai, R.Y.; Hsieh, M.L.; et al. Genome-wide association study for circulating fibroblast growth factor 21 and 23. Sci. Rep. 2020, 10, 14578. [Google Scholar] [CrossRef] [PubMed]
  32. Rosendahl, J.; Braun, H.S.; Schrapers, K.T.; Martens, H.; Stumpff, F. Evidence for the functional involvement of members of the TRP channel family in the uptake of Na (+) and NH4 (+) by the ruminal epithelium. Pflug. Arch. Eur. J. Phy. 2016, 468, 1333–1352. [Google Scholar] [CrossRef] [PubMed]
  33. Geiger, S.; Patra, A.K.; Schrapers, K.T.; Braun, H.S.; Aschenbach, J.R. Menthol stimulates calcium absorption in the rumen but not in the jejunum of sheep. J. Dairy Sci. 2021, 104, 3067–3081. [Google Scholar] [CrossRef] [PubMed]
  34. VanHouten, J.N.; Dann, P.; Stewart, A.F.; Watson, C.J.; Pollak, M.; Karaphs, A.C.; Wysolmerski, J.J. Mammary-specific deletion of parathyroid hormone-related protein preserves bone mass during lactation. J. Clin. Investig. 2003, 112, 1429–1436. [Google Scholar] [CrossRef]
  35. Bach, F.C.; Rutten, K.; Hendriks, K.; Riemers, F.M.; Cornelissen, P.; de Bruin, A.; Arkesteijn, G.J.; Wubbolts, R.; Horton, W.A.; Penning, L.C.; et al. The Paracrine Feedback Loop Between Vitamin D3 (1,25(OH)2D3) and PTHrP in Prehypertrophic Chondrocytes. J. Cell. Physiol. 2014, 229, 1999–2014. [Google Scholar] [CrossRef]
  36. Okazaki, T.; Nishimori, S.; Ogata, E.; Fujita, T. Vitamin D-dependent recruitment of DNA-PK to the chromatinized negative vitamin D response element in the PTHrP gene is required for gene repression by vitamin D. Biochem. Bioph Res. Commun. 2003, 304, 632–637. [Google Scholar] [CrossRef]
  37. Zang, W.J.; Li, H.; Zhang, Z.F.; QuZhen, R.; CuoMu, Y.Z.; Zhang, D.K.; Luo, J.; Loor, J.J.; Zheng, H.L. Serotonin induces parathyroid hormone-related protein in goat mammary gland. J. Anim. Sci. 2018, 96, 1010–1016. [Google Scholar] [CrossRef]
  38. Zhang, Z.; Du, W.; Liu, W.; Wong, B.T.; Zheng, H. Increasing serotonin concentrations alter calcium metabolism in periparturient dairy goats. J. Anim. Sci. 2022, 100, skac065. [Google Scholar] [CrossRef]
  39. Kim, J.M.; Lin, C.J.; Stavre, Z.; Greenblatt, M.B.; Shim, J.H. Osteoblast-Osteoclast Communication and Bone Homeostasis. Cells 2020, 9, 2073. [Google Scholar] [CrossRef]
  40. Yamane, M.; Yamashita, N.; Yamamoto, H.; Iizuka, A.; Shouji, M.; Usui, H.; Goshima, Y. Semaphorin3A facilitates axonal transport through a local calcium signaling and tetrodotoxin-sensitive voltage-gated sodium channels. Biochem. Bioph Res. Commun. 2012, 422, 333–338. [Google Scholar] [CrossRef]
  41. Treinys, R.; Kaselis, A.; Jover, E.; Bagnard, D.; Satkauskas, S. R-Type Calcium Channels Are Crucial for Semaphorin 3A-Induced DRG Axon Growth Cone Collapse. PloS ONE 2014, 9, e102357. [Google Scholar] [CrossRef] [PubMed]
  42. Duan, M.; Wang, Q.; Liu, Y.; Xie, J. The role of TGF-beta2 in cartilage development and diseases. Bone Jt. Res. 2021, 10, 474–487. [Google Scholar] [CrossRef] [PubMed]
  43. Kim, H.J.; Ahn, D.; Park, T.I.; Jeong, J.Y. TGFBI Expression Predicts the Survival of Patients with Oropharyngeal Squamous Cell Carcinoma. In Vivo 2020, 34, 3005–3012. [Google Scholar] [CrossRef]
  44. Guo, Y.S.; Tang, J.; Chen, B.; Huang, W.; Li, Y.; Cui, H.Y.; Zhang, X.; Wang, S.J.; Chen, Z.N.; Jiang, J.L. βig-h3 regulates store-operated Ca2+ entry and promotes the invasion of human hepatocellular carcinoma cells. Cell Biol. Int. 2011, 35, 811–817. [Google Scholar] [CrossRef] [PubMed]
  45. Riihonen, R.; Supuran, C.T.; Parkkila, S.; Pastorekova, S.; Vaananen, H.K.; Laitala-Leinonen, T. Membrane-bound carbonic anhydrases in osteoclasts. Bone 2007, 40, 1021–1031. [Google Scholar] [CrossRef] [PubMed]
  46. Arlot-Bonnemains, Y.; Fouchereau-Peron, M.; Moukhtar, M.S.; Benson, A.A.; Milhaud, G. Calcium-regulating hormones modulate carbonic anhydrase II in the human erythrocyte. Proc. Natl. Acad. Sci. USA 1985, 82, 8832–8834. [Google Scholar] [CrossRef] [PubMed]
  47. Lehenkari, P.; Hentunen, T.A.; Laitala-Leinonen, T.; Tuukkanen, J.; Vaananen, H.K. Carbonic anhydrase II plays a major role in osteoclast differentiation and bone resorption by effecting the steady state intracellular pH and Ca2+. Exp. Cell Res. 1998, 242, 128–137. [Google Scholar] [CrossRef]
  48. Hillstrom Shapiro, L.; Venta, P.J.; Yu, Y.S.; Tashian, R.E. Carbonic anhydrase II is induced in HL-60 cells by 1,25-dihydroxyvitamin D3: A model for osteoclast gene regulation. FEBS Lett. 1989, 249, 307–310. [Google Scholar] [CrossRef]
  49. Slominski, R.M.; Raman, C.; Elmets, C.; Jetten, A.M.; Slominski, A.T.; Tuckey, R.C. The significance of CYP11A1 expression in skin physiology and pathology. Mol. Cell Endocrinol. 2021, 530, 111238. [Google Scholar] [CrossRef]
  50. Chaiprasongsuk, A.; Janjetovic, Z.; Kim, T.K.; Tuckey, R.C.; Li, W.; Raman, C.; Panich, U.; Slominski, A.T. CYP11A1-derived vitamin D3 products protect against UVB-induced inflammation and promote keratinocytes differentiation. Free. Radic. Biol. Med. 2020, 155, 87–98. [Google Scholar] [CrossRef]
  51. Ma, Y.; Gong, Y.J.; Xu, Q.Q.; Zou, X. Molecular mechanism of mercuric chloride inhibiting progesterone secretion in ovarian granulosa cells of laying hens. J. Anim. Physiol. Anim. Nutr. 2018, 102, 1533–1542. [Google Scholar] [CrossRef] [PubMed]
  52. Zhao, C.X.; Wang, Y.Z.; Peng, Z.C.; Sun, X.D.; Sun, G.Q.; Yuan, X.; Li, X.W.; Liu, G.W. Subacute ruminal acidosis suppressed the expression of MCT1 in rumen of cows. J. Cell. Physiol. 2019, 234, 11734–11745. [Google Scholar] [CrossRef]
  53. Zhao, C.X.; Bobe, G.; Wang, Y.Z.; Zhang, X.Y.; Zhao, Z.B.; Zhang, S.Q.; Sun, G.Q.; Yuan, X.; Li, X.W.; Liu, G.W. Potential Role of SLC5A8 Expression in the Etiology of Subacute Ruminal Acidosis. Front. Vet. Sci. 2020, 7, 394. [Google Scholar] [CrossRef]
  54. Zhang, H.X.; Birch, J.; Pei, J.J.; Ahmed, I.A.M.; Yang, H.Y.; Dias, G.; Abd El-Aty, A.M.; Bekhit, A.E. Identification of Six Phytochemical Compounds from Asparagus officinalis L. Root Cultivars from New Zealand and China Using UAE-SPE-UPLC-MS/MS: Effects of Extracts on H2O2-Induced Oxidative Stress. Nutrients 2019, 11, 107. [Google Scholar] [CrossRef]
  55. Ming, J.; Wu, S.L.; You, T.Z.; Wang, X.L.; Yu, C.; Luo, P.; Zhang, A.H.; Pan, X.L. Histone Deacetylation in the Promoter of p16 Is Involved in Fluoride-Induced Human Osteoblast Activation via the Inhibition of Sp1 Binding. Biol. Trace Elem. Res. 2019, 188, 373–383. [Google Scholar] [CrossRef] [PubMed]
  56. Li, B.; Dewey, C.N. RSEM: Accurate transcript quantification from RNA-Seq data with or without a reference genome. BMC Bioinform. 2011, 12, 323. [Google Scholar] [CrossRef] [PubMed]
Figure 1. The analyses of IC50, cell cycle, and intracellular Ca2+ level treatment with Sr. (A) After 24 h of treatment with Sr, the IC50 of rumen epithelial cells was 43.21 mmol/L. (B) Percentages of the cell population distributing in the G0/G1, S, and G2/M phases. (C) Comparison of the proliferation index in different groups. (D) The fluorescence value of Ca2+ staining was significantly increased in the 20 mmol/L Sr treatment group, and showed an increasing trend with an increase Sr dose in bovine rumen epithelial cells; * p < 0.05, ** p < 0.01 as compared to the 0 mmol/L Sr treatment group.
Ijms 24 09383 g001
Figure 2. Transcriptomics profile comparison between control group (Sr-0) and Sr treatment group (Sr-20). (A) Volcano plot of the fold change and statistical significance. (B) Heatmap showed the changes in the expression pattern of DEGs. (C) GO enrichment analysis of DEGs; the top 20 significant enrichment pathways were listed. (D) KEGG enrichment analysis of DEGs; the top 20 significant enrichment pathways were listed; (E) PPI analysis of DEGs.
Ijms 24 09383 g002
Figure 3. Proteomics profile comparison between the control group (Sr-0) and Sr treatment group (Sr-20). (A) Volcano plot of the fold change and statistical significance. (B) Heatmap showed the changes expression patterns of DEPs. (C) GO enrichment analysis of DEPs. The top 20 significantly enriched pathways were listed. (D) KEGG enrichment analysis of DEPs. The top 20 significantly enriched pathways were listed. (E) PPI analysis of DEPs.
Ijms 24 09383 g003
Figure 4. Associations analysis of transcriptomics and proteomics profiles. (A) Venn diagram of all mRNAs and proteins. (B) In the nine-quadrant diagram, the differential expressed genes and differential expressed proteins were screened according to the threshold of transcriptomics and proteomics. (C) GO enrichment analysis for DEPs-DEGs; the top 20 significantly enriched pathways were listed. (D) KEGG pathway analysis for DEPs-DEGs; the top 20 significantly enriched pathways were listed.
Ijms 24 09383 g004
Figure 5. Screening and validation of Ca2+ metabolism and Sr core targets. (A) Venn diagram of hypocalcemia, transcriptomics, and proteomics profiles. (B) Core targets between hypocalcemia and Sr expression levels in transcriptomics and proteomics profiles. (C) Correlation analysis of core targets between transcriptomics and proteomics profiles. (D) Correlation analysis of CYP11A1, AHCYL2, SEMA3A, PTHLH, and TGF-β2 between RT-PCR and transcriptomics. (E) The core targets were verified using RT-PCR, * p < 0.05, ** p < 0.01, as compared to the 0 mmol/L Sr treatment group.
Ijms 24 09383 g005
Table 1. Primers used for RT-PCR.
Gene Symbol aAccession No.Product SizePrimer Sequence (5′ → 3′)
CYP11A1NM_176644.2219 bpF: CTTGGAGGGACCATGTAGCC
R: GCAATGTCATGGATGTCGTGT
AHCYL2XM_005205707.4279 bpF: GCACAGTCAAGAAGATCCAATTTGC
R: GTGCTGGCATTTCTTGCTCA
UPK1BNM_174482.2181 bpF: GAGGAGAGGGTAAGCTTGGG
R: TGGCTTCAAGCAGTGGGTAG
WWC2XM_024986463.1190 bpF: CGCCCGGTTCCCCTATG
R: GCTTGGTCAACCTGTCCC
TGF-β2NM_ 001113252.1264 bpF: TCATGCGCAAGAGGATCGAG
R: GCGGGATGGCATTTTCCGAG
SEMA3ANM_001276701.2224 bpF: TCTTCCGAACTCTTGGGCAC
R: GCCCCCAAAGTCATTCTTGC
CA2NM_178572.2201 bpF: TCGCGGAGAATGGTCAACAA
R: GTGAACCAGGTGTAGCTCGG
TGFBINM_001205402.1273 bpF: GAGCTCTGTGAAACTAGCCCC
R: TGGGCTAACCGCCATGTTTA
PTHLHNM_174753.1132 bpF: GGTTATTATTTCGGAGGAGGCG
R: CTCTCGCTCTGGGGACTTAT
GAPDHNM_001034034117 bpF: CCTGCCAAGTATGATGAGAT
R: AGTGTCGCTGTTGAAGTC
18SNR_036642.1130 bpF: ACCCATTCGAACGTCTGCCCTATT
R: TCCTTGGATGTGGTAGCCGTTTCT
a CYP11A1, Cholesterol side-chain cleavage enzyme; AHCYL2, adenosylhomocysteinase such as 2; UPK1B, uroplakin 1B; WWC2, WW, and C2 domain containing 2; TGF-β2, Transforming growth factor β2; SEMA3A, Semaphoring 3A; CA2, Carbonic anhydrase II; TGFBI, transforming growth factor beta-induced; PTHLH, parathyroid hormone-related protein.
Disclaimer/Publisher’s Note: The statements, opinions and data contained in all publications are solely those of the individual author(s) and contributor(s) and not of MDPI and/or the editor(s). MDPI and/or the editor(s) disclaim responsibility for any injury to people or property resulting from any ideas, methods, instructions or products referred to in the content.

