Article

Comparative Transcriptome Profiling of Cassava Tuberous Roots in Response to Postharvest Physiological Deterioration

1
Key Laboratory of Biology and Genetic Resources of Tropical Crops, Institute of Tropical Bioscience and Biotechnology, Chinese Academy of Tropical Agricultural Sciences, Haikou 571101, China
2
Key Laboratory for Biology and Genetic Resources of Tropical Crops of Hainan Province, Hainan Institute for Tropical Agricultural Resources, Haikou 571101, China
3
College of Tropical Crops, Hainan University, Haikou 570228, China
*
Authors to whom correspondence should be addressed.
These authors contributed equally to this work.
Int. J. Mol. Sci. 2023, 24(1), 246; https://doi.org/10.3390/ijms24010246
Submission received: 17 November 2022 / Revised: 15 December 2022 / Accepted: 20 December 2022 / Published: 23 December 2022
(This article belongs to the Special Issue Biochemical and Molecular Approaches to Postharvest Research)

Abstract

:
Cassava is one of the most versatile tuberous-root crops on Earth. However, the postharvest storage properties of cassava tuberous root mean that it is perishable through a process known as postharvest physiological deterioration (PPD), which seriously affects its starch quality. Therefore, a comprehensive understanding of the transcriptional regulatory activity of cassava against the PPD response is necessary in order to extract key molecular mechanisms related to PPD tolerance. In this study, we found that RYG1 tuberous roots showed delayed PPD compared to those of SC8. In addition, RYG1 roots maintained a more stable cell wall structure after storage than those of SC8. The transcriptome changes in tuberous roots were analyzed for both RYG1 and SC8 after 21 days of storage (SR and SS) compared to fresh (FR and FS) by the RNA-Seq method. The total number of differentially expressed genes (DEGs) in the various comparisons of these four samples ranged from 68 to 3847. Of these, a total of 2008 co-DEGs in SR vs. SS were shared by either SR vs. FR or SS vs. FS. GO and KEGG enrichment analysis revealed that upregulated co-DEGs in SR vs. SS were mainly enriched in photosynthesis, protein processing, hormone and cutin, suberine and wax biosynthesis. By contrast, the downregulated co-DEGs were mainly related to cell wall organization, starch and sucrose metabolism, galactose metabolism, phenylpropanoid biosynthesis, diterpenoid biosynthesis, cysteine and methionine metabolism and flavonoid biosynthesis. The protein–protein interaction (PPI) networks of the co-DEGs showed a complex interaction of genes in different pathways, and 16 hub genes were characterized to have a degree in excess of 15, among which eight genes were associated with photosynthesis. These results provide new information for the study of cassava resistance to PPD and lay a foundation for the further molecular breeding of storage-tolerant cassava varieties.

1. Introduction

Cassava (Manihot esculenta Crantz) is a starch-rich tuberous-root crop, grown in tropical and subtropical regions, that plays an important role in global food security [1,2,3,4]. The cassava can be used as a food and vegetable for human consumption—similarly to potatoes. It also has value in other applications, including use as livestock and poultry feed [5,6], biofuel production [7,8] and medicine [9]. However, its processing and utilization are seriously affected by its deterioration after harvest, which is known as postharvest physiological deterioration (PPD) [10]. Decay and metamorphism reduce the transparency of starch, seriously affecting the quality and the processing of starch and fuel ethanol, which causes both farmers and industrial enterprises to suffer huge economic losses. Globally, yield losses due to PPD are estimated at up to 29% [10,11]. This has led to a great loss of enthusiasm among the participants in the cassava industry chain. It is estimated that if the storage life of cassava was extended to 45 days, there would be an additional economic benefit of at least USD 35 million per year in Thailand [12,13]. In Africa, the main cassava-producing region, the economics of extending cassava’s shelf-life are expected to be even higher [13]. Therefore, one of the main objectives of cassava breeding is to delay the postharvest rot and thereby improve the shelf life of cassava.
Recognizing the economic impact of postharvest decay, researchers have carried out numerous studies on the storage shelf life of cassava. Different storage techniques have been developed to keep cassava fresh. However, the problem remains unsolved, because the storage techniques used are either too labor-intensive or are limited by increased cassava production [14]. The breeding of new, durable cassava varieties would provide a permanent solution to the perishability problem affecting cassava after harvest. In 2002, Coters et al. identified 10 genes related to the wound response in cassava PPD using the quantitative trait loci (QTL) mapping method [15]. Genome-wide association studies (GWAS) are another potential genetic anatomical method for complex traits. Although the role of GWAS in cassava PPD has not been reported, GWAS studies on cassava root rot have been reported [16]. It can also provide a reference for the molecular mechanism of cassava postharvest metamorphism. Genomic selection (GS) is also a very important technique in plant breeding. At present, it has been applied in cassava breeding [17,18,19,20,21], but its application in cassava PPD has not been reported. With the development of biotechnology and improvements in cassava genetic transformation systems, it is possible to obtain decay-resistant cassava varieties by means of genetic engineering. Obtaining a fuller understanding of the molecular mechanisms of cassava decay and deterioration after harvest is therefore of great significance in the cultivation of cassava varieties with resistance to PPD via molecular means.
Because agricultural products respond to postharvest storage stress in a species-specific manner, transcriptome sequencing has been widely used to study postharvest gene expression in different agricultural products and to understand the molecular mechanisms of PPD and resistance to PPD [22,23,24,25,26,27,28]. Transcriptome analysis has also been carried out in several cassava PPD studies. Huang et al. (2001) used an RNA fingerprinting method, called cDNA-AFLP, to study the gene changes and important metabolic pathways in the early stage (the first 72 h) of PPD in cassava. Seventy transcription-derived fragments were screened and isolated. The analysis showed that important biochemical and physiological processes such as oxygen stress, carbohydrate metabolism, protein metabolism and phenolic compound synthesis were involved in PPD in cassava [29]. Reilly et al. (2007) analyzed the transcriptome of cassava roots after harvest and identified 72 genes that were altered during postharvest regulation. Many of the upregulated and PPD-specific expressed genes are involved in cellular processes such as reactive oxygen species turnover, cell wall repair and programmed cell death [30]. Transcriptome analysis has also been used to analyze the role of melatonin in delaying the PPD of cassava [31,32]. Melatonin treatment activated the expression of several antioxidant enzymes, calcium signaling, the MAPK cascade and transcription factors, as well as starch degradation-related genes in cassava [31,32]. Yan et al. (2021) conducted a comparative transcriptome analysis of cassava postharvest deterioration and found that the expression of a large number of genes encoding antioxidant enzymes and protein kinases was significantly upregulated in the process of PPD, and the expression of genes related to starch degradation was significantly upregulated, while genes related to starch synthesis were significantly downregulated [33]. Previous studies have mainly focused on the stress response of cassava stored for a short time after harvest, such as 6 h, 12 h, 48 h [31,32,33], 72 h [29] or the longest period of 11 days [34], but the changes in the gene expression levels of cassava stored for 3 weeks without decay have not been studied. It is more important to identify the key genes that maintain the PPD tolerance in the more storable cassava.
In a previous study, we found that RYG1 cassava tuberous roots were significantly more resistant to PPD than SC8 cassava [35]. In the current study, to further understand the molecular basis for the extended shelf life of RYG1, the transcriptomes of two cassava varieties at two time points after harvest (fresh and after 21 days in storage) were established and compared. Some important genes and pathways related to maintaining a longer shelf life in cassava have been found. The results of this study will provide new theories and insights for extending the shelf life of cassava by molecular means.

2. Results

2.1. Comparison of the PPD Tolerance of SC8 and RYG1 Cassava Tuberous Roots during Storage

After comparing the PPD in both SC8 and RYG1 cassava, we found that the RYG1 cassavas were more resistant to PPD than SC8 cassavas (Figure 1). As is apparent in Figure 1, SC8 cassava roots were significantly deteriorated after 21 days of storage and totally deteriorated after 28 days, with fungal growth being clearly observable after 35 days, and, by 42 days, the fungus was spread more widely. By contrast, RYG1 roots remained fresh, without any sign of deterioration after 21 days of storage. Indeed, by 35 days, the peel and flesh of cassava were still be observed to be light green. However, at 42 days, RYG1 cassava roots appeared to change to a light coffee color, which is symptomatic of deterioration (Figure 1). These results indicated that the RYG1 cassava was more tolerant to PPD than SC8.

2.2. Microscopic Structure of SC8 and RYG1 Cassava

To understand how the structure of cassava changed after storage, the ultrastructural features of RYG1 and SC8 cassava were observed, both fresh and after 21 days of storage, by transmission electron microscopy. The results revealed that the cell wall and membrane were close together, without separation, both in fresh RYG1 (hereafter, FR) and fresh SC8 (hereafter, FS). The cell wall was smooth and uniform in morphology. By contrast, after 21 days of storage of RYG1 (hereafter termed SR) and 21 days of storage of SC8 (hereafter termed SS), the different cassava cultivars showed great differences in their cell structures. The cell structures of SS were severely damaged, with visible morphological changes, including plasma membrane invagination and cell wall collapse. Meanwhile, in SR, the cell morphological changes were considerably weaker than those exhibited by SS (Figure 2).

2.3. Assembly of Transcriptomes and Quality Assessments

To determine how the tuberous roots of RYG1 maintain a longer shelf life than SC8, we performed mRNA sequencing to analyze the transcriptomes of tuberous roots from FS, FR, SS and SR. In our data, each sample generated an average of ~2.96 GB of clean data (Table S1). Clean reads with quality scores ≥20% reached more than 95%, and clean reads with quality scores ≥30% accounted for more than 90% (Table S1). After the reads were filtered, 18.48–24.27 million clean reads were obtained, among which more than 73.92% were mapped to the cassava reference genome. We found that 73.57% of the mapped reads were aligned to unique locations. Finally, 31,592 genes were obtained (Table S1). Next, correlation analysis between biological replicates of RNA-seq data showed high Pearson’s correlation values (R2 ≥ 0.88) between repeats (Figure 3a), indicating that the sequencing results exhibited high reproducibility.
The total transcriptional responses of FS, FR, SS and SR were next compared. The principal component analysis (PCA) plot showed 59.6% variance in PC1 and 33.8% variance in PC2 (Figure 3b). The FS and FR groups were difficult to separate by either PC1 or PC2, indicating that their global gene expression was highly similar. By contrast, PC1 clearly separated the samples of SS and SR from the FS and FR (Figure 3b), suggesting that the overall gene expression profiles of cassava were largely affected by storage stress when compared with the fresh condition. Notably, PC2 clearly separated the samples of SS and SR from both FS and FR, even separating SS from SR, indicating that highly diverse patterns of gene expression existed between SS and SR, between SR and FR and between SS and FS (Figure 3b).

2.4. Identification of Differentially Expressed Genes

We subsequently analyzed the differentially expressed genes (DEGs) in the four pairwise comparisons with the criteria of |log2(fold change) | more than 2 and false discovery rate (FDR, adjusted p-value) less than 0.05. Among them, there were 68 DEGs (five upregulated, 63 downregulated) between FR and FS, 2716 DEGs (988 upregulated, 1188 downregulated) between SR and SS, 3844 DEGs (1379 upregulated, 2465 downregulated) between SR and FR and 3847 DEGs (1640 upregulated, 2207 downregulated) between SS and FS (Figure 4a). These results demonstrate that the storage of cassava led to a larger number of DEGs than those caused by the cassava germplasm variety difference. In order to ensure the accuracy of the RNA-seq data, eight DEGs were randomly selected for the subsequent qRT-PCR validation experiments. The results showed that the expression trends of selected genes obtained by qRT-PCR were basically similar to the RNA-seq results (Figure 5). As such, this result confirms the reproducibility and reliability of the RNA-seq data in this study, which can be used with confidence in subsequent studies.

2.5. Venn Analysis of the DEGs

To explore genes that possibly contributed to differences in RYG1 and SC8’s resistance to PPD, we used Venn diagrams to display the common DEGs (co-DEGs) shared by different comparisons. This analysis revealed that there are 332 genes shared by SR vs. SS, SS vs. FS and SR vs. FR; 947 genes only shared by SR vs. SS and SS vs. FS; 729 genes only shared by SR vs. SS and SR vs. FS; and 1515 genes only shared by SR vs. FR and SS vs. FS. Furthermore, there were 168 genes unique to SR vs. SS, 1053 genes unique to SS vs. FS and 1268 genes unique to SR vs. FR (Figure 4b). We subsequently found that a total of 2008 genes in SR vs. SS were shared either with SS vs. FS or with SR vs. FR (Figure 4b). It is speculated that these genes may be the main factors responsible for the differences in response to PPD between the two varieties. Therefore, they were selected for further studies and their expression patterns in both varieties and under both conditions were visualized in a heatmap (Figure 4c). Among the 2008 genes, there were 725 genes upregulated and 1283 genes downregulated in SR vs. SS, 411 upregulated and 650 downregulated in SR vs. FR and 849 upregulated and 430 downregulated in SS vs. FS (Figure 4d).

2.6. GO Functional Enrichment Analysis of Co-DEGs

In an attempt to determine the molecular differences in RYG1 and SC8’s response to PPD, we analyzed the functional annotations of the 2008 co-DEGs. The 725 upregulated and 1283 downregulated co-DEGs in SR vs. SS were subjected to GO classification separately. They grouped into three broad categories: biological processes, cellular components and molecular functions (Table S2). In the upregulated gene sets, genes were enriched in biological process categories related to the response to stimuli, such as light, heat, reactive oxygen, salt stress, hormones, alcohol and inorganic substances. These genes were also enriched in categories related to photosynthesis, such as light reaction and light harvesting, and categories related to protein folding. In the downregulated gene sets, genes were enriched in categories related to metabolism processes, such as the cellulose catabolic process, phenylpropanoid biosynthesis, chitin catabolic process, gibberellin biosynthetic process, hydrogen peroxide catabolic process and glutathione metabolic process; in categories related to cell wall organization or biogenesis; and in categories related to stimuli, such as ethylene, jasmonic acid, salicylic acid, fungus, immunity, wounding and oxidative stress (Figure S1).

2.7. KEGG Pathway Analysis of co-DEGs

A KEGG pathway enrichment analysis was carried out for both 725 upregulated co-DEGs and 1283 downregulated co-DEGs (Table 1). In the upregulated gene sets, the energy metabolism-related pathways, including photosynthesis and photosynthesis—antenna proteins; protein folding, sorting and degradation-related pathways; protein processing in the endoplasmic reticulum; lipid metabolism-related pathways, including cutin, suberin and wax biosynthesis and fatty acid elongation; and the signal transduction-related pathway—plant hormone signal transduction, were significantly enriched. In the downregulated gene sets, a total of 19 pathways were significantly enriched, which included cysteine and methionine metabolism, phenylpropanoid biosynthesis, flavonoid biosynthesis, carbon metabolism, glutathione metabolism, the MAPK signaling pathway—plants, starch and sucrose metabolism, galactose metabolism and terpenoid backbone biosynthesis.

2.8. Differentially Expressed Genes Related to Photosynthesis

In this study, both the GO and KEGG enrichment analysis of co-DEGs revealed that photosynthesis-associated terms were significantly enriched in the upregulated co-DEGs (Figure S1, Table 1 and Table S2). We therefore searched the 2008 co-DEGs to identify all of the photosynthesis-related genes and their expression patterns. A total of 28 genes that participate in photosynthesis, including LHCAs, LHCBs, PETs, PSAs, PSBs, CHLH, PRK, PPDK, GIDA, FTSH6, PGR5, RBCS1A and SIG, were revealed (Figure 6a). It was discovered that all the DEGs had higher expression in stored RYG1 than in stored SC8, even though they were induced in both varieties after storage in comparison to their fresh condition. These results suggest that the stored RYG1 may exhibit higher rates of photosynthesis than the stored SC8. However, whether the photosynthetic process is active remains to be confirmed in future studies.

2.9. Differentially Expressed Genes in Protein Processing in the Endoplasmic Reticulum Pathway

Protein processing in the endoplasmic reticulum pathway was another significantly enriched pathway in the upregulated co-DEGs. Here, we further examined all genes in this pathway in co-DEGs, revealing in a total of 30 genes (Figure 6b). There were 23 HSP20s, three HSP70s, two HSP90s and two RMAs. All of the HSP20s, HSP70s and HSP90s were upregulated in SR compared SS. Most of them were upregulated in SR compared to FR, while others displayed no significant difference. Meanwhile, in SS vs. FS, most of the HSP genes were downregulated. In addition, for the two RMAs, one was upregulated and the other was downregulated in both SR vs. SS and SR vs. FR, but there was no difference in SS vs. FS.

2.10. Differentially Expressed Genes Related to Starch and Sucrose Metabolism and Galactose Metabolism

A total of 34 co-DEGs were identified from the starch and sucrose metabolism and galactose metabolism pathways, in which five genes (one HXK, four SacAs) belonged to both pathways (Figure 6c). In addition, four GolSs, one STS, one RAF, one glgP, one glgC, one SBE, one FRK, one SS, two TPSs and two SUSs genes were upregulated in SR vs. SS, while the other genes, such as two PFKs, one RAF, one HXK, four SacAs, two bglBs, one bglX, two AMYs, four CELs, one SUS and one TREH, were downregulated in SR vs. SS.

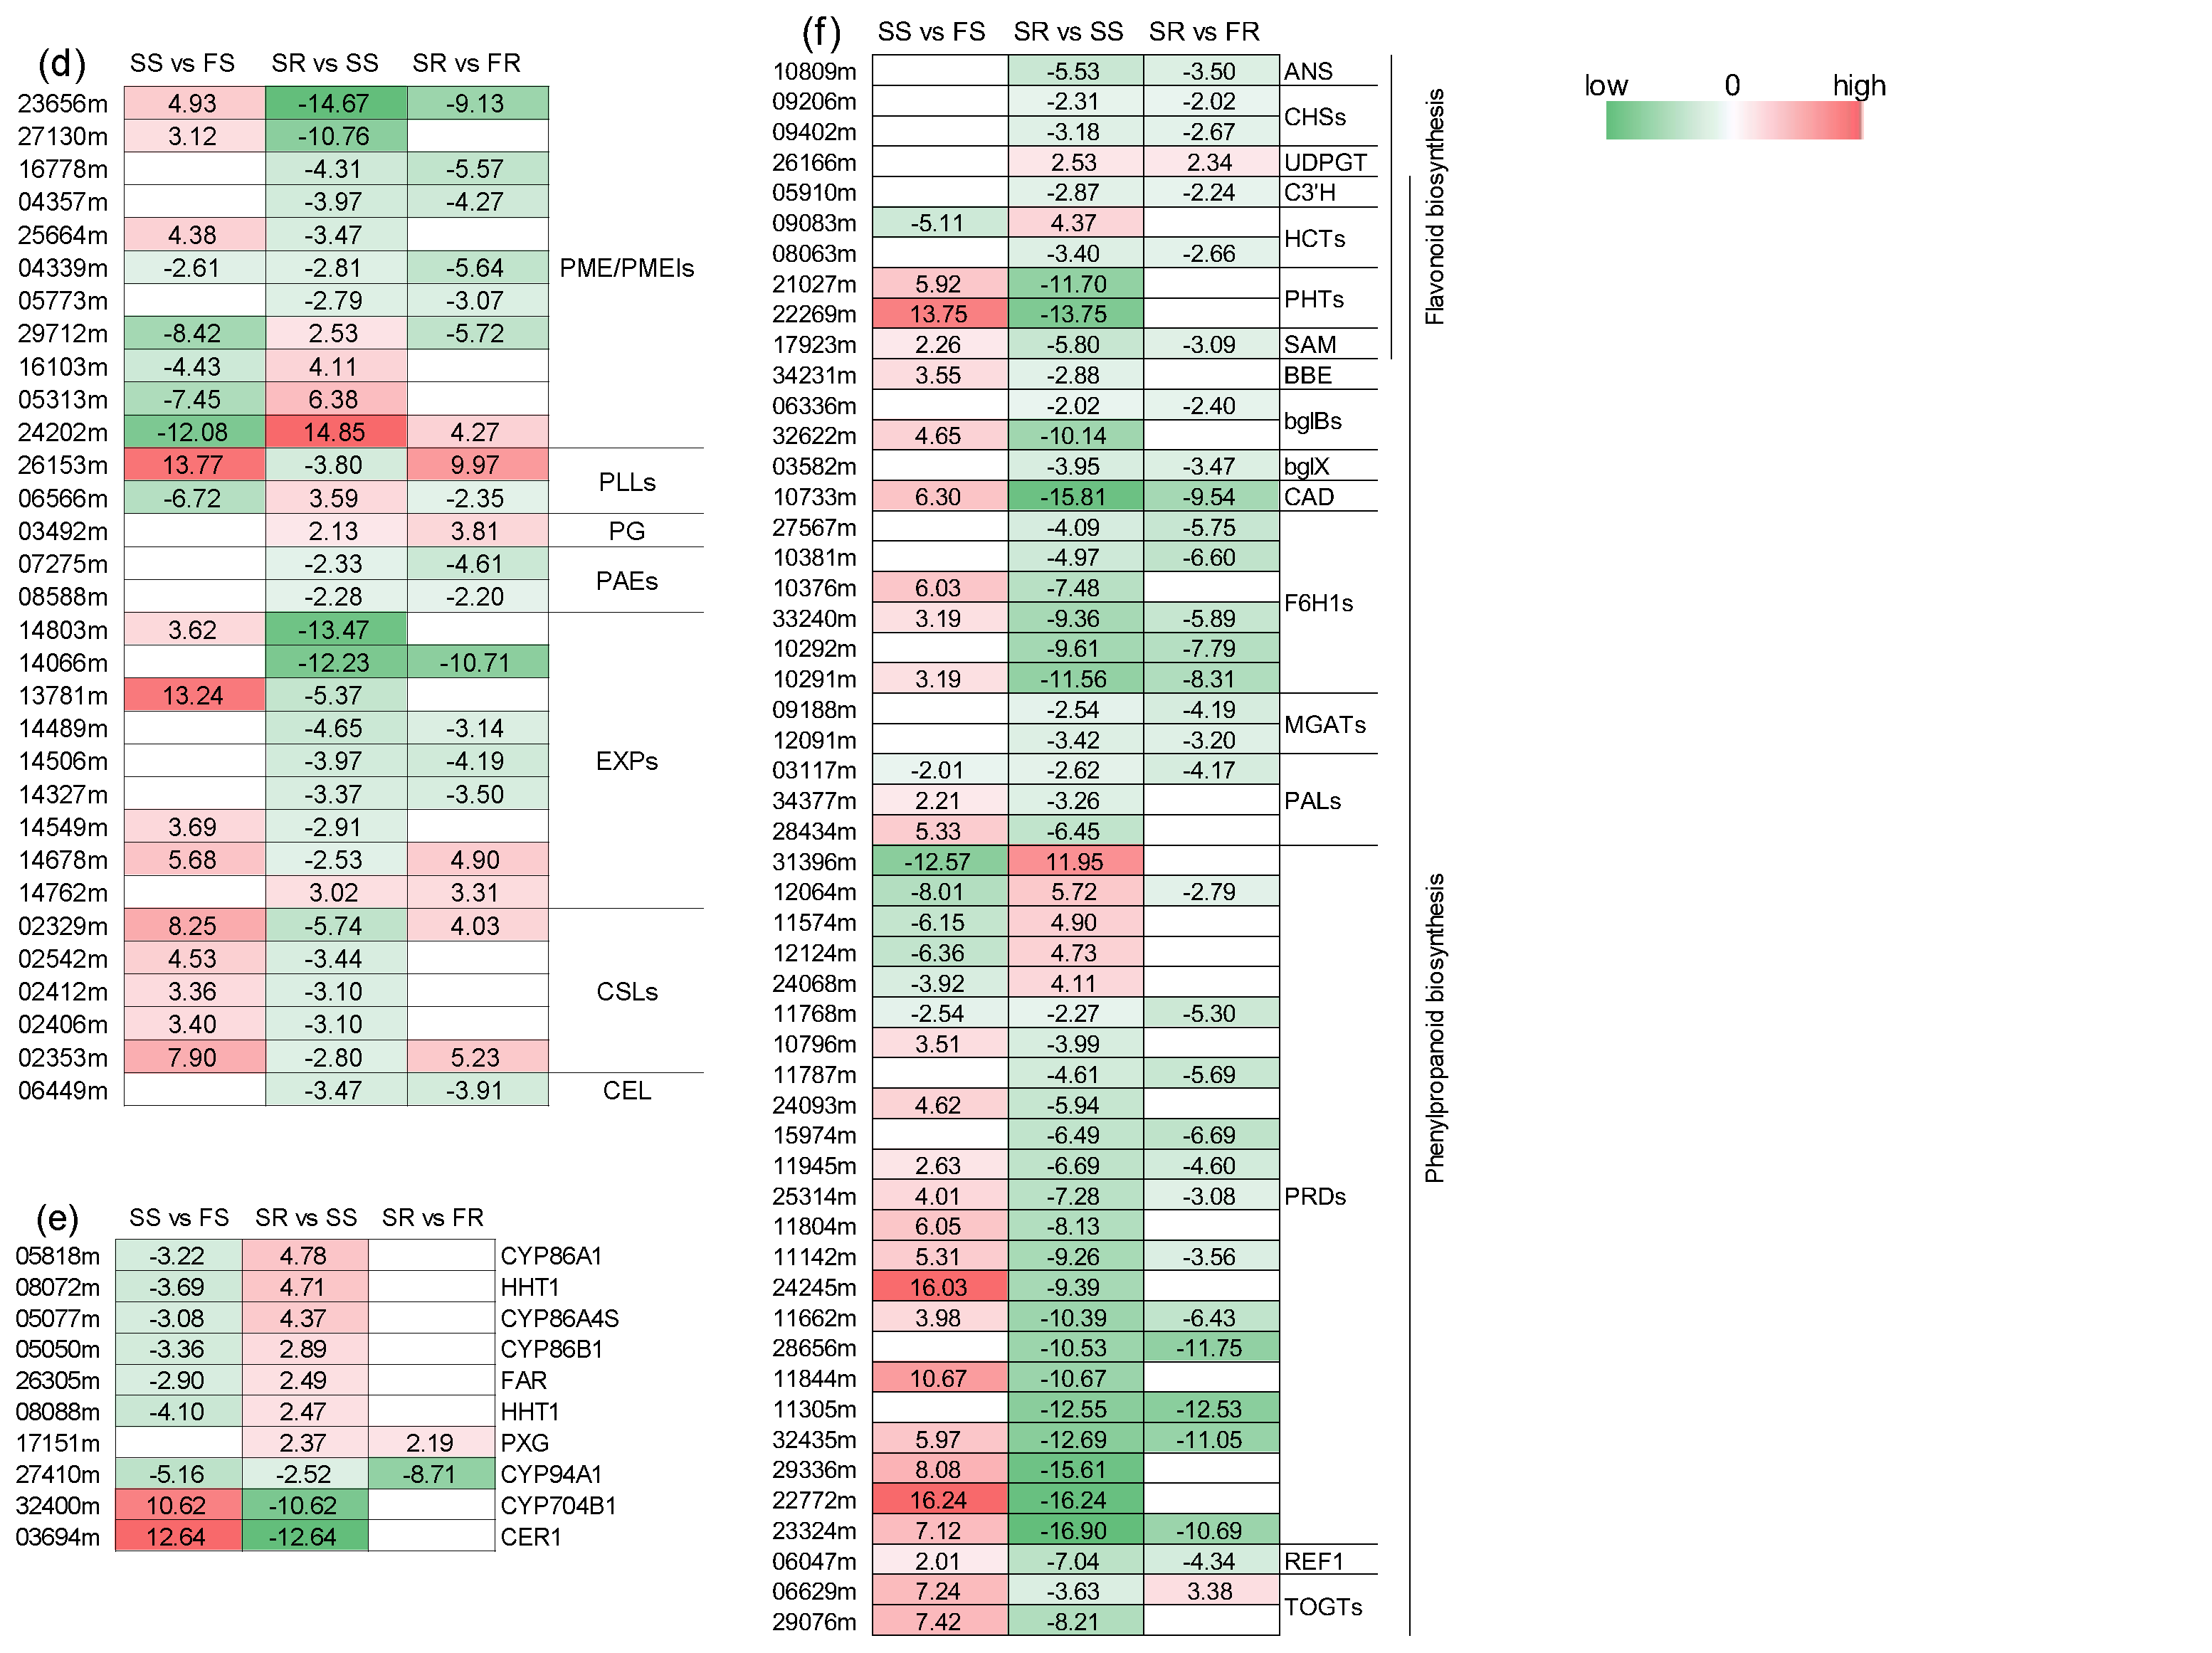
2.11. Differentially Expressed Genes Related to Cell Wall, Cutin, Suberin and Wax Biosynthesis, Phenylpropanoid Biosynthesis and Flavonoid Biosynthesis

In the present study, we found that genes in the cell wall organization GO term and the cutin, suberin and wax biosynthesis, phenylpropanoid biosynthesis and flavonoid biosynthesis KEGG pathways were significantly enriched in the SR vs. SS comparison. Therefore, we further examined the relative levels of expression of these genes. Notably, 11 PME/PMEIs (four upregulated and seven downregulated), two PLLs (one upregulated, one downregulated), two PAEs (downregulated) and one PG (upregulated) were identified from the SR vs. SS comparison, and all of these genes acted on pectin in the cell wall components. In addition, our study revealed that five CSLs and one CEL gene(s), which are associated with cellulose, were identified, and all of them were downregulated in SR vs. SS. Moreover, a total of nine EXPs (one upregulated, eight downregulated) were identified from the SR vs. SS comparison (Figure 6d). For the cutin, suberine and wax biosynthesis pathway, a total of 10 genes (three upregulated, seven downregulated) were identified (Figure 6e). A total of 52 genes were identified from the phenylpropanoid biosynthesis or flavonoid biosynthesis pathways, in which six genes (two HCTs, two PHTs, one C3′H and one SAM) belonged to both pathways. Most of the genes (45 out of 52) were downregulated in SR vs. SS, while only seven genes were upregulated in SR vs. SS (Figure 6f).

2.12. Differentially Expressed Genes Related to Hormone Signaling

To explore how the plant hormones were involved in cassava PPD tolerance, the expression profiles of 38 genes related to plant hormone signal transduction were analyzed (Figure 7 and Table S3). For the auxin signal, 17 genes were differentially expressed in SR vs. SS, thirteen of which were upregulated, including genes encoding seven AUX/IAAs, three ARFs, two GH3s and one SAUR. For the ABA signal, two PP2C genes were upregulated after storage in SR vs. SS, while another PP2C and two PYLs were downregulated. For the JA signal, one JAR1 gene and two JAZs were downregulated in SR vs. SS. For the SA signal, only one TGA gene existed and was downregulated in SR vs. SS. For the CTK signal, only one B-ARR gene existed and was upregulated. For the ETH signal, one ETR and five ERFs were downregulated, while only one EIN2 gene was upregulated in SR vs. SS. For the GA signal, only one DELLA was upregulated in SR vs. SS. For the BR signal, one BSK and one BKI1 were downregulated, while one CYCD3 was upregulated in SR vs. SS.

2.13. Differentially Expressed Genes Related to Transcriptional Regulation

Co-DEG analysis indicated that a total of 176 genes encoding putative transcription factors (TFs) were significantly differentially expressed between RYG1 and SC8 after storage, and their expression heatmap is presented in Figure 8. These TFs were categorized into 31 different families, including MYBs, AP2s, WRKYs, NACs, bHLHs, GRASs, C2H2s, HSFs and IAAs. The MYB family of transcription factors was the most abundant (32 genes), followed by the AP2s (22 genes), WRKYs (19 genes), bHLHs (13 genes), NACs (10 genes) and GRASs (10 genes) (Figure 8).

2.14. Protein–Protein Interaction Network Construction and Hub Gene Identification

As described above, the transcriptome analysis identified a list of co-DEGs, and these genes participated in differential pathways or biological processes. To reveal the interaction relationships among these co-DEGs, a protein–protein interaction (PPI) network was constructed on the basis of gene co-expression. The co-DEGs formed PPI networks with 524 nodes and 1004 edges, in which 324 nodes with 874 edges formed the largest network (Figure 9a). Genes in diverse pathways were intertwined, which illustrated the complexity of cassava’s resistance to PPD. The intertwined genes were associated with pathways such as photosynthesis, protein processing in the endoplasmic reticulum, carbon metabolism, nitrogen metabolism, starch and sucrose metabolism, etc. Next, by running the cytoHubba plugin in Cytoscape v3.9.0, the genes with a degree of connectivity in excess of 15 were identified as hub genes. Thereby, a total of 16 hub genes were obtained, of which the degree of connectivity was 25 for both PRK and LHCA3, 23 for both PSAF and NR1, 21 for GUN4, 20 for both LHCA1 and PETE, 19 for PSBY, 18 for both GGR and PSAD-2, 16 for GDH2s and LASPO and 15 for ALDH3F1, CYP38 and LHCA4 (Figure 9b, c). Among these hub genes, there were 12 hub genes, including PRK, LHCA3, PSAF, GUN4, LHCA1, PETE, PSBY, GGR, PSAD-2, ALDH3F1, CYP38 and LHCA4, that were up-regulated, and four hub genes (NR1, 2 GDH2s and LASPO) were down-regulated in SR vs. SS. In addition, eight of the hub genes, including PRK, LHCA3, PSAF, LHCA1, PETE, PSBY, PSAD-2 and LHCA4, were associated with photosynthesis, which further suggested the crucial role of photosynthesis-related genes in RYG1 cassava’s resistance to PPD (Figure 9c).

3. Discussion

Postharvest physiological deterioration (PPD) of cassava is a major obstacle to the development of the cassava industry. It is a complex physiological and biochemical process involving changes in gene expression, protein synthesis and secondary metabolite accumulation [30]. In recent decades, great progress has been made in improving cassava’s resistance to PPD, but it is far from sufficient. Here, we compared the differences in the postharvest response to PPD between RYG1 (PPD-tolerant) and SC8 (PPD-susceptible) cassava cultivars in terms of their phenotype, microstructure and transcriptome. On the whole, the phenotypes and microstructures of fresh RYG1 and SC8 cassavas were significantly different from those at 21 days after harvest under the same storage conditions. The differences in the physiological responses of the two cassava germplasms after storage were partly caused by the differences in gene expression. Therefore, four sets of transcriptomic data were compared to analyze the functional information of differentially expressed genes, using fresh cassava samples (FR and FS) and 21-day-storage cassava samples (SR and SS). From the perspective of the principal component analysis of gene expression, SC8 and RYG1 cassava samples showed little difference in their gene expression profiles when fresh, but had completely different gene expression profiles after storage, presenting a state of polarization. This was consistent with the appearances that they exhibited, as SC8 exhibited symptoms of deterioration, whereas RYG1 did not, after 21 days of storage. Consistently with the results of the principal component analysis, only a small quantity of differentially expressed genes (68 DEGs) was detected in the comparison between FR and FS, indicating that both of them had similar gene expression profiles when fresh. However, after 21 days of storage, a great deal of differentially expressed genes were generated in SR vs. SS, SR vs. FR and SS vs. FS, indicating that RYG1 and SC8 had substantially different responses to PPD at the gene transcription level. The 2008 co-DEGs shared in SR vs. SS with either SR vs. FR or SS vs. FS were considered to be the most important genes mediating a series of defense mechanisms against PPD in RYG1 cassava.
In previous studies, it has been shown that reactive oxygen species (ROS) are active during cassava deterioration [30,36]. Indeed, they have been considered as the main cause of PPD. Thus, the genes responsible for scavenging reactive oxygen species and their regulatory mechanisms have become the focus of research. In this study, we also found that some upregulated co-DEGs were enriched in the GO terms annotated as the response to reactive oxygen species (Table S2, Figure S1). Most of the genes were described as HSP20s. Moreover, these genes were upregulated or unchanged in stored RYG1 compared to the fresh control; however, most of these genes were downregulated in stored SC8 compared to its fresh control (Table S4). In this study, we also found that ROS fluorescence and H2O2 content in 21-day-storage RYG1 cassava were significantly lower than those in 21-day-storage SC8 cassava (Figures S2 and S3). Therefore, we hypothesized that the positive expression of these reactive oxygen species responsive genes in stored RYG1 triggers a series of reactive oxygen species scavenging reactions, thereby maintaining intracellular reactive oxygen species stability without causing cell toxicity.
Cell wall integrity and its regulatory genes have often been considered in relation to the storage tolerance of agricultural products after harvest [37,38,39]. High-CO2 treatment increases the pectin content and hardness of strawberries, and reduces their rate of rotting. At the same time, the expression of genes related to cell wall degradation, such as pectin methylesterase (PME), polygalacturonase (PG) and pectin lyase (PL), is inhibited [37]. The rapid softening of peach flesh was found to occur due to the stronger expression of genes encoding cell wall hydrolases, especially xylosidases and galactosidases [38]. Furthermore, inhibition of the expression of cell wall modification genes related to fruit softening, such as PG, cellulase, PME, alpha-l-arabinofuranosidase and beta-galactosidase, can improve storage tolerance in grapefruits [39]. The differential expression of some genes related to cell wall remodeling, such as pectin methylesterase (PME) and α-mannosidases (MNS), has also been detected in cassava at the early stage of postharvest metamorphism [40]. In our study, transmission electron microscopy showed that the cell wall of SR was more intact than that of SS. GO functional annotation and enrichment analysis of co-DEGs revealed that many cell-wall-related genes were significantly enriched, including PME/PMEIs, PLLs, CEL and EXPs (Figure 6d). In addition, the genes in the cutin, suberin and wax biosynthesis were also enriched. Therefore, we hypothesized that maintaining cell wall integrity is another mechanism by which RYG1 resists PPD and maintains its shelf life. These cell-wall-associated co-DEGs therefore deserve attention and require functional verification.
There was a strong correlation between an increase in soluble sugar content and the extension of postharvest shelf life. For example, one of the mechanisms involved in improving the postharvest life of sweet cherry fruit via heating and calcium treatment is that the treatment increases the content of soluble sugar, especially galactose [41]. In potato, the soluble sugar accumulation after cold treatment served to maintain the quality of the crop during storage [28]. In a previous study of cassava, the soluble sugar content after storage in a PPD-resistant variety was higher than that in susceptible varieties [34]. In the current study, we found that some genes involved in the starch and sucrose metabolism and galactose metabolism pathways were significantly enriched in the co-DEGs (Figure 6c). Moreover, the total soluble sugar content was higher in the PPD-tolerant RYG1 than in the control after 21 days storage (Figure S4), which is consistent with the previous study. On the other hand, the soluble sugar concentration is considered as a positive quality criterion in fruit, and it determines the sweetness of the fruit [42,43]. Although reports on cassava’s soluble sugar content or sweetness in cassava quality are rare, there have been several reports that mention a preference for cassava with sweetness [44,45,46]. Since some (not all) prefer no taste in cassava products, the increase in soluble sugar content after storage may lead more people to favor cassava products, thus stimulating the cassava industry. Therefore, we speculate that the expression of related genes plays important roles in regulating the anti-PPD capabilities of RYG1. The hexokinase (HXK) activity and HXK gene expression in peach fruits were increased by postharvest disease stress [47]. Plant HXK can independently catalyze hexose phosphorylation into glycolysis and is sensitive to glucose. HXK phosphorylation of hexoses affects a variety of hormone signaling pathways, as well as plant development and stress responses [48]. In our study, one HXK was identified, and its expression was significantly decreased after storage in RYG1, while it was unaltered in SC8. This suggests that the sugar signal in RYG1 may have been sensed and thereby effectively regulated metabolic activity.
In addition to the above possible mechanisms of resistance to PPD, we also found that upregulated co-DEGs were mainly enriched in the photosynthetic antenna protein, photosynthesis and protein processing in the endoplasmic reticulum KEGG pathways (Table 1). Previous studies have shown that the activation of the expression of photosynthesis-related genes is closely related to the alleviation of the postharvest deterioration of agricultural products [49,50,51]. Light treatment delayed postharvest yellowing, retained chloroplast components and maintained slower sugar loss in broccoli [49]. Results in broccoli research indicate that postharvest treatments that delay chlorophyll degradation have a higher effect on the expression of pheophytinase genes [51]. Transcriptome analysis revealed that the mechanism by which low-intensity white LED light delayed postharvest pakchoi senescence was mainly through activating the expression of photosynthesis-related genes, including genes related to Photosystem II, Photosystem I, Cytochrome b6f complex, photosynthetic electron transport and F-type ATPase [50]. In this study, we found that the RYG1 cassava became light green after storage for 35 days (Figure 1). This result indicated that, after longtime storage, RYG1 began to produce and accumulate chlorophyll. This phenotypic change is also partially consistent with previous studies in other crops. Although the expression of photosynthesis-related genes was upregulated after storage in both RYG1 and SC8, the expression of these genes was higher after storage in RYG1 than in SC8 (Figure 6a). These results suggested that RYG1 may have a higher energy state due to a higher photosynthetic rate than that of SC8 occurring after storage, thus helping to delay the deterioration during postharvest storage. Interestingly, among the hub genes screened, we also found that eight hub genes (PRK, LHCA3, PSAF, LHCA1, PETE, PSBY, PSAD-2 and LHCA4) were all related to photosynthesis (Figure 9bc). The direct involvement of these genes in delaying postharvest fruit deterioration has not been reported; however, several gene-related proteins have been reported as participating in the discoloration of postharvest fruits and vegetables [52,53]. The expression of LHCI and LHCII was significantly downregulated in the yellowing of broccoli heads [52]. The expression of LHC (CAB) proteins was downregulated with the decrease in the chlorophyll content in peach peel [53]. The LHC was also used as an index to measure tomato postharvest ripening [54]. This further piqued our interest, since it suggests that photosynthesis may play a non-negligible role in the PPD resistance of RYG1; however, given the fact that this observation was made in a tuberous root, rather than an above-ground organ of the plant, the exact physiological significance of this finding warrants further investigation. Nevertheless, the upregulation of photosynthesis in other below-ground tissues is not without precedence, with similar findings being reported for Acmella, Datura, Artmisia, Rudbeckia, Stevia, Tagetes, Alnus and cassava [55,56,57]. Long ago, researchers found that the chloroplast structure and chlorophyll fluorescence in green root plastids were similar to those in leaves, while there was no chloroplast structure formation in dark grown roots [55]. Moreover, these studies also showed that the green roots are photoautotrophic [55]. Although we have not detected the chloroplast structure in cassava tuberous roots, the green accumulation in cassava could be clearly found by observing 35-day cassava slices (Figure 1). In view of this, it is reasonable to speculate that cassava tuberous roots may form photoautotrophs under long-term light conditions after separation from the parent plant.
The genes involved in protein processing in the endoplasmic reticulum pathway were mainly heat shock protein (HSP) genes. HSPs are proteins encoded by multi-gene families that protect plants from abiotic stress and are produced under ultra-stable high temperatures. They act as molecular chaperones to maintain protein homeostasis in the cell by helping in protein folding, protein unfolding, protein assembly, protein intracellular distribution and protein degradation [58]. Environmental stresses often lead to protein dysfunction, so the ability of HSPs to repair and assist in the refolding of damaged proteins is important in order to protect cells from stress. It has been reported that heat shock proteins maintain an incredibly important role in reducing the postharvest sensitivity of fruits to biological and abiotic stresses [25,59]. For example, the molecular mechanism of extending the fruit shelf life and quality in citrus involves the upregulation of heat shock proteins [59]. Some upregulated HSPs were also detected in storage potato with good quality [28]. In our data, 23 HSP20s, 3 HSP70s and 2 HSP90s were identified in the co-DEGs. All of the HSPs were upregulated in SR compared SS. These HSPs were either upregulated or showed no significant difference in SR compared to FR. Meanwhile, in SS vs. FS, most of the HSP genes were downregulated (Figure 6b). As described in the above, HSP20s were also the major genes identified in this study in response to ROS. This highlights even further their importance in PPD resistance.
Phenolic secondary metabolites produced in the phenylpropanoid biosynthesis pathway affect the quality characteristics of plant foods, such as their appearance, flavor and other health properties [60]. Previous studies have identified that some proteins in the phenylpropanoid biosynthesis pathway respond to postharvest deterioration at the proteomic level [61]. In this work, genes involved in the phenylpropanoid biosynthesis and flavonoid biosynthesis pathways were specifically enriched in the downregulated co-DEGs in SR vs SS. It may be conjectured that the expression differences in these genes might be related to the maintenance of cassava root quality after harvest.
Phytohormone signaling pathways play important roles in many environmental stresses and are often involved in the storage and preservation of agricultural products [62,63]. The present transcriptome data implied the important role of auxin pathway genes in RYG1 resistant to PPD. Among the 38 genes involved in the plant hormone signal transduction pathway, 17 genes belonged to the auxin signal (Figure 7). Specifically, there were seven AUX/IAAs and three ARFs that were upregulated in SR vs SS. In strawberry, exogenous IAA delayed the fruit ripening process by upregulating the AUX/IAA and ARF genes and downregulating the genes related to cell wall degradation and pectin [22]. In the present data, most of the cell wall degradation-related genes were downregulated in RYG1 after storage. These results suggested that the auxin signaling pathway plays an important role in the PPD resistance of RYG1.
The complexity of the molecular mechanism of RYG1’s resistance to PPD was further demonstrated by constructing a protein–protein interaction network. Different gene-regulatory pathways intertwine to synergistically resist the occurrence of postharvest metamorphism (Figure 9). Among the selected 16 hub genes, with the exception of eight genes related to photosynthesis, there were another eight hub genes, including GUN4, GGR, ALDH3F1, CYP38, NR1, two GDH2s and LASPO. GUN4 is one of the key regulators in the chlorophyll biosynthesis pathway [64]. The reduction in chlorophyll loss in Chinese cabbage under 21 days of light storage was related to the upregulation of this gene’s expression [65]. GGR is another gene participating in chlorophyll biosynthesis [66]. Thus, GUN4 and GGR may be involved in the fight against PPD by regulating the chlorophyll synthesis process. The stress-induced ROS cause the excessive accumulation of toxic aldehydes in cells. ALDHs can convert toxic aldehydes to nontoxic carboxylic acids, thus reducing the damage to cells [67]. LASPO is considered pivotal to maintain NAD homeostasis [68]. GDH2 activates the catabolic oxidation of glutamate and provides a carbon skeleton for the citrate cycle (TCA cycle) [69]. It is also a key enzyme in NH4+ assimilation and is involved in various stresses [70]. It is well documented that the downregulation of GDH expression and the reduced GDH activity are correlated with a delay in the initiation of senescence or the extended shelf life of fruits as well as vegetables [71,72,73]. A decrease in NR activity coincided with the alleviation of postharvest pericarp browning in longan fruit [74]. However, enhanced NR gene expression appears in the accelerated softening of tomato fruits [75]. The abovementioned evidence partially supports the notion that the function of these hub genes might be involved in regulating postharvest deterioration in cassava. The molecular mechanisms of these hub genes affecting the shelf life of postharvest cassava need to be further studied through a series of experiments. For example, the effect of these genes on PPD resistance in cassava can be observed by overexpressing or suppressing their expression in cassava.

4. Materials and Methods

4.1. Plant Treatment and Tissue Sampling

Cassava (Manihot esculenta Crantz) cultivars SC8 and RYG1 were selected for this study, according to previous results [35] in which SC8 and RYG1 were identified as being sensitive and tolerant to PPD, respectively. Cassavas were harvested after 1-year planting from the experiment field in the city of Wenchang, Hainan Province, China, in March 2015. They were kept at 28~30 °C and 65~70% relative humidity, under 16/8 h light/dark conditions. The cassavas, with the proximal and distal ends removed, were transected weekly (0, 7, 14, 21, 28, 35 and 42 d) with a thickness of 1 cm, to detect the PPD in the sections.

4.2. Transmission Electron Microscope Observations

Cassava samples of FR, SR, FS and SS were fixed in glutaraldehyde (2.5%) for more than 3 h. The samples were cleaned 3–4 times with phosphoric acid buffer (PAB, PH7.2, 0.1 mol/L), and then fixed overnight with osmium acid (1%) at 4 °C. After this, the samples were washed with PAB (0.1 mol/L, pH 7.2) 3 to 4 times, for 45 min each time. Next, the samples were dehydrated with 50%, 70%, 80%, 90% and 100% ethanol solutions for 12 to 15 min each time, followed by epoxy propane 2 times, for 10 min each time, with epoxy propane:EPON resin = 2:1, and epoxy propane:EPON resin = 1:2. They were permeated for 2 h, and then placed in pure resin overnight. This was replaced with acetone:ethanol = 1:1 and pure acetone for 25–35 min each time, and then with acetone:EPON resin (3:1) for 2 h. We then placed samples in acetone:EPON resin (1:1) and permeated them for 2 h; in acetone:EPON resin (1:3), they were permeated for 2 h, and then in pure resin overnight. We then replaced the sample overnight with pure resin and then buried the sample in an embedded plate with pure resin. The polymerization was carried out at 37 °C for 12 h, 45 °C for 12 h and 60 °C for 48 h. We then sliced, dyed, dried and observed the samples.

4.3. RNA-Seq Transcriptome Analysis

The samples from 0 and 21 d treatments were collected and frozen with liquid nitrogen for the total RNA extraction. The methods of total RNA extraction and RNA-seq library conduction were same as those previously described [76]. The RNA quality and concentrations were evaluated using an Agilent 2100 Bioanalyzer (Agilent Technologies, Santa Clara, CA, USA). Equal amounts of RNA from each sample were sequenced on an Illumina HiSeq 2500 sequencer (Illumina, San Diego, CA, USA) at the Gene Denovo company (Guangzhou China), to construct the strand-specific RNA-seq libraries. The data were submitted to the National Genomics Data Center (NGDC) with the assigned accession number CRA007720. The experiments on RYG1 and SC8 were performed with two biological repeats, and each repeat consisted of a mixture of five individual roots.

4.4. Screening of Differentially Expressed Genes (DEGs) and Enrichment Analysis

RNA-seq data analysis was carried out essentially according to previous methods [76]. Briefly, the ribosomal RNA reads of raw data were first removed to obtain clean reads. The clean data were aligned to the cassava genome [77]. For each cassava gene, its expression level was calculated using the fragments per kilobase of transcript per million mapped reads (FPKM) method [78]. The R language package was used for principal component analysis (PCA). The FDR and |log2FC| were used to screen differentially expressed genes (DEGs). The screening conditions were FDR < 0.05 and |log2FC| ≥ 2. The co-DEGs were screened using a Venn diagram. The heatmaps of the selected co-DEGs were drawn with the program in Omicshare.

4.5. Enrichment Analysis, PPI Interaction Network Construction of co-DEGs

The GO enrichment analysis, KEGG pathway enrichment analysis and the interaction networks of co-DEGs were generated by the STRING online platform (https://cn.string-db.org/, 23 October 2022), with confidence scores higher than 0.7. In the PPI network, the hub genes were screened by the Degree algorithm of the CytoHubba plugin in an open-source software program, Cytoscape v 3.9.0 (https://cytoscape.org/, 6 November 2022) [79,80]. The genes with an interaction degree more than 15 were selected as hub genes in this study.

4.6. Quantitative Real-Time PCR Analysis

The PrimeScript RT reagent kit with gDNA Eraser was utilized to reverse the purified RNA of each sample to first-strand cDNA. The Tubulin gene in cassava was used as an internal control. All the primers used in this work were designed with Primer Premier 5. The primers are listed in Supplementary Table S5. QRT-PCR was performed with a SYBR®Premix Ex TaqTM II Kit and a ABI 7900HT Fast Real-Time PCR System (Applied Biosystems, Foster City, CA, USA). The relative expression levels of target genes were calculated via 2−∆∆Ct relative quantitative analysis [76]. The data were statistically analyzed using GraphPad Prism 8.3.0.538 to generate bar charts.

5. Conclusions

This study suggested that the longer shelf life of RYG1 may be related to the maintenance of lower reactive oxygen species, higher soluble sugar levels and more intact cell wall structures. In addition, the regulation of photosynthesis and endoplasmic reticulum protein processing, phenolic secondary metabolites and phytohormone signaling pathways also plays an important role in the resistance to PPD. Moreover, we screened out some of the hub genes that connected these important biological processes, including PRK, LHCA3, PSAF, LHCA1, PETE, PSBY, PSAD-2, LHCA4, GUN4, GGR, ALDH3F1, CYP38, NR1, 2 GDH2s and LASPO. These findings provide targets for the further improvement of cassava storage tolerance.

Supplementary Materials

The following supporting information can be downloaded at: https://www.mdpi.com/article/10.3390/ijms24010246/s1.

Author Contributions

Conceptualization, R.L. and J.G.; methodology, R.L.; validation, S.Y., Y.Z., S.W., Q.Z. and Z.D.; formal analysis, R.L. and S.Y.; investigation, R.L., S.Y. and Y.Z.; resources, R.L., J.G. and Y.Y.; data curation, S.Y., Y.Z., S.W., Q.Z. and Z.D.; writing—original draft preparation, R.L. and S.Y.; writing—review and editing, J.G., J.L. and Y.Y.; visualization, R.L. and S.Y.; supervision, J.G., J.L. and Y.Y.; project administration, R.L., Y.W., Y.Y., J.L. and J.G.; funding acquisition, R.L., J.G., J.L. and Y.Y. All authors have read and agreed to the published version of the manuscript.

Funding

This research was funded by the National Key R&D Program of China: 2019YFD1001105, 2018YFD1000500; the Earmarked Fund for China Agriculture Research System: CARS-11-HNGJC; the National Natural Science Foundation of China: 31601359; the State Scholarship Fund of China Scholarship Council: CSC202003260020; the Key Research and Development Projects of Hainan Province: ZDYF2015048; the Major Science and Technology plan of Hainan Province: ZDKJ2021012; and the Central Public-Interest Scientific Institution Basal Research Fund for Chinese Academy of Tropical Agricultural Sciences: 1630052022008.

Institutional Review Board Statement

Not applicable.

Informed Consent Statement

Not applicable.

Data Availability Statement

Not applicable.

Acknowledgments

We are grateful to Alisdair R. Fernie at the Max Planck Institute of Molecular Plant Physiology for his help in writing and revising our manuscript. We are grateful for the patience and comments of the editors and the reviewers.

Conflicts of Interest

The authors declare no conflict of interest.

References

  1. Wilson, M.C.; Mutka, A.M.; Hummel, A.W.; Berry, J.; Chauhan, R.D.; Vijayaraghavan, A.; Taylor, N.J.; Voytas, D.F.; Chitwood, D.H.; Bart, R.S. Gene expression atlas for the food security crop cassava. N. Phytol. 2017, 213, 1632–1641. [Google Scholar] [CrossRef] [Green Version]
  2. Tize, I.; Fotso, A.K.; Nukenine, E.N.; Masso, C.; Ngome, F.A.; Suh, C.; Lendzemo, V.W.; Nchoutnji, I.; Manga, G.; Parkes, E.; et al. New cassava germplasm for food and nutritional security in Central Africa. Sci. Rep. 2021, 11, 7394. [Google Scholar] [CrossRef]
  3. Talsma, E.F.; Borgonjen-van den Berg, K.J.; Melse-Boonstra, A.; Mayer, E.V.; Verhoef, H.; Demir, A.Y.; Ferguson, E.L.; Kok, F.J.; Brouwer, I.D. The potential contribution of yellow cassava to dietary nutrient adequacy of primary-school children in Eastern Kenya; the use of linear programming. Public Health Nutr. 2018, 21, 365–376. [Google Scholar] [CrossRef] [Green Version]
  4. Sonnewald, U.; Fernie, A.R.; Gruissem, W.; Schläpfer, P.; Anjanappa, R.B.; Chang, S.-H.; Ludewig, F.; Rascher, U.; Muller, O.; van Doorn, A.M.; et al. The Cassava Source–Sink project: Opportunities and challenges for crop improvement by metabolic engineering. Plant J. 2020, 103, 1655–1665. [Google Scholar] [CrossRef]
  5. Bizzuti, B.E.; de Abreu Faria, L.; da Costa, W.S.; Lima, P.M.T.; Ovani, V.S.; Kruger, A.M.; Louvandini, H.; Abdalla, A.L. Potential use of cassava by-product as ruminant feed. Trop. Anim. Health Prod. 2021, 53, 108. [Google Scholar] [CrossRef]
  6. Bakare, A.G.; Zindove, T.J.; Iji, P.A.; Stamatopoulos, K.; Cowieson, A.J. A review of limitations to using cassava meal in poultry diets and the potential role of exogenous microbial enzymes. Trop. Anim. Health Prod. 2021, 53, 426. [Google Scholar] [CrossRef]
  7. Jiang, D.; Hao, M.; Fu, J.; Tian, G.; Ding, F. Estimating the potential of energy saving and carbon emission mitigation of cassava-based fuel ethanol using life cycle assessment coupled with a biogeochemical process model. Int. J. Biometeorol. 2019, 63, 701–710. [Google Scholar] [CrossRef]
  8. Lin, Z.; Liu, H.; Wu, J.; Patakova, P.; Branska, B.; Zhang, J. Effective continuous acetone-butanol-ethanol production with full utilization of cassava by immobilized symbiotic TSH06. Biotechnol. Biofuels 2019, 12, 219. [Google Scholar] [CrossRef]
  9. Nwose, E.U.; Onodu, B.C.; Anyasodor, A.E.; Sedowo, M.O.; Okuzor, J.N.; Culas, R.J. Ethnopharmacological values of cassava and its potential for diabetes and dyslipidemia management: Knowledge survey and critical review of report. J. Intercult. Ethnopharmacol. 2017, 6, 260–266. [Google Scholar] [CrossRef]
  10. Djabou, A.S.M.; Carvalho, L.; Li, Q.X.; Niemenak, N.; Chen, S. Cassava postharvest physiological deterioration: A complex phenomenon involving calcium signaling, reactive oxygen species and programmed cell death. Acta Physiol. Plant 2017, 39, 91. [Google Scholar] [CrossRef]
  11. Naziri, D.; Quaye, W.; Siwoku, B.; Wanlapatit, S.; Viet, P.; Bennett, C. JJoA, Tropics RDit, Subtropics: The diversity of postharvest losses in cassava value chains in selected developing countries. J. Agric. Rural. Dev. Trop. Subtrop. 2014, 115, 111–123. [Google Scholar]
  12. García, J.A.; Sánchez, T.; Ceballos, H.; Alonso, L. Non-destructive sampling procedure for biochemical or gene expression studies on post-harvest physiological deterioration of cassava roots. Postharvest Biol. Tec. 2013, 86, 529–535. [Google Scholar] [CrossRef]
  13. Zainuddin, I.M.; Fathoni, A.; Sudarmonowati, E.; Beeching, J.R.; Gruissem, W.; Vanderschuren, H. Cassava post-harvest physiological deterioration: From triggers to symptoms. Postharvest Biol. Tec. 2018, 142, 115–123. [Google Scholar] [CrossRef]
  14. Njoku, D.N.; Amadi, C.O.; Mbe, J.; Amanze, N.J. Strategies to overcome post-harvest physiological deterioration in cassava (Manihot esculenta) root: A review. Niger. Agric. J. 2014, 45, 126568023. [Google Scholar]
  15. Cortes, D.F.; Reilly, K.; Okogbenin, E.; Beeching, J.R.; Iglesias, C.; Tohme, J. Mapping wound-response genes involved in post-harvest physiological deterioration (PPD) of cassava (Manihot esculenta Crantz). Euphytica 2002, 128, 47–53. [Google Scholar] [CrossRef]
  16. Brito, A.C.; Oliveira, S.A.S.; Oliveira, E.J. Genome-wide association study for resistance to cassava root rot. J. Agric. Sci. 2017, 155, 1424–1441. [Google Scholar] [CrossRef]
  17. de Andrade, L.R.B.; Sousa, M.B.E.; Oliveira, E.J.; de Resende, M.D.V.; Azevedo, C.F. Cassava yield traits predicted by genomic selection methods. PLoS ONE 2019, 14, e0224920. [Google Scholar] [CrossRef] [Green Version]
  18. Torres, L.G.; de Resende, M.D.V.; Azevedo, C.F.; Silva, F.F.E.; de Oliveira, E.J. Genomic selection for productive traits in biparental cassava breeding populations. PLoS ONE 2019, 14, e0220245. [Google Scholar] [CrossRef] [Green Version]
  19. Lima, L.P.; Azevedo, C.F.; de Resende, M.D.V.; Silva, F.F.E.; Viana, J.M.S.; de Oliveira, E.J. Triple categorical regression for genomic selection: Application to cassava breeding. Sci. Agric. 2019, 76, 368–375. [Google Scholar] [CrossRef] [Green Version]
  20. Esuma, W.; Ozimati, A.; Kulakow, P.; Gore, M.A.; Wolfe, M.D.; Nuwamanya, E.; Egesi, C.; Kawuki, R.S. Effectiveness of genomic selection for improving provitamin A carotenoid content and associated traits in cassava. G3 Genes Genomes Genet. 2021, 11, jkab160. [Google Scholar] [CrossRef]
  21. Ozimati, A.; Kawuki, R.; Esuma, W.; Kayondo, S.I.; Pariyo, A.; Wolfe, M.; Jannink, J.L. Genetic Variation and Trait Correlations in an East African Cassava Breeding Population for Genomic Selection. Crop. Sci. 2019, 59, 460–473. [Google Scholar] [CrossRef] [Green Version]
  22. Chen, J.; Mao, L.; Lu, W.; Ying, T.; Luo, Z. Transcriptome profiling of postharvest strawberry fruit in response to exogenous auxin and abscisic acid. Planta 2016, 243, 183–197. [Google Scholar] [CrossRef] [PubMed]
  23. Liu, W.; Zhang, J.; Jiao, C.; Yin, X.; Fei, Z.; Wu, Q.; Chen, K. Transcriptome analysis provides insights into the regulation of metabolic processes during postharvest cold storage of loquat (Eriobotrya japonica) fruit. Hortic. Res. 2019, 6, 49. [Google Scholar] [CrossRef] [PubMed] [Green Version]
  24. Yu, Y.Y.; Dou, G.X.; Sun, X.X.; Chen, L.; Zheng, Y.; Xiao, H.M.; Wang, Y.P.; Li, H.Y.; Guo, J.H.; Jiang, C.H. Transcriptome and Biochemical Analysis Jointly Reveal the Effects of Bacillus cereus AR156 on Postharvest Strawberry Gray Mold and Fruit Quality. Front. Plant. Sci. 2021, 12, 700446. [Google Scholar] [CrossRef] [PubMed]
  25. Wu, M.X.; Zou, Y.; Yu, Y.H.; Chen, B.X.; Zheng, Q.W.; Ye, Z.W.; Wei, T.; Ye, S.Q.; Guo, L.Q.; Lin, J.F. Comparative transcriptome and proteome provide new insights into the regulatory mechanisms of the postharvest deterioration of Pleurotus tuoliensis fruitbodies during storage. Food Res. Int. 2021, 147, 110540. [Google Scholar] [CrossRef]
  26. Ding, Y.; Chang, J.; Ma, Q.; Chen, L.; Liu, S.; Jin, S.; Han, J.; Xu, R.; Zhu, A.; Guo, J.; et al. Network analysis of postharvest senescence process in citrus fruits revealed by transcriptomic and metabolomic profiling. Plant Physiol. 2015, 168, 357–376. [Google Scholar] [CrossRef]
  27. Li, T.; Wu, Q.; Duan, X.; Yun, Z.; Jiang, Y. Proteomic and transcriptomic analysis to unravel the influence of high temperature on banana fruit during postharvest storage. Funct. Integr. Genomics 2019, 19, 467–486. [Google Scholar] [CrossRef]
  28. Lin, Q.; Xie, Y.; Guan, W.; Duan, Y.; Wang, Z.; Sun, C. Combined transcriptomic and proteomic analysis of cold stress induced sugar accumulation and heat shock proteins expression during postharvest potato tuber storage. Food Chem. 2019, 297, 124991. [Google Scholar] [CrossRef]
  29. Huang, J.; Bachem, C.; Jacobsen, E.; Visser, R.G.F. Molecular analysis of differentially expressed genes during postharvest deterioration in cassava (Manihot esculenta Crantz) tuberous roots. Euphytica 2001, 120, 85–93. [Google Scholar] [CrossRef]
  30. Reilly, K.; Bernal, D.; Cortes, D.F.; Gomez-Vasquez, R.; Tohme, J.; Beeching, J.R. Towards identifying the full set of genes expressed during cassava post-harvest physiological deterioration. Plant Mol. Biol. 2007, 64, 187–203. [Google Scholar] [CrossRef]
  31. Hu, W.; Kong, H.; Guo, Y.; Zhang, Y.; Ding, Z.; Tie, W.; Yan, Y.; Huang, Q.; Peng, M.; Shi, H.; et al. Comparative Physiological and Transcriptomic Analyses Reveal the Actions of Melatonin in the Delay of Postharvest Physiological Deterioration of Cassava. Front. Plant. Sci. 2016, 7, 736. [Google Scholar] [CrossRef] [PubMed] [Green Version]
  32. Ma, Q.; Zhang, T.; Zhang, P.; Wang, Z.Y. Melatonin attenuates postharvest physiological deterioration of cassava storage roots. J. Pineal Res. 2016, 60, 424–434. [Google Scholar] [CrossRef] [PubMed]
  33. Yan, Y.; Zhao, S.; Ding, Z.; Tie, W.; Hu, W. Comparative Transcriptomic Analysis of Storage Roots in Cassava during Postharvest Physiological Deterioration. Plant Mol. Biol. Rep. 2021, 39, 607–616. [Google Scholar] [CrossRef]
  34. Uarrota, V.G.; Nunes Eda, C.; Peruch, L.A.; Neubert Ede, O.; Coelho, B.; Moresco, R.; Dominguez, M.G.; Sanchez, T.; Melendez, J.L.; Dufour, D.; et al. Toward better understanding of postharvest deterioration: Biochemical changes in stored cassava (Manihot esculenta Crantz) roots. Food Sci. Nutr. 2016, 4, 409–422. [Google Scholar] [CrossRef] [Green Version]
  35. Yuan, S.; Li, R.; Zhou, Y.; Qiu, T.; Yao, Y.; Liu, J.; Duan, R.; Fu, S.; Hu, X.; Guo, J. Comparative Analysis of Agronomic Traits and Leaf Physiological Indexes of Two Cassava Germplasms in Field. Mol. Plant Breed. 2018, 16, 2316–2321. [Google Scholar]
  36. Owiti, J.; Grossmann, J.; Gehrig, P.; Dessimoz, C.; Laloi, C.; Hansen, M.B.; Gruissem, W.; Vanderschuren, H. iTRAQ-based analysis of changes in the cassava root proteome reveals pathways associated with post-harvest physiological deterioration. Plant J. 2011, 67, 145–156. [Google Scholar] [CrossRef]
  37. Eum, H.L.; Han, S.H.; Lee, E.J. High-CO2 Treatment Prolongs the Postharvest Shelf Life of Strawberry Fruits by Reducing Decay and Cell Wall Degradation. Foods 2021, 10, 1649. [Google Scholar] [CrossRef]
  38. Zhu, Y.; Wang, K.; Wu, C.; Zhao, Y.; Yin, X.; Zhang, B.; Grierson, D.; Chen, K.; Xu, C. Effect of Ethylene on Cell Wall and Lipid Metabolism during Alleviation of Postharvest Chilling Injury in Peach. Cells 2019, 8, 1612. [Google Scholar] [CrossRef] [Green Version]
  39. Shi, Z.; Yang, H.; Jiao, J.; Wang, F.; Lu, Y.; Deng, J. Effects of graft copolymer of chitosan and salicylic acid on reducing rot of postharvest fruit and retarding cell wall degradation in grapefruit during storage. Food Chem. 2019, 283, 92–100. [Google Scholar] [CrossRef]
  40. An, F.; Baker, M.R.; Qin, Y.; Chen, S.; Li, Q.X. Relevance of Class I alpha-Mannosidases to Cassava Postharvest Physiological Deterioration. ACS Omega 2019, 4, 8739–8746. [Google Scholar] [CrossRef] [Green Version]
  41. Michailidis, M.; Karagiannis, E.; Tanou, G.; Sarrou, E.; Stavridou, E.; Ganopoulos, I.; Karamanoli, K.; Madesis, P.; Martens, S.; Molassiotis, A. An integrated metabolomic and gene expression analysis identifies heat and calcium metabolic networks underlying postharvest sweet cherry fruit senescence. Planta 2019, 250, 2009–2022. [Google Scholar] [CrossRef] [PubMed]
  42. Wen, S.Y.; Neuhaus, H.E.; Cheng, J.T.; Bie, Z.L. Contributions of sugar transporters to crop yield and fruit quality. J. Exp. Bot. 2022, 73, 2275–2289. [Google Scholar] [CrossRef] [PubMed]
  43. Wang, Y.P.; Zhang, Z.J.; Wang, X.C.; Yuan, X.; Wu, Q.; Chen, S.Y.; Zou, Y.J.; Ma, F.W.; Li, C. Exogenous dopamine improves apple fruit quality via increasing flavonoids and soluble sugar contents. Sci. Hortic. 2021, 280, 109903. [Google Scholar] [CrossRef]
  44. Bechoff, A.; Tomlins, K.; Fliedel, G.; Lopez-Lavalle, L.A.B.; Westby, A.; Hershey, C.; Dufour, D. Cassava traits and end-user preference: Relating traits to consumer liking, sensory perception, and genetics. Crit. Rev. Food Sci. Nutr. 2018, 58, 547–567. [Google Scholar] [CrossRef]
  45. Saleh, H.; Mohammed, S.; Khamis, F.K.; Taib, H.J. On-farm testing of selected cassava clones. Afr. Crop. Sci. J. 2005, 12, 283–288. [Google Scholar] [CrossRef] [Green Version]
  46. de Araujo, F.D.B.; Moura, E.F.; Cunha, R.L.; Neto, J.T.D.; Silva, R.D. Chemical root traits differentiate ‘bitter’ and ‘sweet’ cassava accessions from the Amazon. Crop. Breed. Appl. Biotechnol. 2019, 19, 77–85. [Google Scholar] [CrossRef]
  47. Xu, W.J.; Wei, Y.Y.; Wang, X.X.; Han, P.P.; Chen, Y.; Xu, F.; Shao, X.F. Molecular cloning and expression analysis of hexokinase genes in peach fruit under postharvest disease stress. Postharvest Biol. Tec. 2021, 172, 111377. [Google Scholar] [CrossRef]
  48. Alves, H.L.S.; Matiolli, C.C.; Soares, R.C.; Almadanim, M.C.; Oliveira, M.M.; Abreu, I.A. Carbon/nitrogen metabolism and stress response networks—calcium-dependent protein kinases as the missing link? J. Exp. Bot. 2021, 72, 4190–4201. [Google Scholar] [CrossRef]
  49. Favre, N.; Bárcena, A.; Bahima, J.V.; Martínez, G.; Costa, L. Pulses of low intensity light as promising technology to delay postharvest senescence of broccoli. Postharvest Biol. Tec. 2018, 142, 107–114. [Google Scholar] [CrossRef]
  50. Yan, Z.; Zuo, J.; Zhou, F.; Shi, J.; Xu, D.; Hu, W.; Jiang, A.; Liu, Y.; Wang, Q. Integrated Analysis of Transcriptomic and Metabolomic Data Reveals the Mechanism by Which LED Light Irradiation Extends the Postharvest Quality of Pak-choi (Brassica campestris L. ssp. chinensis (L.) Makino var. communis Tsen et Lee). Biomolecules 2020, 10, 252. [Google Scholar] [CrossRef] [Green Version]
  51. Büchert, A.M.; Civello, P.M.; Martínez, G.A. Effect of hot air, UV-C, white light and modified atmosphere treatments on expression of chlorophyll degrading genes in postharvest broccoli (Brassica oleracea L.) florets. Sci. Hortic. 2011, 127, 214–219. [Google Scholar] [CrossRef]
  52. Zhang, Y.; Ma, Y.; Guo, Y.; Chen, Y.; Yang, M.; Fu, R.; Sun, Y. Physiological and iTRAQ-based proteomic analyses for yellowing of postharvest broccoli heads under elevated O2 controlled atmosphere. Sci. Hortic. 2022, 294, 110769. [Google Scholar] [CrossRef]
  53. Zhou, H.; Yu, Z.; Ye, Z. Key proteins associated to coloured compounds of peach peel using iTRAQ proteomic techniques during development and postharvest. Sci. Hortic. 2018, 239, 123–132. [Google Scholar] [CrossRef]
  54. Kasampalis, D.S.; Tsouvaltzis, P.; Siomos, A.S. Chlorophyll fluorescence, non-photochemical quenching and light harvesting complex as alternatives to color measurement, in classifying tomato fruit according to their maturity stage at harvest and in monitoring postharvest ripening during storage. Postharvest Biol. Tec. 2020, 161, 111036. [Google Scholar] [CrossRef]
  55. Flores, H.E.; Dai, Y.; Cuello, J.L.; Maldonado-Mendoza, I.E.; Loyola-Vargas, V.M. Green Roots: Photosynthesis and Photoautotrophy in an Underground Plant Organ. Plant Physiol. 1993, 101, 363–371. [Google Scholar] [CrossRef] [Green Version]
  56. McClure, P.R.; Coker, G.T.; Schubert, K.R. Carbon Dioxide Fixation in Roots and Nodules of Alnus glutinosa: I. Role of Phosphoenolpyruvate Carboxylase and Carbamyl Phosphate Synthetase in Dark CO(2) Fixation, Citrulline Synthesis, and N(2) Fixation. Plant Physiol. 1983, 71, 652–657. [Google Scholar] [CrossRef] [Green Version]
  57. Saithong, T.; Rongsirikul, O.; Kalapanulak, S.; Chiewchankaset, P.; Siriwat, W.; Netrphan, S.; Suksangpanomrung, M.; Meechai, A.; Cheevadhanarak, S. Starch biosynthesis in cassava: A genome-based pathway reconstruction and its exploitation in data integration. BMC Syst. Biol. 2013, 7, 75. [Google Scholar] [CrossRef] [Green Version]
  58. Basha, E.; Jones, C.; Wysocki, V.; Vierling, E. Mechanistic Differences between Two Conserved Classes of Small Heat Shock Proteins Found in the Plant Cytosol. J. Biol. Chem. 2010, 285, 11489–11497. [Google Scholar] [CrossRef] [Green Version]
  59. Yun, Z.; Gao, H.; Liu, P.; Liu, S.; Luo, T.; Jin, S.; Xu, Q.; Xu, J.; Cheng, Y.; Deng, X. Comparative proteomic and metabolomic profiling of citrus fruit with enhancement of disease resistance by postharvest heat treatment. BMC Plant Biol. 2013, 13, 44. [Google Scholar] [CrossRef] [Green Version]
  60. Ugolini, L.; Righetti, L.; Carbone, K.; Paris, R.; Malaguti, L.; Di Francesco, A.; Micheli, L.; Paliotta, M.; Mari, M.; Lazzeri, L. Postharvest application of brassica meal-derived allyl-isothiocyanate to kiwifruit: Effect on fruit quality, nutraceutical parameters and physiological response. J. Food Sci. Technol. 2017, 54, 751–760. [Google Scholar] [CrossRef] [Green Version]
  61. Vanderschuren, H.; Nyaboga, E.; Poon, J.S.; Baerenfaller, K.; Grossmann, J.; Hirsch-Hoffmann, M.; Kirchgessner, N.; Nanni, P.; Gruissem, W. Large-Scale Proteomics of the Cassava Storage Root and Identification of a Target Gene to Reduce Postharvest Deterioration. Plant Cell. 2014, 26, 1913–1924. [Google Scholar] [CrossRef] [PubMed] [Green Version]
  62. Zhang, F.; Ji, S.; Wei, B.; Cheng, S.; Wang, Y.; Hao, J.; Wang, S.; Zhou, Q. Transcriptome analysis of postharvest blueberries (Vaccinium corymbosum ‘Duke’) in response to cold stress. BMC Plant Biol. 2020, 20, 80. [Google Scholar] [CrossRef] [Green Version]
  63. Busatto, N.; Farneti, B.; Tadiello, A.; Oberkofler, V.; Cellini, A.; Biasioli, F.; Delledonne, M.; Cestaro, A.; Noutsos, C.; Costa, F. Wide transcriptional investigation unravel novel insights of the on-tree maturation and postharvest ripening of ‘Abate Fetel’ pear fruit. Hortic. Res. 2019, 6, 32. [Google Scholar] [CrossRef] [PubMed]
  64. Folsche, V.; Grossmann, C.; Richter, A.S. Impact of Porphyrin Binding to GENOMES UNCOUPLED 4 on Tetrapyrrole Biosynthesis in planta. Front. Plant Sci. 2022, 13, 850504. [Google Scholar] [CrossRef] [PubMed]
  65. Wang, T.; Liu, S.; Tian, S.; Ma, T.; Wang, W. Light regulates chlorophyll biosynthesis via ELIP1 during the storage of Chinese cabbage. Sci. Rep. 2022, 12, 11098. [Google Scholar] [CrossRef] [PubMed]
  66. Wang, P.; Li, C.; Wang, Y.; Huang, R.; Sun, C.; Xu, Z.; Zhu, J.; Gao, X.; Deng, X.; Wang, P. Identification of a Geranylgeranyl reductase gene for chlorophyll synthesis in rice. Springerplus 2014, 3, 201. [Google Scholar] [CrossRef] [Green Version]
  67. Hou, Q.; Bartels, D. Comparative study of the aldehyde dehydrogenase (ALDH) gene superfamily in the glycophyte Arabidopsis thaliana and Eutrema halophytes. Ann. Bot. 2015, 115, 465–479. [Google Scholar] [CrossRef] [Green Version]
  68. Hao, J.; Petriacq, P.; de Bont, L.; Hodges, M.; Gakiere, B. Characterization of l-aspartate oxidase from Arabidopsis thaliana. Plant Sci. 2018, 271, 133–142. [Google Scholar] [CrossRef]
  69. Bi, F.; Barad, S.; Ment, D.; Luria, N.; Dubey, A.; Casado, V.; Glam, N.; Minguez, J.D.; Espeso, E.A.; Fluhr, R.; et al. Carbon regulation of environmental pH by secreted small molecules that modulate pathogenicity in phytopathogenic fungi. Mol. Plant Pathol. 2016, 17, 1178–1195. [Google Scholar] [CrossRef] [Green Version]
  70. Tian, J.; Pang, Y.; Zhao, Z. Drought, Salinity, and Low Nitrogen Differentially Affect the Growth and Nitrogen Metabolism of Sophora japonica (L.) in a Semi-Hydroponic Phenotyping Platform. Front. Plant Sci. 2021, 12, 715456. [Google Scholar] [CrossRef]
  71. Tsilikochrisos, G.; Tsaniklidis, G.; Delis, C.; Nikoloudakis, N.; Aivalakis, G. Glutamate dehydrogenase is differentially regulated in seeded and parthenocarpic tomato fruits during crop development and postharvest storage. Sci. Hortic. 2015, 181, 34–42. [Google Scholar] [CrossRef]
  72. Pratta, G.; Zorzoli, R.; Boggio, S.B.; Picardi, L.A.; Valle, E.M. Glutamine and glutamate levels and related metabolizing enzymes in tomato fruits with different shelf-life. J. Sci. Horticulturae. 2004, 100, 341–347. [Google Scholar] [CrossRef]
  73. Ferraro, G.; Bortolotti, S.; Mortera, P.; Schlereth, A.; Stitt, M.; Carrari, F.; Kamenetzky, L.; Valle, E.M. Novel glutamate dehydrogenase genes show increased transcript and protein abundances in mature tomato fruits. J. Plant Physiol. 2012, 169, 899–907. [Google Scholar] [CrossRef] [PubMed]
  74. Intarasit, S.; Faiyue, B.; Uthaibutra, J.; Saengnil, K. Amelioration of nitrosative stress to reduce pericarp browning of harvested longan by chlorine dioxide. Sci. Hortic. 2022, 293, 110678. [Google Scholar] [CrossRef]
  75. Sun, Q.; Zhang, N.; Wang, J.; Zhang, H.; Li, D.; Shi, J.; Li, R.; Weeda, S.; Zhao, B.; Ren, S. Melatonin promotes ripening and improves quality of tomato fruit during postharvest life. J. Exp. Botany 2015, 66, 657–668. [Google Scholar] [CrossRef] [Green Version]
  76. He, Y.; Li, R.; Lin, F.; Xiong, Y.; Wang, L.; Wang, B.; Guo, J.; Hu, C. Transcriptome Changes Induced by Different Potassium Levels in Banana Roots. Plants 2019, 9, 11. [Google Scholar] [CrossRef] [Green Version]
  77. Prochnik, S.; Marri, P.R.; Desany, B.; Rabinowicz, P.D.; Kodira, C.; Mohiuddin, M.; Rodriguez, F.; Fauquet, C.; Tohme, J.; Harkins, T.; et al. The Cassava Genome: Current Progress, Future Directions. Trop. Plant Biol. 2012, 5, 88–94. [Google Scholar] [CrossRef] [Green Version]
  78. Wesolowski, S.; Birtwistle, M.R.; Rempala, G.A. A Comparison of Methods for RNA-Seq Differential Expression Analysis and a New Empirical Bayes Approach. Biosensors 2013, 3, 238–258. [Google Scholar] [CrossRef] [Green Version]
  79. Shannon, P.; Markiel, A.; Ozier, O.; Baliga, N.S.; Wang, J.T.; Ramage, D.; Amin, N.; Schwikowski, B.; Ideker, T. Cytoscape: A software environment for integrated models of biomolecular interaction networks. Genome Res. 2003, 13, 2498–2504. [Google Scholar] [CrossRef]
  80. Chin, C.H.; Chen, S.H.; Wu, H.H.; Ho, C.W.; Ko, M.T.; Lin, C.Y. cytoHubba: Identifying hub objects and sub-networks from complex interactome. BMC Syst. Biol. 2014, 8, S11. [Google Scholar] [CrossRef]
Figure 1. PPD detection results for the SC8 and RYG1 cassavas after the proximal and distal ends were removed.
Ijms 24 00246 g001
Figure 2. Transmission electron microscopy images of SC8 and RYG1 cassava. CW, cell wall. Blue arrow, plasma membrane invagination. Red arrow, cell wall collapse. The white lines indicate 2 μm.
Ijms 24 00246 g002
Figure 3. Quality assessment of transcriptomes. (a) Spearman’s correlation analysis between biological replicates for RNA-seq. Color levels correspond to the degree of correlation in each replicate. (b) Principal component analysis (PCA) of the whole transcriptome in cassava samples.
Ijms 24 00246 g003
Figure 4. Differentially expressed gene analysis of FR, SR, FS and SS. (a) DEGs in statistics for FR vs. FS, SR vs. SS, SS vs. FS and SR vs. FR. The ordinate value represents the number of DEG. (b) Venn diagram depicting co-expressed and specific expressed DEGs in the pairwise comparisons: SR vs. SS, SS vs. FS and SR vs. FR. (c) Heatmap of the selected 2008 (322, 947 and 729) common DEGs. The color scale represents Z-score. (d) The upregulated and downregulated genes in the 2008 common DEGs. The ordinate value represents the number of co-DEG.
Ijms 24 00246 g004
Figure 5. qRT-PCR validation of the RNA sequencing results for selected DEGs. The grey bars represent the FPKM values of genes from RNA-seq. The blue bars represent the values determined by qRT-PCR. The error bars indicate the standard deviation. The characters on the top of each bar indicate a significant difference.
Ijms 24 00246 g005
Figure 6. Heatmap of differentially expressed genes related to photosynthesis (a), protein processing in endoplasmic reticulum (b), galactose metabolism and starch and (c), cell wall (d), cutin, suberin and wax biosynthesis (e) and phenylpropanoid biosynthesis and flavonoid biosynthesis (f).
Ijms 24 00246 g006aIjms 24 00246 g006b
Figure 7. Differentially expressed genes in the plant hormone signal transduction pathway.
Ijms 24 00246 g007
Figure 8. Heatmap of differentially expressed genes related to transcriptional regulation.
Ijms 24 00246 g008
Figure 9. Network analysis of co-DEGs and hub gene identification. (a) The networks of co-DEGs. The different colors indicate the diverse pathways that genes participated in. (b) Hub genes with edges numbering more than 15 selected from the network of co-DEGs by using cytoHubba plugin in Cytoscape v3.9.0. The color of nodes from red to yellow represents the degree of connectivity of nodes, with red being highly connected and yellow weakly connected. The “+” indicates upregulated genes in SR vs. SS, while the “-” indicates the downregulated genes in SR vs. SS. (c) The differential expression of hub genes. The red cells from light to dark indicate upregulation. The green cells from light to dark indicate downregulation. The white cell indicates no significant difference.
Ijms 24 00246 g009
Table 1. KEGG pathway enrichment of co-DEGs.
ClassifyPathway IDDescriptionGene NumberFalse Discovery Rate
upregulatedEnergy metabolismmap00195Photosynthesis100.00024
map00196Photosynthesis—antenna proteins60.00036
Folding, sorting and degradationmap04141Protein processing in endoplasmic reticulum292.08 × 10−9
Global and overview mapsmap01110Biosynthesis of secondary metabolites510.0252
Lipid metabolismmap00062Fatty acid elongation50.0418
map00073Cutin, suberine and wax biosynthesis70.0021
Signal transductionmap04075Plant hormone signal transduction180.0156
downregulatedAmino acid metabolismmap00250Alanine, aspartate and glutamate metabolism90.0058
map00270Cysteine and methionine metabolism239.50 × 10−7
map00400Phenylalanine, tyrosine and tryptophan biosynthesis90.0061
Biosynthesis of other secondary metabolitesmap00940Phenylpropanoid biosynthesis428.91 × 10−14
map00941Flavonoid biosynthesis80.034
map00945Stilbenoid, diarylheptanoid and gingerol biosynthesis80.0082
Carbohydrate metabolismmap00052Galactose metabolism90.0153
map00500Starch and sucrose metabolism160.0136
map00520Amino sugar and nucleotide sugar metabolism140.0315
Global and overview mapsmap01100Metabolic pathways2112.41 × 10−21
map01110Biosynthesis of secondary metabolites1492.07 × 10−22
map01200Carbon metabolism270.0041
map01230Biosynthesis of amino acids270.00043
Metabolism of other amino acidsmap00450Selenocompound metabolism50.0282
map00460Cyanoamino acid metabolism90.0035
map00480Glutathione metabolism244.65 × 10−9
Metabolism of terpenoids and polyketidesmap00900Terpenoid backbone biosynthesis130.00043
map00904Diterpenoid biosynthesis60.03
Signal transductionmap04016MAPK signaling pathway—plant242.89 × 10−5
Disclaimer/Publisher’s Note: The statements, opinions and data contained in all publications are solely those of the individual author(s) and contributor(s) and not of MDPI and/or the editor(s). MDPI and/or the editor(s) disclaim responsibility for any injury to people or property resulting from any ideas, methods, instructions or products referred to in the content.

