
Spatiotemporal Gene Expression Regions along the Anterior–Posterior Axis in Mouse Embryos before and after Palatal Elevation

 , and
, and 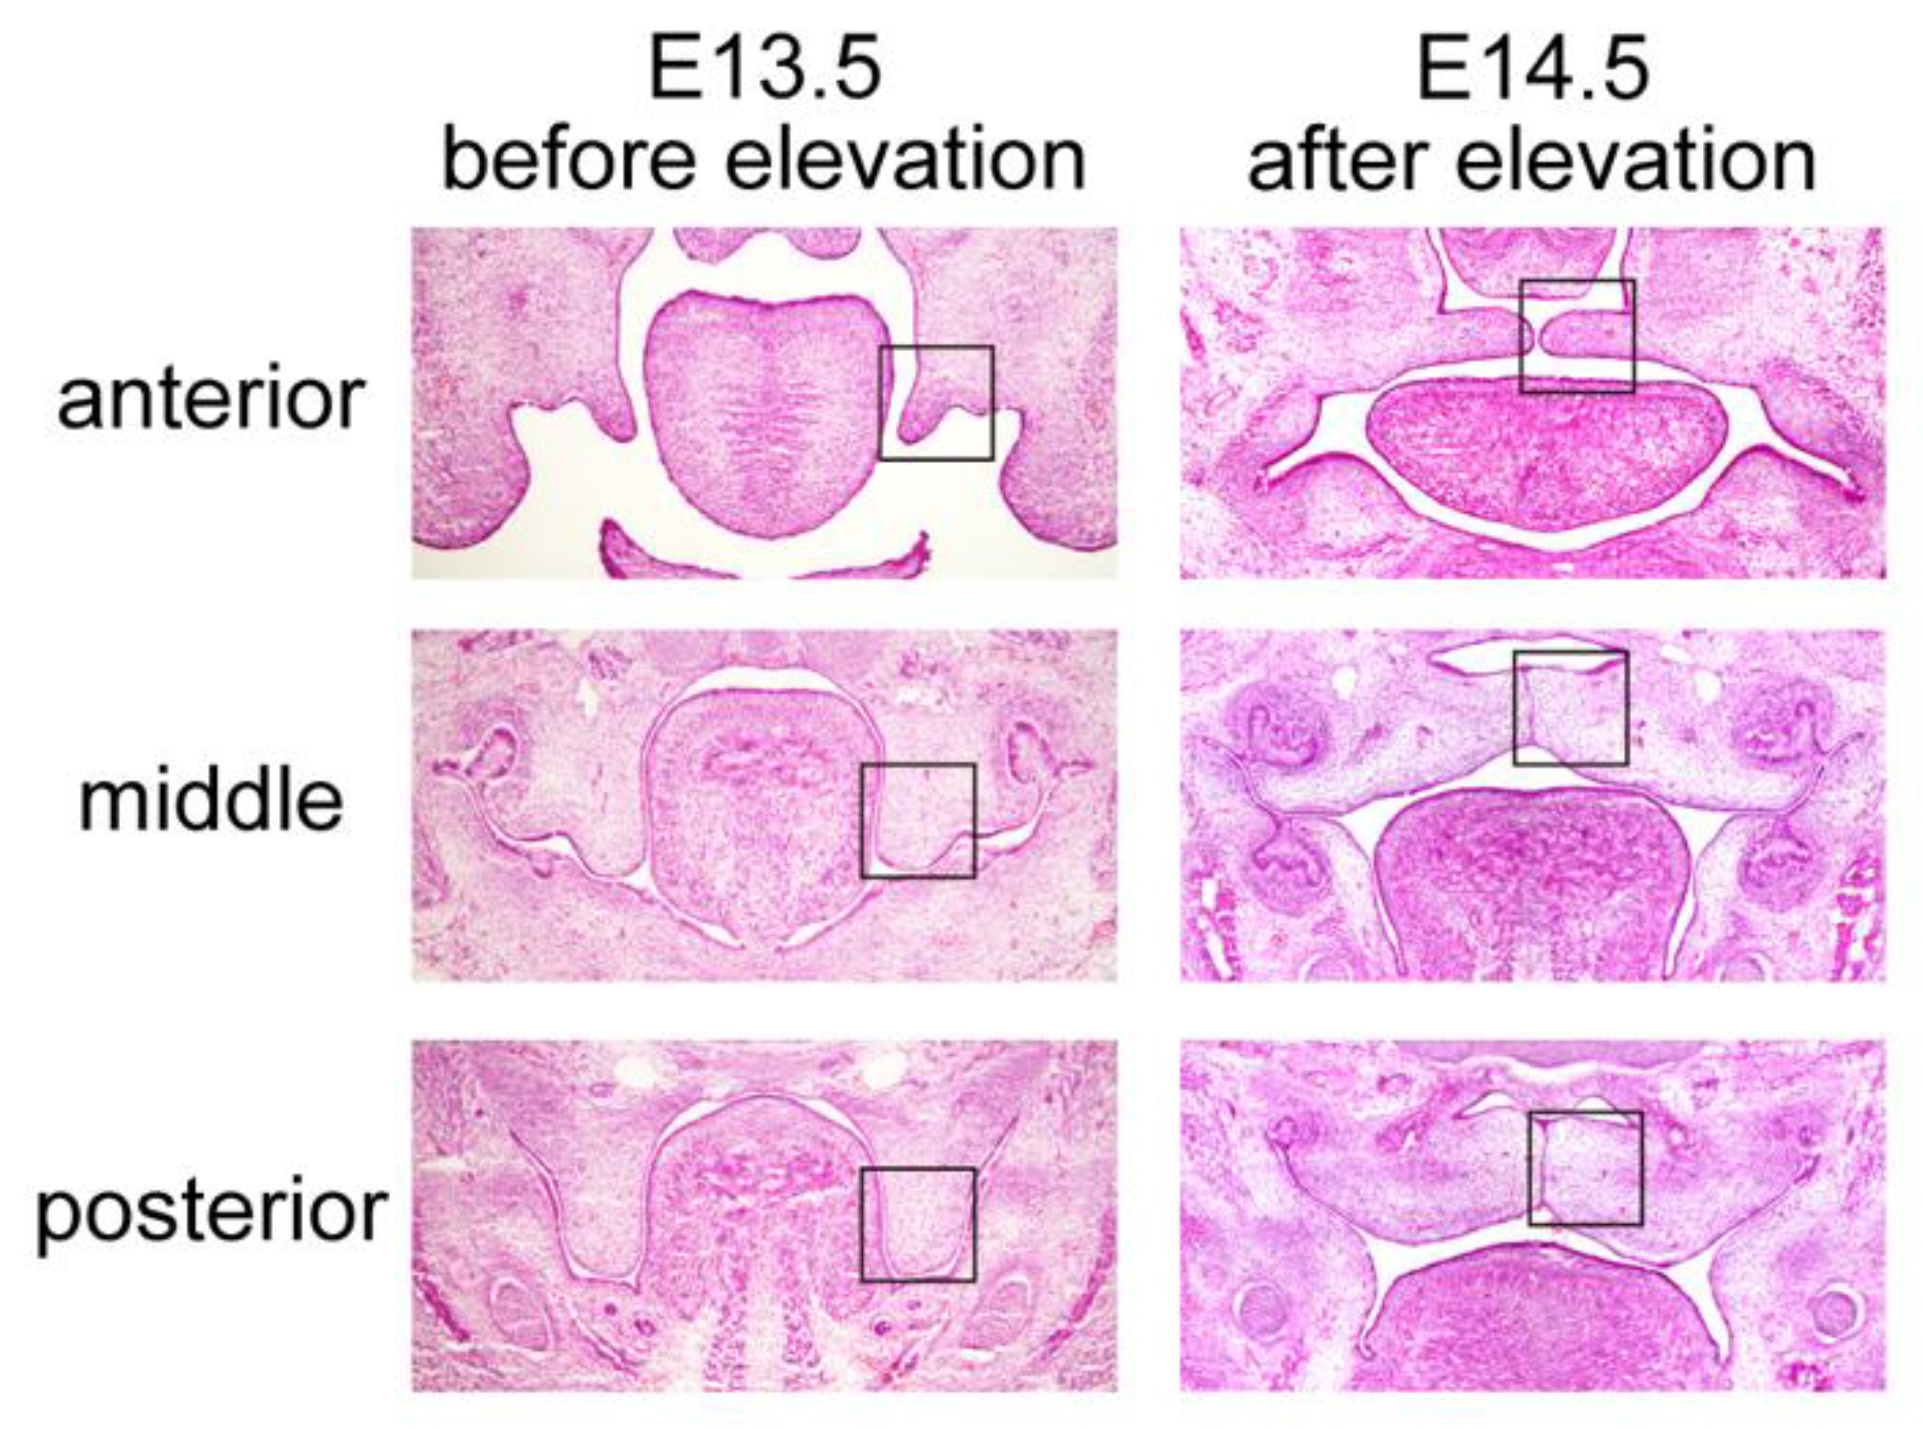
Abstract
:1. Introduction
2. Materials and Methods
2.1. Animals
2.2. Immunofluorescence
2.3. Preparation of Palatal Shelf Samples for Real-Time PCR
2.4. Quantitative Real-Time PCR
3. Results
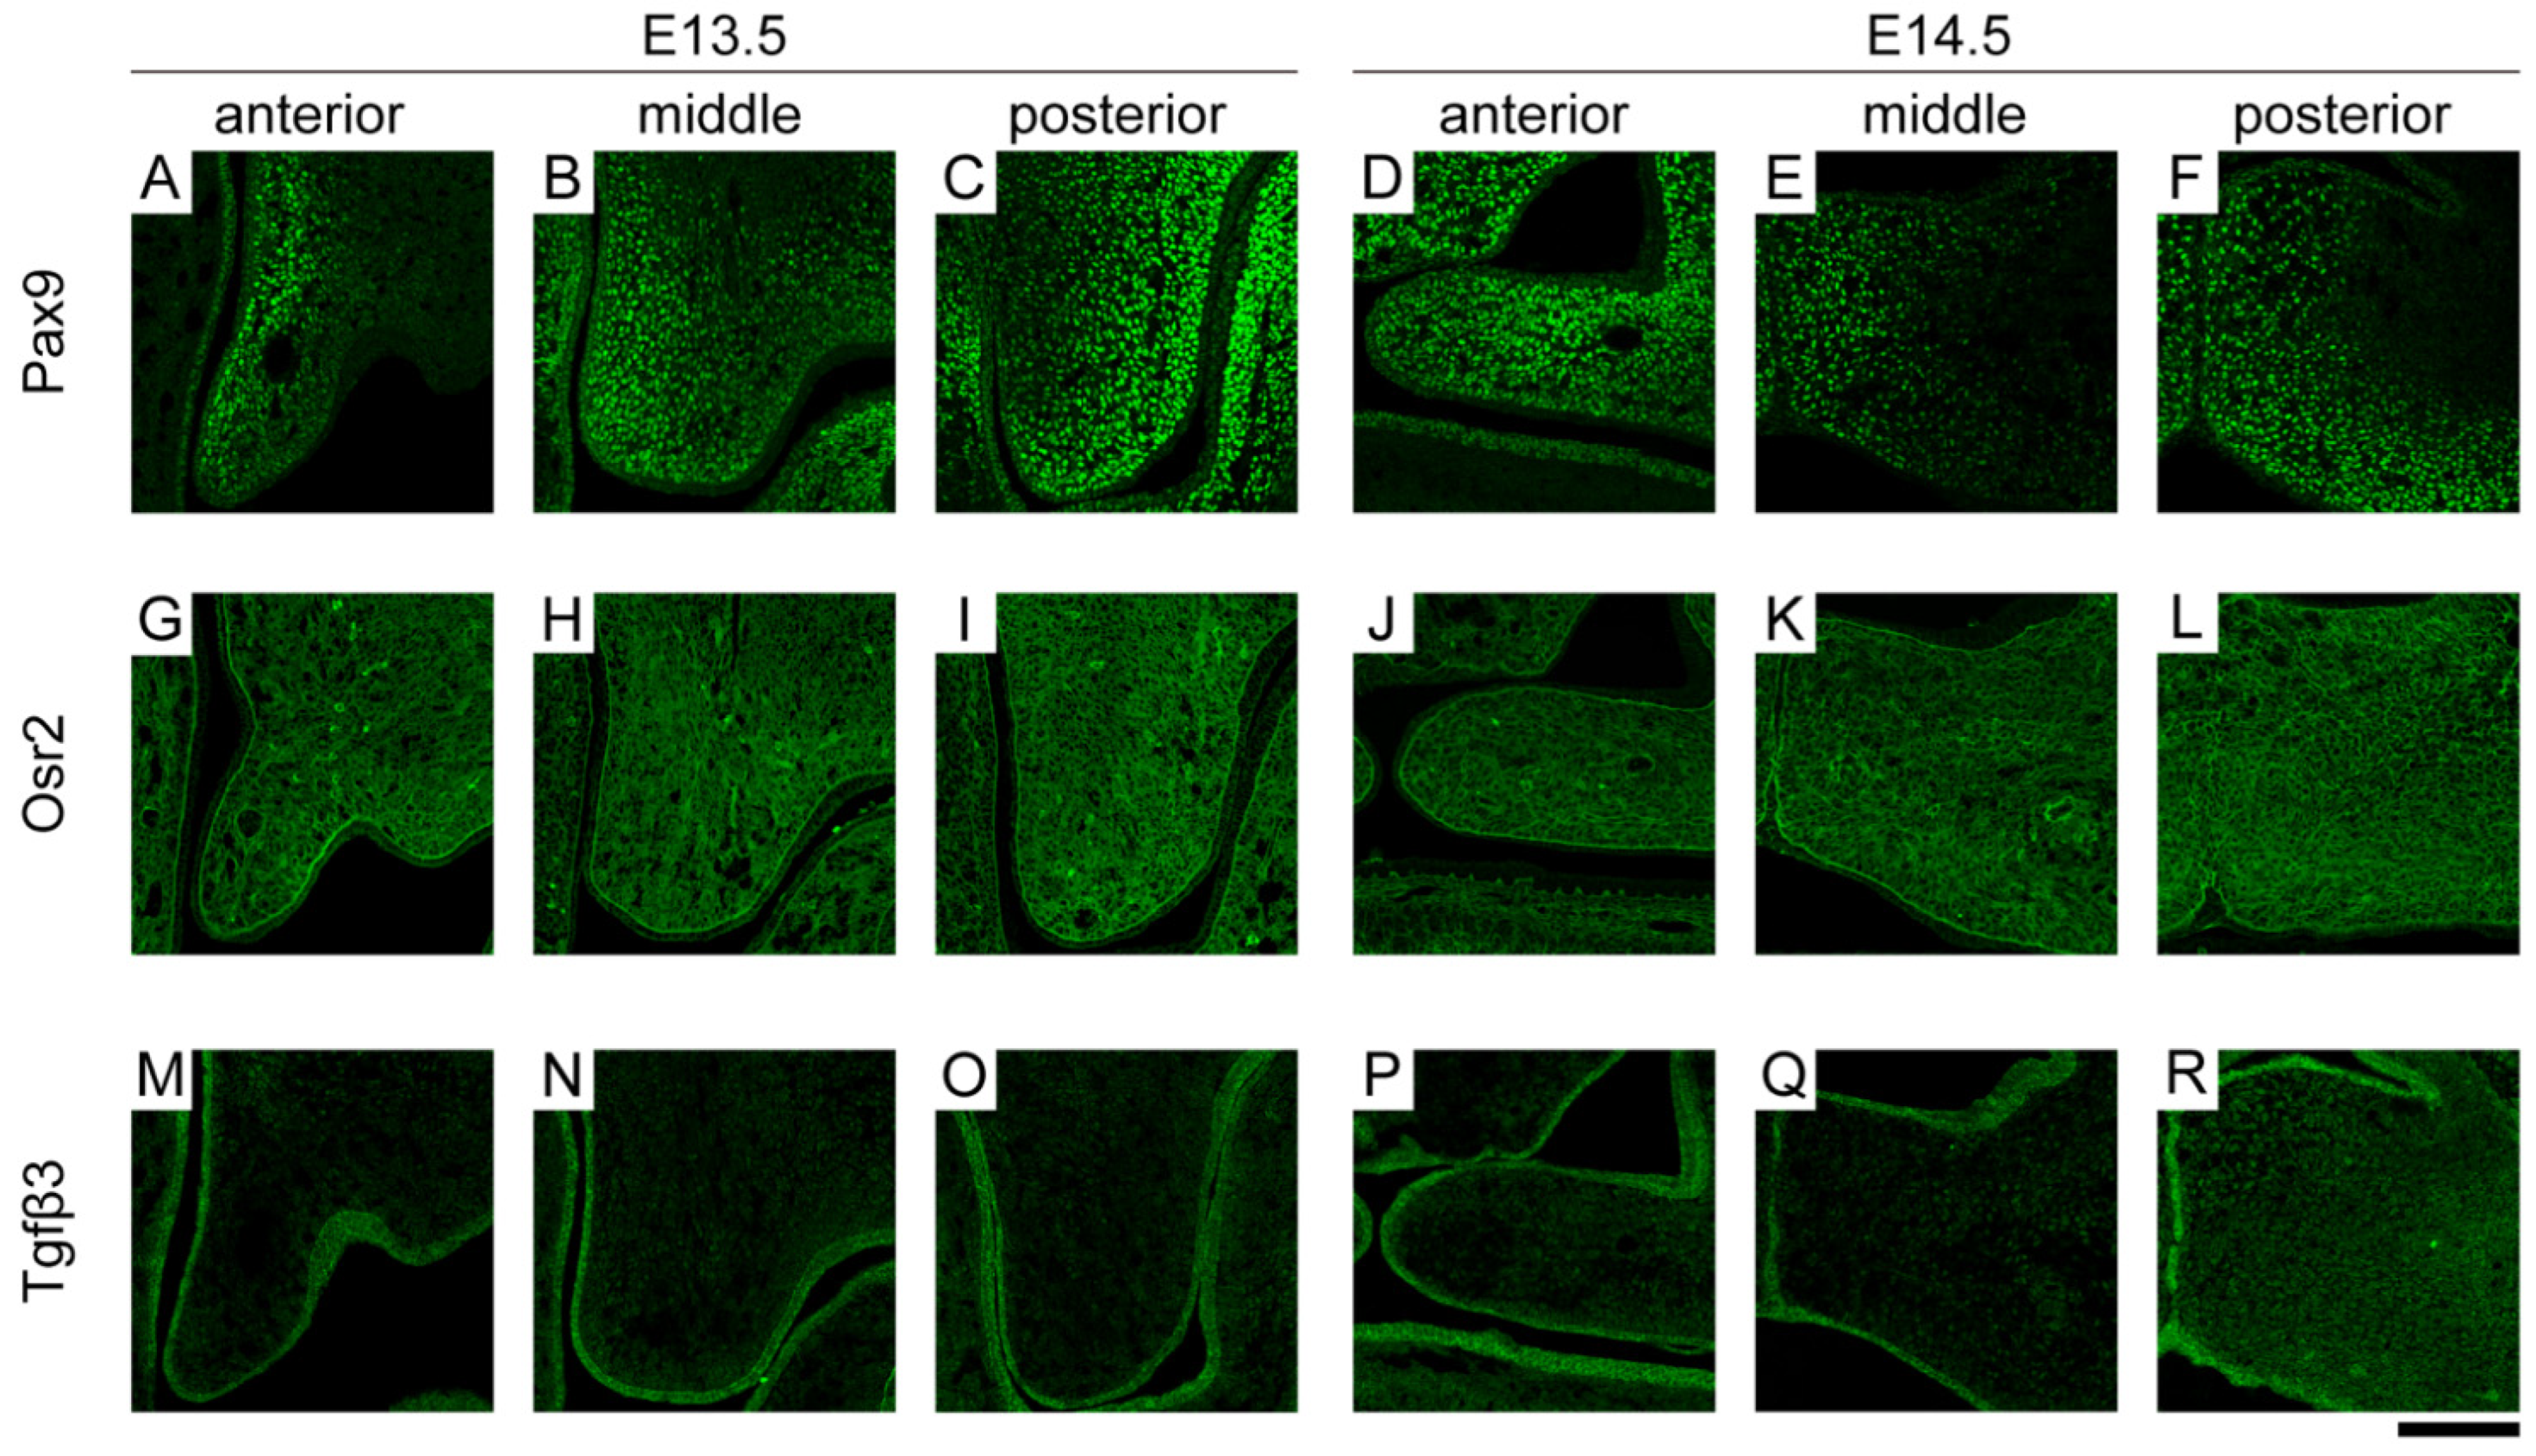
3.1. Spatiotemporal Expression Location of Molecules Related to Palatal Shelf Elevation
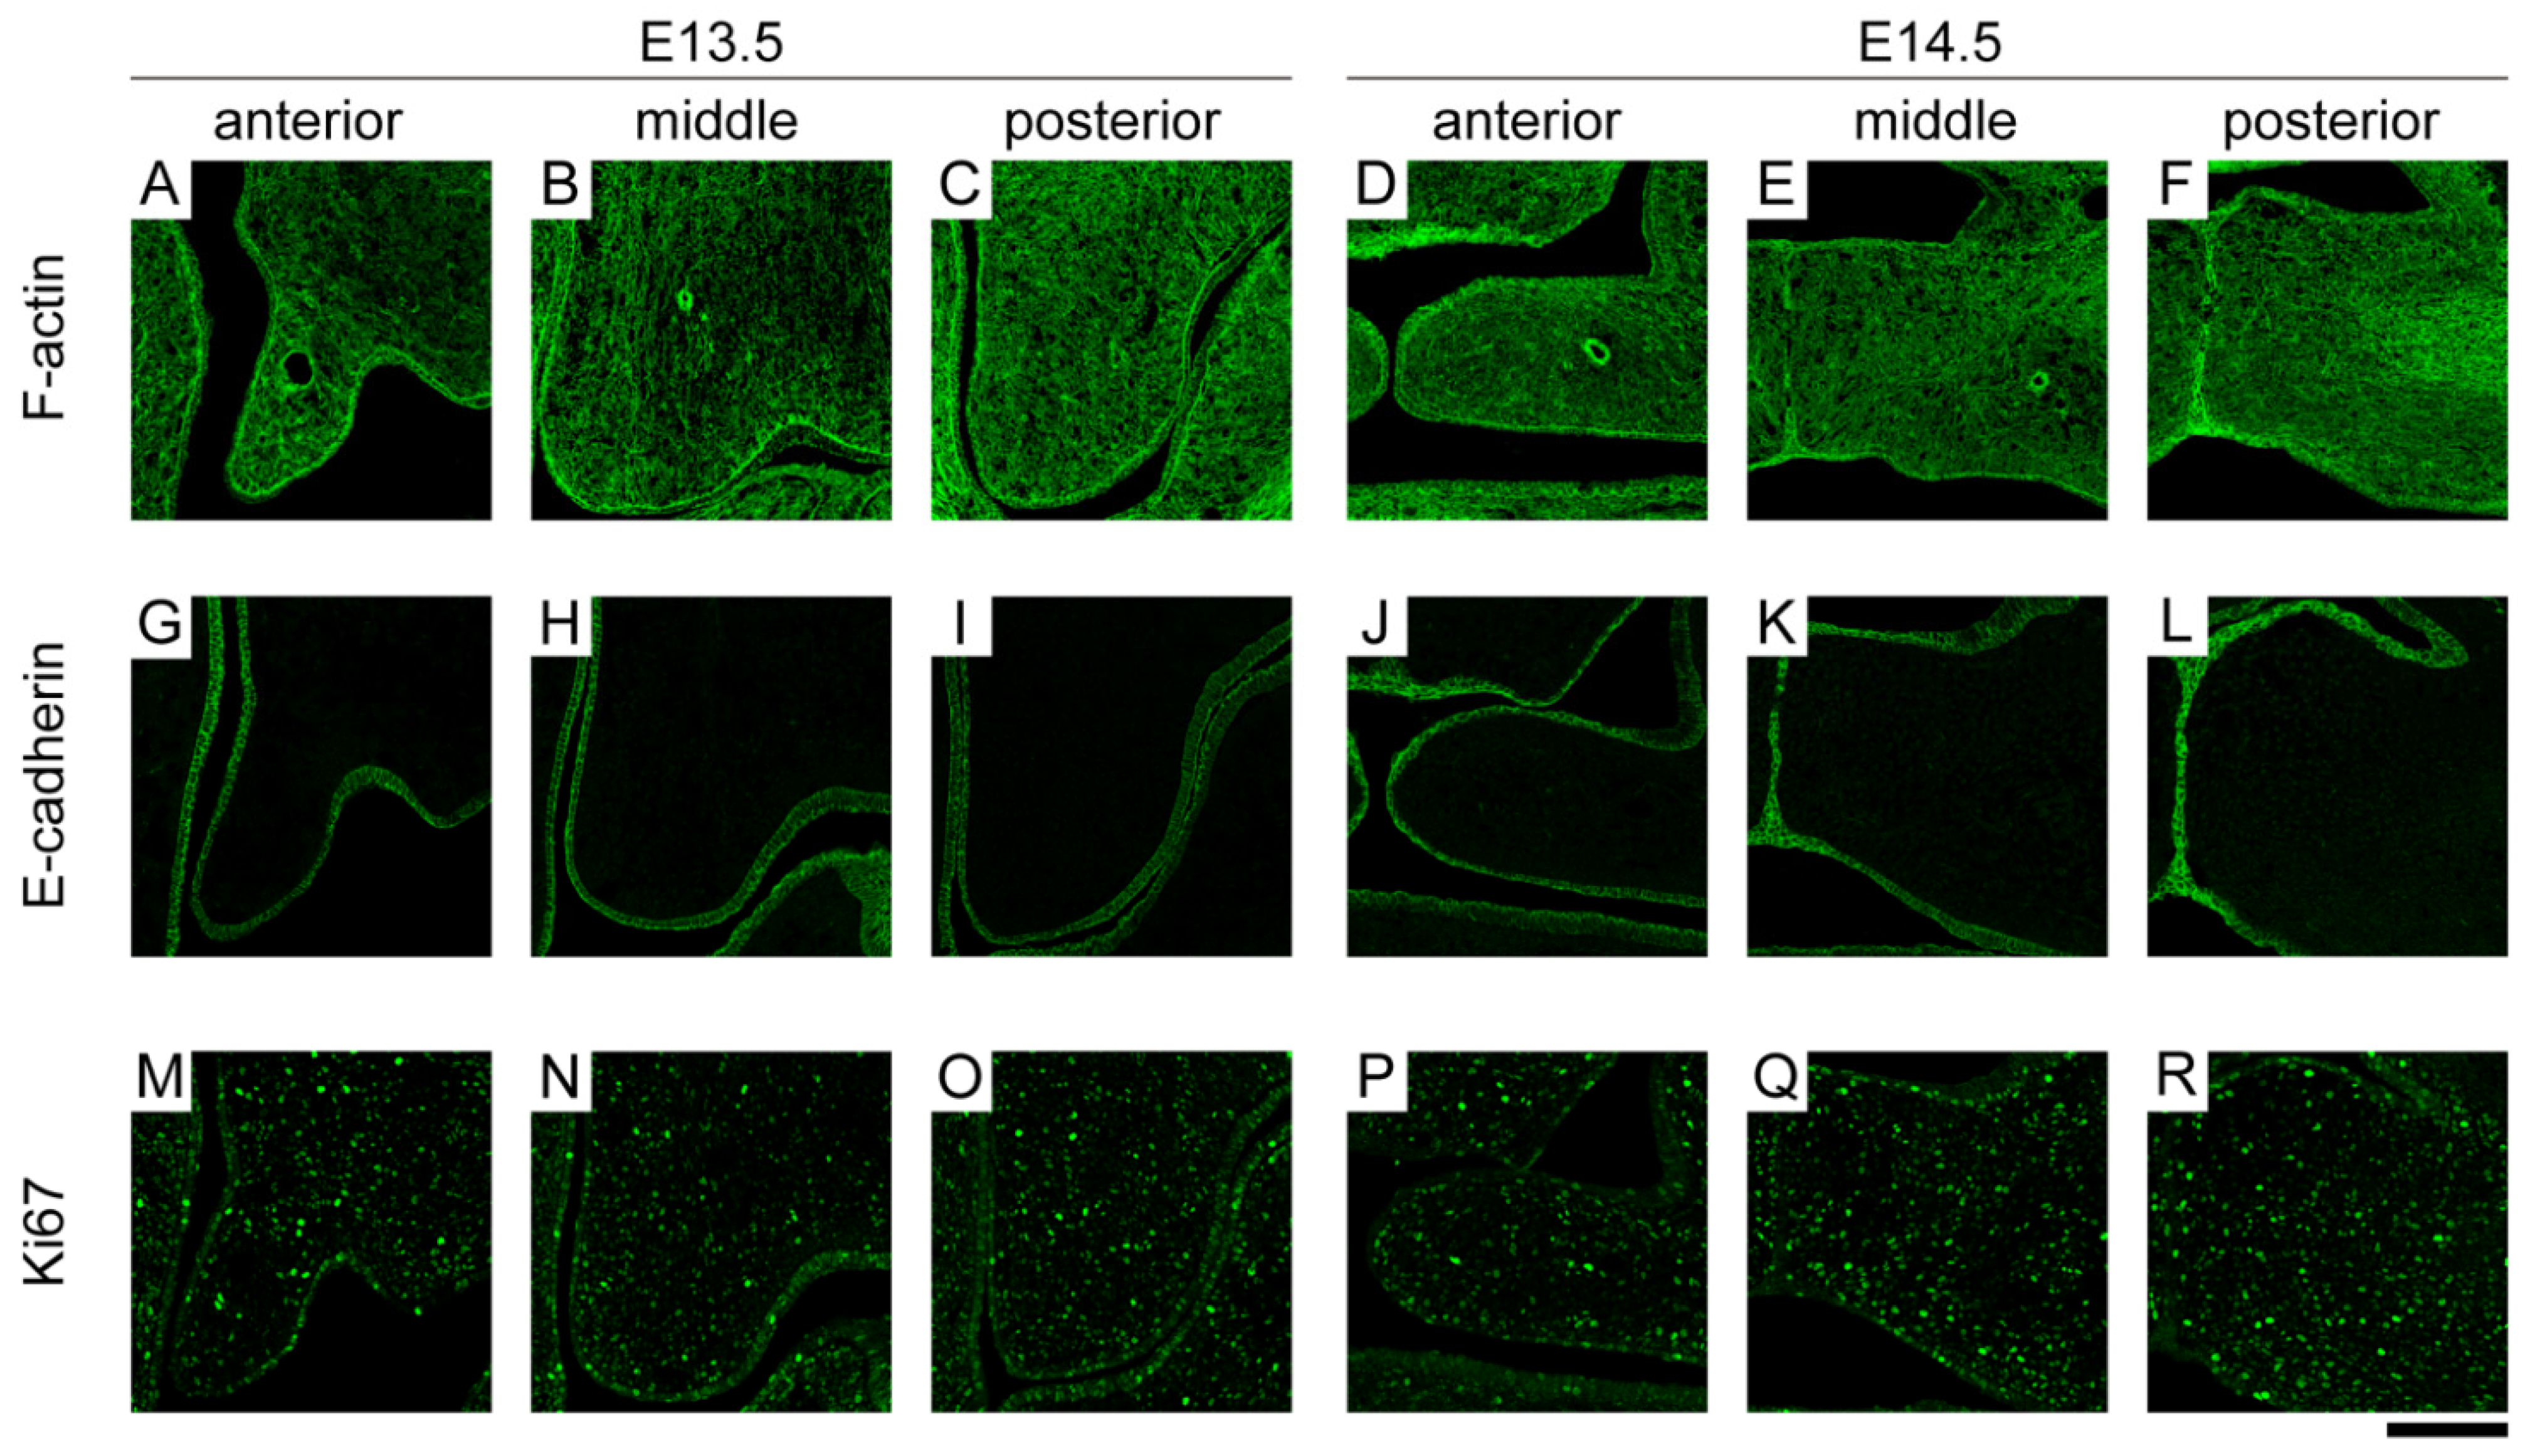
3.2. Spatiotemporal Expression Location of Molecules Related to Tissue Deformation
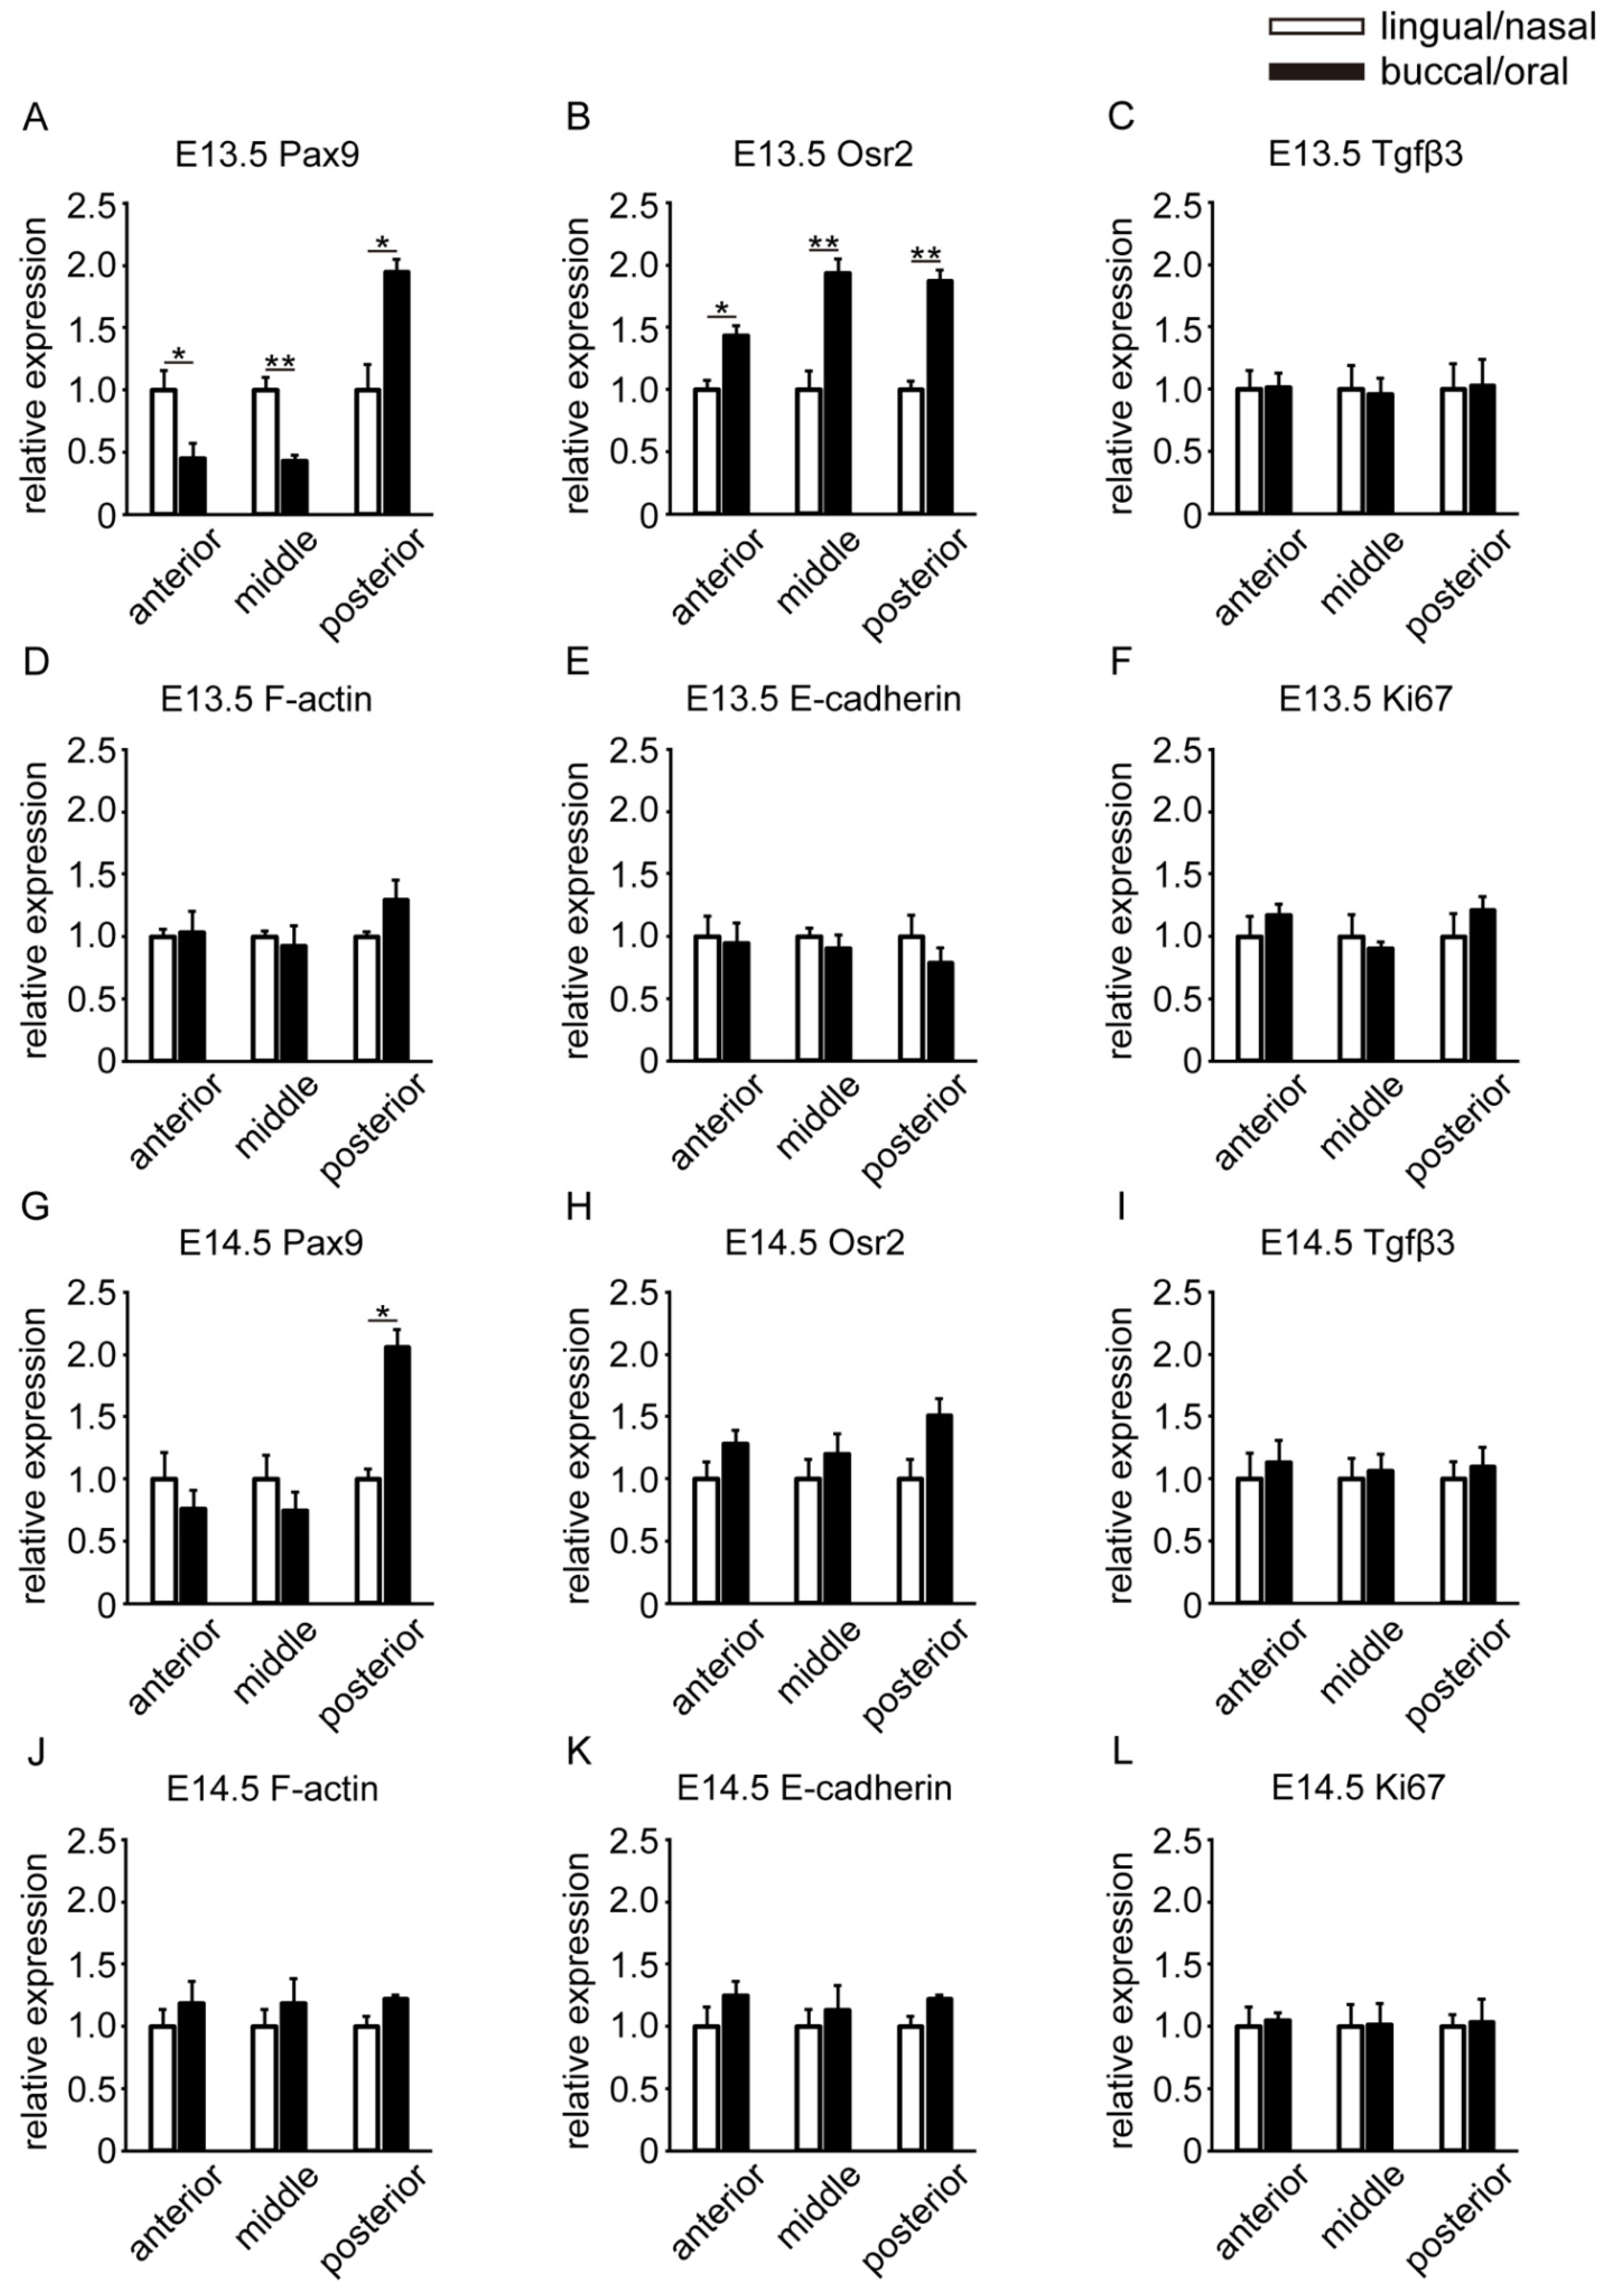
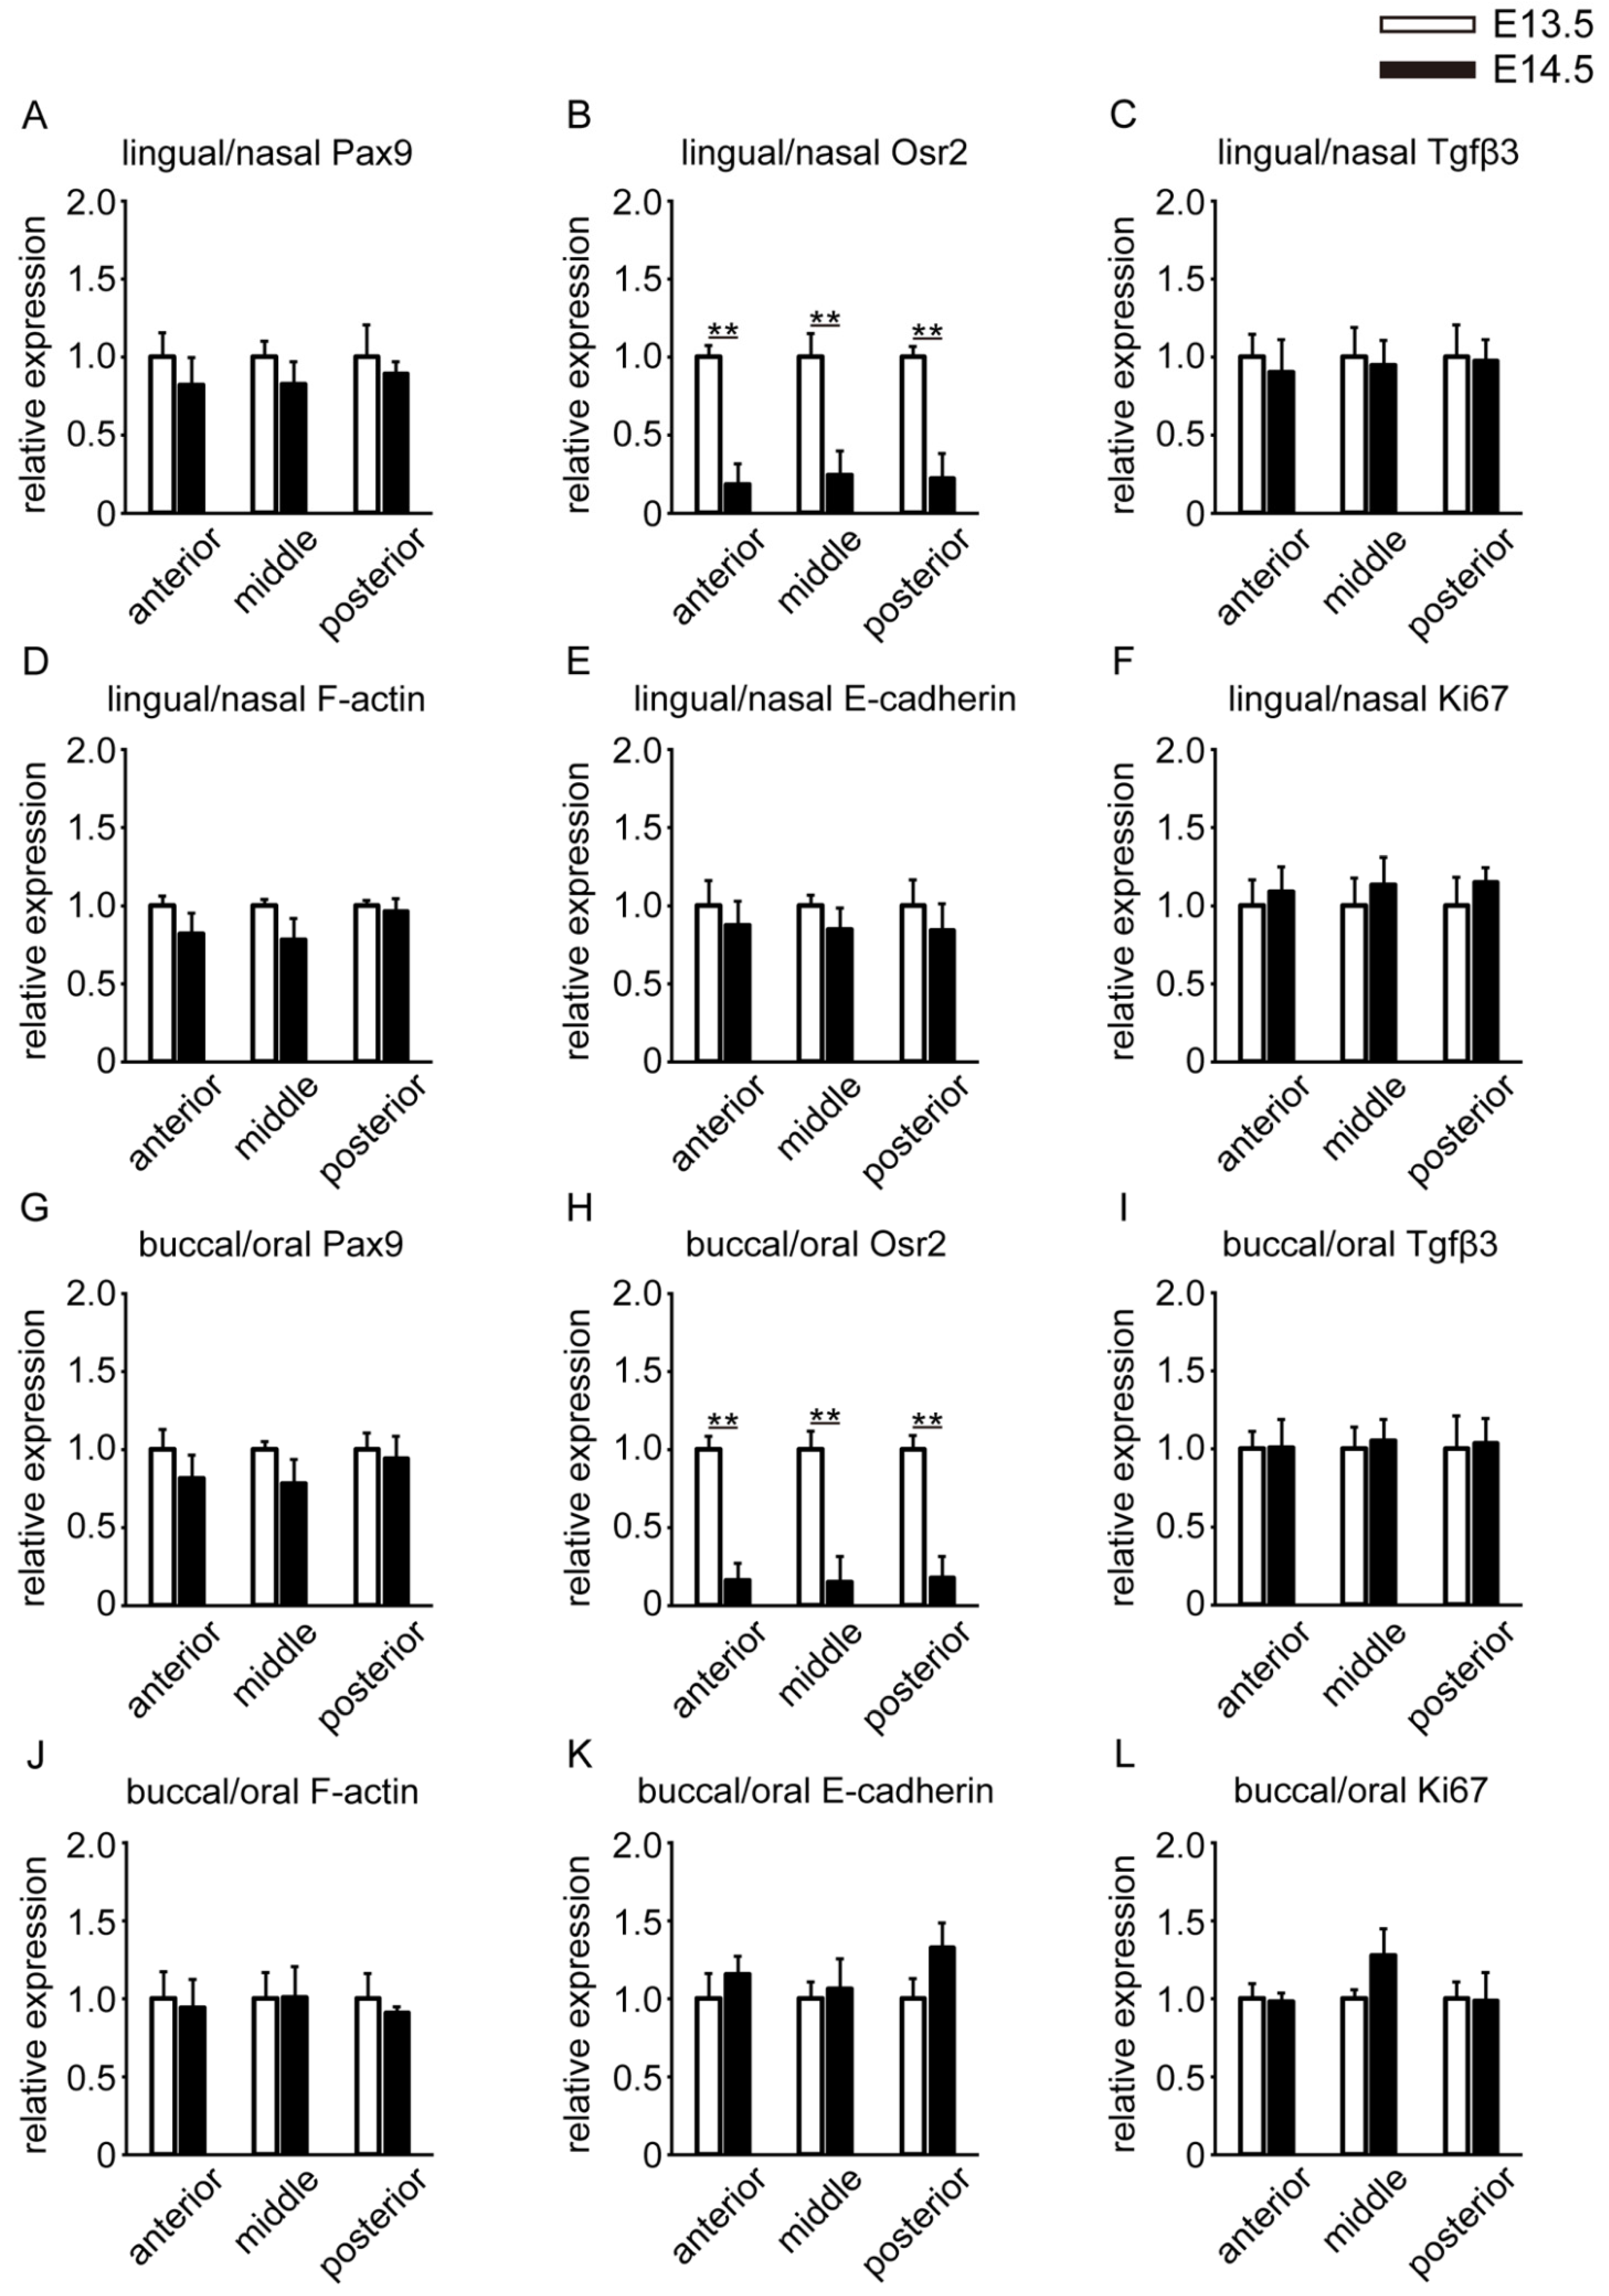
3.3. Spatial Differences in the Gene Expression Locations of Molecules
3.4. Temporal Differences in the Gene Expression Locations of Molecules
4. Discussion
Author Contributions
Funding
Institutional Review Board Statement
Informed Consent Statement
Data Availability Statement
Acknowledgments
Conflicts of Interest
References
- Murillo-Rincón, A.P.; Kaucka, M. insights into the complexity of craniofacial development from a cellular perspective. Front. Cell Dev. Biol. 2020, 8, 620735. [Google Scholar] [CrossRef] [PubMed]
- Kuriyama, S.; Theveneau, E.; Benedetto, A.; Parsons, M.; Tanaka, M.; Charras, G.; Kabla, A.; Mayor, R. In vivo collective cell migration requires an LPAR2-dependent increase in tissue fluidity. J. Cell Biol. 2014, 206, 113–127. [Google Scholar] [CrossRef] [PubMed] [Green Version]
- Kaucka, M.; Ivashkin, E.; Gyllborg, D.; Zikmund, T.; Tesarova, M.; Kaiser, J.; Xie, M.; Petersen, J.; Pachnis, V.; Nicolis, S.K.; et al. Analysis of neural crest-derived clones reveals novel aspects of facial development. Sci. Adv. 2016, 2, e1600060. [Google Scholar] [CrossRef] [PubMed] [Green Version]
- Reid, B.S.; Yang, H.; Melvin, V.S.; Taketo, M.M.; Williams, T. Ectodermal Wnt/β-catenin signaling shapes the mouse face. Dev. Biol. 2011, 349, 261–269. [Google Scholar] [CrossRef] [PubMed] [Green Version]
- Abramyan, J. Hedgehog signaling and embryonic craniofacial disorders. J. Dev. Biol. 2019, 7, 9. [Google Scholar] [CrossRef] [Green Version]
- Peters, H.; Neubüser, A.; Kratochwil, K.; Balling, R. Pax9-deficient mice lack pharyngeal pouch derivatives and teeth and exhibit craniofacial and limb abnormalities. Genes Dev. 1998, 12, 2735–2747. [Google Scholar] [CrossRef] [PubMed] [Green Version]
- Bhol, C.S.; Patil, S.; Sahu, B.B.; Patra, S.K.; Bhutia, S.K. The clinical significance and correlative signaling pathways of paired box gene 9 in development and carcinogenesis. Biochim. Biophys. Acta Rev. Cancer 2021, 1876, 188561. [Google Scholar] [CrossRef]
- Dixon, M.J.; Marazita, M.L.; Beaty, T.H.; Murray, J.C. Cleft lip and palate: Understanding genetic and environmental influences. Nat. Rev. Genet. 2011, 12, 167–178. [Google Scholar] [CrossRef] [Green Version]
- Ferguson, M.W. Palate development. Development 1988, 103, 41–60. [Google Scholar] [CrossRef]
- Li, R.; Chen, Z.; Yu, Q.; Weng, M.; Chen, Z. The function and regulatory network of Pax9 gene in palate development. J. Dent. Res. 2019, 98, 277–287. [Google Scholar] [CrossRef]
- Yamada, T.; Sasaki, A.; Bando, Y.; Sakiyama, K.; Suda, N.; Kanegae, H.; Amano, O. Immunolocalization of heat shock protein 25 (Hsp25) in developing secondary palate pf mouse embryos. Pediatr. Oral Maxillofac. Surg. 2014, 24, 27–37. [Google Scholar]
- Li, C.; Lan, Y.; Jiang, R. Molecular and cellular mechanisms of palate development. J. Dent. Res. 2017, 96, 1184–1191. [Google Scholar] [CrossRef] [PubMed]
- Paiva, K.B.S.; Maas, C.S.; Santos, P.M.D.; Granjeiro, J.M.; Letra, A. Extracellular matrix composition and remodeling: Current perspectives on secondary palate formation, cleft lip/palate, and palatal reconstruction. Front. Cell Dev. Biol. 2019, 7, 340. [Google Scholar] [CrossRef] [PubMed] [Green Version]
- Proetzel, G.; Pawlowski, S.A.; Wiles, M.V.; Yin, M.; Boivin, G.P.; Howles, P.N.; Ding, J.; Fergson, M.W.; Doetschman, T. Transforming growth factor-beta 3 is required for secondary palate fusion. Nat. Genet. 1995, 11, 409–414. [Google Scholar]
- Lan, Y.; Ovitt, C.E.; Cho, E.S.; Maltby, K.M.; Wang, Q.; Jiang, R. Odd-skipped related 2 (Osr2) encodes a key intrinsic regulator of secondary palate growth and morphogenesis. Development 2004, 131, 3207–3216. [Google Scholar] [CrossRef] [Green Version]
- Jin, J.-Z.; Tan, M.; Warner, D.R.; Darling, D.S.; Higashi, Y.; Gridley, T.; Ding, J. Mesenchymal cell remodeling during mouse secondary palate reorientation. Dev. Dyn. 2010, 239, 2110–2117. [Google Scholar] [CrossRef] [Green Version]
- Yu, K.; Ornitz, D.M. Histomorphological study of palatal shelf elevation during murine secondary palate formation. Dev. Dyn. 2011, 240, 1737–1744. [Google Scholar] [CrossRef] [Green Version]
- Zhou, J.; Gao, Y.; Lan, Y.; Jia, S.; Jiang, R. Pax9 regulates a molecular network involving Bmp4, Fgf10, Shh signaling and the Osr2 transcription factor to control palate morphogenesis. Development 2013, 140, 4709–4718. [Google Scholar] [CrossRef] [Green Version]
- Sasaki, Y.; O’Kane, S.; Dixon, J.; Dixon, M.J.; Ferguson, M.W.J. Temporal and spatial expression of Pax9 and sonic hedgehog during development of normal mouse palates and cleft palates in TGF-beta3 null embryos. Arch. Oral Biol. 2007, 52, 260–267. [Google Scholar] [CrossRef]
- Fitzpatrick, D.R.; Denhez, F.; Kondaiah, P.; Akhurst, R.J. Differential expression of TGF beta isoforms in murine palatogenesis. Development 1990, 109, 585–595. [Google Scholar] [CrossRef]
- Stapleton, P.; Weith, A.; Urbánek, P.; Kozmik, Z.; Busslinger, M. Chromosomal localization of seven PAX genes and cloning of a novel family member, PAX-9. Nat. Genet. 1993, 3, 292–298. [Google Scholar] [CrossRef] [PubMed]
- Lan, Y.; Kingsley, P.D.; Cho, E.S.; Jiang, R. Osr2, a new mouse gene related to Drosophila odd-skipped, exhibits dynamic expression patterns during craniofacial, limb, and kidney development. Mech. Dev. 2001, 107, 175–179. [Google Scholar] [CrossRef]
- Gao, Y.; Lan, Y.; Ovitt, C.E.; Jiang, R. Functional equivalence of the zinc finger transcription factors Osr1 and Osr2 in mouse development. Dev. Biol. 2009, 328, 200–209. [Google Scholar] [CrossRef] [PubMed] [Green Version]
- Herpin, A.; Lelong, C.; Favrel, P. Transforming growth factor-beta-related proteins: An ancestral and widespread superfamily of cytokines in metazoans. Dev. Comp. Immunol. 2004, 28, 461–485. [Google Scholar] [CrossRef]
- Takeichi, M. The cadherins: Cell-cell adhesion molecules controlling animal morphogenesis. Development 1988, 102, 639–655. [Google Scholar] [CrossRef]
- Brock, L.J.; Economou, A.D.; Cobourne, M.T.; Green, J.B.A. Mapping cellular processes in the mesenchyme during palatal development in the absence of Tbx1 reveals complex proliferation changes and perturbed cell packing and polarity. J. Anat. 2016, 228, 464–473. [Google Scholar] [CrossRef] [Green Version]
- Ryynänen, J.; Kriebizsch, C.; Meyer, M.B.; Janssens, I.; Pike, J.W.; Verlinden, L.; Verstuyf, A. Class 3 semaphorins are transcriptionally regulated by 1,25(OH)2D3 in osteoblasts. J. Steroid. Biochem. Mol. Biol. 2017, 173, 185–193. [Google Scholar] [CrossRef]
- Fu, X.; Xu, J.; Chaturvedi, P.; Liu, H.; Jiang, R.; Lan, Y. Identification of Osr2 transcriptional target genes inn palate development. J. Dent. Res. 2017, 96, 1451–1458. [Google Scholar] [CrossRef]
- Hammond, N.L.; Dixon, J.; Dixon, M.J. Periderm: Life-cycle and function during orofacial and epidermal development. Semin. Cell Dev. Biol. 2019, 91, 75–83. [Google Scholar] [CrossRef] [Green Version]
- Iwata, J.; Suzuki, A.; Pelikan, R.C.; Ho, T.-V.; Sanchez-Lara, P.A.; Urata, M.; Dixon, M.J.; Chai, Y. Smad4-Irf6 genetic interaction and TGFβ-mediated IRF6 signaling cascade are crucial for palatal fusion in mice. Development 2013, 140, 1220–1230. [Google Scholar] [CrossRef] [Green Version]
- Biggs, L.C.; Naridze, R.L.; Demali, K.A.; Lusche, D.F.; Kuhl, S.; Soll, D.R.; Schutte, B.C.; Dunnwald, M. Interferon regulatory factor 6 regulates keratinocyte migration. J. Cell Sci. 2014, 127, 2840–2848. [Google Scholar] [CrossRef] [PubMed] [Green Version]
- Chiquet, M.; Blumer, S.; Angelini, M.; Mitsiadis, T.A.; Katsaros, C. Mesenchymal remodeling during palatal shelf elevation revealed by extracellular matrix and F-actin expression patterns. Front. Physiol. 2016, 7, 392. [Google Scholar] [CrossRef] [Green Version]
- Wang, X.; Li, C.; Zhu, Z.; Yuan, L.; Chan, W.Y.; Sha, O. Extracellular matrix remodeling during palate development. Organogenesis 2020, 16, 43–60. [Google Scholar] [CrossRef] [PubMed] [Green Version]
- Du, W.; Bhojwani, A.; Hu, J.K. FACEs of mechanical regulation in the morphogenesis of craniofacial structures. Int. J. Oral Sci. 2021, 13, 4. [Google Scholar] [CrossRef] [PubMed]
- Heisenberg, C.-P.; Bellaïche, Y. Forces in tissue morphogenesis and patterning. Cell 2013, 153, 948–962. [Google Scholar] [CrossRef] [PubMed] [Green Version]
- Kindberg, A.; Hu, J.K.; Bush, J.O. Forces to communicate: Integration of mechanical and biochemical signaling in morphogenesis. Curr. Opin. Cell Biol. 2020, 66, 59–68. [Google Scholar] [CrossRef] [PubMed]
- Le Duc, Q.; Shi, Q.; Blonk, I.; Sonnenberg, A.; Wang, N.; Leckband, D.; de Rooji, J. Vinculin potentiates E-cadherin mechanosensing and is recruited to actin-anchored sites within adherens junctions in a myosin Ⅱ-dependent manner. J. Cell Biol. 2010, 189, 1107–1115. [Google Scholar] [CrossRef] [Green Version]


Publisher’s Note: MDPI stays neutral with regard to jurisdictional claims in published maps and institutional affiliations. |
© 2022 by the authors. Licensee MDPI, Basel, Switzerland. This article is an open access article distributed under the terms and conditions of the Creative Commons Attribution (CC BY) license (https://creativecommons.org/licenses/by/4.0/).
Share and Cite
Nagasaka, A.; Sakiyama, K.; Bando, Y.; Yamamoto, M.; Abe, S.; Amano, O. Spatiotemporal Gene Expression Regions along the Anterior–Posterior Axis in Mouse Embryos before and after Palatal Elevation. Int. J. Mol. Sci. 2022, 23, 5160. https://doi.org/10.3390/ijms23095160
Nagasaka A, Sakiyama K, Bando Y, Yamamoto M, Abe S, Amano O. Spatiotemporal Gene Expression Regions along the Anterior–Posterior Axis in Mouse Embryos before and after Palatal Elevation. International Journal of Molecular Sciences. 2022; 23(9):5160. https://doi.org/10.3390/ijms23095160
Chicago/Turabian StyleNagasaka, Arata, Koji Sakiyama, Yasuhiko Bando, Masahito Yamamoto, Shinichi Abe, and Osamu Amano. 2022. "Spatiotemporal Gene Expression Regions along the Anterior–Posterior Axis in Mouse Embryos before and after Palatal Elevation" International Journal of Molecular Sciences 23, no. 9: 5160. https://doi.org/10.3390/ijms23095160