Article

Identification of Zinc Efficiency-Associated Loci (ZEALs) and Candidate Genes for Zn Deficiency Tolerance of Two Recombination Inbred Line Populations in Maize

1
Key Laboratory of Plant-Soil Interaction (MOE), Centre for Resources, Environment and Food Security, College of Resources and Environmental Sciences, China Agricultural University, Beijing 100193, China
2
State Key Laboratory for Agrobiotechnology, Key Laboratory of Crop Heterosis and Utilization (MOE), Key Laboratory of Crop Genetic Improvement, China Agricultural University, Beijing 100193, China
3
Key Laboratory of Maize DNA Fingerprinting and Molecular Breeding, Maize Research Center, Beijing Academy of Agriculture & Forestry Science (BAAFS), Beijing 100097, China
*
Author to whom correspondence should be addressed.
Int. J. Mol. Sci. 2022, 23(9), 4852; https://doi.org/10.3390/ijms23094852
Submission received: 30 December 2021 / Revised: 2 April 2022 / Accepted: 18 April 2022 / Published: 27 April 2022
(This article belongs to the Topic Plant Functional Genomics and Crop Genetic Improvement)

Abstract

:
Zinc (Zn) deficiency is one of the most common micronutrient disorders in cereal plants, greatly impairing crop productivity and nutritional quality. Identifying the genes associated with Zn deficiency tolerance is the basis for understanding the genetic mechanism conferring tolerance. In this study, the K22×BY815 and DAN340×K22 recombination inbred line (RIL) populations, which were derived from Zn-inefficient and Zn-efficient inbred lines, were utilized to detect the quantitative trait loci (QTLs) associated with Zn deficiency tolerance and to further identify candidate genes within these loci. The BLUP (Best Linear Unbiased Prediction) values under Zn-deficient condition (-Zn) and the ratios of the BLUP values under Zn deficient condition to the BLUP values under Zn-sufficient condition (-Zn/CK) were used to perform linkage mapping. In QTL analysis, 21 QTLs and 33 QTLs controlling the Zn score, plant height, shoot and root dry weight, and root-to-shoot ratio were detected in the K22×BY815 population and the DAN340×K22 population, explaining 5.5–16.6% and 4.2–23.3% of phenotypic variation, respectively. In addition, seventeen candidate genes associated with the mechanisms underlying Zn deficiency tolerance were identified in QTL colocalizations or the single loci, including the genes involved in the uptake, transport, and redistribution of Zn (ZmIRT1, ZmHMAs, ZmNRAMP6, ZmVIT, ZmNAS3, ZmDMAS1, ZmTOM3), and the genes participating in the auxin and ethylene signal pathways (ZmAFBs, ZmIAA17, ZmETR, ZmEIN2, ZmEIN3, ZmCTR3, ZmEBF1). Our findings will broaden the understanding of the genetic structure of the tolerance to Zn deficiency in maize.

1. Introduction

Zinc (Zn) deficiency is a common micronutrient disorder in cereal plants, reducing crop productivity and nutritional quality. Zn has been reported to be deficient in 30% of the agricultural soils worldwide [1], and 50% of cereal crops are cultivated on soils with low plant-available Zn [2]. Compared with the demand of plants, the concentration of free Zn ions in the rhizosphere is usually very small, and it is quickly depleted without the proliferation from other pools, leading to the expression of Zn deficiency in crop plants [3,4]. The low level of Zn in the soil restricts the growth of crops and impairs the quantity and quality of crops. Maize is grown on around 160 million hectares worldwide [5], which provides about 30% of the food calories to more than 4.5 billion people in 94 developing countries [6]. As the second largest maize consumer and producer in the world, China was responsible for 22% of global maize output from 2012 to 2014 [7]. Although, in the intensive production systems of China, the maize yields (10t ha−1) are higher than the world average. However, as a limiting factor, Zn deficiency in soil causes farmers to achieve only 48–56% of the yield potential [8,9]. Maize is sensitive to Zn deficiency, and Zn-deficient symptoms are often observed in plants growing on the calcareous soil in the field. Zn deficiency reduces pollen viability and leads to pollen sterility in maize, and then to low kernel numbers [10]. Moreover, the insufficient assimilation caused by Zn deficiency has led to a shorter duration of linear grain-filling in later-growing kernels [11]. Because of the close relation of Zn flow among the soil–crop–human continuum, the purpose of some studies is to develop new cultivars with a strong genetic capacity to tolerate Zn deficiency. In this study, we identified important genes by exploiting the genetic variation of maize to provide the theoretical basis for developing new cultivars.
Quantitative trait locus (QTL) analysis provides an effective means of dissecting the genetic basis of complex traits in plants [12], and the basis for devising plant breeding strategies [13,14], greatly facilitating crop improvement. Zn deficiency is one of the most widespread limiting factors to crop production; however, only little effort in molecular works has been made so far to improve Zn efficiency in crop plants. The genetic basis for Zn deficiency tolerance in crop plants is poorly understood, since a majority of research has only focused on the QTLs associated with the Zn concentration and accumulation in grains [15,16,17]. Only very few studies have reported the performance under Zn-deficient condition, merely limited to rice [18,19], wheat [20], and navy bean [21]. The first study reported QTL associated with the performance under Zn deficiency in crop plants is conducted in rice [18]. This study identified QTLs associated with the most severe and susceptible Zn deficiency symptoms of rice in the field, including leaf bronzing and plant mortality, and biomass reduction in Zn-deficient condition. The two most influential QTLs controlling plant mortality were detected on chromosome 2 and explained 16.6% and 24.2% of the variation [18]. In wheat, Genc et al. [20] (2009) found that most of the QTLs linked to wheat seedling growth under Zn deficiency were associated with height genes. Combining bi-parental QTL mapping and genome-wide association analysis, Lee et al. [19] (2017) identified one putative candidate gene within the chromosome 6 QTL, which was associated with grain yield and component traits in both analyses. As for maize, almost all research has paid attention to the molecular basis of biofortification for mineral elements, especially iron and zinc [22,23,24]. However, there are very few reports on mapping Zn efficiency-associated loci (ZEALs) in maize [25], which strongly hampers the development of untangling the internal mechanisms underlying the tolerance to Zn deficiency in maize.
Plants have established the sophisticated mechanisms in resistance to Zn deficiency, including uptake from the environment as well as influx and efflux of Zn ions across adjacent cells, which require specific transmembrane transporters. Among these transporters, the zinc-regulated/iron-regulated transporter-like proteins (ZIPs) and heavy metal ATPases (HMAs) family play essential roles in the mechanisms on Zn deficiency tolerance in plants. Most studies concentrate on the ZIP and HMA gene families in Arabidopsis [26,27,28], rice [29,30,31,32], and barley [33,34]. However, there were only a few studies characterizing ZIPs and HMAs in maize [35,36,37,38].
In order to dissect the genetic basis in Zn deficiency tolerance in maize, in this study, the K22×BY815 and DAN340×K22 RIL populations were grown hydroponically under Zn-deficient and Zn-sufficient conditions. Utilizing QTL colocalizations mapped in different populations, important loci and the candidate genes associated with the tolerance to Zn deficiency in maize were explored.

2. Results

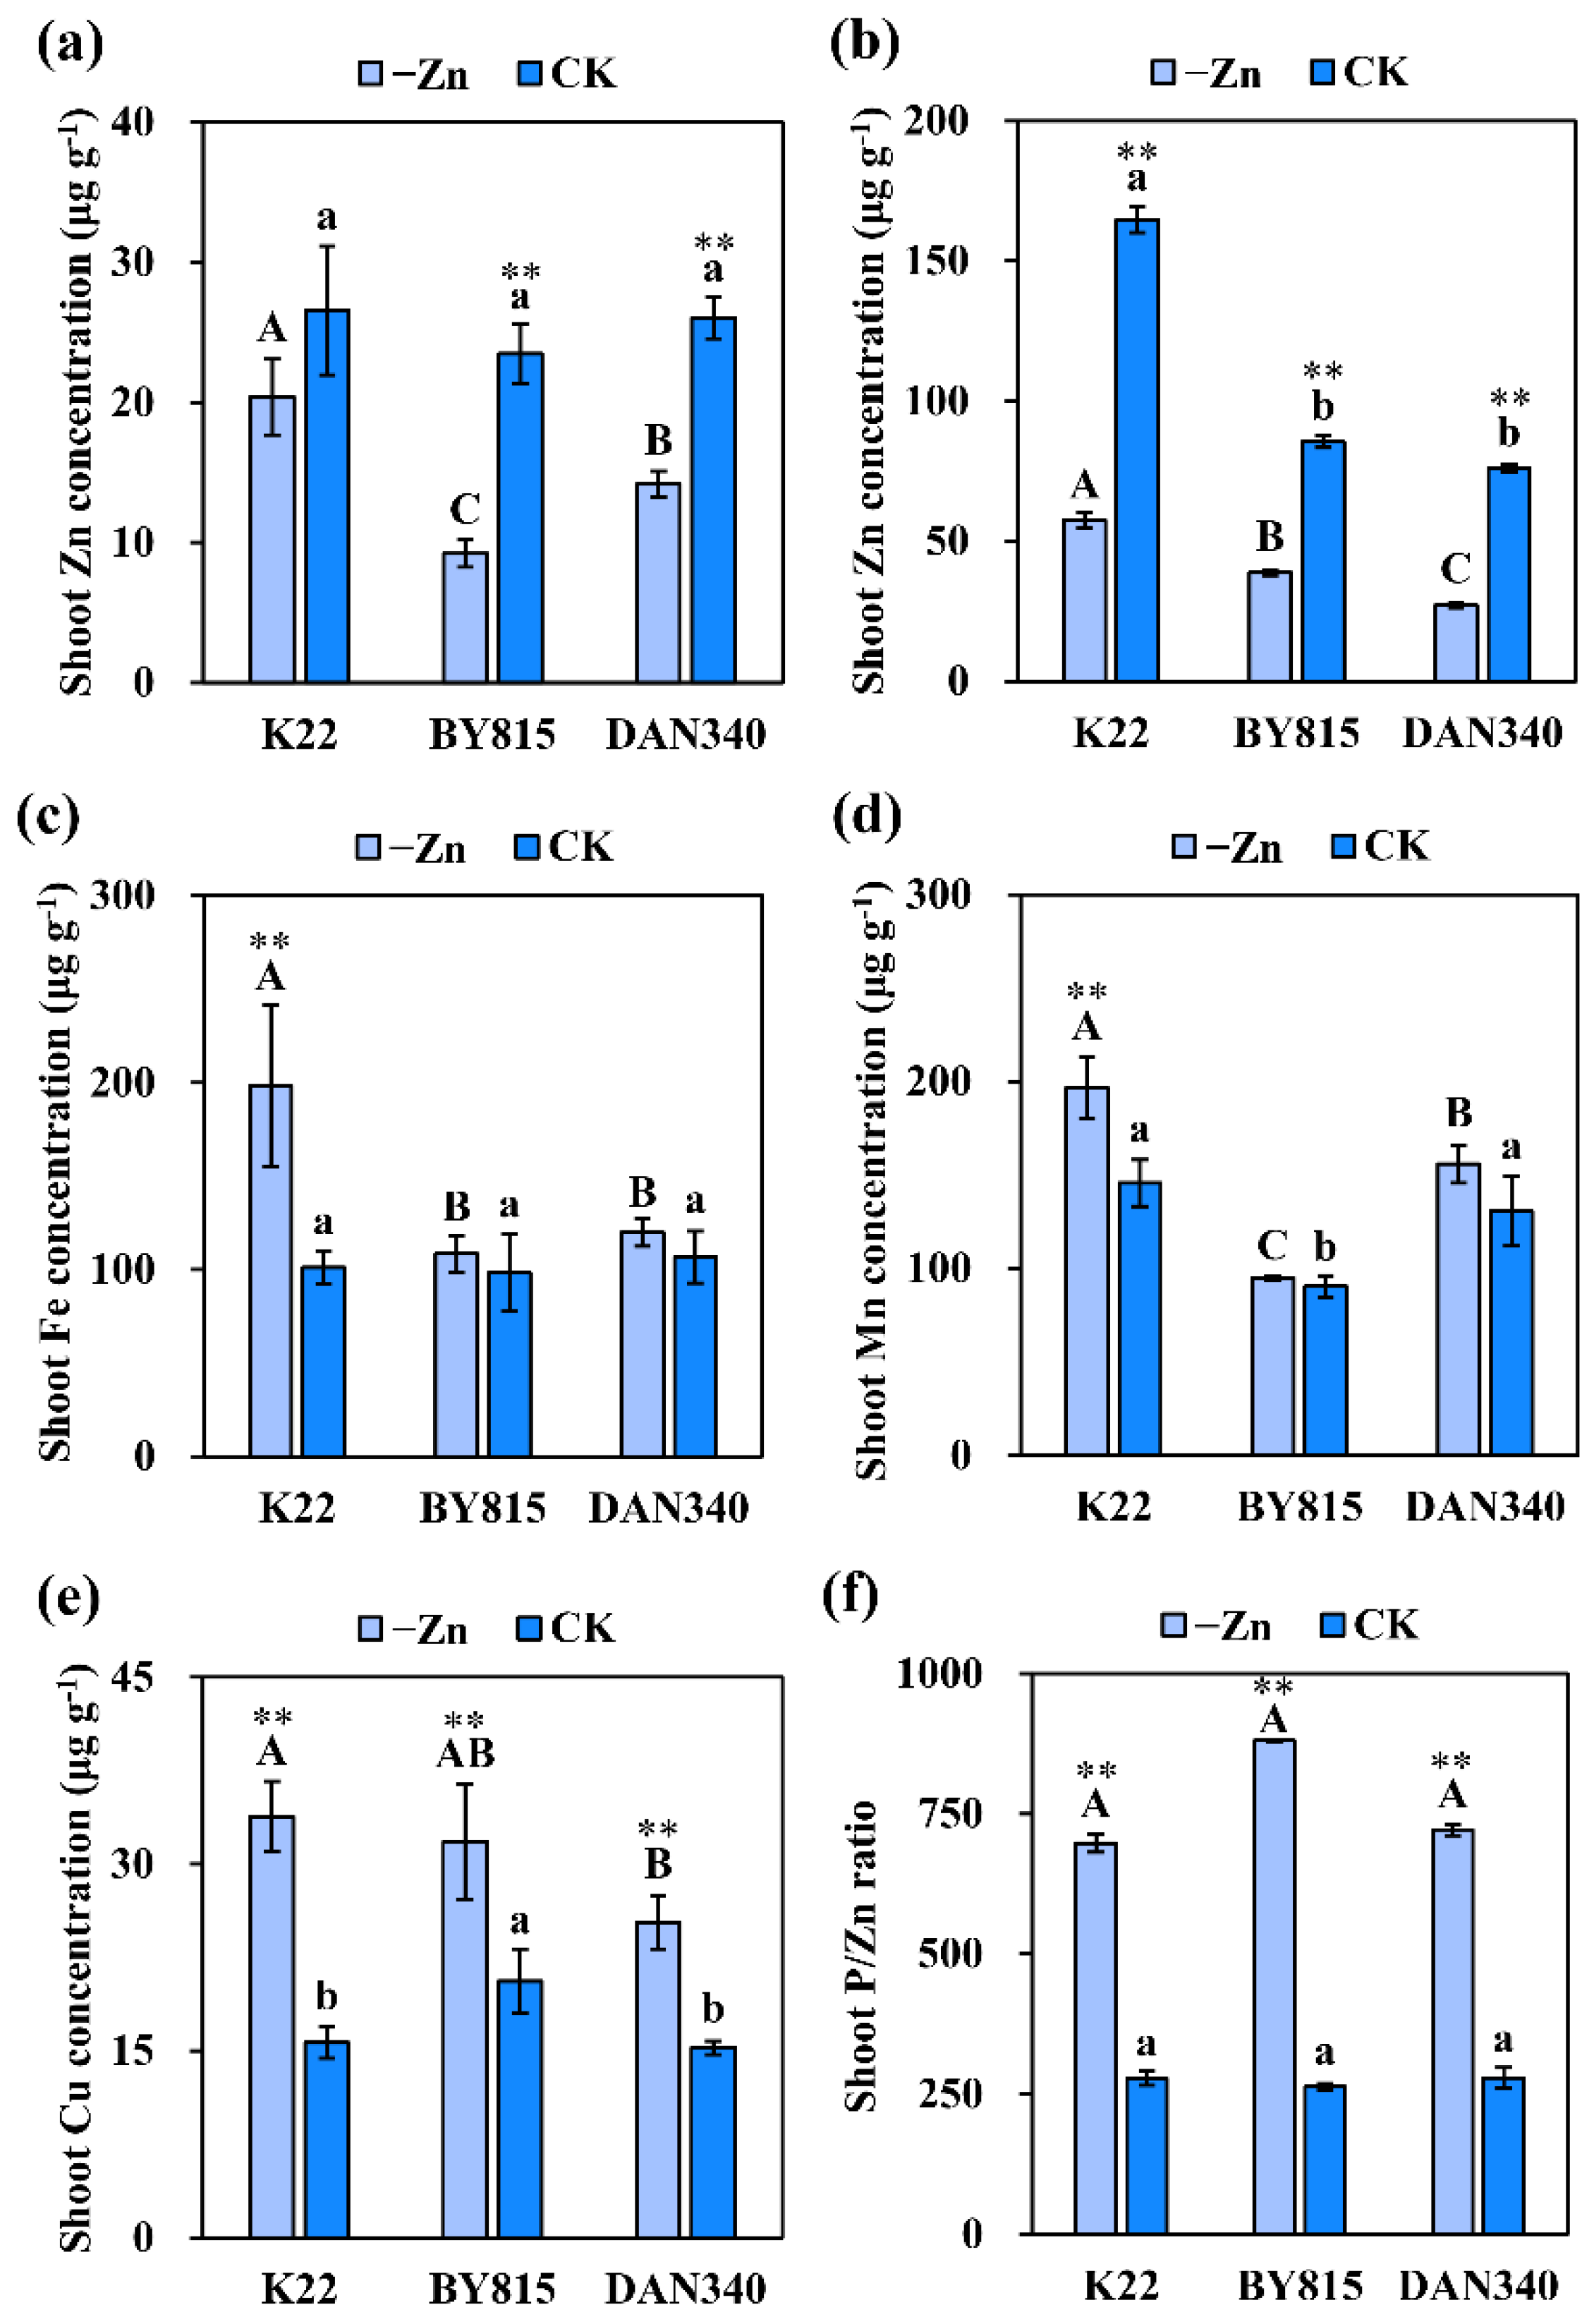
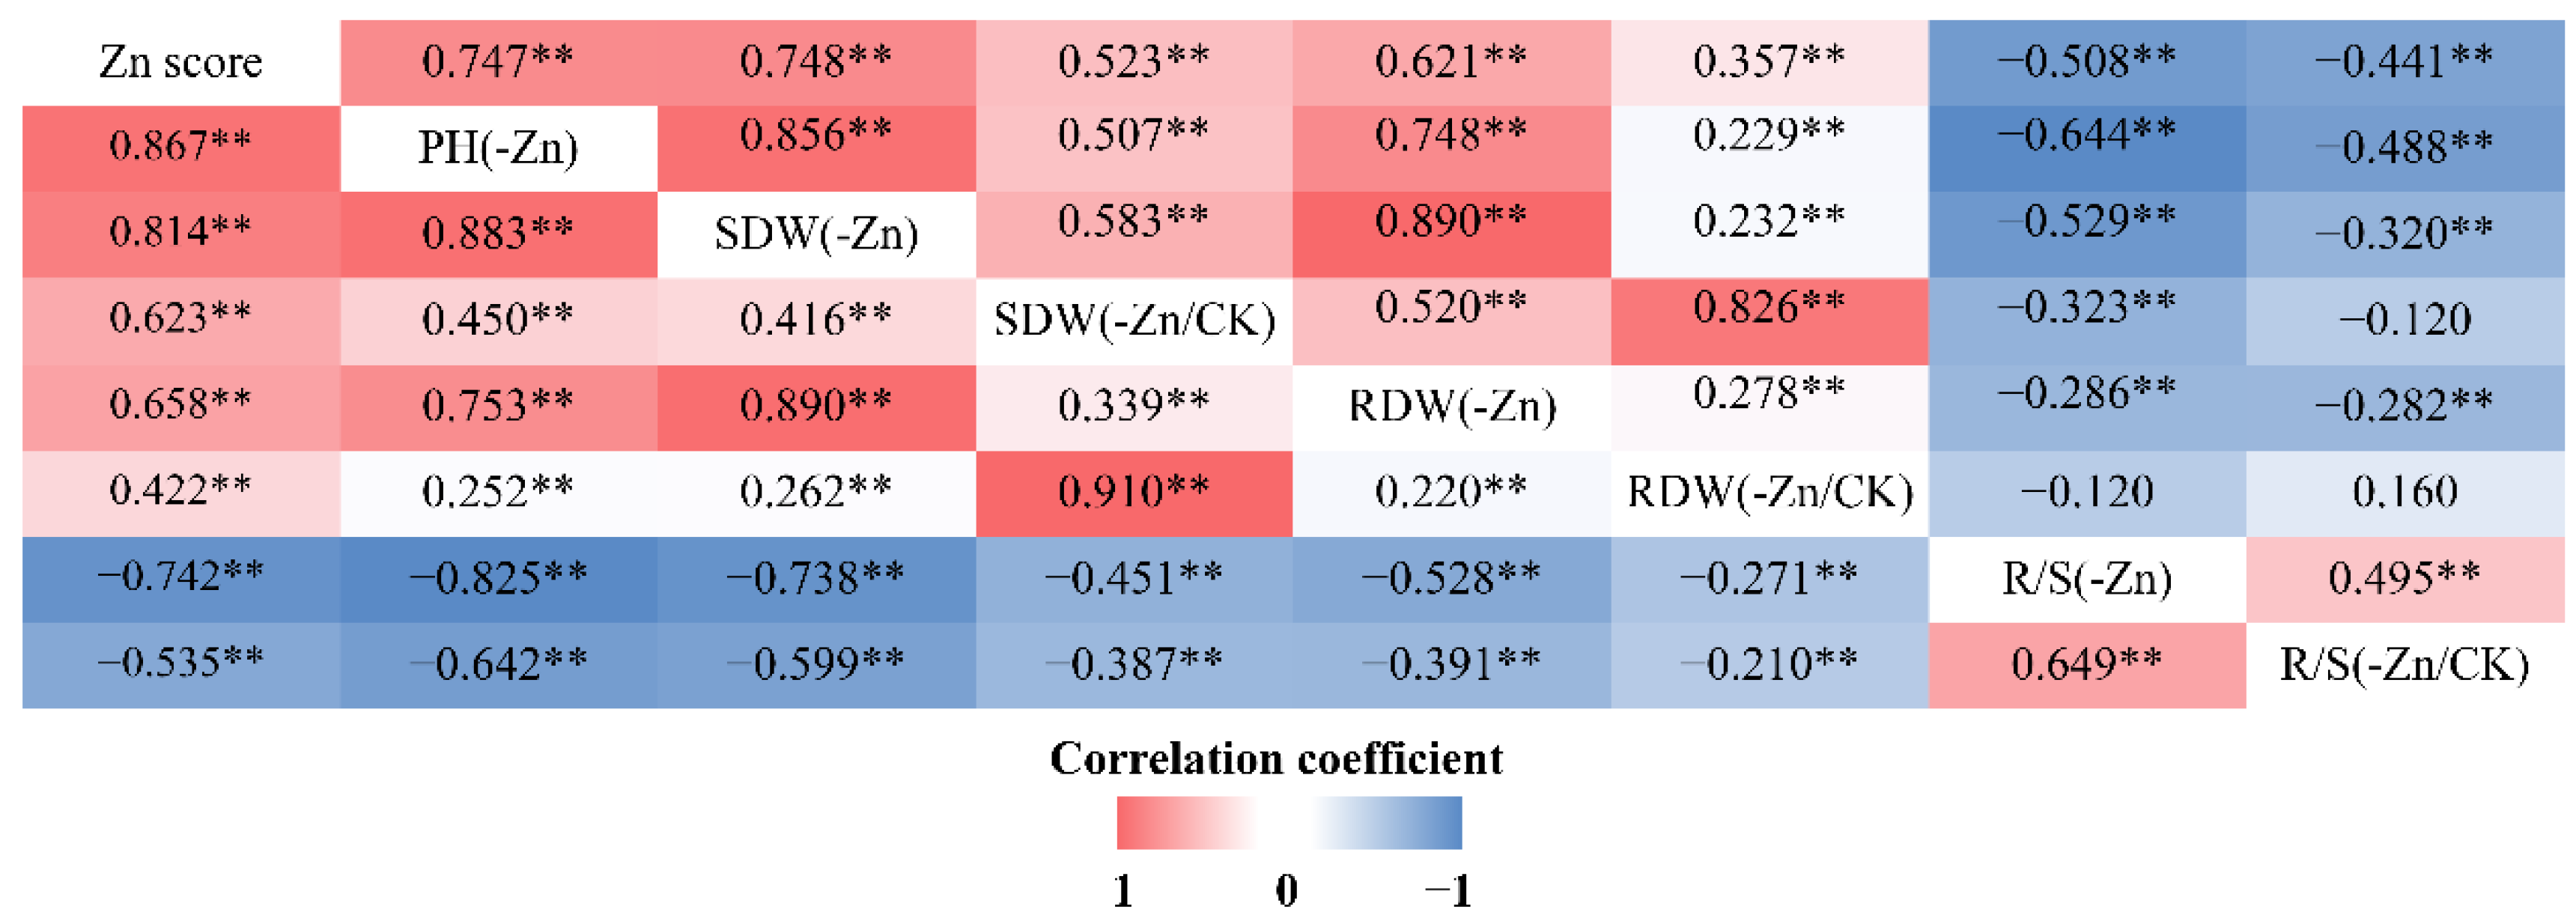
2.1. Phenotypic Variation in Zn Deficiency Tolerance

Under Zn-deficient condition, parents BY815 and DAN340 exhibited no visual Zn-deficient symptoms (Figure 1). K22 showed severe symptoms of Zn deficiency, including stunted growth, yellowish-white necrotic lesions on leaves, the necrosis of the leaf margins, and smaller leaves. By contrast, BY815 and DAN340 displayed no phenotypic differences between Zn-deficient and Zn-sufficient conditions. Regardless of treatments, all the traits associated with the tolerance to Zn deficiency showed significant differences between maternal and paternal parents (Table 1 and Table 2). BY815 had high Zn efficiencies (ZEs) based on the shoot (116%) and root (111%) dry weights, which were 6.0-fold and 4.8-fold higher than those of K22, respectively. Under Zn-deficient condition, the shoot and root dry weights of BY815 were more than five times higher than K22 (Table 1). Zn efficiencies based on the shoot and root dry weights of DAN340 were 4.1-fold and 3.8-fold higher than those of K22 (Table 2), respectively. The root-to-shoot ratios (R/S) for the parents increased in response to Zn deficiency, especially for K22.
Since shoot Zn concentrations of K22, BY815, and DAN340 under Zn deficiency were no more than 20 μg g−1, plants in the -Zn treatment were diagnosed to be Zn deficient. Deficiency in Zn substantially decreased Zn concentrations in the shoots and roots of BY815 and DAN340 by 60.8% and 54.7%, 45.5% and 64.4%, respectively (Figure 2a,b). However, Zn deficiency had no significant effects on the shoot Zn concentration of K22 (Figure 2a). In addition, Zn concentration of the sensitive inbred line K22 was 2.2-fold and 1.4-fold higher than those of tolerant inbred lines BY815 and DAN340, respectively, indicating that Zn-efficient genotypes may not necessarily have higher shoot Zn concentrations when compared with Zn-inefficient genotypes. Furthermore, our previous results confirmed that Zn efficiencies based on shoot and root dry weights were not correlated with Zn concentrations in the shoot and root of twenty maize inbred lines which contained K22, BY815, and DAN340 [25]. Zn deficiency significantly enhanced shoot concentrations of iron (Fe) and manganese (Mn) for K22 by 96.2% and 34.9%, respectively, whereas it had no effects on Fe and Mn concentrations of BY815 and DAN340 (Figure 2c,d). By contrast, shoot copper (Cu) concentration and P/Zn ratio for each parent were markedly increased by Zn deficiency (Figure 2e,f).
Large variations of Zn-deficient symptoms were observed among RILs (Figure 3a). For each trait, the mean in each line was calculated by at least three replications from the uniform seedlings. The mean values for each trait of the K22×BY815 and DAN340×K22 RIL populations were between maternal and paternal parents (Table 1 and Table 2; Figures S1 and S2). All traits associated with Zn deficiency tolerance exhibited abundant diversity among lines. The Coefficient of Variation (CV) for each trait among all RILs was calculated using the ratio of the mean to the standard error, ranging from 19.6% to 55.4%. All traits displayed normal distributions except for Zn score (Figures S1 and S2). The broad-sense heritability for each trait varied from 64.7–86.8%, suggesting that a great proportion of phenotypic variation in each trait was genetically controlled (Table 1 and Table 2).
Zn score, which was to assess the ability to tolerate Zn deficiency and was ranked from 0 to 5 (Figure 2b–g, Figure 4a and Figure 5a), had the highest broad-sense heritability (Table 1 and Table 2). As shown in Figure 4 and Figure 5, the 75th percentiles of shoot and root dry weights in the -Zn/CK treatment in these two RIL populations were no more than 1, indicating that shoot and root biomass accumulation in most of the RILs were reduced in response to Zn deficiency. However, the 90th percentiles of R/S ratio in the -Zn/CK treatment were higher than 1 (Figure 4e,h and Figure 5e,h), suggesting that the root-to-shoot ratios of the RILs responded positively to low Zn stress. In these two RIL populations, the Zn score was significantly correlated with plant height, shoot and root dry weights, and R/S ratio using Spearman correlation analysis (p < 0.01). Furthermore, significant correlation was found among any other two traits using Pearson correlation analysis (p < 0.01) (Figure 6).

2.2. QTL Detection

In the K22×BY815 RIL population, based on the empirical threshold of the LOD score for each trait, a total of 21 QTLs were identified in the -Zn and -Zn/CK treatments (Figure 7, Table S1). Five QTLs (qKB-ZnSc1-1, qKB-ZnSc2-1, qKB-ZnSc6-1, qKB-ZnSc9-1, and qKB-ZnSc9-2) controlling Zn score were identified on chromosome 1, 2, 6, and 9, together explained 39.5% of phenotypic variation. Alleles from BY815 at four QTLs except for qKB-ZnSc1-1 had an additive effect of 0.31–0.42 for increased Zn score. Five QTLs for plant height were mapped on chromosome 1, 2, 6, and 9, explaining 5.5–12.0% of phenotypic variation. The allele associated with increased plant height at the four QTLs, except for qKB-PH1-1 on chromosome 1, came from BY815. The second largest-effect QTL, qKB-PH2-2, that accounted for 12.0% of phenotypic variation, was located between PZE-102017472 and SYN18069. Four loci (qKB-SDW2-1, qKB-SDW2-2, qKB-SDW9-1, and qKB-SDW3-1) controlling shoot dry weight were identified on chromosome 2, 3, and 9. At the three QTLs (qKB-SDW2-1, qKB-SDW2-2, and qKB-SDW9-1) on chromosome 2 and 9, the allele from BY815 increased the shoot dry weight by 0.09–0.13 g. Four QTLs associated with the root dry weight were detected on chromosome 1 and 9, explaining 5.9–11.2% of phenotypic variation. The allele from K22 at two loci (qKB-RDW1-1, qKB-RDW1-2) on chromosome 1 had additive effects for the increased root dry weight. In addition, the allele that increased the ZE based on root dry weight at two loci (qKB-RDW9-1, qKB-RDW9-2) on chromosome 9 came from BY815. The third largest-effect QTL was mapped between PZE-109023988 and PZE-109025227 on chromosome 9, explaining 11.2% of phenotypic variation. Three QTLs (qKB-R/S5-1, qKB-R/S7-1, and qKB-R/S7-2) controlling the R/S ratio under Zn deficiency were identified on chromosome 5 and 7, explaining 6.4% of phenotypic variation. Major QTL qKB-R/S7-2, located in the genetic interval of 136.9–138.9 cM on chromosome 7, explained 16.6% of phenotypic variation in the K22×BY815 RIL population.
In the DAN340×K22 RIL population, the BLUPs in the -Zn and -Zn/CK treatments were used to perform the QTL mapping, and 33 QTLs were detected based on the empirical threshold of the LOD score for each trait (Figure 7, Table S2). Six QTLs (qDK-ZnSc1-1, qDK-ZnSc1-2, qDK-ZnSc1-3, qDK-ZnSc2-1, qDK-ZnSc2-2, and qDK-ZnSc2-3) for the Zn score were identified on chromosome 1 and 2, elucidating 4.5–23.3% of phenotypic variation. Among them, qDK-ZnSc2-2, a QTL was located to the interval flanked by PZE-102080558 and PZE-102113254 (66.9–152.5 Mb) on chromosome 2 and accounted for 23.3% of the phenotypic variation observed for Zn score. The QTL qDK-ZnSc2-3, located in the interval of 157.7–173.2 Mb on chromosome 2, explained 21.2% of phenotypic variation. The allele from DAN340 at two QTLs had additive effects of 0.66–0.69 for enhanced Zn score. Six QTLs (qDK-PH1-1, qDK-PH1-2, qDK-PH2-1, qDK-PH2-2, qDK-PH5-1, and qDK-PH10-1) controlling plant height were detected on chromosome 1, 2, 5, and 10, explaining 4.2–15.5% of phenotypic variation. Eight QTLs that were associated with the shoot dry weight were mapped on chromosome 1, 2, 3, and 10, explaining 4.8–23.2% of phenotypic variation. Among them, the second largest-effect loci, qDK-SDW2-1, was identified between PZE-102084401 and PZE-102113254 on chromosome 2, explaining 23.2% of phenotypic variation. The allele which increased the shoot dry weight under Zn deficiency by 0.16 g at this locus, was provided by DAN340. The remaining seven loci had relatively minor effects, with LOD scores ranging from 3.4 to 6.5. For the root dry weight, six QTLs were detected on chromosome 1, 2, 5, and 6, accounting for 8.9–14.2% of phenotypic variation. Seven QTLs controlling the R/S ratio were detected on chromosome 1 and 2 and accounted for 6.6–21.2% of phenotypic variation. Among these seven loci, qDK-R/S2-1 and qDK-R/S2-2, which had large effects with PVEs of 20.5% and 21.2%, respectively, were detected in the intervals of 74.4–151.0 Mb and 156.9–173.3 Mb, respectively. Another five QTLs controlling R/S ratio contributed to 6.6–11.7% of phenotypic variation.
In summary, the number of QTLs per trait varied from three to eight in these two RIL populations. Support intervals determined by the 1-LOD method in the KB and DK population averaged 5.1 cM (10.4 Mb) and 4.7 cM (17.4 Mb), with a range from 2.0 to 13.6 cM (0.4–67.9 Mb) and a range from 0.8 to 12.3 cM (1.1–85.6 Mb), respectively. The explained phenotypic variation (PVE) of each QTL in the KB and DK populations varied from 5.5% (qKB-PH6-1) to 16.6% (qKB-R/S7-2) and from 4.2% (qDK-PH5-1) to 23.3% (qDK-ZnSc2-2), respectively (Tables S1 and S2). In these two RIL populations, 14.8% of 54 single loci had a PVE ≥ 15%, suggesting that quite a few QTLs with higher PVEs and a number of QTLs with lower PVEs mainly contribute to the genetic component of the traits associated with Zn deficiency tolerance. This also reflects the complex basis of the tolerance to Zn-deficiency stress in maize. Additionally, 71.4% (15/21) of the identified QTLs in the KB population had additive effects for increasing the values of the detected traits, and this value in the DK population was 60.6% (20/33). These results implied that parent lines BY815 and DAN340 have occupied abundant favorable alleles, which may be available for the improvement of Zn deficiency tolerance during maize breeding.

2.3. QTL Colocalization and Candidate Genes Identification

Genomic regions overlapped by the QTLs controlling the same traits and colocalizations of the QTLs detected by different the RIL populations are important for the identification of candidate genes. Evidence for identifying candidate genes by the QTLs colocalized by the loci detected in different populations have been recorded by multiple studies in maize [14,39,40]. Apart from the QTLs detected in the KB and DK populations in this study, we also used the QTLs identified in the Ye478×Wu312 (YW) RIL population to further determine the QTL colocalization among different populations [25]. Five QTL colocalization intervals were identified in eleven QTLs detected by different traits in the KB, DK, and YW RIL populations: two localizations on chromosome 1 and three localizations on chromosome 2 (Figure 7, Table 3).
Based on the annotated genes in the B73 reference genome Version 5, a total of 253 candidate genes was identified within these QTL colocalizations. According to the functional descriptions of 253 candidate genes in Arabidopsis and rice on the MaizeGDB Database (Available online: http://www.maizeGDB.org (accessed on 15 January 2022)) and the Gramene Database (Available online: https://www.gramene.org (accessed on 15 January 2022)) (Table S3), ZmIRT1 (Zm00001eb052440) and ZmNRAMP (Zm00001eb051790), which were considered to be associated with Zn deficiency tolerance, were identified within the overlapped interval of qKB-PH1-1 and qDK-PH1-1, which both controlled plant height under Zn deficiency. In addition, another seven genes which may be associated with the responses to Zn deficiency, containing ZmTOM3 (Zm00001eb093430), ZmHMA3 (Zm00001eb095020), ZmHMA4 (Zm00001eb095010), ZmCTR3 (Zm00001eb096080), ZmVIT (Zm00001eb248740), ZmIAA17 (Zm00001eb258220), and ZmHMA9 (Zm00001eb389830), were identified within other overlapped regions colocalized by the QTLs controlling different traits (Table 4). Beyond that, according to previous studies on Zn deficiency in plants, eight genes associated with Zn uptake and translocation, stress sensing and signaling were identified within the intervals of five single loci, containing ZmDMAS1 (Zm00001eb010040), ZmNAS3 (Zm00001eb052890), ZmETR (Zm00001eb054170), ZmEIN2 (Zm00001eb054060), ZmEIN3 (Zm00001eb331080), ZmEBF1 (Zm00001eb011850), and ZmAFBs (Zm00001eb085030, Zm00001eb421340) (Table 4).

3. Discussion

3.1. Physiological Mechanisms Underlying ZE

Zn efficiency, which is considered to characterize the tolerance to Zn deficiency, can be defined as the ability of a genotype to grow and yield well under Zn-deficient condition for a standard cultivar. A linear relationship between the reduction in shoot dry matter and the severity of leaf symptoms of Zn deficiency are observed in a range of cereals [41], and some reports further confirmed that the visual symptoms of Zn deficiency are significantly correlated with Zn efficiency [42,43]. Consistent with previous results mentioned above, Zn scores evaluating the symptoms of Zn deficiency in the linkage population for the present study were significantly correlated with R/S ratios, as well as the absolute and relative values of the dry matter weights of the shoots and roots (p < 0.01) (Figure 6). Therefore, the visual scoring system has provided a rapid selection criterion to estimate Zn efficiency at the seedling stage.
Our results showed that the root-to-shoot ratios of most RILs were increased in response to low Zn stress, further confirming that the increase in R/S ratio occurs as an initial response to Zn deficiency in crops [44,45]. Zn-efficient and Zn-inefficient inbred lines displayed differential responses to Zn deficiency in shoot and root growth. Root growth can be increased in some cereals as a consequence of Zn deficiency [46]. For a Zn-efficient inbred line like BY815, which had the highest ZEs based on the shoot and root dry weights (116% and 111%), the root dry matter increased more than the shoot and may be attributed to the change in the partitioning of the dry matter, enabling higher nutrient uptake [47]. A Zn-efficient inbred line like DAN340, with higher ZEs (below 100%), reduced the shoot growth at the expense of the root growth, so as to decrease the metabolic demands of the shoots and the greater relative root surface area for ion absorption [46,48]. Furthermore, there was significant correlation among the R/S ratio, the shoot and root dry weights (Figure 6). Therefore, the absolute and relative shoot and root biomass accumulation can be suitable indicators to characterize Zn efficiency in the linkage populations in maize.
In our work, Zn-efficient genotypes did not have higher Zn concentrations in the shoot or root at a low level of Zn supply. A number of studies have indicated that plant tissue Zn concentration is not a dependable parameter for evaluating differential Zn efficiency among genotypes [49,50]. Zn concentrations in tissues do not reflect how much is physiologically available for metabolic processes, or how much is inactivated or compartmented in nonmetabolic pools [51]. Zn efficiency in crop plants does not differ in shoot concentrations and may be due to internal biochemical utilization or the subcellular compartmentation of Zn in leaf cells [52,53]. Compartmental analysis of 65Zn efflux from bean leaves provides further evidence in support of compartmentation in one of the ZE mechanisms, which indicates that the Zn-efficient genotype not only has moderately more Zn in the cytoplasm, and less Zn in the vacuole, but also exhibits a faster Zn exchange from vacuole when compared with the Zn-inefficient genotype [54].
Fe, Mn, and Cu concentrations in the shoots of Zn-deficient plants increased likely due to competitive interaction of Zn deficiency-inducible transport proteins in the transport of Fe, Mn, and Cu compared to Zn across the plasma membrane [34,55]. In addition, maize inbred lines accumulated high amounts of P in shoots on deficient Zn supply, resulting in a higher P/Zn ratio in the shoots. This is completely in accord with the general view of many researchers, that P has an antagonistic effect on Zn uptake by plants and the degree of the increase in the P/Zn ratios in plant tissue is indicative of the degree of Zn-deficiency stress in plants [56,57]. Moreover, this effect is possibly regulated by the expression of the genes encoding P transporters, which is induced by the plant’s Zn nutritional status [58,59]. Zn deficiency not only results in increased expression of the genes encoding high-affinity P uptake transporters in the roots [60], but also increases the expression of P transporters involving in the transport of P to the xylem, leading to enhanced P transport to the shoot [61].

3.2. Comparisons of QTLs Identified in this Study with Previous Reports

To our knowledge, very few Zn efficiency-associated loci have been identified in maize, but numerous QTLs were identified to be associated with Zn and other microelements concentrations in maize [22,24,62,63,64,65]. In addition, there were lots of QTLs related to the traits we used in this study, such as plant height, shoot or root dry weight, and the R/S ratio under other conditions rather than Zn-deficient condition [66,67,68,69]. Thereby, these QTLs in previous studies were compared with current results based on their physical position.
In total, 41 of 54 QTLs for different traits in two linkage populations have been identified to be colocalized with the QTLs reported by other researchers (Tables S1 and S2). Among these QTLs, 21 QTLs were also identified in the QTLs controlling mineral concentrations in grain, including Zn, Fe, Mn, and P concentrations, detected in previous studies [22,24,62,63,64,65]. Especially, the major-effect QTL qKB-R/S7-2 in the KB population was colocalized with two QTLs for Zn and Fe concentrations of the kernel [62]. In addition, five QTLs with a PVE > 20% mapped on chromosome 2 in the DK population were colocalized with the loci controlling Fe and Mn concentrations of the grain detected by Gu et al. [22] (2015) and Zhang et al. [63] (2017). These results imply that these colocalized QTL regions may have pleiotropic effects on the mineral concentration of grains and seedlings in maize.
Moreover, 35 of 54 QTLs in the current study were identified in the QTLs associated with plant height, the shoot or root dry weight, the R/S ratio, and the seedling root traits in previous reports (Tables S1 and S2). Both qKB-PH6-1 and qKB-PH9-1, controlling plant height under Zn deficiency on chromosome 6 and 9, were overlapped with the loci related to plant height reported by Zhang et al. [69] (2018) and Luo et al. [68] (2017), respectively. This indicates that these regions may contain a single gene exerting a strong effect underlying the QTL colocalization for plant height under Zn-deficiency stress. Three QTLs (qKB-RDW1-1, qKB-RDW1-2, and qDK-RDW1-1) on chromosome 1, two QTLs (qDK-RDW2-1 and qDK-RDW2-2) on chromosome 2, one QTL on chromosome 5 (qDK-RDW5-1) and 6 (qDK-RDW6-1), and three QTLs (qKB-RDW9-1, qKB-RDW9-2 and qDK-RDW9-1) on chromosome 9, which were associated with root dry weight, were colocalized with the QTLs regulating the seedling root traits, including the root length, root surface area, and root volume under normal condition [64,70], the axial root number, and the primary root length under high- and low-nitrogen levels [67]. These findings suggest that these QTLs may harbor several genes with pleiotropic effects on root traits at the seedling stage.

3.3. Candidate Genes Associated with Zn Uptake and Transport

Zm00001eb052440, also known as ZmIRT1, which belongs to the ZIP family, was mapped in the QTL colocalization overlapped by qKB-PH1-1 and qDK-PH1-1, controlling plant height under Zn-deficient condition in two RIL populations (Figure 7, Tables S1 and S2). It is reported that the yeast mutants expressing ZmIRT1 showed the strongest propagation under both Zn- and Fe-limited conditions [35]. The ZmIRT1-overexpressing Arabidopsis plants not only exhibit increased levels of Zn and Fe in different tissues, but also show altered tolerance to various Fe and Zn conditions compared with wild-type plants [71].
Actually, IRT1 has been identified to be a metal transporter with a broad substrate specificity [26,72]. A novel yeast uptake assay based on an inductively coupled plasma–mass spectrometry analysis of 31 different metal and metalloid ions proved that the HvIRT1 protein is able to transport Zn2+ and Cd2+, in addition to Fe2+ [73]. The broad substrate specificity of HvIRT1 is similar to that found for AtIRT1 [27,74]. For another homolog, OsIRT1, its transcripts are induced by Fe, Zn, Cu, and Mn deficiencies, and over-expressing plants are sensitive to excess Zn and Cd [75]. Moreover, OsIRT1-overexpressing plants accumulate more Fe and Zn in the shoots, roots, and mature seeds [75]. This indicates that OsIRT1 may be a transporter for Zn.
Additionally, ZmHMA3 and ZmHMA4 were also identified in the QTL colocalization detected by three QTLs (Table 4). Up to now, many HMA genes have been identified and studied in Arabidopsis and rice. ZmHMA3 and ZmHMA4 are the homologs of AtHMA3 and OsHMA3, and ZmHMA9 is the ortholog of OsHMA9 [38]. The overexpression of AtHMA3 leads to the enhancement of Zn accumulation in both shoots and roots [76]. A 67Zn-labeling experiment and a mobility experiment indicate that OsHMA3 is important for Zn detoxification and storage by sequestration into the vacuoles in the roots [77,78].
These findings suggest that ZmHMA3 and ZmHMA4 may be involved in the transport of Zn ions. Zm00001eb051790 (ZmNRAMP6), a member of the NRAMP family in maize, was detected in the overlapped region colocalized by qKB-PH1-1 and qDK-PH1-1 in two different RIL populations. NRAMP proteins play important roles in Zn, Fe, Mn, and Cd transport across the cellular membranes in living organisms [79]. Additionally, the conserved metal-binding site methionine dictates substrate preference in Nramp family divalent metal transporters [80]. The high expression of NRAMP3 and NRAMP4 genes is found in the leaves of Zn/Cd hyperaccumulating Arabidopsis halleri [81]. AtNRAMP4 is an identified Zn transporter [82], and AtNRAMP4 expression modulates the concentrations of Zn2+, Cd2+, and Mn2+ in roots [83]. In addition, the candidate gene Zm00001eb248740 encoding vacuolar iron transporter has been identified in this research (Figure 7). It is reported that rice VIT1 and VIT2 function to transport Fe2+, Zn2+, and Mn2+ into the vacuoles in yeast [84]. OsVIT1 and OsVIT2 are suggested to play a role in Fe/Zn translocation between source and sink organs [84]. Beyond that, three candidate genes identified within a single locus were associated with chelation mechanisms in the uptake and translocation of Zn, containing ZmNAS3 (Zm00001eb052890), ZmDMAS1 (Zm00001eb010040), and ZmTOM3 (Zm00001eb093430). On the one hand, nicotianamine synthase (NAS) catalyzes the biosynthesis of nicotianamine (NA), which can chelate Zn ions to form stable complexes Zn(II)-NA [85]. On the other hand, deoxymugineic acid (DMA) is synthesized from NA via nicotianamine aminotransferase (NAAT) and DMA synthase (DMAS) [86,87,88,89]. Phytosiderophores (PSs), including NA and DMA, secreted by the transporter of mugineic acid (TOM) proteins [90,91,92], can form Zn complexes that are as stable as Fe(III)-PS [93], including Zn(II)-DMA [94] and Zn(II)-NA [95]. These stable complexes, especially Zn(II)-DMA, which is the preferred form for the uptake and long-distance transport of Zn, display important roles in Zn absorption from the soil and the distribution within plants [96,97,98].

3.4. Candidate Genes Linked with Hormone Signaling

Reactive oxygen species (ROS), which should be scavenged to keep cellular turgor and structures actively functioned [99,100], accumulate under Zn-deficient condition, leading to the oxidative degradation of IAA, and then the repression in the shoot growth [101]. Zn plays an important role in the production of indole-3-acetic acid [102,103], and Zn deficiency adversely affects the synthesis of the growth regulating compounds such as auxins, resulting in decreases of production and activity of indole-3-acetic acid [104]. Zn deficiency signals may be linked with hormones that include auxin and ethylene, which would indirectly regulate downstream Zn-responsive genes, such as the genes responsible for Zn acquisition, uptake, and transport, and the genes controlling Zn chelator biosynthesis and release [105].
Zm00001eb421340, also known as ZmAFB, is identified to encode an auxin signaling F-box protein (AFB) and is involved in auxin-dependent regulation via the interaction between TIR1/AFB with Aux/IAA proteins in plants. Zm00001eb258220, which was mapped within qKB-R/S5-1 and qZEAL-RDW5-1 on chromosome 5, encodes a member of the Aux/IAA gene family (ZmIAA17). Exogenous auxin influences plant root growth by regulating the expression of early auxin-responsive genes of auxin/indole-3-acetic acid (Aux/IAA), which may be quickly activated and transcribed after being processed by auxin [106,107,108,109]. OsIAA9, an ortholog of ZmIAA17, is greatly induced by exogenously applied auxin [110]. Ectopic overexpression of OsIAA9 results in fewer crown and lateral roots and reduces the inhibition of root elongation by auxin, suggesting that OsIAA9 is a negative regulator of auxin-regulated root growth [111].
In addition, another five candidate genes probably involved in the ethylene signaling pathway were identified in this study, containing ZmETR (Zm00001eb054170), ZmCTR3 (Zm00001eb096080), ZmEIN2 (Zm00001eb054060), ZmEIN3 (Zm00001eb331080), and ZmEBF1 (Zm00001eb011850) (Table 4, Figure 7). Zn is required for ethylene response because it is a component of the ethylene receptor [112]. Several ethylene signal genes are found in some plants to be regulated by salt stress, Zn stress, and Fe deficiency stress [113,114,115,116].

4. Materials and Methods

4.1. RIL Population

K22×BY815 (KB) and DAN340×K22 (DK) RIL populations, constructed by Xiao et al. [117] (2016), consist of 209 and 192 lines and are derived from the cross between maternal parent K22 and paternal parent BY815, maternal parent DAN340 and paternal parent K22, respectively. The genetic map of the K22×BY815 RIL population contains 2263 SNPs which cover 1670.4 cM throughout the genome. The genetic map of the DAN340×K22 RIL population includes 2100 SNPs that cover 1698.4 cM throughout 10 chromosomes. Average intervals of adjacent SNPs for K22×BY815 and DAN340×K22 RIL populations are 0.74 cM and 0.81 cM, respectively.

4.2. Plant Culture in Hydroponics

Maize seeds were sterilized for 30 min in a 10% solution of H2O2, washed with distilled water, and soaked in saturated CaSO4 for 10 h, and then germinated on moist filter paper in the dark at room temperature. Two days later, the germinated seeds were wrapped in moist filter paper roll and grown. At the stage of two visible leaves, the seedlings were selected and transferred into a 40 L black tank (665 mm × 410 mm × 160 mm, length × width × height). Plants were cultured in hydroponics under Zn-deficient (-Zn: 3 × 10⁻⁴ mmol L−1 Zn-EDTA) and Zn-sufficient conditions (CK: 1 × 10⁻² mmol L−1 Zn-EDTA). Each treatment contained three replicates. For each treatment, 53 RILs and two seedlings of each parent were grown in each tank, as shown in Figure 3a, and four tanks which contained all RILs were considered as a replication in each treatment. For each treatment, a total of twelve tanks was used as three replicates in each RIL population. Two experiments were conducted for two RIL populations randomized in incomplete blocks.
The adjusted Hoagland nutrient solution contained (mmol L−1): 0.5 NH4NO3, 0.5 CaCl2, 1.5 Ca(NO3)2, 0.75 K2SO4, 0.65 MgSO4, 0.1 KCl, 0.25 KH2PO4, 1.0 × 10⁻³ H3BO3, 0.35 EDTA-Fe(II), 8.0 × 10⁻³ CuSO4, 1.2 × 10⁻² MnSO4, 4.0 × 10⁻⁵ (NH4)Mo7O24, 4.0 × 10⁻³ NiCl. Solution pH was set at 5.5–6.0. Nutrient solution was renewed every three days and aerated by a pump. Maize seedlings were cultured in hydroponics in a growth chamber with strictly controlled conditions: 28 °C during 14 h light period from 8:00 to 22:00, 22 °C during 10 h dark period, average light intensity with 350 μmol m−2 s−1 that were measured at canopy.

4.3. Phenotyping Methods

Zn-deficient symptoms appeared since the 9–12th day after transplanting, and the Zn score (ZnSc) for each plant was visually recorded three times since 15th day after transplanting. Six scales (0–5) were designed to assess the tolerance to Zn deficiency. Zn deficiency tolerance scoring mainly depends on the suppression of the growth and development for the whole plant, as well as the areas of chlorosis and necrotic patches distributed on middle and young leaves.
Score 0: plant develops about three leaves with one sprout, plant growth is stunted, and leaf elongation is severely suppressed. All leaves show wrinkled leaf margins and small malformed leaves, and more than 50% of areas on middle and young leaves appear chlorosis and turn pale yellow. The whole leaf with obvious Zn-deficient symptoms tends to be dead, with declines in physiological functions (Figure 2b). Score 1: four leaves and one sprout have been developed, and plant height and leaf elongation are strongly suppressed, as the score-0 plant is. Clustering and malformed leaves are prominent symptoms, and 30–50% of areas on middle and young leaves show Zn-deficient chlorosis with necrotic patches distributed on the margins and tips of leaves (Figure 2c). Score 2: plant has 5 leaves and 1 sprout, exhibiting similar malformations in plant development and distorted leaf growth as with the score-1 plant. All leaves are clustering and small leaves, and 20–30% of areas on middle and young appear brown patches. Moreover, Zn-deficient chlorosis has been improved compared with plants in score-0 and 1 (Figure 2d). Score 3: suppression in plant height and internode length is markedly decreased when compared with the score-2 plant. However, the stretch for all leaves is strongly inhibited and the necrotic spots are shown on 10–20% of areas in middle and young leaves (Figure 2e). Score 4: there are no significant differences in plant growth and development between the -Zn (Zn-deficient condition) and CK treatment (Zn-sufficient condition). However, banded chlorosis is still shown on the leaf margins of the middle and young leaves (Figure 2f). Score 5: plants are green and healthy (Figure 2g).
The experiment was terminated at the 21st day after transplanting, and the plant heights (PH) were measured first, then the shoots (SDW) and roots (RDW) were stored in the envelopes separately. All samples were dried at 75 °C until a constant weight, then shoot and root dry weights were recorded separately, and the R/S ratios (R/S) were calculated. Additionally, the values of SDW, RDW, and R/S in the -Zn/CK treatment refer the ratios of the values under Zn-deficient condition (-Zn) to the values under Zn-sufficient condition (CK). Dried shoots and roots for parent samples were separately ground into fine powder, and 0.3000 g powder was digested with HNO3-H2O2 in a microwave accelerated reaction system (CEM, Matthews, NC, USA). The concentrations of Fe, Mn, Cu, Zn and P in the digested solutions were determined by inductively coupled plasma atomic emission spectroscopy (ICPAES, OPTIMA 3300 DV, Perkin-Elmer, Waltham, MA, USA). The ratio of shoot P content to shoot Zn content for each plant was calculated as P/Zn ratio.

4.4. Statistical Analysis

Means of different inbred lines were compared using one-way ANOVA at a 0.05 level of probability by SPSS 20.0 (SPSS, Chicago, IL, USA). The phenotypic difference between two parents for each RIL population was calculated by Student’s t-test. The linear mixed effect function lmer in the lme4 package of R was fitted to each RIL in the RIL population to obtain the BLUP (Best Linear Unbiased Prediction) value for each trait: yijk = μ + Gi + Ej + Gi × Ej + R(E)jk + εi, where yijk is the phenotypic value of ith inbred line in the jth environment and kth replication, μ is the overall mean, Gi is the genetic effect of the ith inbred line, Ei is the environmental effect of jth environment, Gi × Ej is the interaction between genotype and environment for the ith inbred line and jth environment, R(E)jk is the kth replication within the jth environment, and εijk is the residual error. The broad-sense heritability for each trait was estimated using the formula: H2 = σG2/(σG2 + σGE2/e +σE2/re), where σG2 is genetic variance, σGE2 is the interaction of genotype and environment, σE2 is residual error, while e and r are the number of environments and replications, respectively.

4.5. QTL Mapping

In this study, the BLUP values under Zn-deficient condition (-Zn) and the ratios (-Zn/CK) of the BLUP values under Zn-deficient condition to the values under Zn-sufficient condition were used to perform the QTL analysis. Here, the ratio of -Zn to CK for each trait was calculated using the BLUPs for each trait from the -Zn treatment and CK, respectively. The identification of QTL was performed using composite interval mapping (CIM) [118], implemented in the Windows QTL Cartographer version 2.5 (N.C. State University, Bioinformatics Research Center, Raleigh, NC, USA). The scanning interval between markers was set at 0.5 cM, and the window size was set at 10 cM. Model 6 of the Zmapqtl module was selected for detecting position and additive effects of QTL. The threshold logarithm of odds (LOD) values in this study were estimated by permutation tests with minimum of 1000 replicates at a significance level of p = 0.05. The support interval of the QTL position was determined using the 1-LOD interval method (1 LOD away from the peak LOD value). Moreover, the QTL having the same support intervals were defined as an identical QTL.

4.6. Annotation of Candidate Genes

According to the physical distance of peak bins, genes within the refined QTL peak and their functional descriptions were identified using the maize B73 reference genome assembly Version 5, available on the MaizeGDB Database (Available online: http://www.maizeGDB.org/ (accessed on 15 January 2022)) and the Gramene Database (Available online: https://www.gramene.org/ (accessed on 15 January 2022)). The functions of candidate genes were further confirmed by the annotations of the orthologs in Arabidopsis and rice.

Supplementary Materials

The following supporting information can be downloaded at: https://www.mdpi.com/article/10.3390/ijms23094852/s1.

Author Contributions

J.X.: Data curation, Methodology, Visualization, Software, Formal analysis, Investigation, Writing—original draft preparation. X.Q.: Data curation, Visualization, Software, Formal analysis, Writing—original draft preparation. Z.N.: Writing—reviewing and editing. F.C.: Writing—reviewing and editing. X.F.: Methodology, Software. F.Y.: Conceptualization, Supervision, Writing—reviewing and editing. All authors have read and agreed to the published version of the manuscript.

Funding

This study was supported by the National Key Research and Development Program of China (2016YFD0200405).

Data Availability Statement

The data presented in this study are available on request from the corresponding author.

Acknowledgments

The authors would like to thank Xiaohong Yang of China Agricultural University for K22, BY815, DAN340, K22×BY815, and DAN340×K22 RIL populations, and the genetic maps.

Conflicts of Interest

The authors declare no conflict of interest.

References

  1. Alloway, B.J. Zinc in Soils and Crop Nutrition, 2nd ed.; IZA Publications: Brussels, Belgium; Paris, France, 2008. [Google Scholar]
  2. Cakmak, I. Enrichment of cereal grains with zinc: Agronomic or genetic biofortification? Plant Soil 2008, 302, 1–17. [Google Scholar] [CrossRef]
  3. Impa, S.M.; Johnson-Beebout, S.E. Mitigating zinc deficiency and achieving high grain Zn in rice through integration of soil chemistry and plant physiology research. Plant Soil 2012, 361, 3–41. [Google Scholar] [CrossRef]
  4. Maqbool, M.A.; Beshir, A.R. Zinc biofortification of maize (Zea mays L.): Status and challenges. Plant Breed. 2019, 138, 1–28. [Google Scholar] [CrossRef] [Green Version]
  5. Zhang, W.; Liang, Z.; He, X.; Wang, X.; Shi, X.; Zou, C.; Chen, X. The effects of controlled release urea on maize productivity and reactive nitrogen losses: A meta-analysis. Environ. Pollut. 2019, 246, 559–565. [Google Scholar] [CrossRef] [PubMed]
  6. CGIAR. CGIAR Strategy and Results Framework 2016–2030; CGIAR: Montpellier, France, 2016. [Google Scholar]
  7. Zhao, J.; Yang, X. Spatial patterns of yield-based cropping suitability and its driving factors in the three main maize-growing regions in China. Int. J. Biometeorol. 2019, 63, 1659–1668. [Google Scholar] [CrossRef] [PubMed]
  8. Grassini, P.; Eskridge, K.M.; Cassman, K.G. Distinguishing between yield advances and yield plateaus in historical crop production trends. Nat. Commun. 2013, 4, 2918. [Google Scholar] [CrossRef] [PubMed]
  9. FAOSTAT. Food and Agriculture Organization of the United Nations Statistics Division. 2014. Available online: http://faostat3.fao.org/browse/Q/QC/E (accessed on 15 May 2020).
  10. Sharma, P.N.; Chatterjee, C.; Agarwala, S.C.; Sharma, C.P. Zinc deficiency and pollen fertility in maize (Zea mays). Plant Soil 1990, 124, 221–225. [Google Scholar] [CrossRef]
  11. Serrago, R.A.; Alzueta, I.; Savin, R.; Slafer, G.A. Understanding grain yield responses to source-sink ratios during grain filling in wheat and barley under contrasting environments. Field Crops Res. 2013, 150, 42–51. [Google Scholar] [CrossRef] [Green Version]
  12. Alonso-Blanco, C.; Aarts, M.G.M.; Bentsink, L.; Keurentjes, J.J.B.; Reymond, M.; Vreugdenhil, D.; Koornneef, M. What has natural variation taught us about plant development, physiology, and adaptation? Plant Cell 2009, 21, 1877–1896. [Google Scholar] [CrossRef] [Green Version]
  13. Prasanna, B.M.; Pixley, K.; Warburton, M.L.; Xie, C.X. Molecular marker-assisted breeding options for maize improvement in Asia. Mol. Breed. 2010, 26, 339–356. [Google Scholar] [CrossRef]
  14. Li, P.; Zhang, Y.; Yin, S.; Zhu, P.; Pan, T.; Xu, Y.; Wang, J.; Hao, D.; Fang, H.; Xu, C. QTL-by-environment interaction in the response of maize root and shoot traits to different water regimes. Front. Plant Sci. 2018, 9, 229. [Google Scholar] [CrossRef] [Green Version]
  15. Lonergan, P.F.; Pallotta, M.A.; Lorimer, M.; Paull, J.G.; Barker, S.J.; Graham, R.D. Multiple genetic loci for zinc uptake and distribution in barley (Hordeum vulgare). New Phytol. 2009, 184, 168–179. [Google Scholar] [CrossRef] [PubMed]
  16. Hussain, S.; Rengel, Z.; Mohammadi, S.A.; Ebadi-Segherloo, A.; Maqsood, M.A. Mapping QTL associated with remobilization of zinc from vegetative tissues into grains of barley (Hordeum vulgare). Plant Soil 2016, 399, 193–208. [Google Scholar] [CrossRef]
  17. Velu, G.; Tutus, Y.; Gomez-Becerra, H.F.; Hao, Y.; Demir, L.; Kara, R.; Crespo-Herrera, L.A.; Orhan, S.; Yazici, A.; Singh, R.P.; et al. QTL mapping for grain zinc and iron concentrations and zinc efficiency in a tetraploid and hexaploid wheat mapping populations. Plant Soil 2017, 411, 81–89. [Google Scholar] [CrossRef]
  18. Wissuwa, M.; Ismail, A.M.; Yanagihara, S. Effects of zinc deficiency on rice growth and genetic factors contributing to tolerance. Plant Physiol. 2006, 142, 731–741. [Google Scholar] [CrossRef] [PubMed] [Green Version]
  19. Lee, J.S.; Sajise, A.G.C.; Gregorio, G.B.; Kretzschmar, T.; Ismail, A.M.; Wissuwa, M. Genetic dissection for zinc deficiency tolerance in rice using bi-parental mapping and association analysis. Theor. Appl. Genet. 2017, 130, 1903–1914. [Google Scholar] [CrossRef]
  20. Genc, Y.; Verbyla, A.P.; Torun, A.A.; Carmak, I.; Willsmore, K.; Wallwork, H.; McDonald, G.K. Quantitative trait loci analysis of zinc efficiency and grain zinc concentration in wheat using whole genome average interval mapping. Plant Soil 2009, 314, 49–66. [Google Scholar] [CrossRef]
  21. Gelin, J.R.; Forster, S.; Grafton, K.F.; Mcclean, P.E.; Rojas-Cifuentes, G.A. Analysis of seed zinc and other minerals in a recombinant inbred population of navy bean (Phaseolus vulgaris L.). Crop Sci. 2007, 47, 1361–1366. [Google Scholar] [CrossRef]
  22. Gu, R.; Chen, F.; Liu, B.; Wang, X.; Liu, J.; Li, P.; Pan, Q.; Pace, J.; Soomro, A.A.; Lübberstedt, T.; et al. Comprehensive phenotypic analysis and quantitative trait locus identification for grain mineral concentration, content, and yield in maize (Zea mays L.). Theor. Appl. Genet. 2015, 128, 1777–1789. [Google Scholar] [CrossRef] [Green Version]
  23. Jin, T.; Chen, J.; Zhu, L.; Zhao, Y.; Guo, J.; Huang, Y. Comparative mapping combined with homology-based cloning of the rice genome reveals candidate genes for grain zinc and iron concentration in maize. BMC Genet. 2015, 16, 17. [Google Scholar] [CrossRef] [Green Version]
  24. Hindu, V.; Palacios-Rojas, N.; Babu, R.; Suwarno, W.B.; Rashid, Z.; Usha, R.; Saykhedkar, G.R.; Nair, S.K. Identification and validation of genomic regions influencing kernel zinc and iron in maize. Theor. Appl. Genet. 2018, 131, 1443–1457. [Google Scholar] [CrossRef] [PubMed] [Green Version]
  25. Xu, J.; Wang, X.; Zhu, H.; Yu, F. Identification and Analysis of Zinc Efficiency-Associated Loci in Maize. Front. Plant Sci. 2021, 12, 739282. [Google Scholar] [CrossRef] [PubMed]
  26. Eide, D.; Broderius, M.; Fett, J.; Guerinot, M.L. A novel iron-regulated metal transporter from plants identified by functional expression in yeast. Proc. Natl. Acad. Sci. USA 1996, 93, 5624–5628. [Google Scholar] [CrossRef] [Green Version]
  27. Vert, G.; Grotz, N.; Dédaldéchamp, F.; Gaymard, F.; Guerinot, M.L.; Briat, J.F.; Curie, C. IRT1, an Arabidopsis transporter essential for iron uptake from the soil and for plant growth. Plant Cell 2002, 14, 1223–1233. [Google Scholar] [CrossRef] [PubMed] [Green Version]
  28. Wong, C.K.E.; Jarvis, R.S.; Sherson, S.M.; Cobbett, C.S. Functional analysis of the heavy metal binding domains of the Zn/Cd-transporting ATPase, HMA2, in Arabidopsis thaliana. New Phytol. 2009, 181, 79–88. [Google Scholar] [CrossRef] [PubMed]
  29. Ueno, D.; Yamaji, N.; Kono, I.; Huang, C.F.; Ando, T.; Yano, M.; Ma, J.F. Gene limiting cadmium accumulation in rice. Proc. Natl. Acad. Sci. USA 2010, 107, 16500–16505. [Google Scholar] [CrossRef] [PubMed] [Green Version]
  30. Sasaki, A.; Yamaji, N.; Ma, J.F. Overexpression of OsHMA3 enhances Cd tolerance and expression of Zn transporter genes in rice. J. Exp. Bot. 2014, 65, 6013–6021. [Google Scholar] [CrossRef] [Green Version]
  31. Yan, J.; Wang, P.; Wang, P.; Yang, M.; Lian, X.; Tang, Z.; Huang, C.F.; Salt, D.E.; Zhao, F.J. A loss-of-function allele of OsHMA3 associated with high cadmium accumulation in shoots and grain of Japonica rice cultivars. Plant Cell Environ. 2016, 39, 1941–1954. [Google Scholar] [CrossRef] [Green Version]
  32. Liu, C.L.; Gao, Z.Y.; Shang, L.G.; Yang, C.H.; Ruan, B.P.; Zeng, D.L.; Guo, L.B.; Zhao, F.J.; Huang, C.F.; Qian, Q. Natural variation in the promoter of OsHMA3 contributes to differential grain cadmium accumulation between Indica and Japonica rice. J. Integr. Plant Biol. 2020, 62, 314–329. [Google Scholar] [CrossRef] [Green Version]
  33. Pedas, P.; Schjoerring, J.K.; Husted, S. Identification and characterization of zinc-starvation-induced ZIP transporters from barley roots. Plant Physiol. Biochem. 2009, 47, 377–383. [Google Scholar] [CrossRef]
  34. Tiong, J.; McDonald, G.; Genc, Y.; Shirley, N.; Langridge, P.; Huang, C.Y. Increased expression of six ZIP family genes by zinc (Zn) deficiency is associated with enhanced uptake and root-to-shoot translocation of Zn in barley (Hordeum vulgare). New Phytol. 2015, 207, 1097–1109. [Google Scholar] [CrossRef] [PubMed]
  35. Li, S.; Zhou, X.; Huang, Y.; Zhu, L.; Zhang, S.; Zhao, Y.; Guo, J.; Chen, J.; Chen, R. Identification and characterization of the zinc-regulated transporters, iron-regulated transporter-like protein (ZIP) gene family in maize. BMC Plant Biol. 2013, 13, 114. [Google Scholar] [CrossRef] [PubMed] [Green Version]
  36. Khatun, M.A.; Hossain, M.M.; Bari, M.A.; Abdullahil, K.M.; Parvez, M.S.; Alam, M.F.; Kabir, A.H. Zinc deficiency tolerance in maize is associated with the up-regulation of Zn transporter genes and antioxidant activities. Plant Biol. 2018, 20, 765–770. [Google Scholar] [CrossRef] [PubMed]
  37. Mager, S.; Schönberger, B.; Ludewig, U. The transcriptome of zinc deficient maize roots and its relationship to DNA methylation loss. BMC Plant Biol. 2018, 18, 372. [Google Scholar] [CrossRef] [Green Version]
  38. Cao, Y.; Zhao, X.; Liu, Y.; Wang, Y.; Wu, W.; Jiang, Y.; Liao, C.; Xu, X.; Gao, S.; Shen, Y.; et al. Genome-wide identification of ZmHMAs and association of natural variation in ZmHMA2 and ZmHMA3 with leaf cadmium accumulation in maize. PeerJ 2019, 7, e7877. [Google Scholar] [CrossRef] [Green Version]
  39. Liu, R.; Zhang, H.; Zhao, P.; Zhang, Z.; Liang, W.; Tian, Z.; Zheng, Y. Mining of candidate maize genes for nitrogen use efficiency by integrating gene expression and QTL data. Plant Mol. Biol. Rep. 2012, 30, 297–308. [Google Scholar] [CrossRef]
  40. Osman, K.A.; Tang, B.; Wang, Y.; Chen, J.; Yu, F.; Li, L.; Han, X.; Zhang, Z.; Yan, J.; Zheng, Y.; et al. Dynamic QTL analysis and candidate gene mapping for waterlogging tolerance at maize seedling stage. PLoS ONE 2013, 8, e79305. [Google Scholar] [CrossRef] [Green Version]
  41. Cakmak, I.; Torun, B.; Erenoglu, B.; Ozturk, L.; Marschner, H.; Kalayci, M.; Ekiz, H.; Yilmaz, A. Morphological and physiological differences in the response of cereals to zinc deficiency. Euphytica 1998, 100, 349–357. [Google Scholar] [CrossRef]
  42. Genc, Y.; McDonald, G.K.; Graham, R.D. Differential expression of zinc efficiency during the growing season of barley. Plant Soil 2004, 263, 273–282. [Google Scholar] [CrossRef]
  43. Genc, Y.; McDonald, G.K.; Graham, R.D. Contribution of different mechanisms to zinc deficiency in bread wheat during early vegetative stage. Plant Soil 2006, 281, 353–367. [Google Scholar] [CrossRef]
  44. Khan, H.R.; McDonald, G.K.; Rengel, Z. Chickpea genotypes differ in their sensitivity to Zn deficiency. Plant Soil 1998, 198, 11–18. [Google Scholar] [CrossRef]
  45. Sadeghzadeh, B.; Rengel, Z.; Li, C. Differential zinc efficiency of barley genotypes grown in soil and chelator-buffered nutrient solution. J. Plant Nutr. 2009, 32, 1744–1767. [Google Scholar] [CrossRef]
  46. Cakmak, I.; Sari, N.; Marschner, H.; Kalayci, M.; Yilmaz, A.; Eker, S.; Gülüt, K.Y. Dry matter production and distribution of zinc in bread and durum wheat genotypes differing in Zn efficiency. Plant Soil 1996, 180, 173–181. [Google Scholar] [CrossRef]
  47. Dong, B.; Rengel, Z.; Graham, R.D. Root morphology of wheat genotypes differing in zinc efficiency. J. Plant Nutr. 1995, 18, 2761–2773. [Google Scholar] [CrossRef]
  48. Rengel, Z.; Graham, R.D. Wheat genotypes differ in zinc efficiency when grown in the chelate-buffered nutrient solution. Plant Soil 1995, 176, 307–316. [Google Scholar] [CrossRef]
  49. Hacisalihoglu, G.; Hart, J.J.; Wang, Y.; Cakmak, I.; Kochian, L.V. Zinc efficiency is correlated with enhanced expression and activity of zinc-requiring enzymes in wheat. Plant Physiol. 2003, 131, 595–602. [Google Scholar] [CrossRef] [PubMed] [Green Version]
  50. Impa, S.M.; Morete, M.J.; Ismail, A.M.; Schulin, R.; Johnson-Beebout, S.E. Zn uptake, translocation and grain Zn loading in rice (Oryza sativa L.) genotypes selected for Zn deficiency tolerance and high grain Zn. J. Exp. Bot. 2013, 64, 2739–2751. [Google Scholar] [CrossRef]
  51. Rengel, Z. Physiological mechanisms underlying differential nutrient efficiency of crop genotypes. In Mineral Nutrition of Crops—Fundamental Mechanisms and Implications; Rengel, Z., Ed.; Food Products Press: New York, NY, USA, 1999. [Google Scholar]
  52. Hacisalihoglu, G.; Kochian, L. V How do some plants tolerate low levels of soil zinc? Mechanisms of zinc efficiency in crop plants. New Phytol. 2003, 159, 341–350. [Google Scholar] [CrossRef]
  53. White, P.J.; Broadley, M.R. Physiological limits to zinc biofortification of edible crops. Front. Plant Sci. 2011, 2, 80. [Google Scholar] [CrossRef] [Green Version]
  54. Erenoglu, B.; Nikolic, M.; Römheld, V.; Cakmak, I. Uptake and transport of foliar applied zinc (65Zn) in bread and durum wheat cultivars differing in zinc efficiency. Plant Soil 2002, 241, 251–257. [Google Scholar] [CrossRef]
  55. Rengel, Z.; Graham, R.D. Uptake of zinc from chelate-buffered nutrient solutions by wheat genotypes differing in zinc efficiency. J. Exp. Bot. 1996, 47, 217–226. [Google Scholar] [CrossRef]
  56. Zhang, W.; Liu, D.; Li, C.; Cui, Z.; Chen, X.; Russell, Y.; Zou, C. Zinc accumulation and remobilization in winter wheat as affected by phosphorus application. Field Crops Res. 2015, 184, 155–161. [Google Scholar] [CrossRef]
  57. Zhang, W.; Liu, D.; Liu, Y.; Cui, Z.; Chen, X.; Zou, C. Zinc uptake and accumulation in winter wheat relative to changes in root morphology and mycorrhizal colonization following varying phosphorus application on calcareous soil. Field Crops Res. 2016, 197, 74–82. [Google Scholar] [CrossRef]
  58. Rose, T.J.; Impa, S.M.; Rose, M.T.; Pariasca-Tanaka, J.; Mori, A.; Heuer, S.; Johnson-Beebout, S.E.; Wissuwa, M. Enhancing phosphorus and zinc acquisition efficiency in rice: A critical review of root traits and their potential utility in rice breeding. Ann. Bot. 2013, 112, 331–345. [Google Scholar] [CrossRef] [Green Version]
  59. Shahzad, Z.; Rouached, H.; Rakha, A. Combating mineral malnutrition through iron and zinc biofortification of cereals. Comprehen. Rev. Food Sci. Food Saf. 2014, 13, 329–346. [Google Scholar] [CrossRef]
  60. Huang, C.; Barker, S.J.; Langridge, P.; Smith, F.W.; Graham, R.D. Zinc deficiency up-regulates expression of high-affinity phosphate transporter genes in both phosphate-sufficient and -deficient barley roots. Plant Physiol. 2000, 124, 415–422. [Google Scholar] [CrossRef] [PubMed] [Green Version]
  61. Khan, G.A.; Bouraine, S.; Wege, S.; Li, Y.; de Carbonnel, M.; Berthomieu, P.; Rouached, H.; Poirier, Y. Coordination between zinc and phosphate homeostasis involves the transcription factor PHR1, the phosphate exporter PHO1, and its homologue PHO1; H3 in Arabidopsis. J. Exp. Bot. 2014, 65, 871–884. [Google Scholar] [CrossRef] [Green Version]
  62. Qin, H.; Cai, Y.; Liu, Z.; Wang, G.; Wang, J.; Guo, Y.; Wang, H. Identification of QTL for zinc and iron concentration in maize kernel and cob. Euphytica 2012, 187, 345–358. [Google Scholar] [CrossRef]
  63. Zhang, H.; Liu, J.; Jin, T.; Huang, Y.; Chen, J.; Zhu, L.; Zhao, Y.; Guo, J. Identification of quantitative trait locus and prediction of candidate genes for grain mineral concentration in maize across multiple environments. Euphytica 2017, 213, 90. [Google Scholar] [CrossRef]
  64. Ju, C.; Zhang, W.; Liu, Y.; Gao, Y.; Wang, X.; Yan, J.; Yang, X.; Li, J. Genetic analysis of seedling root traits reveals the association of root trait with other agronomic traits in maize. BMC Plant Biol. 2018, 18, 171. [Google Scholar] [CrossRef]
  65. Ma, L.; Qing, C.; Zhang, M.; Zou, C.; Pan, G.; Shen, Y. GWAS with a PCA uncovers candidate genes for accumulations of microelements in maize seedlings. Physiol. Plantarum 2021, 172, 2170–2180. [Google Scholar] [CrossRef]
  66. Azevedo, G.C.; Cheavegatti-Gianotto, A.; Negri, B.F.; Hufnagel, B.; Silva, L.D.C.E.; Magalhaes, J.V.; Garcia, A.A.; Lana, U.G.; de Sousa, S.M.; Guimaraes, C.T. Multiple interval QTL mapping and searching for PSTOL1 homologs associated with root morphology, biomass accumulation and phosphorus content in maize seedlings under low-P. BMC Plant Biol. 2015, 15, 172. [Google Scholar] [CrossRef] [PubMed] [Green Version]
  67. Li, P.; Zhuang, Z.; Cai, H.; Cheng, S.; Soomro, A.A.; Liu, Z.; Gu, R.; Mi, G.; Yuan, L.; Chen, F. Use of genotype-environment interactions to elucidate the pattern of maize root plasticity to nitrogen deficiency. J. Integr. Plant Biol. 2016, 58, 242–253. [Google Scholar] [CrossRef] [PubMed]
  68. Luo, M.; Zhao, Y.; Zhang, R.; Xing, J.; Duan, M.; Li, J.; Wang, N.; Wang, W.; Zhang, S.; Chen, Z.; et al. Mapping of a major QTL for salt tolerance of mature field-grown maize plants based on SNP markers. BMC Plant Biol. 2017, 17, 140. [Google Scholar] [CrossRef] [PubMed] [Green Version]
  69. Zhang, W.; Li, Z.; Fang, H.; Zhang, M.; Duan, L. Analysis of the genetic basis of plant height-related traits in response to ethylene by QTL mapping in maize (Zea mays L.). PLoS ONE 2018, 13, e0193072. [Google Scholar] [CrossRef] [PubMed] [Green Version]
  70. Burton, A.L.; Johnson, J.; Foerster, J.; Hanlon, M.T.; Kaeppler, S.M.; Lynch, J.P.; Brown, K.M. QTL mapping and phenotypic variation of root anatomical traits in maize (Zea mays L.). Theor. Appl. Genet. 2015, 128, 93–106. [Google Scholar] [CrossRef]
  71. Li, S.; Zhou, X.; Li, H.; Liu, Y.; Zhu, L.; Guo, J.; Liu, X.; Fan, Y.; Chen, J.; Chen, R. Overexpression of ZmIRT1 and ZmZIP3 enhances iron and zinc accumulation in transgenic Arabidopsis. PLoS ONE 2015, 10, e0136647. [Google Scholar] [CrossRef]
  72. Rogers, E.E.; Eide, D.J.; Guerinot, M.L. Altered selectivity in an Arabidopsis metal transporter. Proc. Natl. Acad. Sci. USA 2000, 97, 12356–12360. [Google Scholar] [CrossRef] [Green Version]
  73. Pedas, P.; Ytting, C.K.; Fuglsang, A.T.; Jahn, T.P.; Schjoerring, J.K.; Husted, S. Manganese efficiency in barley: Identification and characterization of the metal ion transporter HvIRT1. Plant Physiol. 2008, 148, 455–466. [Google Scholar] [CrossRef] [Green Version]
  74. Korshunova, Y.O.; Eide, D.; Clark, W.G.; Guerinot, M.L.; Pakrasi, H.B. The IRT1 protein from Arabidopsis thaliana is a metal transporter with a broad substrate range. Plant Mol. Biol. 1999, 40, 37–44. [Google Scholar] [CrossRef]
  75. Lee, S.; An, G. Over-expression of OsIRT1 leads to increased iron and zinc accumulations in rice. Plant Cell Environ. 2009, 32, 408–416. [Google Scholar] [CrossRef] [PubMed]
  76. Morel, M.; Crouzet, J.; Gravot, A.; Auroy, P.; Leonhardt, N.; Vavasseur, A.; Richaud, P. AtHMA3, a P1B-ATPase allowing Cd/Zn/Co/Pb vacuolar storage in Arabidopsis. Plant Physiol. 2009, 149, 894–904. [Google Scholar] [CrossRef] [PubMed] [Green Version]
  77. Cai, H.M.; Huang, S.; Che, J.; Yamaji, N.; Ma, J.F. The tonoplast-localized transporter OsHMA3 plays an important role in maintaining Zn homeostasis in rice. J. Exp. Bot. 2019, 70, 2717–2725. [Google Scholar] [CrossRef] [PubMed] [Green Version]
  78. Ma, J.F.; Ueno, D.; Zhao, F.J.; McGrath, S.P. Subcellular localisation of Cd and Zn in the leaves of a Cd-hyperaccumulating ecotype of Thlaspi caerulescens. Planta 2005, 220, 731–736. [Google Scholar] [CrossRef]
  79. Nevo, Y.; Nelson, N. The NRAMP family of metal-ion transporters. Biochim. Biophys. Acta-Mol. Cell Res. 2006, 1763, 609–620. [Google Scholar] [CrossRef] [Green Version]
  80. Bozzi, A.T.; Bane, L.B.; Weihofen, W.A.; McCabe, A.L.; Singharoy, A.; Chipot, C.J.; Schulten, K.; Gaudet, R. Conserved methionine dictates substrate preference in Nramp-family divalent metal transporters. Proc. Natl. Acad. Sci. USA 2016, 113, 10310–10315. [Google Scholar] [CrossRef] [Green Version]
  81. Weber, M.; Harada, E.; Vess, C.; Roepenack-Lahaye, E.V.; Clemens, S. Comparative microarray analysis of Arabidopsis thaliana and Arabidopsis halleri roots identifies nicotianamine synthase, a ZIP transporter and other genes as potential metal hyperaccumulation factors. Plant J. 2004, 37, 269–281. [Google Scholar] [CrossRef]
  82. Lanquar, V.; Lelièvre, F.; Barbier-Brygoo, H.; Thomine, S. Regulation and function of AtNRAMP4 metal transporter protein. Soil Sci. Plant Nutr. 2004, 50, 1141–1150. [Google Scholar] [CrossRef]
  83. Pottier, M.; Oomen, R.; Picco, C.; Giraudat, J.; Scholz-Starke, J.; Richaud, P.; Carpaneto, A.; Thomine, S. Identification of mutations allowing Natural Resistance Associated Macrophage Proteins (NRAMP) to discriminate against cadmium. Plant J. 2015, 83, 625–637. [Google Scholar] [CrossRef] [Green Version]
  84. Zhang, Y.; Xu, Y.H.; Yi, H.Y.; Gong, J.M. Vacuolar membrane transporters OsVIT1 and OsVIT2 modulate iron translocation between flag leaves and seeds in rice. Plant J. 2012, 72, 400–410. [Google Scholar] [CrossRef]
  85. Rellan-Alvarez, R.; Abadia, J.; Alvarez-Fernandez, A. Formation of metal-nicotianamine complexes as affected by pH, ligand exchange with citrate and metal exchange. A study by electrospray ionization time-of-flight mass spectrometry. Rapid Commun. Mass. Spectrom. 2008, 22, 1553–1562. [Google Scholar] [CrossRef] [PubMed]
  86. Shojima, S.; Nishizawa, N.K.; Fushiya, S.; Nozoe, S.; Irifune, T.; Mori, S. Biosynthesis of phytosiderophores: In Vitro biosynthesis of 2’-deoxymugineic acid from l-methionine and nicotianamine. Plant Physiol. 1990, 93, 1497–1503. [Google Scholar] [CrossRef] [Green Version]
  87. Higuchi, K.; Suzuki, K.; Nakanishi, H.; Yamaguchi, H.; Nishizawa, N.K.; Mori, S. Cloning of nicotianamine synthase genes, novel genes involved in the biosynthesis of phytosiderophores. Plant Physiol. 1999, 119, 471–480. [Google Scholar] [CrossRef] [PubMed] [Green Version]
  88. Takahashi, M.; Yamaguchi, H.; Nakanishi, H.; Shioiri, T.; Nishizawa, N.K.; Mori, S. Cloning two genes for nicotianamine aminotransferase, a critical enzyme in iron acquisition (strategy II) in graminaceous plants. Plant Physiol. 1999, 121, 947–956. [Google Scholar] [CrossRef] [PubMed] [Green Version]
  89. Bashir, K.; Inoue, H.; Nagasaka, S.; Takahashi, M.; Nakanishi, H.; Mori, S.; Nishizawa, N.K. Cloning and characterization of deoxymugineic acid synthase genes from graminaceous plants. J. Biol. Chem. 2006, 281, 32395–32402. [Google Scholar] [CrossRef] [PubMed] [Green Version]
  90. Nozoye, T.; Nagasaka, S.; Kobayashi, T.; Takahashi, M.; Sato, Y.; Uozumi, N.; Nakanishi, H.; Nishizawa, N.K. Phytosiderophore efflux transporters are crucial for iron acquisition in graminaceous plants. J. Biol. Chem. 2011, 286, 5446–5454. [Google Scholar] [CrossRef] [Green Version]
  91. Nozoye, T.; Nagasaka, S.; Kobayashi, T.; Sato, Y.; Uozumi, N.; Nakanishi, H.; Nishizawa, N.K. The phytosiderophore efflux transporter TOM2 is involved in metal transport in rice. J. Biol. Chem. 2015, 290, 27688–27699. [Google Scholar] [CrossRef] [Green Version]
  92. Sharma, S.; Kaur, G.; Kumar, A.; Meena, V.; Kaur, J.; Pandey, A.K. Overlapping transcriptional expression response of wheat zinc-induced facilitator-like transporters emphasize important role during Fe and Zn stress. BMC Mol. Biol. 2019, 20, 22. [Google Scholar] [CrossRef] [Green Version]
  93. Murakami, T.; Ise, K.; Hayakawa, M.; Kamei, S.; Takagi, S.I. Stabilities of metal-complexes of mugineic acids and their specific affinities for iron (III). Chem. Lett. 1989, 12, 2137–2140. [Google Scholar] [CrossRef]
  94. Xuan, Y.; Scheuermann, E.B.; Meda, A.R.; Hayen, H.; von Wireìn, N.; Weber, G. Separation and identification of phytosiderophores and their metal complexes in plants by zwitterionic hydrophilic interaction liquid chromatography coupled to electrospray ionization mass spectrometry. J. Chromatogr. A 2006, 1136, 73–81. [Google Scholar] [CrossRef]
  95. Nishiyama, R.; Kato, M.; Nagata, S.; Yanagisawa, S.; Yoneyama, T. Identification of Zn-nicotianamine and Fe-20-deoxymugineic acid in the phloem sap from rice plants (Oryza sativa L.). Plant Cell Physiol. 2012, 53, 381–390. [Google Scholar] [CrossRef] [PubMed]
  96. Suzuki, M.; Tsukamoto, T.; Inoue, H.; Watanabe, S.; Matsuhashi, S.; Takahashi, M.; Nakanishi, H.; Mori, S.; Nishizawa, N.K. Deoxymugineic acid increases Zn translocation in Zn-deficient rice plants. Plant Mol. Biol. 2008, 66, 609–617. [Google Scholar] [CrossRef] [PubMed] [Green Version]
  97. Arnold, T.; Kirk, G.J.; Wissuwa, M.; Frei, M.; Zhao, F.J.; Mason, T.F.; Weiss, D.J. Evidence for the mechanisms of zinc uptake by rice using isotope fractionation. Plant Cell Environ. 2010, 33, 370–381. [Google Scholar] [CrossRef] [PubMed]
  98. Bashir, K.; Ishimaru, Y.; Nishizawa, N.K. Molecular mechanisms of zinc uptake and translocation in rice. Plant Soil 2012, 361, 189–201. [Google Scholar] [CrossRef]
  99. Yancey, P.H. Organic osmolytes as compatible, metabolic and counteracting cytoprotectants in high osmolarity and other stresses. J. Exp. Biol. 2005, 208, 2819–2830. [Google Scholar] [CrossRef] [Green Version]
  100. Mittler, R. Abiotic stress, the field environment and stress combination. Trends Plant Sci. 2006, 11, 15–19. [Google Scholar] [CrossRef]
  101. Marschner, H. Mineral Nutrition of Higher Plants, 2nd ed.; Academic Press: London, UK, 1995. [Google Scholar]
  102. Cakmak, I. Possible roles of zinc in protecting plant cells from damage by reactive oxygen species. New Phytol. 2000, 146, 185–205. [Google Scholar] [CrossRef]
  103. Marschner, H. Mineral Nutrition of Higher Plants, 3rd ed.; Academic Press: London, UK, 2012. [Google Scholar]
  104. Alloway, B.J. Zinc in Soils and Crop Nutrition. International Zinc Association Communications; IZA Publications: Brussels, Belgium, 2004. [Google Scholar]
  105. Zeng, H.; Wu, H.; Yan, F.; Yi, K.; Zhu, Y. Molecular regulation of zinc deficiency responses in plants. J. Plant Physiol. 2021, 261, 153419. [Google Scholar] [CrossRef]
  106. Guilfoyle, T.J.; Hagen, G. Auxin response factors. Curr. Opin. Plant Biol. 2007, 10, 453–460. [Google Scholar] [CrossRef]
  107. Kazan, K. Auxin and the integration of environmental signals into plant root development. Annu. Bot. 2013, 112, 1655–1665. [Google Scholar] [CrossRef] [Green Version]
  108. Guilfoyle, T.J. The PB1 domain in auxin response factor and Aux/IAA proteins: A versatile protein interaction module in the auxin response. Plant Cell 2015, 27, 33–43. [Google Scholar] [CrossRef] [PubMed] [Green Version]
  109. Jian, Y.; Wu, Y.; Hu, N.; Li, H.; Jiao, J. Interactions of bacterial-feeding nematodes and indole-3-acetic acid (IAA)-producing bacteria promotes growth of Arabidopsis thaliana by regulating soil auxin status. Appl. Soil Ecol. 2020, 147, 103447. [Google Scholar] [CrossRef]
  110. Jain, M.; Kaur, N.; Garg, R.; Thakur, J.K.; Tyagi, A.K.; Khurana, J.P. Structure and expression analysis of early auxin-responsive Aux/IAA gene family in rice (Oryza sativa). Funct. Integr. Genom. 2006, 6, 47–59. [Google Scholar] [CrossRef] [PubMed]
  111. Song, Y.L. The gene OsIAA9 encoding auxin/indole-3-acetic acid proteins is a negative regulator of auxin-regulated root growth in rice. Biol. Plant. 2019, 63, 210–218. [Google Scholar] [CrossRef]
  112. Iqbal, N.; Trivellini, A.; Masood, A.; Ferrante, A.; Khan, N.A. Current understanding on ethylene signaling in plants: The influence of nutrient availability. Plant Physiol. Biochem. 2013, 73, 128–138. [Google Scholar] [CrossRef]
  113. Peng, J.; Li, Z.; Wen, X.; Li, W.; Shi, H.; Yang, L.; Zhu, H.; Guo, H. Salt-induced stabilization of EIN3/EIL1 confers salinity tolerance by deterring ROS accumulation in Arabidopsis. PLoS Genet. 2014, 10, e1004664. [Google Scholar] [CrossRef] [Green Version]
  114. Tao, J.J.; Chen, H.W.; Ma, B.; Zhang, W.K.; Chen, S.Y.; Zhang, J.S. The role of ethylene in plants under salinity stress. Front. Plant Sci. 2015, 6, 1059. [Google Scholar] [CrossRef]
  115. Muchate, N.S.; Nikalje, G.C.; Rajurkar, N.S.; Suprasanna, P.; Nikam, T.D. Plant salt stress: Adaptive responses, tolerance mechanism and bioengineering for salt tolerance. Bot. Rev. 2016, 82, 371–406. [Google Scholar] [CrossRef]
  116. Khan, M.I.R.; Jahan, B.; Alajmi, M.F.; Rehman, M.T.; Khan, N.A. Exogenously-sourced ethylene modulates defense mechanisms and promotes tolerance to zinc stress in mustard (Brassica juncea L.). Plants 2019, 8, 540. [Google Scholar] [CrossRef] [Green Version]
  117. Xiao, Y.; Tong, H.; Yang, X.; Xu, S.; Pan, Q.; Qiao, F.; Raihan, M.S.; Luo, Y.; Liu, H.; Zhang, X.; et al. Genome-wide dissection of the maize ear genetic architecture using multiple populations. New Phytol. 2016, 210, 1095–1106. [Google Scholar] [CrossRef] [Green Version]
  118. Zeng, Z.B. Precision mapping of quantitative trait loci. Genetics 1994, 136, 999–1009. [Google Scholar] [CrossRef] [PubMed]
Figure 1. Under the Zn-deficient (-Zn: 0.3 μmol L−1 Zn-EDTA) and Zn-sufficient (CK: 10 μmol L−1 Zn-EDTA) conditions, maize inbred lines K22, BY815, and DAN340 (from left to right) were grown hydroponically for 21 days after transplanting. Representative shoots are displayed.
Ijms 23 04852 g001
Figure 2. Shoot (a) and root (b) concentrations (μg g−1) of Zn, shoot concentrations of Fe (c), Mn (d), and Cu (e), and shoot P/Zn ratios (f) of parent plants (K22, BY815, and DAN340) hydroponically grown under Zn-deficient (0.3 μmol L−1 Zn-EDTA) and Zn-sufficient (10 μmol L−1 Zn-EDTA) conditions for 21 days after transplanting. Different uppercase (lowercase) letters indicate significant differences among K22, BY815, and DAN340 in the -Zn (CK) treatments at p ˂ 0.05. ** indicates significant differences between the -Zn and CK treatments at p ˂ 0.01.
Ijms 23 04852 g002
Figure 3. Phenotypic variations in the RILs and six scales for Zn score under Zn deficiency in maize. (a) In the -Zn treatment, two plants for each parent and 53 RILs were grown in hydroponics for 21 days after transplanting in each container. Large variations of Zn-deficient symptoms were observed among RILs. Zn score for each plant has been visually recorded for three times since 15th day after transplanting. (b) All leaves show wrinkled leaf margins and small malformed leaves, and more than 50% of areas on middle and young leaves show chlorosis and turn pale yellow. The whole leaf with obvious Zn-deficient symptoms tends to be dead with declines in physiological functions. (c) Clustering and malformed leaves are prominent symptoms, and 30–50% of areas on middle and young leaves show Zn deficient chlorosis with necrotic patches distributed on margins and tips of leaves. (d) All leaves are clustering and small leaves, and 20–30% of areas on middle and young appear brown patches. Moreover, Zn-deficient chlorosis has been improved compared with plants in score-0 and 1. (e) The stretch for all leaves of score-3 plant is strongly inhibited and necrotic spots are shown on 10–20% of areas in middle and young leaves. (f) There are no obvious differences of score-4 plant between the -Zn and CK treatments. However, banded chlorosis is still shown on leaf margins of middle and young leaves. (g) Score-5 plants are green and healthy without any Zn-deficient symptoms.
Ijms 23 04852 g003
Figure 4. Phenotypic distribution of each trait in the K22×BY815 RIL population under different conditions (-Zn, -Zn/CK). (a) Zn score; (b) plant height; (c,f) shoot dry weight; (d,g) root dry weight; (e,h) R/S ratio. The solid line in each box represents the median values. The upper and bottom lines represent the 90th and 10th percentiles, respectively. The top and bottom edge of each box represent the 75th and 25th percentiles, respectively.
Ijms 23 04852 g004
Figure 5. Phenotypic distribution of each trait in the DAN340×K22 RIL population under different conditions (-Zn, -Zn/CK). (a) Zn score; (b) plant height; (c,f) shoot dry weight; (d,g) root dry weight; (e,h) R/S ratio. The solid line in each box represents the median values. The upper and bottom lines represent the 90th and 10th percentiles, respectively. The top and bottom edge of each box represent the 75th and 25th percentiles, respectively.
Ijms 23 04852 g005
Figure 6. Correlation coefficients among eight traits in the K22×BY815 (upper triangular matrix) and DAN340×K22 (lower triangular matrix) RIL populations. PH, plant height; SDW, shoot dry weight; RDW, root dry weight; R/S, root-to-shoot ratio. **, p < 0.01.
Ijms 23 04852 g006
Figure 7. Fifty-four Zn efficiency-associated loci (ZEALs) detected on chromosome 1, 2, 3, 5, 6, 7, 9, 10 in the K22×BY815 (KB) and DAN340×K22 (DK) RIL populations, and the QTL colocalizations identified in the Ye478×Wu312 (YW) RIL population [25]. Candidate genes considered to be associated with Zn deficiency uptake, transport, and redistribution (ZmDMAS1, ZmTOM3, ZmNRAMP6, ZmIRT1, ZmHMA3 and ZmHMA4, ZmHMA9, and ZmVIT) are depicted in black columns.
Ijms 23 04852 g007
Table 1. Phenotypic variations of the traits associated with Zn deficiency tolerance in the parental lines K22 and BY815, and K22×BY815 RIL population.
Trait aTreatment aParents RIL Population
K22♀BY815♂bMeanCV (%)H2 (%)c
ZnSc-Zn13**2.555.483.1
PH (cm)-Zn29.567.2**41.826.172.4
SDW (g)-Zn0.291.88**0.7946.681.2
SDW-Zn/CK0.231.16**0.5350.2NA
RDW (g)-Zn0.120.64**0.2841.074.8
RDW-Zn/CK0.291.11**0.6447.2NA
R/S-Zn0.340.37**0.3419.664.7
R/S-Zn/CK1.311.12*1.2621.9NA
a ZnSc, PH, SDW, RDW, and R/S represent Zn score, plant height, shoot dry weight, root dry weight, and R/S ratio, respectively. -Zn and -Zn/CK indicate the data under Zn-deficient condition and the ratio of the data under Zn-deficient condition to the data under Zn-sufficient condition. The same as below. b * and ** indicate significant differences between K22 and BY815 at p < 0.05 and p < 0.01, respectively. c NA indicates not available data. The same as below.
Table 2. Phenotypic variations of the traits associated with Zn deficiency tolerance in the parental lines DAN340 and K22, and DAN340×K22 RIL population.
TraitTreatmentParents RIL Population
DAN340♀K22♂aMeanCV (%)H2 (%)
ZnSc-Zn31**2.453.186.8
PH (cm)-Zn59.431**37.530.281.5
SDW (g)-Zn1.040.36**0.6150.184.1
SDW-Zn/CK0.80.26**0.5453.8NA
RDW (g)-Zn0.270.13**0.1837.177.4
RDW-Zn/CK0.860.31*0.5648.7NA
R/S-Zn0.360.33**0.3429.072.2
R/S-Zn/CK1.161.34**1.1723.9NA
a * and ** indicate significant differences between DAN340 and K22 at p < 0.05 and p < 0.01, respectively.
Table 3. QTLs colocalized with the loci controlling different traits in the K22×BY815, DAN340×K22, and Ye478×Wu312 RIL populations.
ChrInterval (Mb) aQTLTrait bPhysical Interval (Mb) aLODR2 (%)RIL Population c
1261.4–265.2qKB-PH1-1PH260.2–265.25.710.3KB
qDK-PH1-1PH261.4–266.69.514.2DK
1270.4–270.8qKB-RDW1-1RDW270.4–275.135.9KB
qDK-RDW1-1RDW267.1–270.86.411.4DK
27.9–9.4qKB-ZnSc2-1ZnSc7.9–9.44.57.8KB
qZEAL-ZnSc2-1ZnSc4.9–14.4
236.2–38.4qDK-ZnSc2-1ZnSc36.2–38.41016.4DK
qZEAL-ZnSc2-2ZnSc33.5–111.83.910.1YW
2108.6–134.3qDK-SDW2-1SDW74.6–153.012.423.2DK
qZEAL-SDW2-1SDW111.8–176.36.120.7YW
qZEAL-SDW2-2SDW111.8–176.36.317.3YW
a The position refers to the B73 reference sequence Version 5. b ZnSc, PH, SDW, RDW represent Zn score, plant height, shoot and root dry weight, respectively. c KB, DK and YW represent the K22×BY815, the DAN340×K22, and the Ye478×Wu312 RIL populations, respectively.
Table 4. The information of candidate genes within the loci.
QTLChrGene IDGene Position (bp) aDescription
qDK-R/S1-31Zm00001eb01004031742085–31745237ZmDMAS1—Deoxymugineic acid synthase 1
qDK-R/S1-31Zm00001eb01185038561776–38563168ZmEBF1—EIN3-binding F box protein 1
qKB-PH1-1, qDK-PH1-11Zm00001eb051790262493944–262496834ZmNRAMP—Metal transporter Nramp 6
1Zm00001eb052440264886590–264888963ZmIRT1—Iron-regulated transporter 1
qDK-PH1-11Zm00001eb052890266321457–266323150ZmNAS3—Nicotianamine synthase 3
qKB-RDW1-11Zm00001eb054060270891072–270897163ZmEIN2—Ethylene-insensitive protein 2
qKB-RDW1-11Zm00001eb054170271172369–271177408ZmETR—Signal transduction histidine kinase hybrid-type ethylene sensor
qDK-ZnSc2-22Zm00001eb08503067296998–67301921ZmAFB—Auxin signaling F-box
qDK-ZnSc2-2, qDK-PH2-1, qDK-SDW2-1, qDK-R/S2-12Zm00001eb093430152901305–152906124ZmTOM3—Transporter of mugineic acid 3
qDK-ZnSc2-3, qDK-PH2-2, qDK-R/S2-22Zm00001eb095010162889727–162893463ZmHMA4—Cadmium/Zinc-transporting ATPase HMA4
2Zm00001eb095020162910876–162914856ZmHMA3—Cadmium/Zinc-transporting ATPase HMA3
qDK-ZnSc2-3, qDK-PH2-2, qDK-R/S2-22Zm00001eb096080170130733–170150672ZmCTR3—Constitutive triple response 3
qDK-PH5-1, qDK-RDW5-15Zm00001eb248740193961138–193962096ZmVIT—Vacuolar iron transporter (VIT) family protein
qKB-R/S5-1, qZEAL-RDW5-15Zm00001eb258220222819625–222821061ZmIAA17—auxin-responsive Aux/IAA family member
qKB-R/S7-27Zm00001eb331080182932191–182934361ZmEIN3—Ethylene insensitive 3 family protein
qKB-PH9-1, qKB-ZnSc9-2, qKB-SDW9-19Zm00001eb389830114577311–114585730ZmHMA9—Heavy metal translocating P-type ATPase transports
qDK-PH10-110Zm00001eb421340113391837–113396456ZmAFB—Auxin signaling F-box
a The position refers to the B73 reference sequence Version 5.
Publisher’s Note: MDPI stays neutral with regard to jurisdictional claims in published maps and institutional affiliations.

