
Amyloid Beta Pathology Exacerbates Weight Loss and Brain Cytokine Responses following Low-Dose Lipopolysaccharide in Aged Female Tg2576 Mice

 ,
,  ,
,
Abstract
:1. Introduction
2. Results
2.1. Effects of LPS Treatment on SBs and DBs
2.2. Effects of LPS Treatment on BBB Disruption
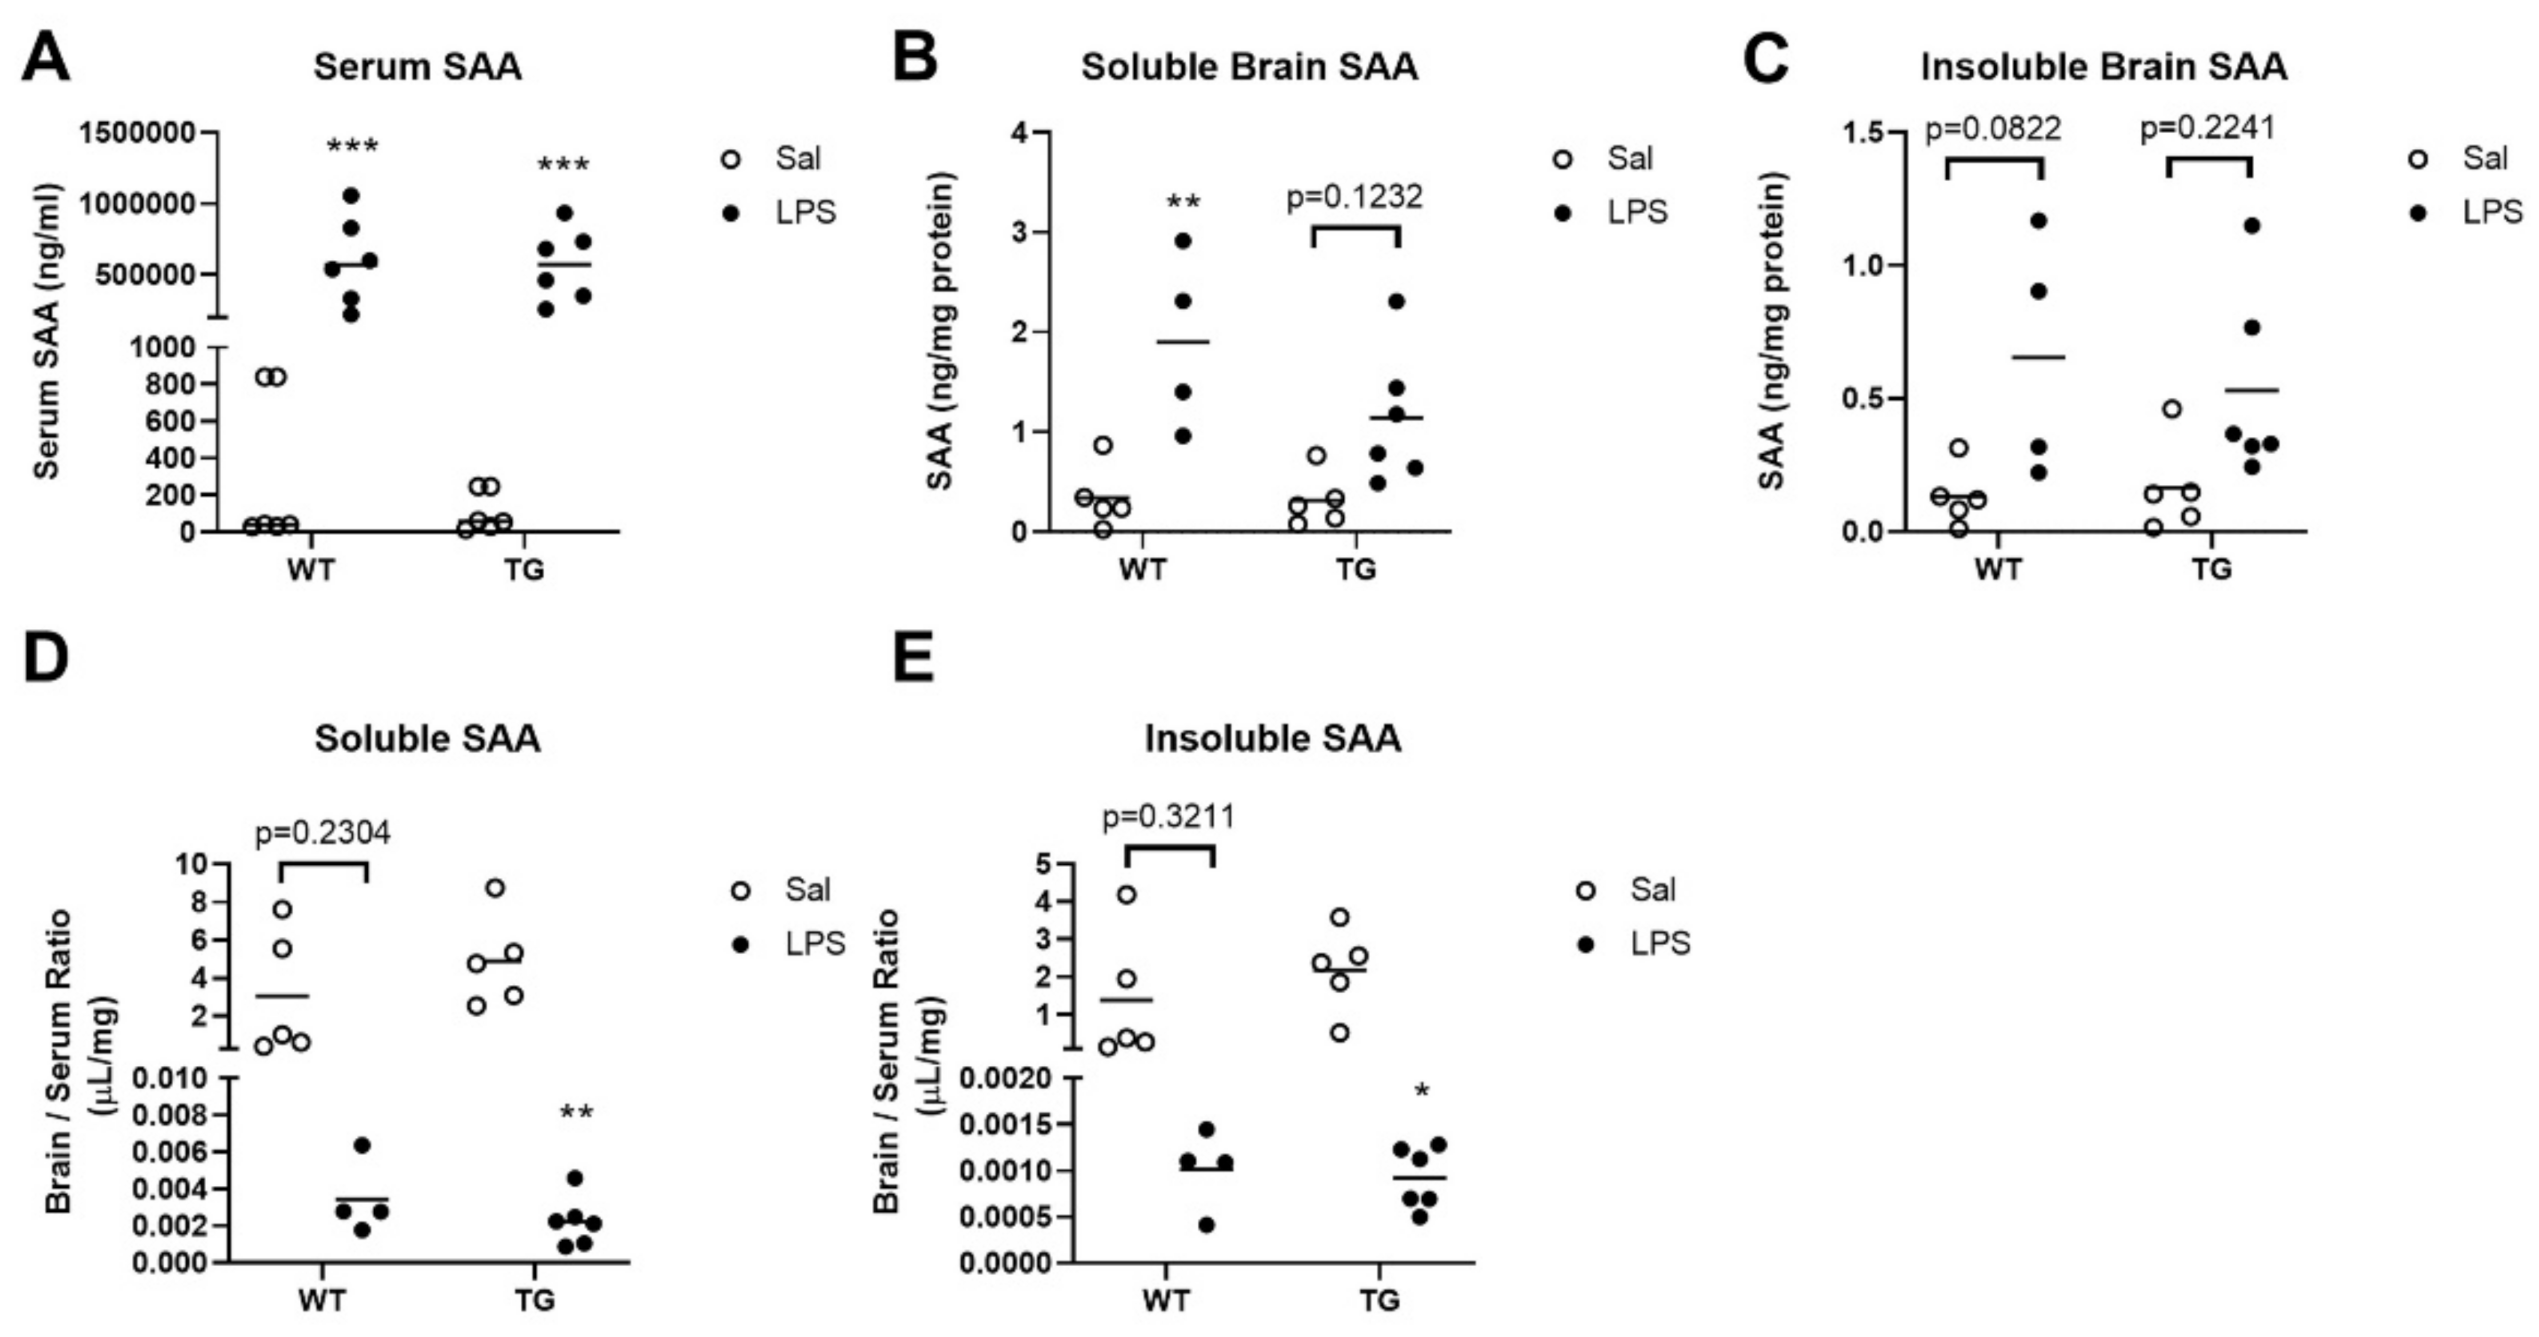
2.3. Effects of LPS Treatment on SAA Concentrations in Blood and Brain
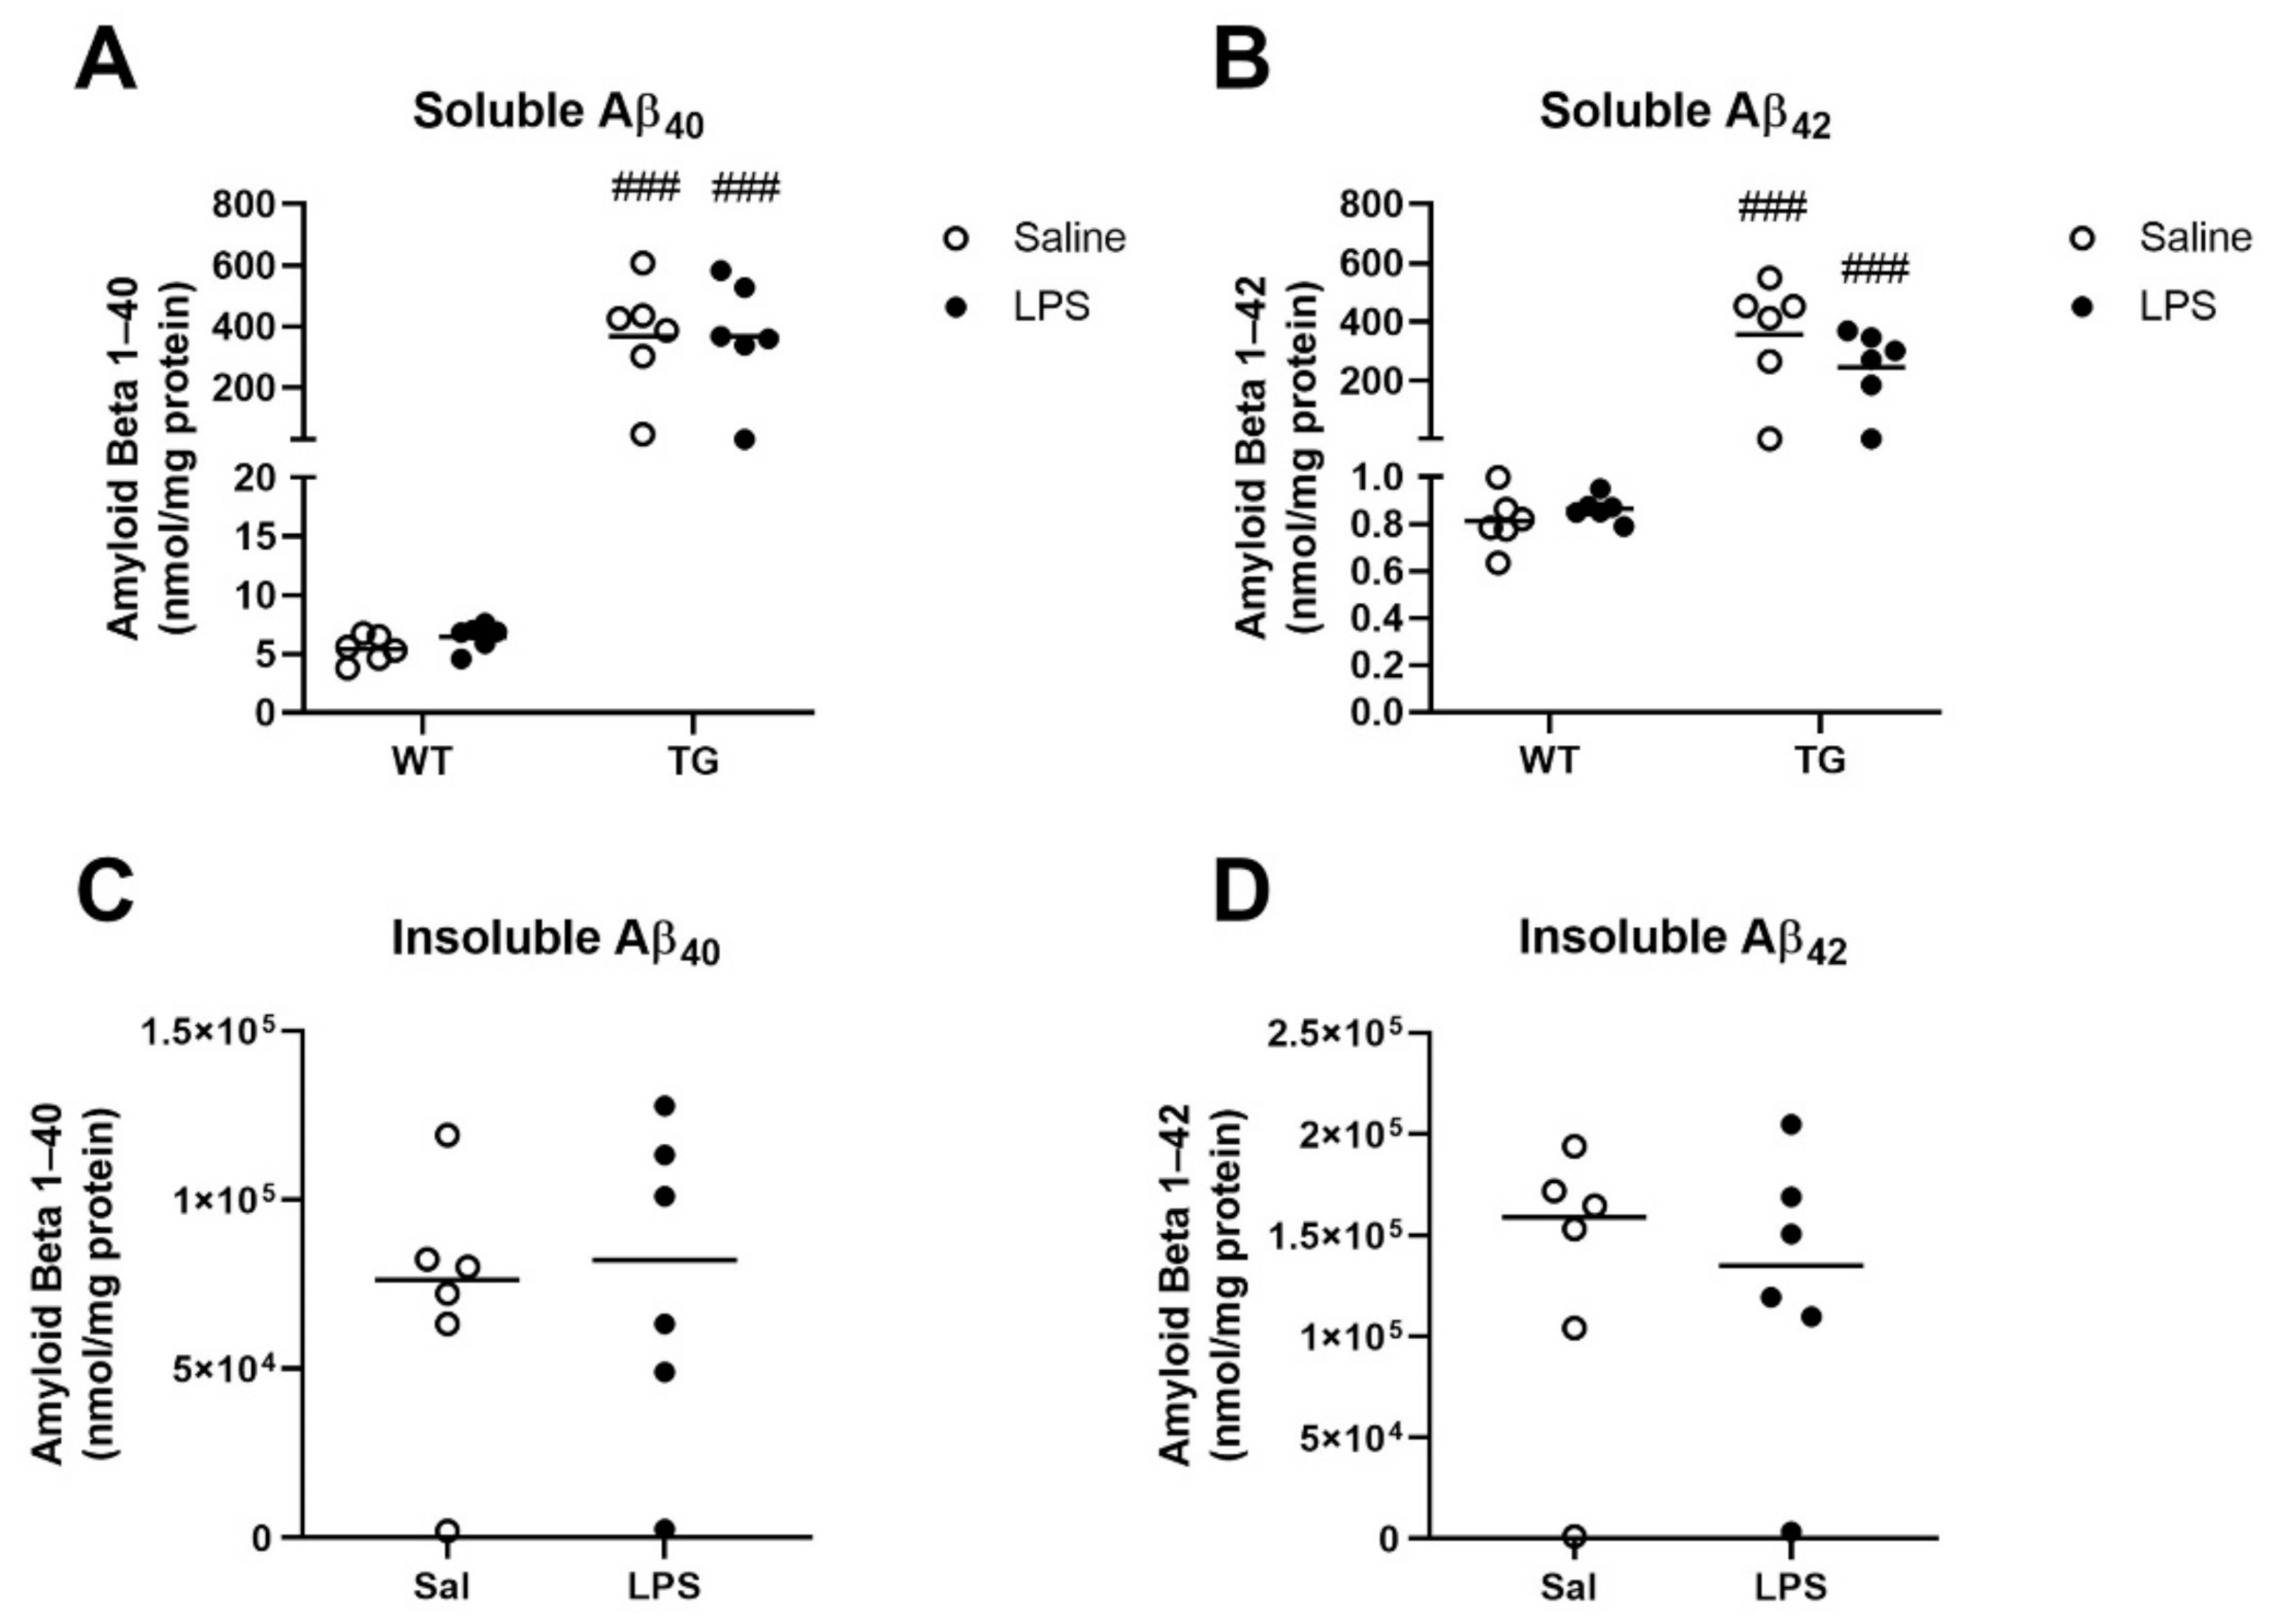
2.4. Effects of LPS Treatment on Aβ Concentrations in Brain
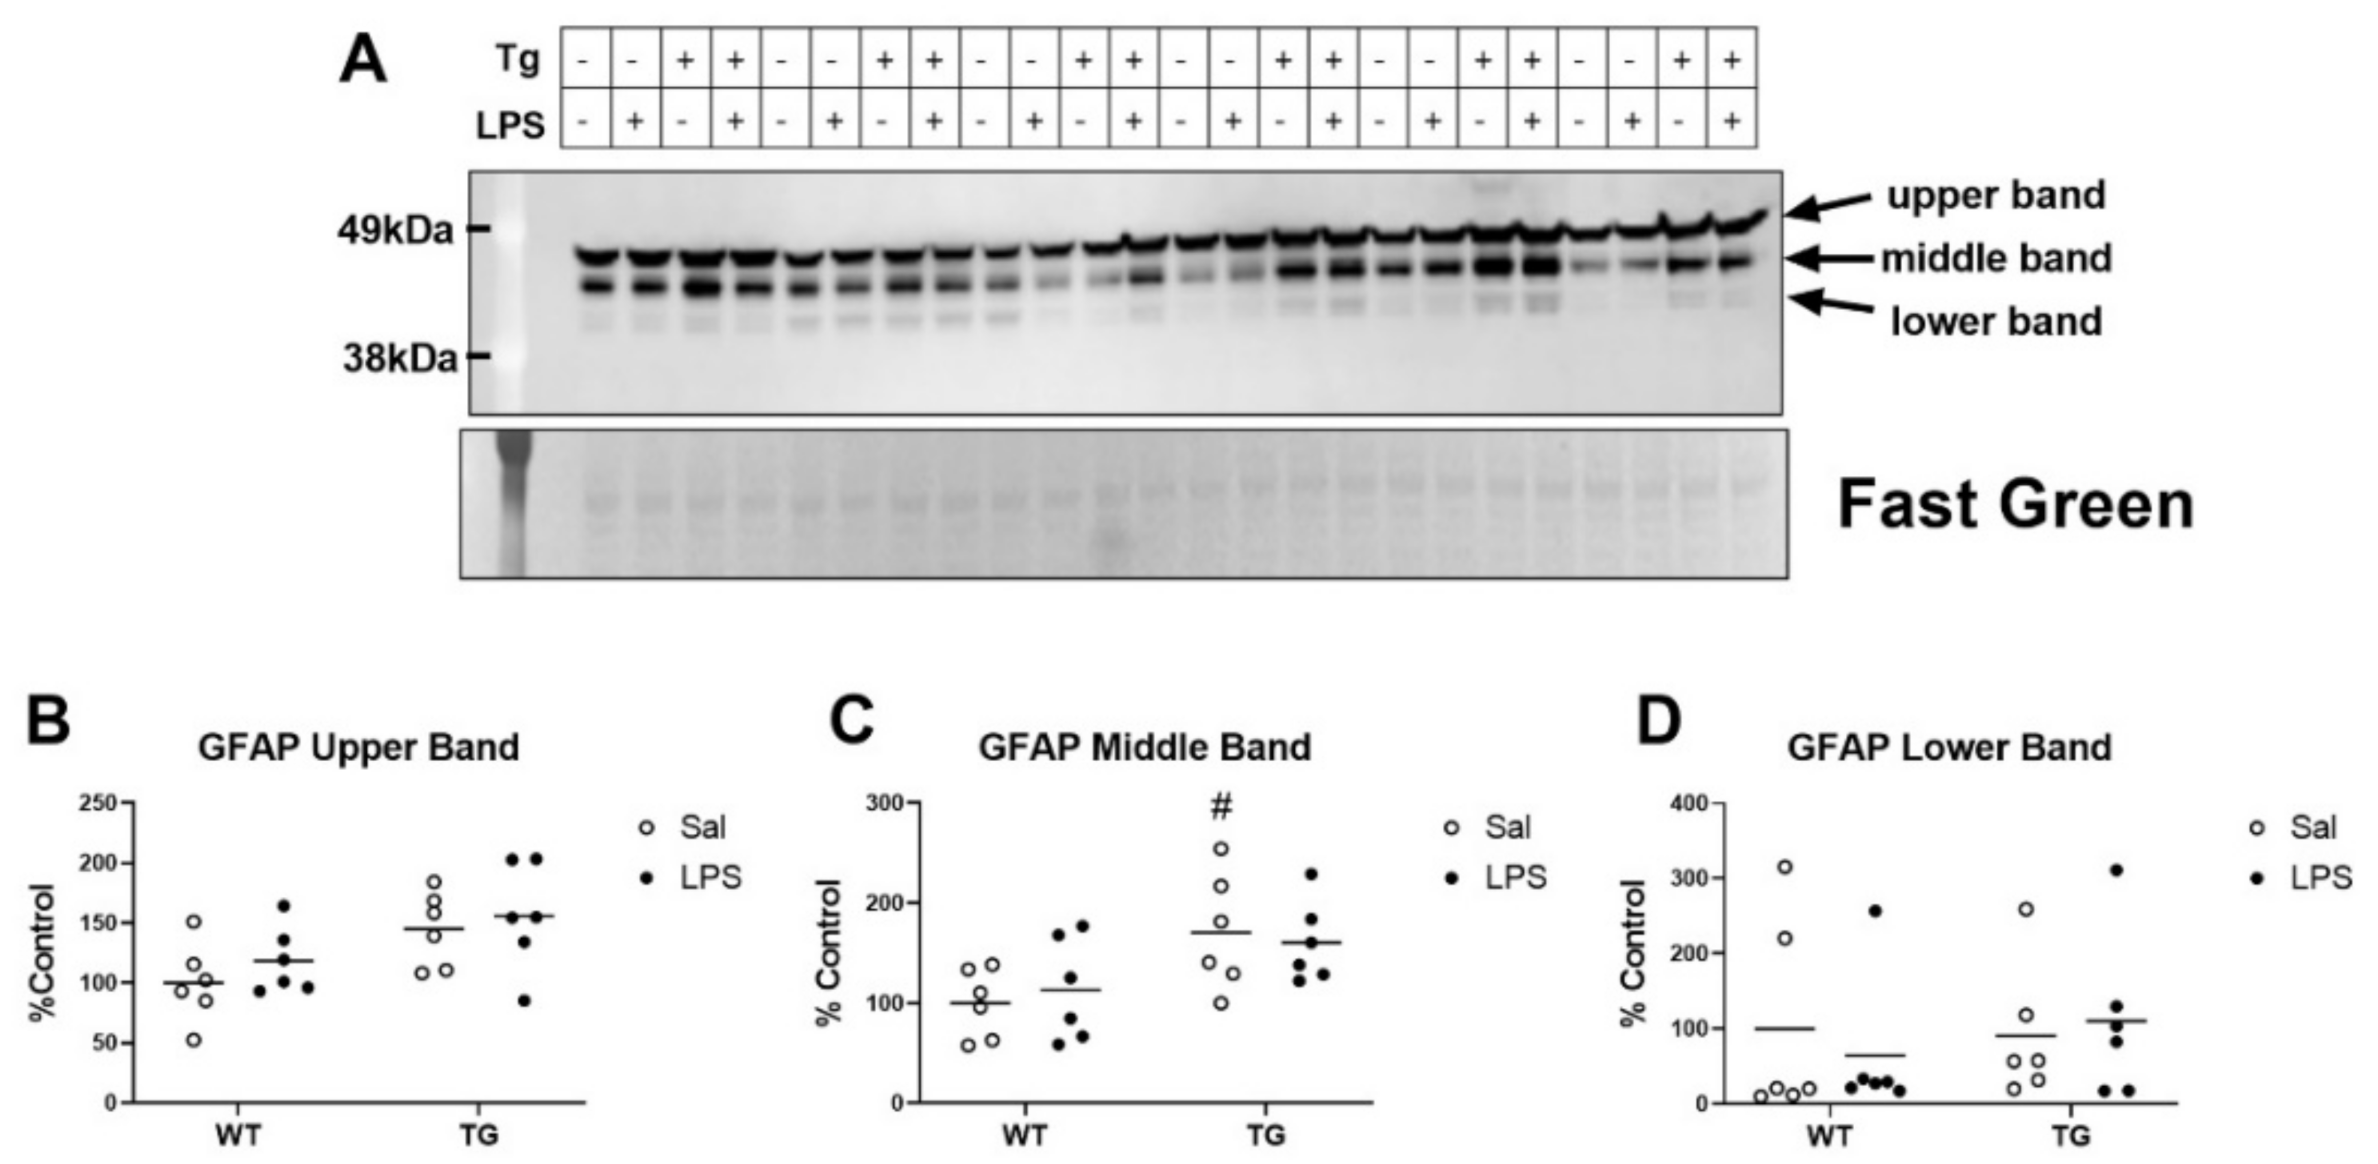
2.5. Effects of LPS on a Marker of Gliosis
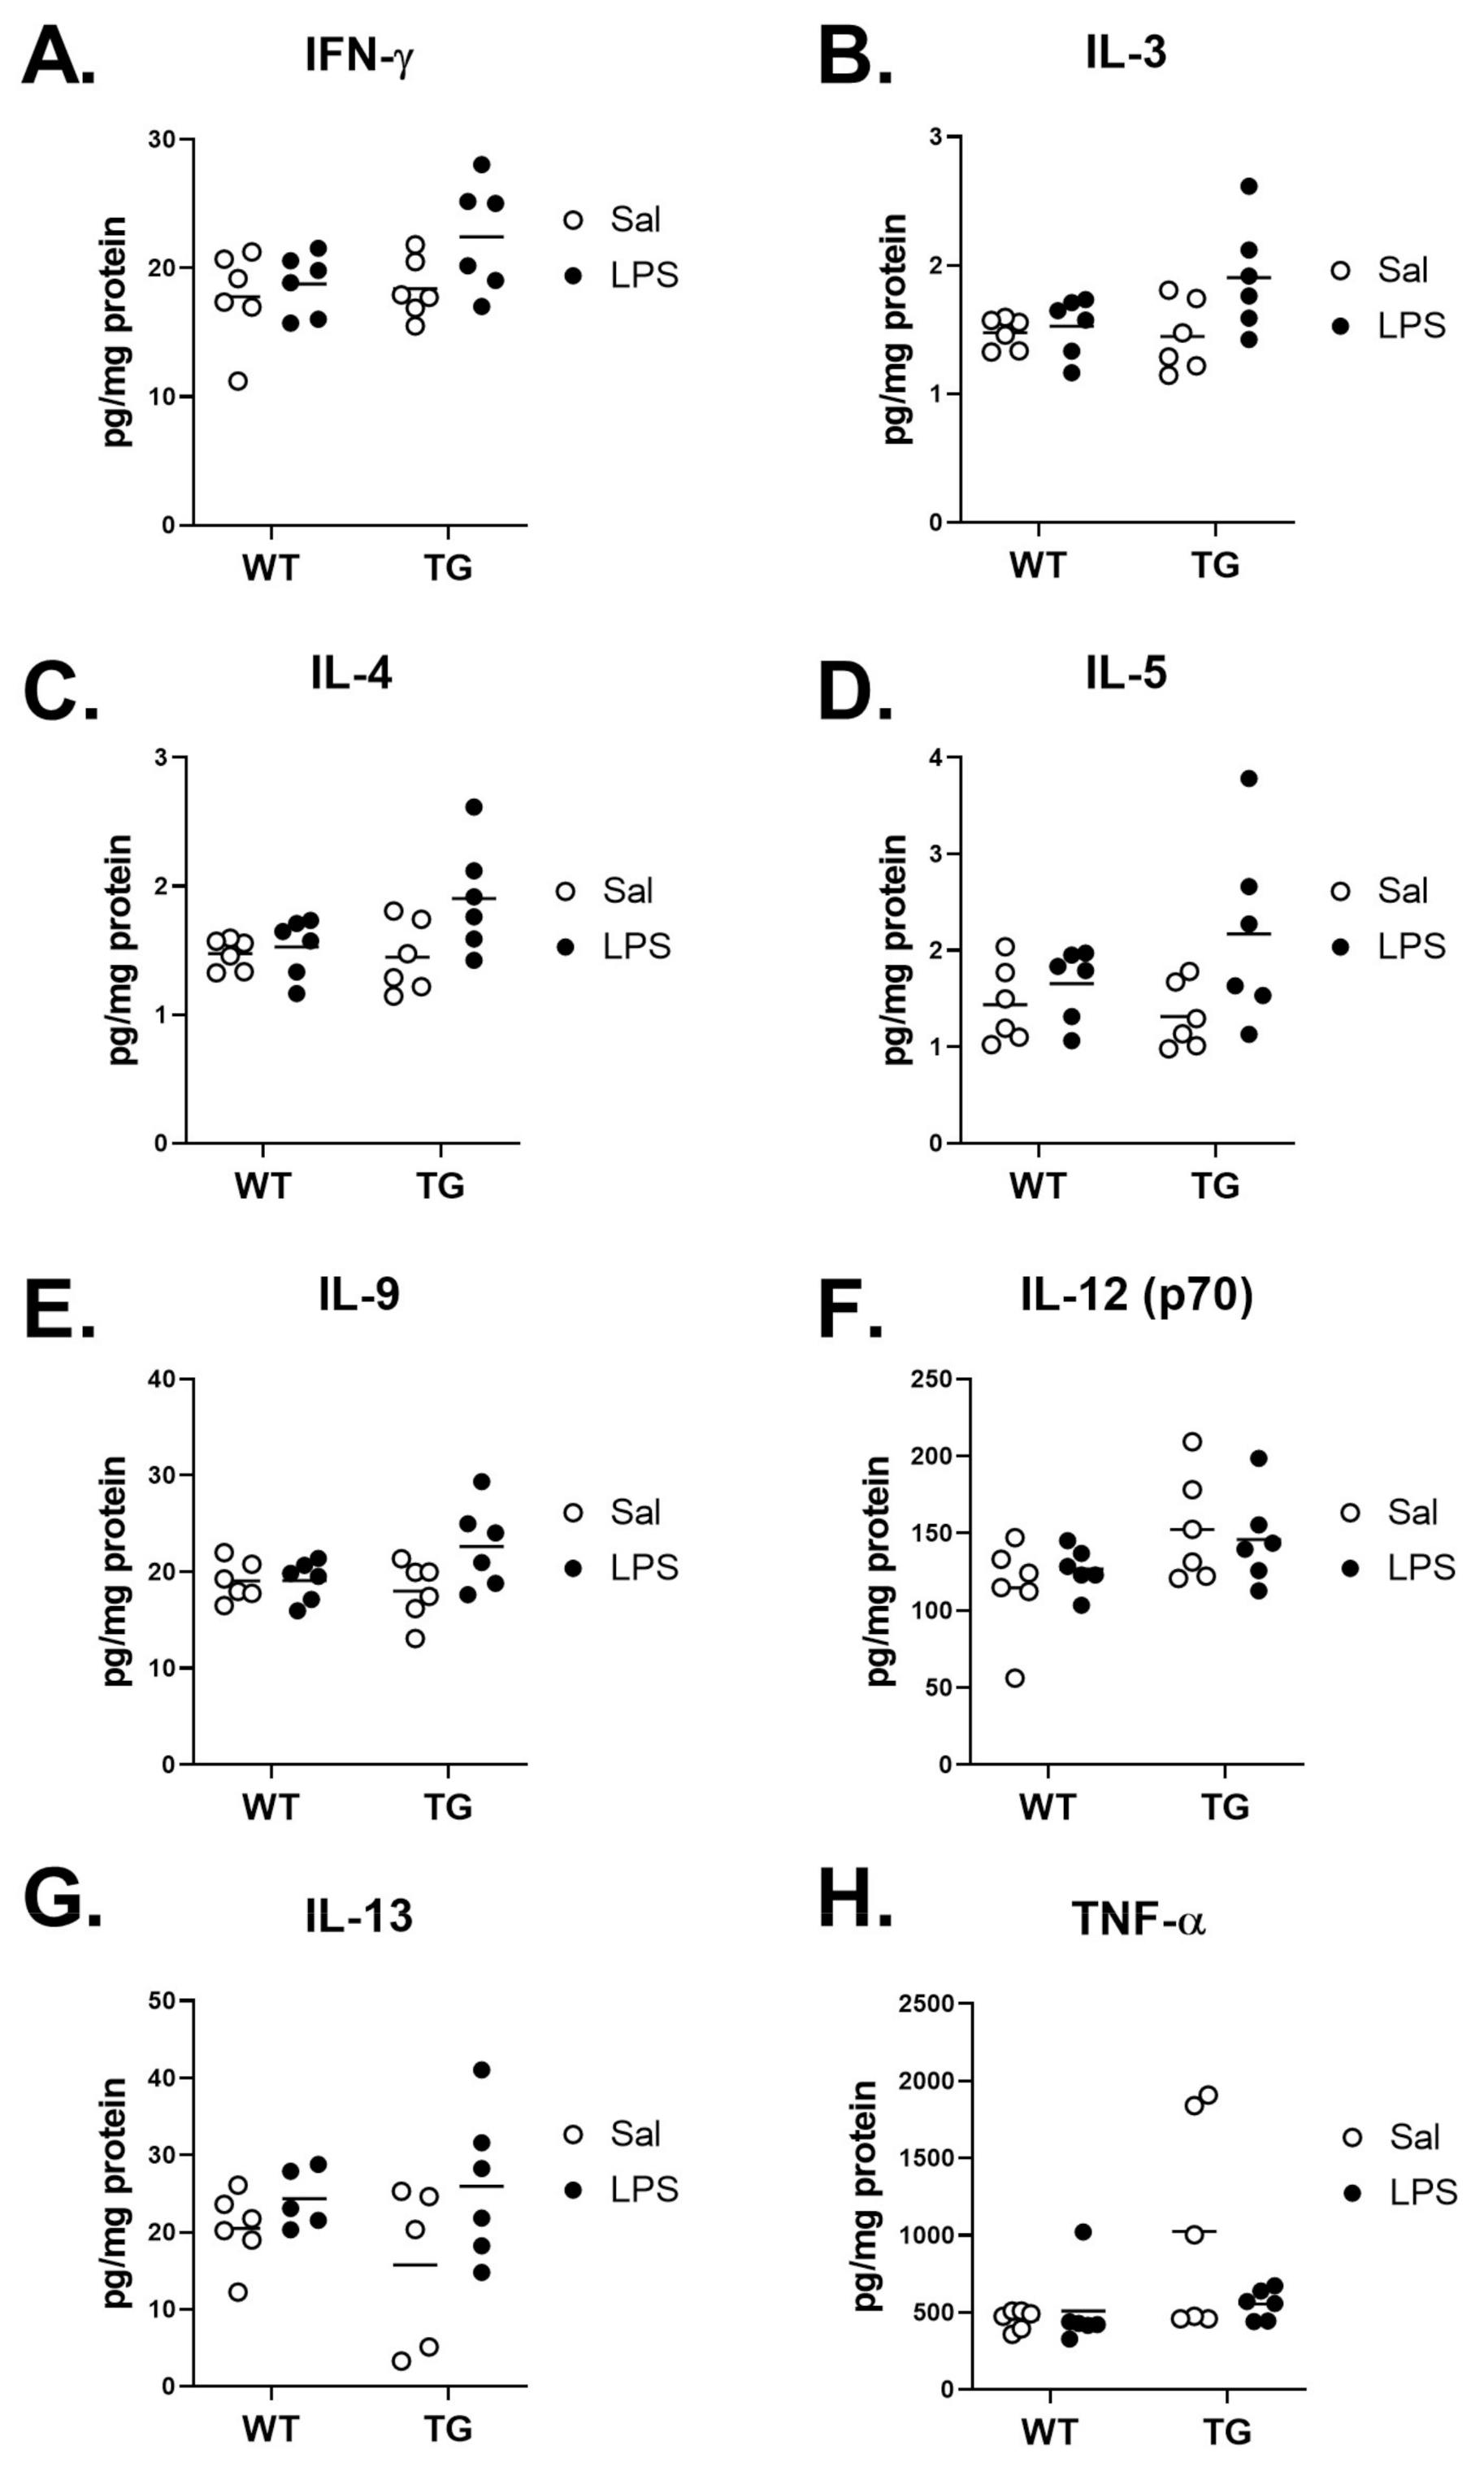
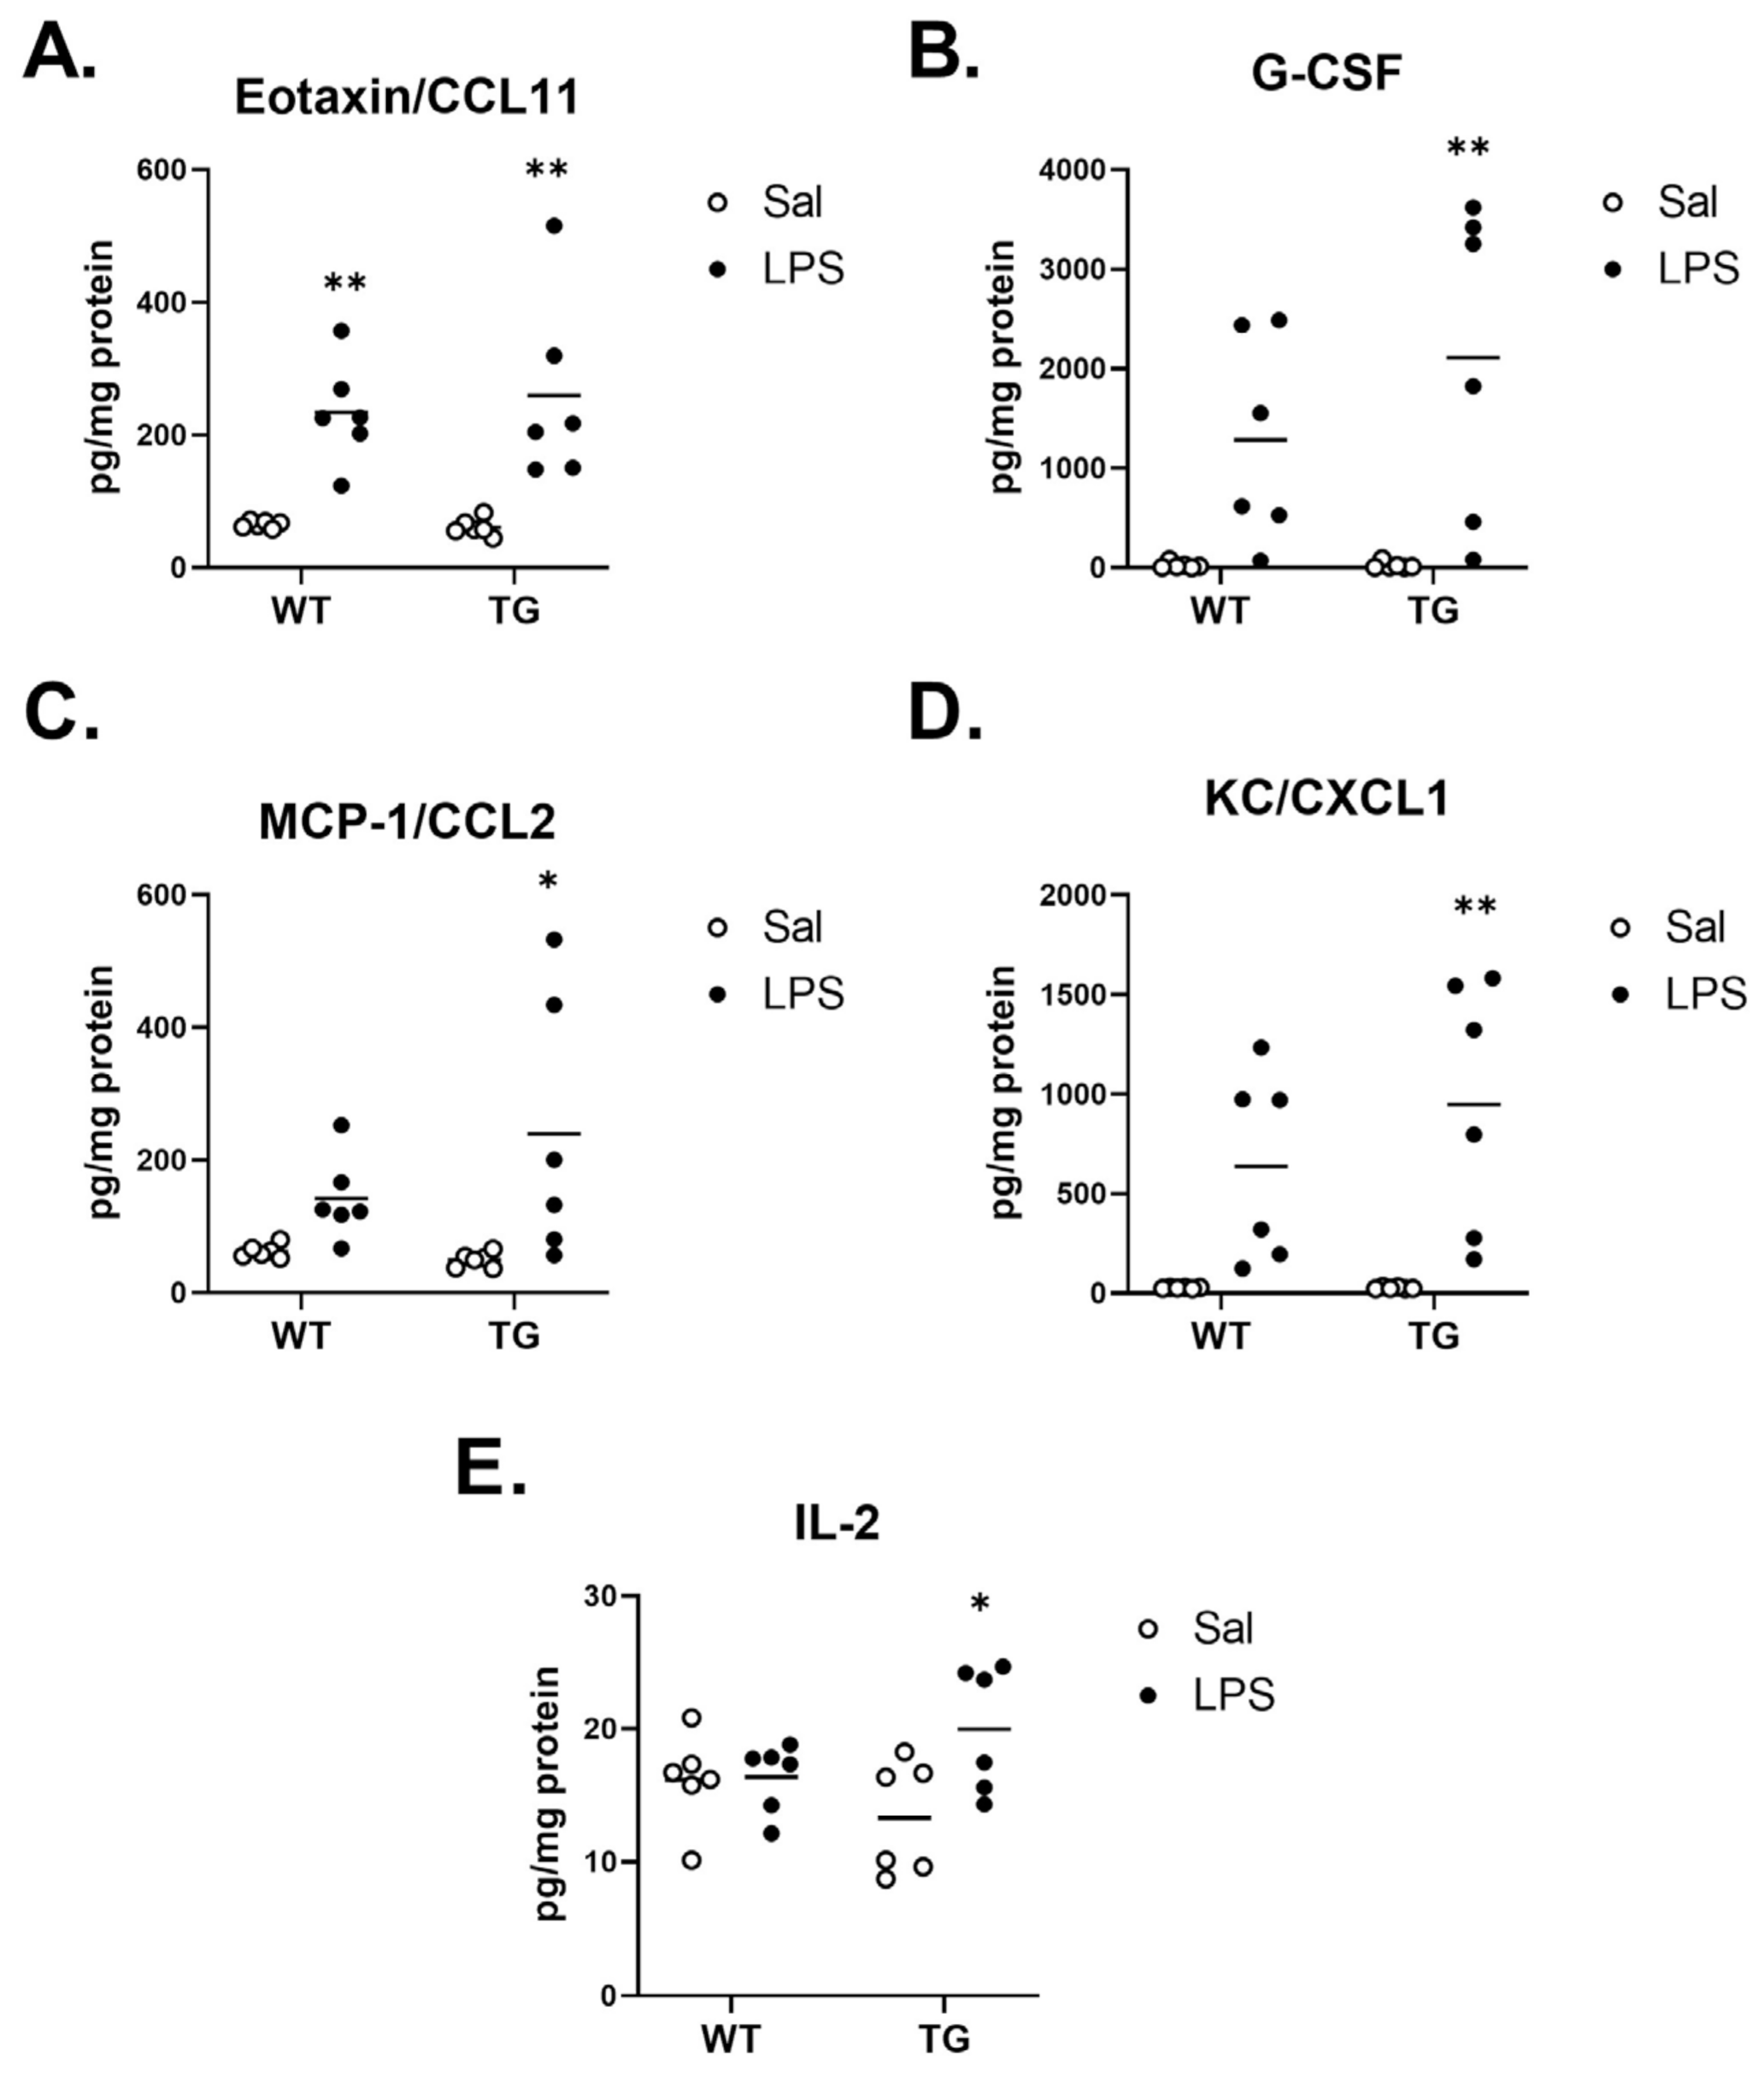
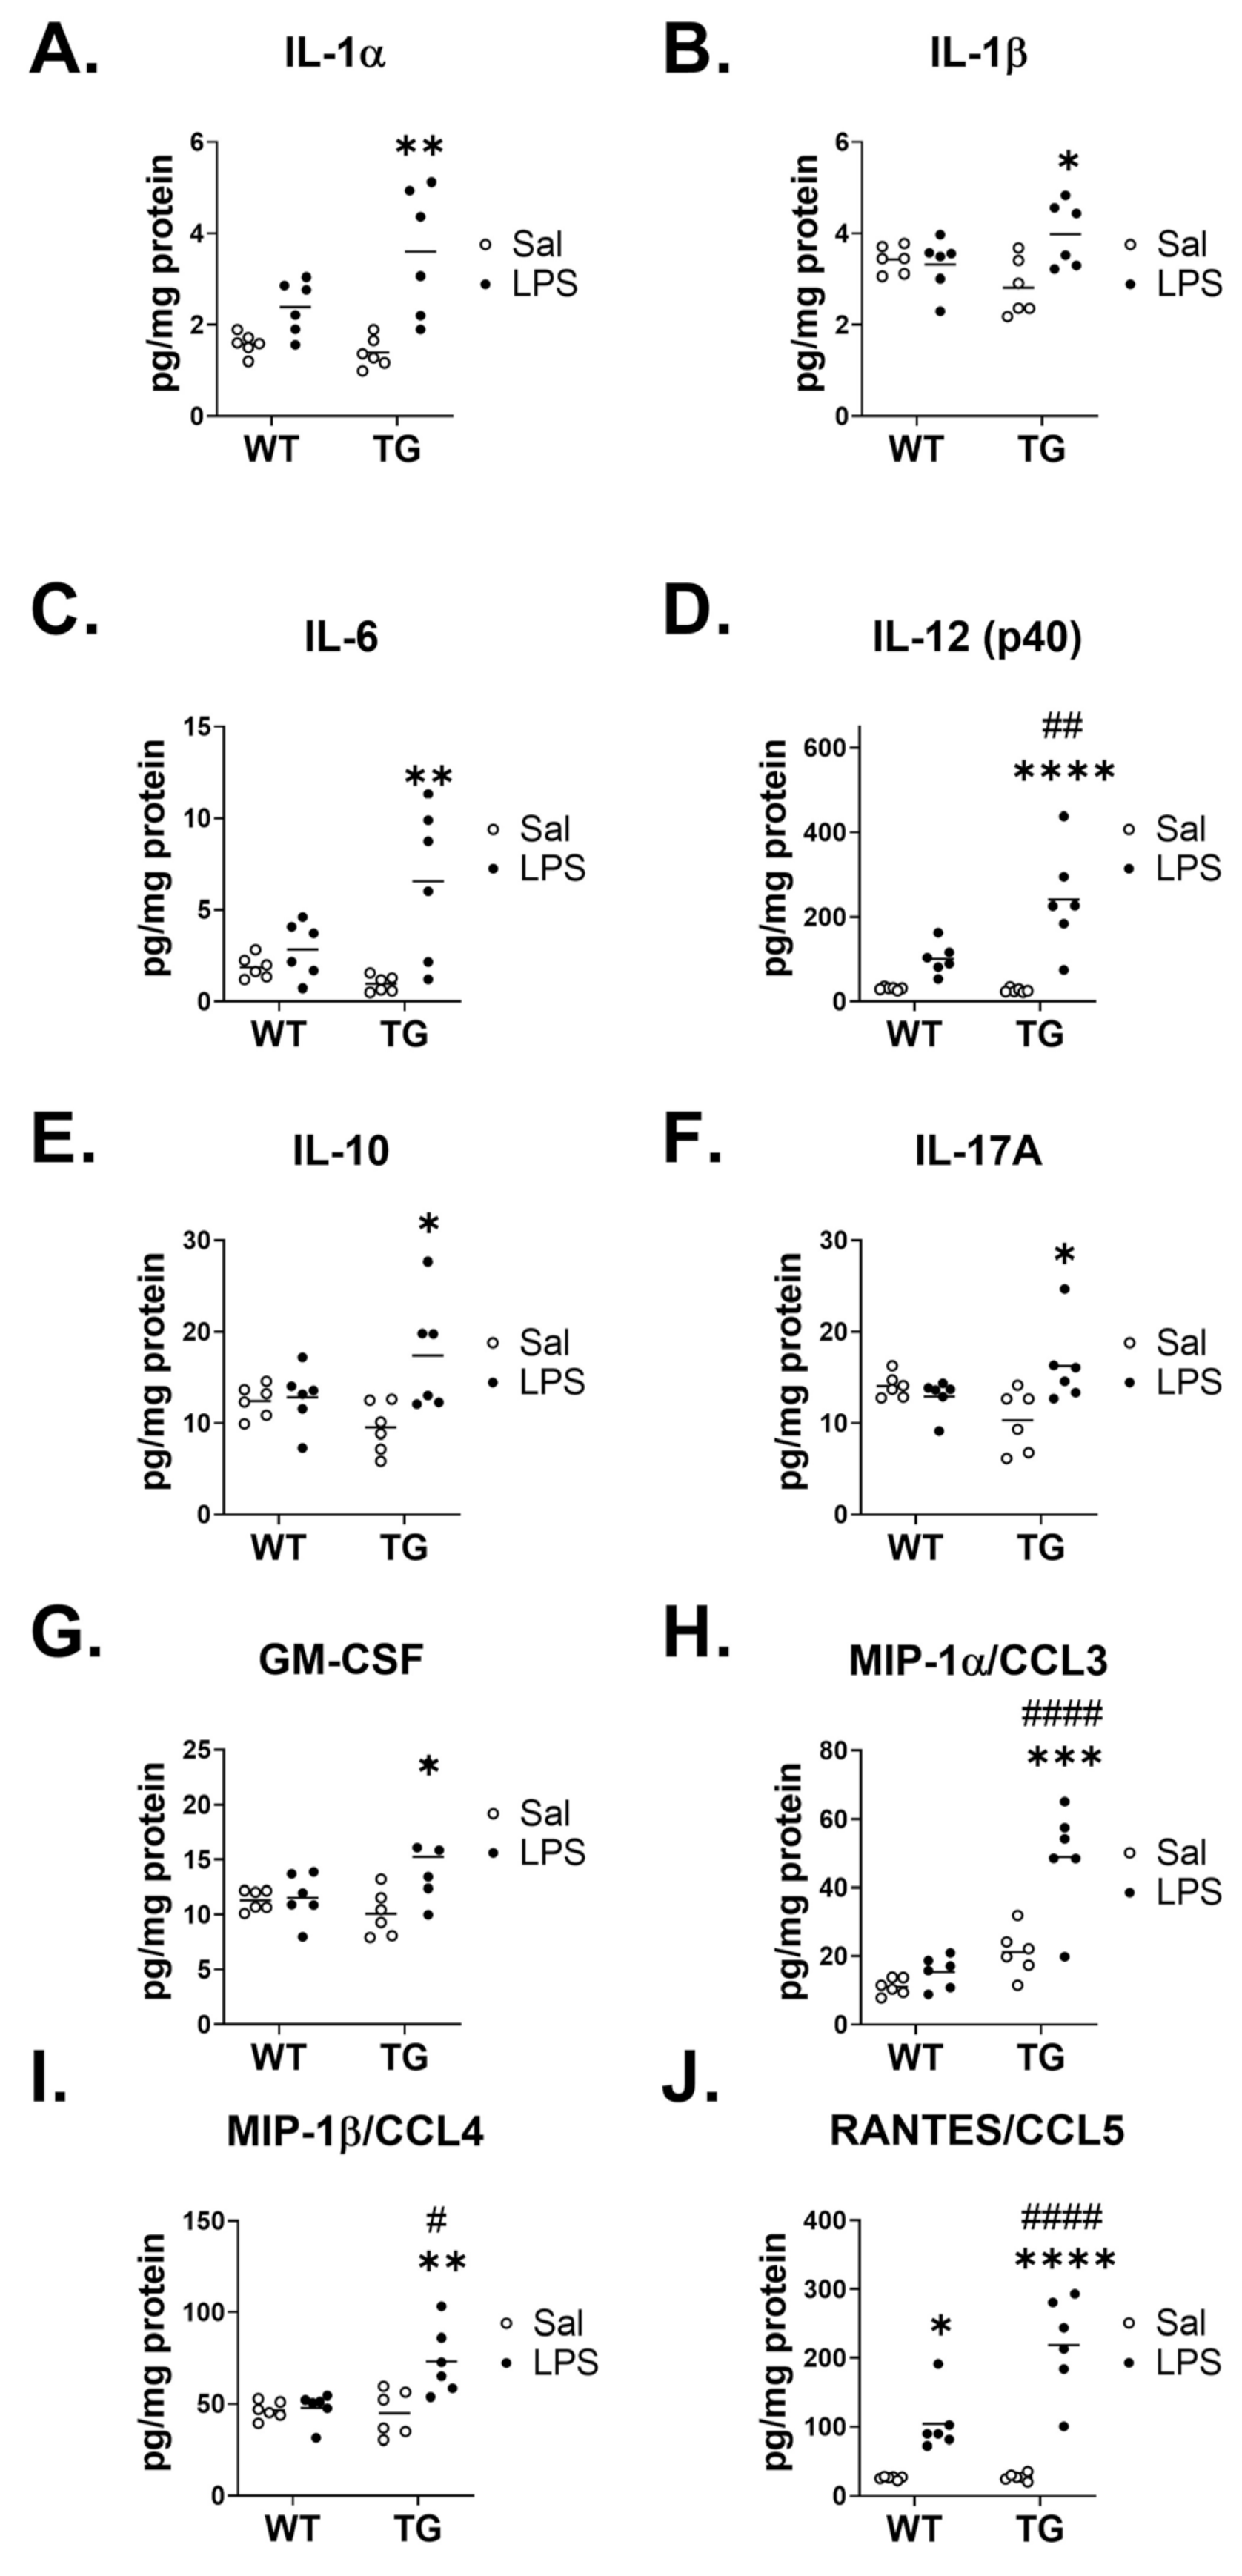
2.6. Effect of LPS on Inflammatory Brain Cytokine Levels
3. Discussion
4. Materials and Methods
4.1. Mice
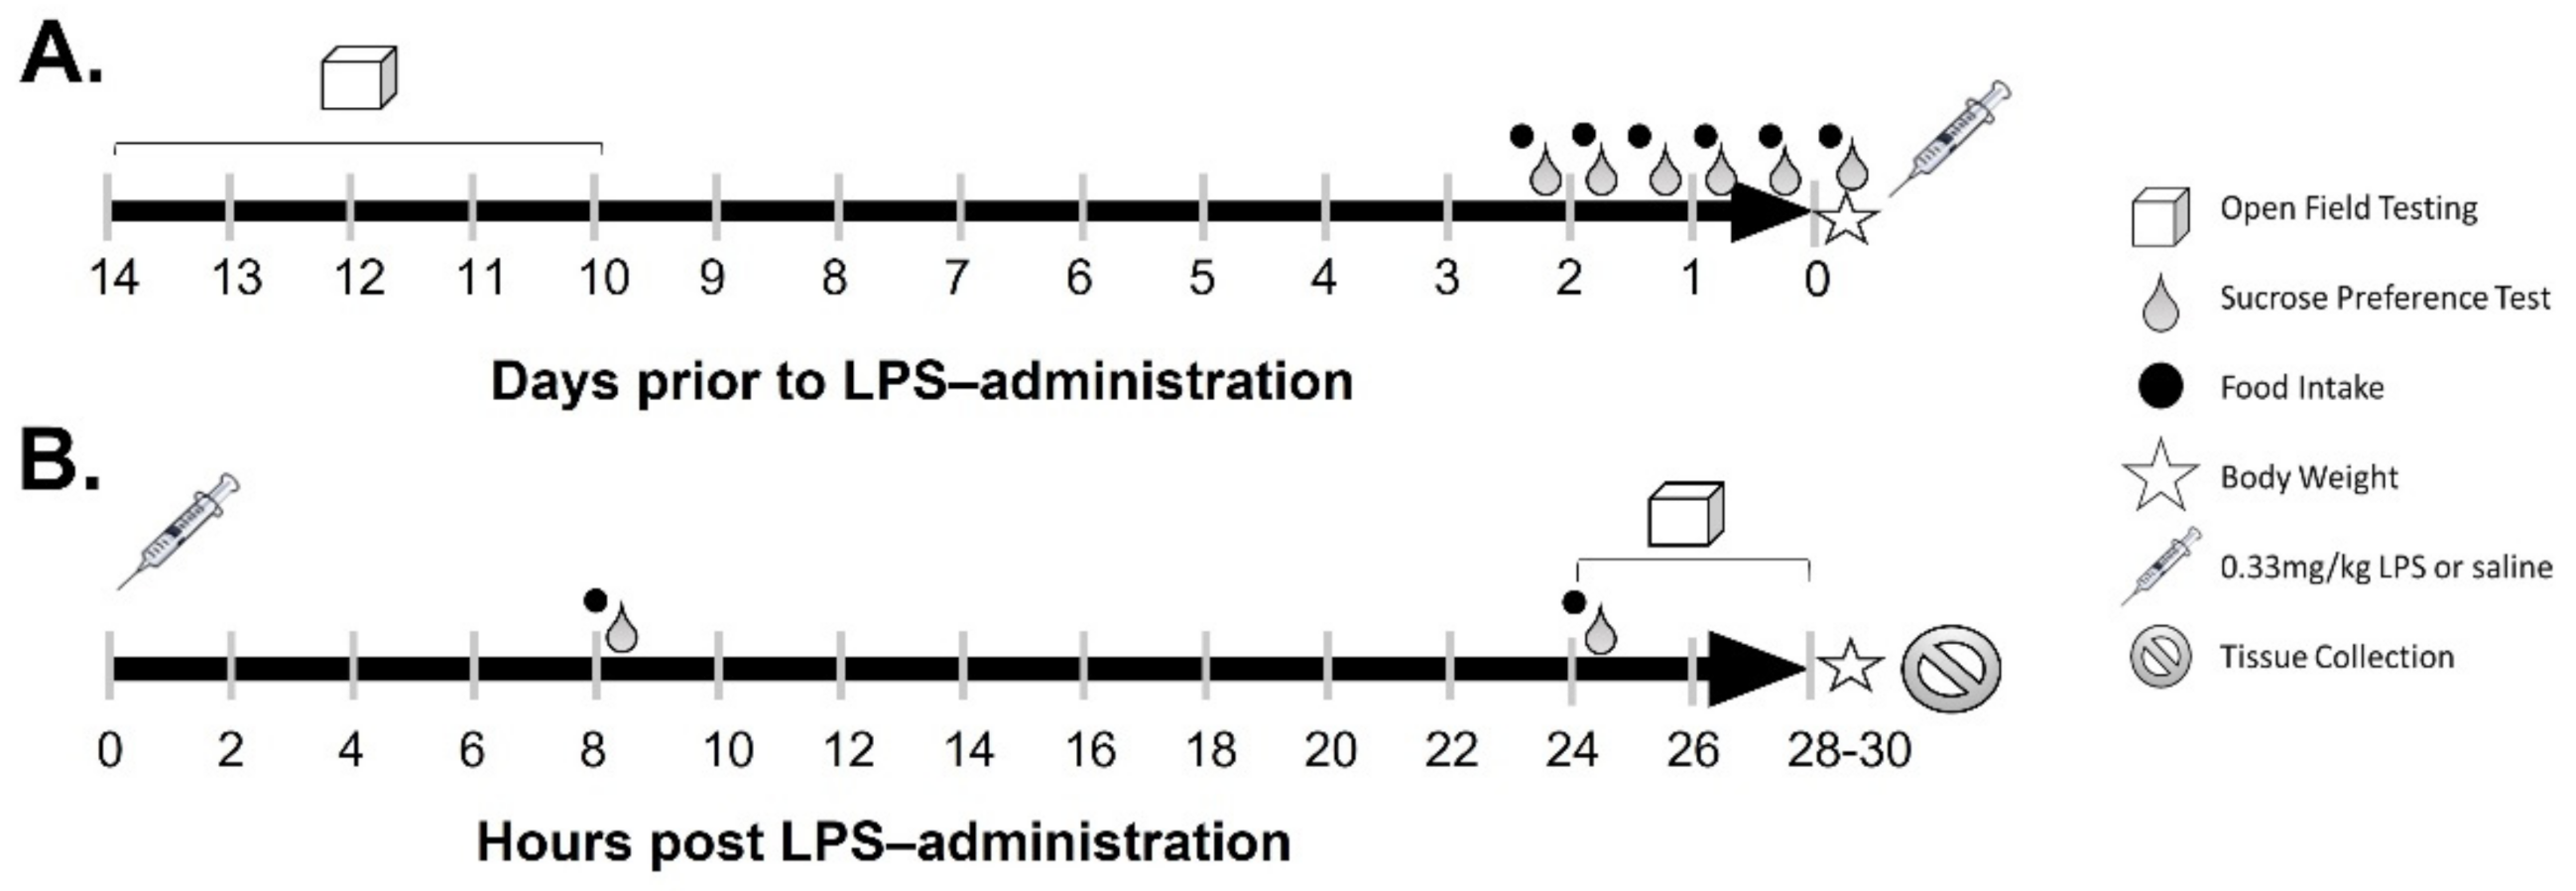
4.2. LPS Treatments
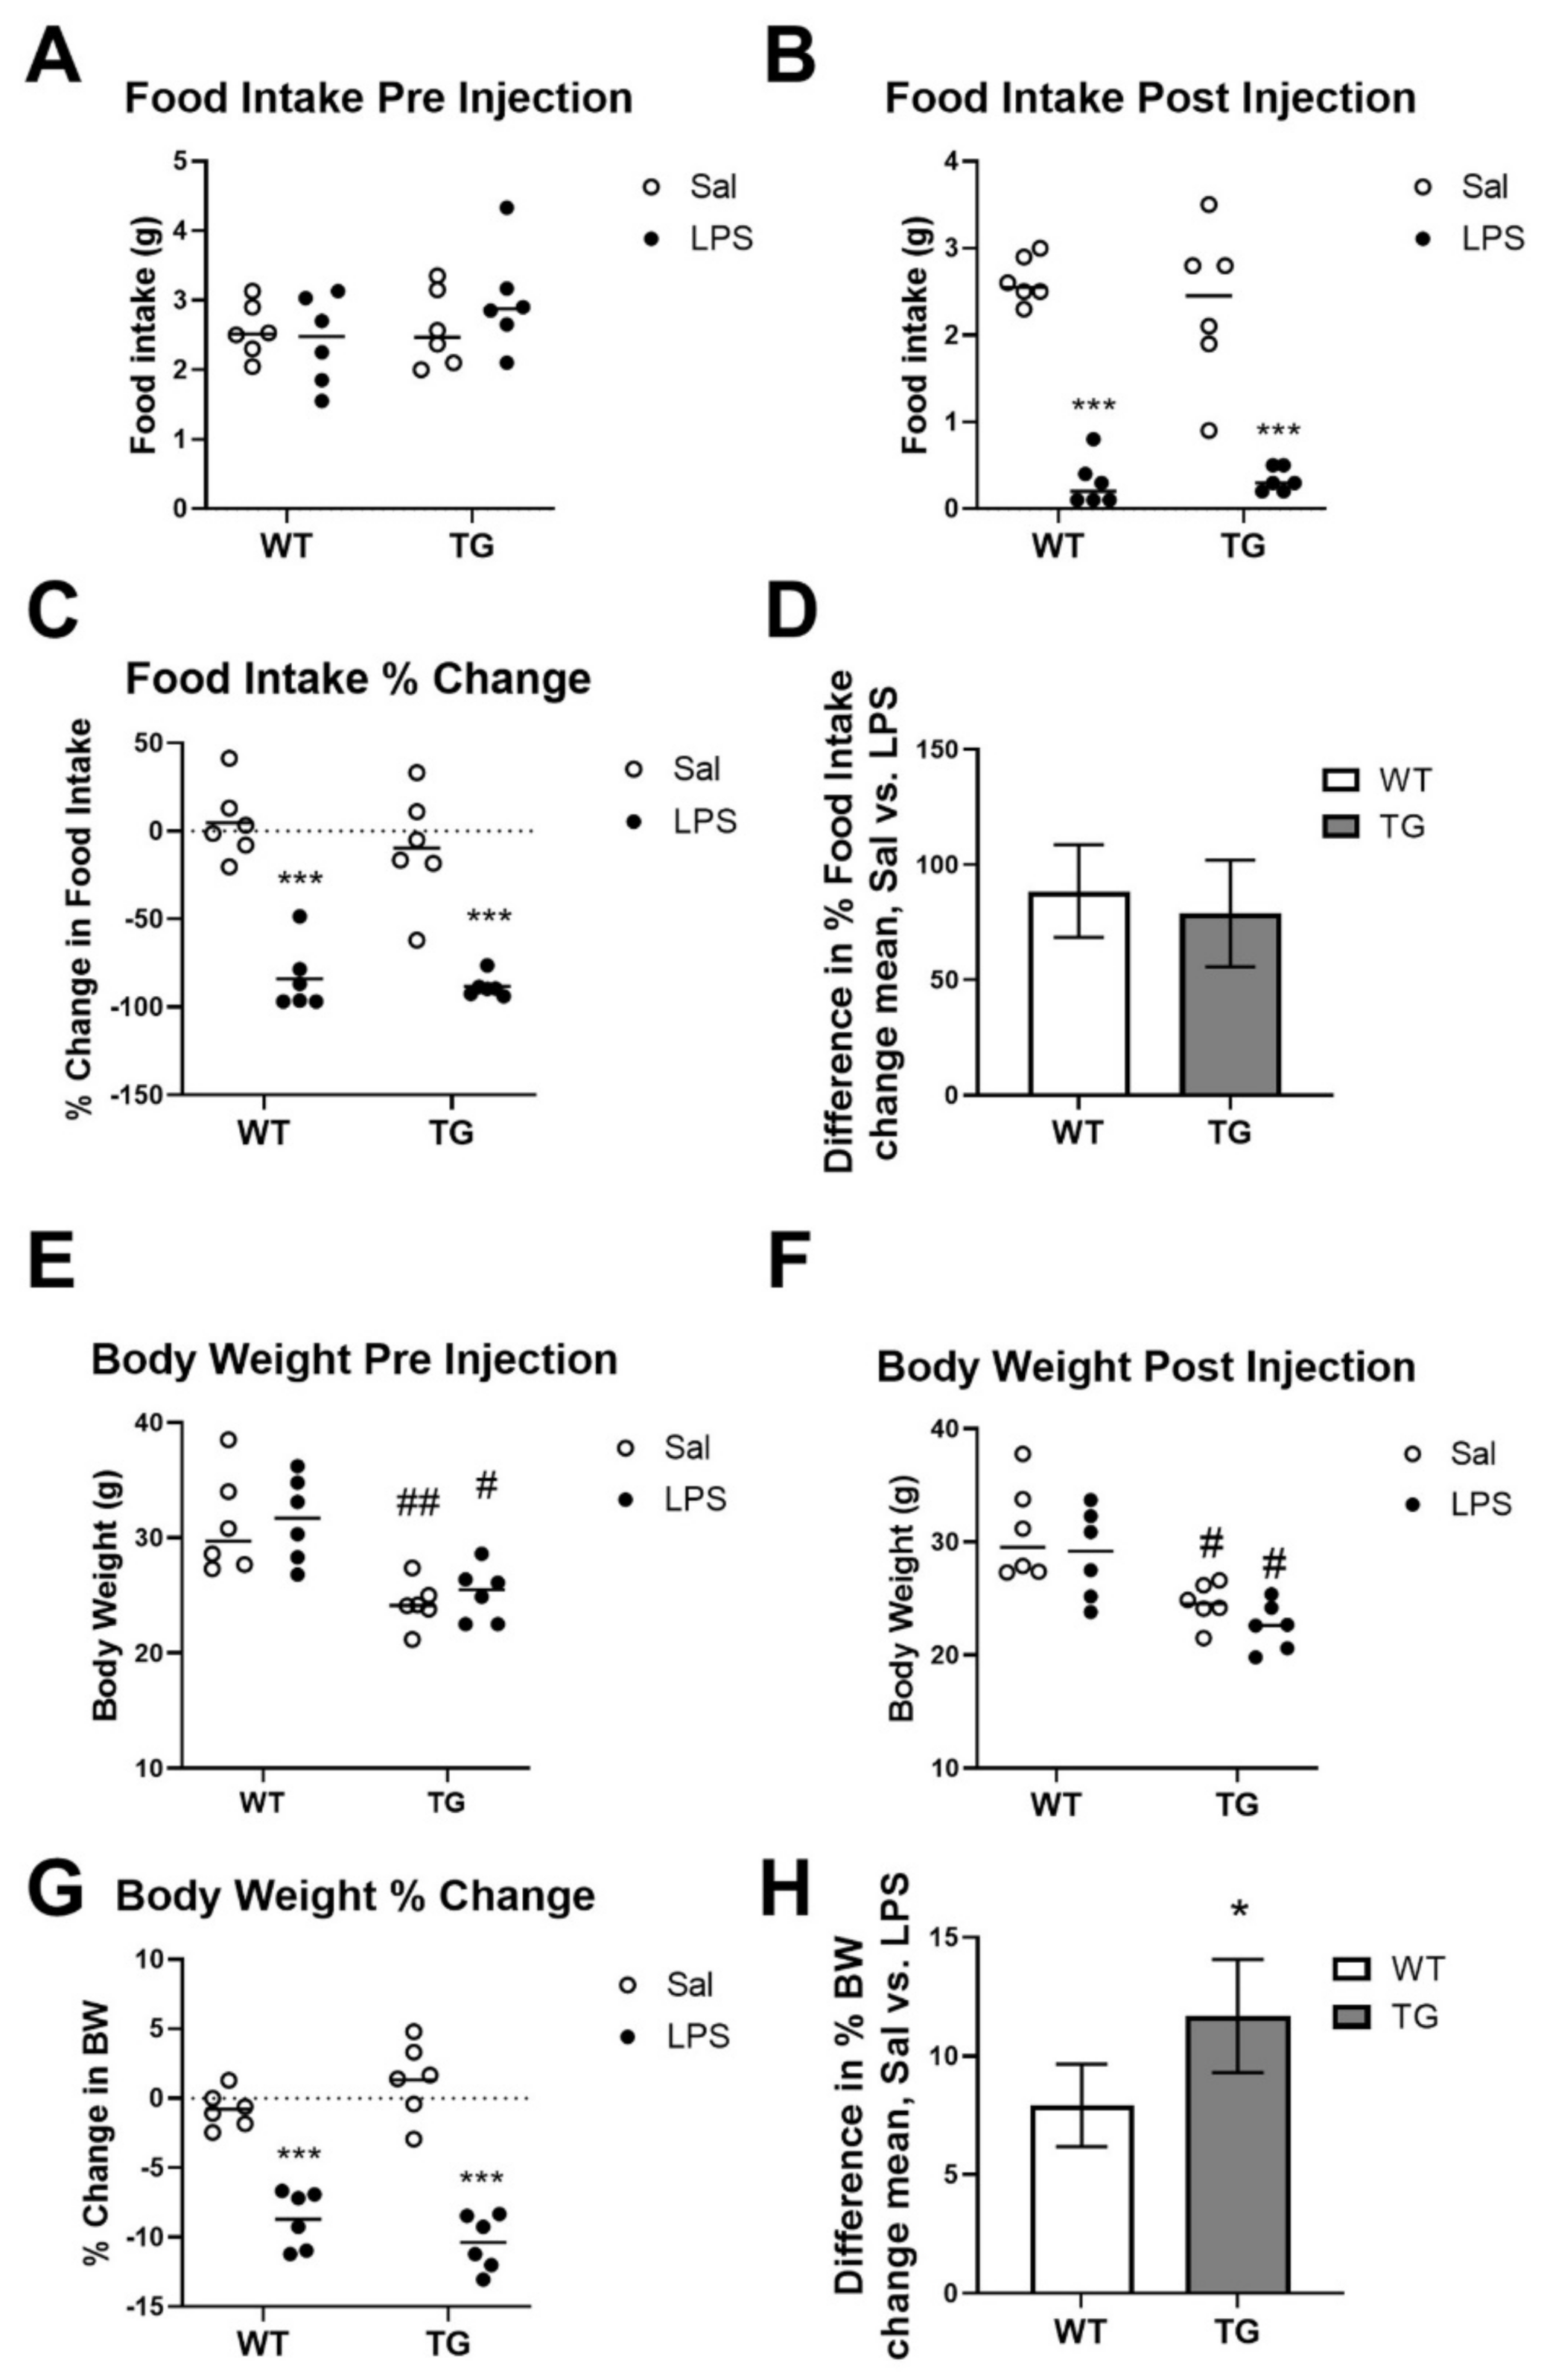
4.3. Calculation of Food Intake and Body Weight
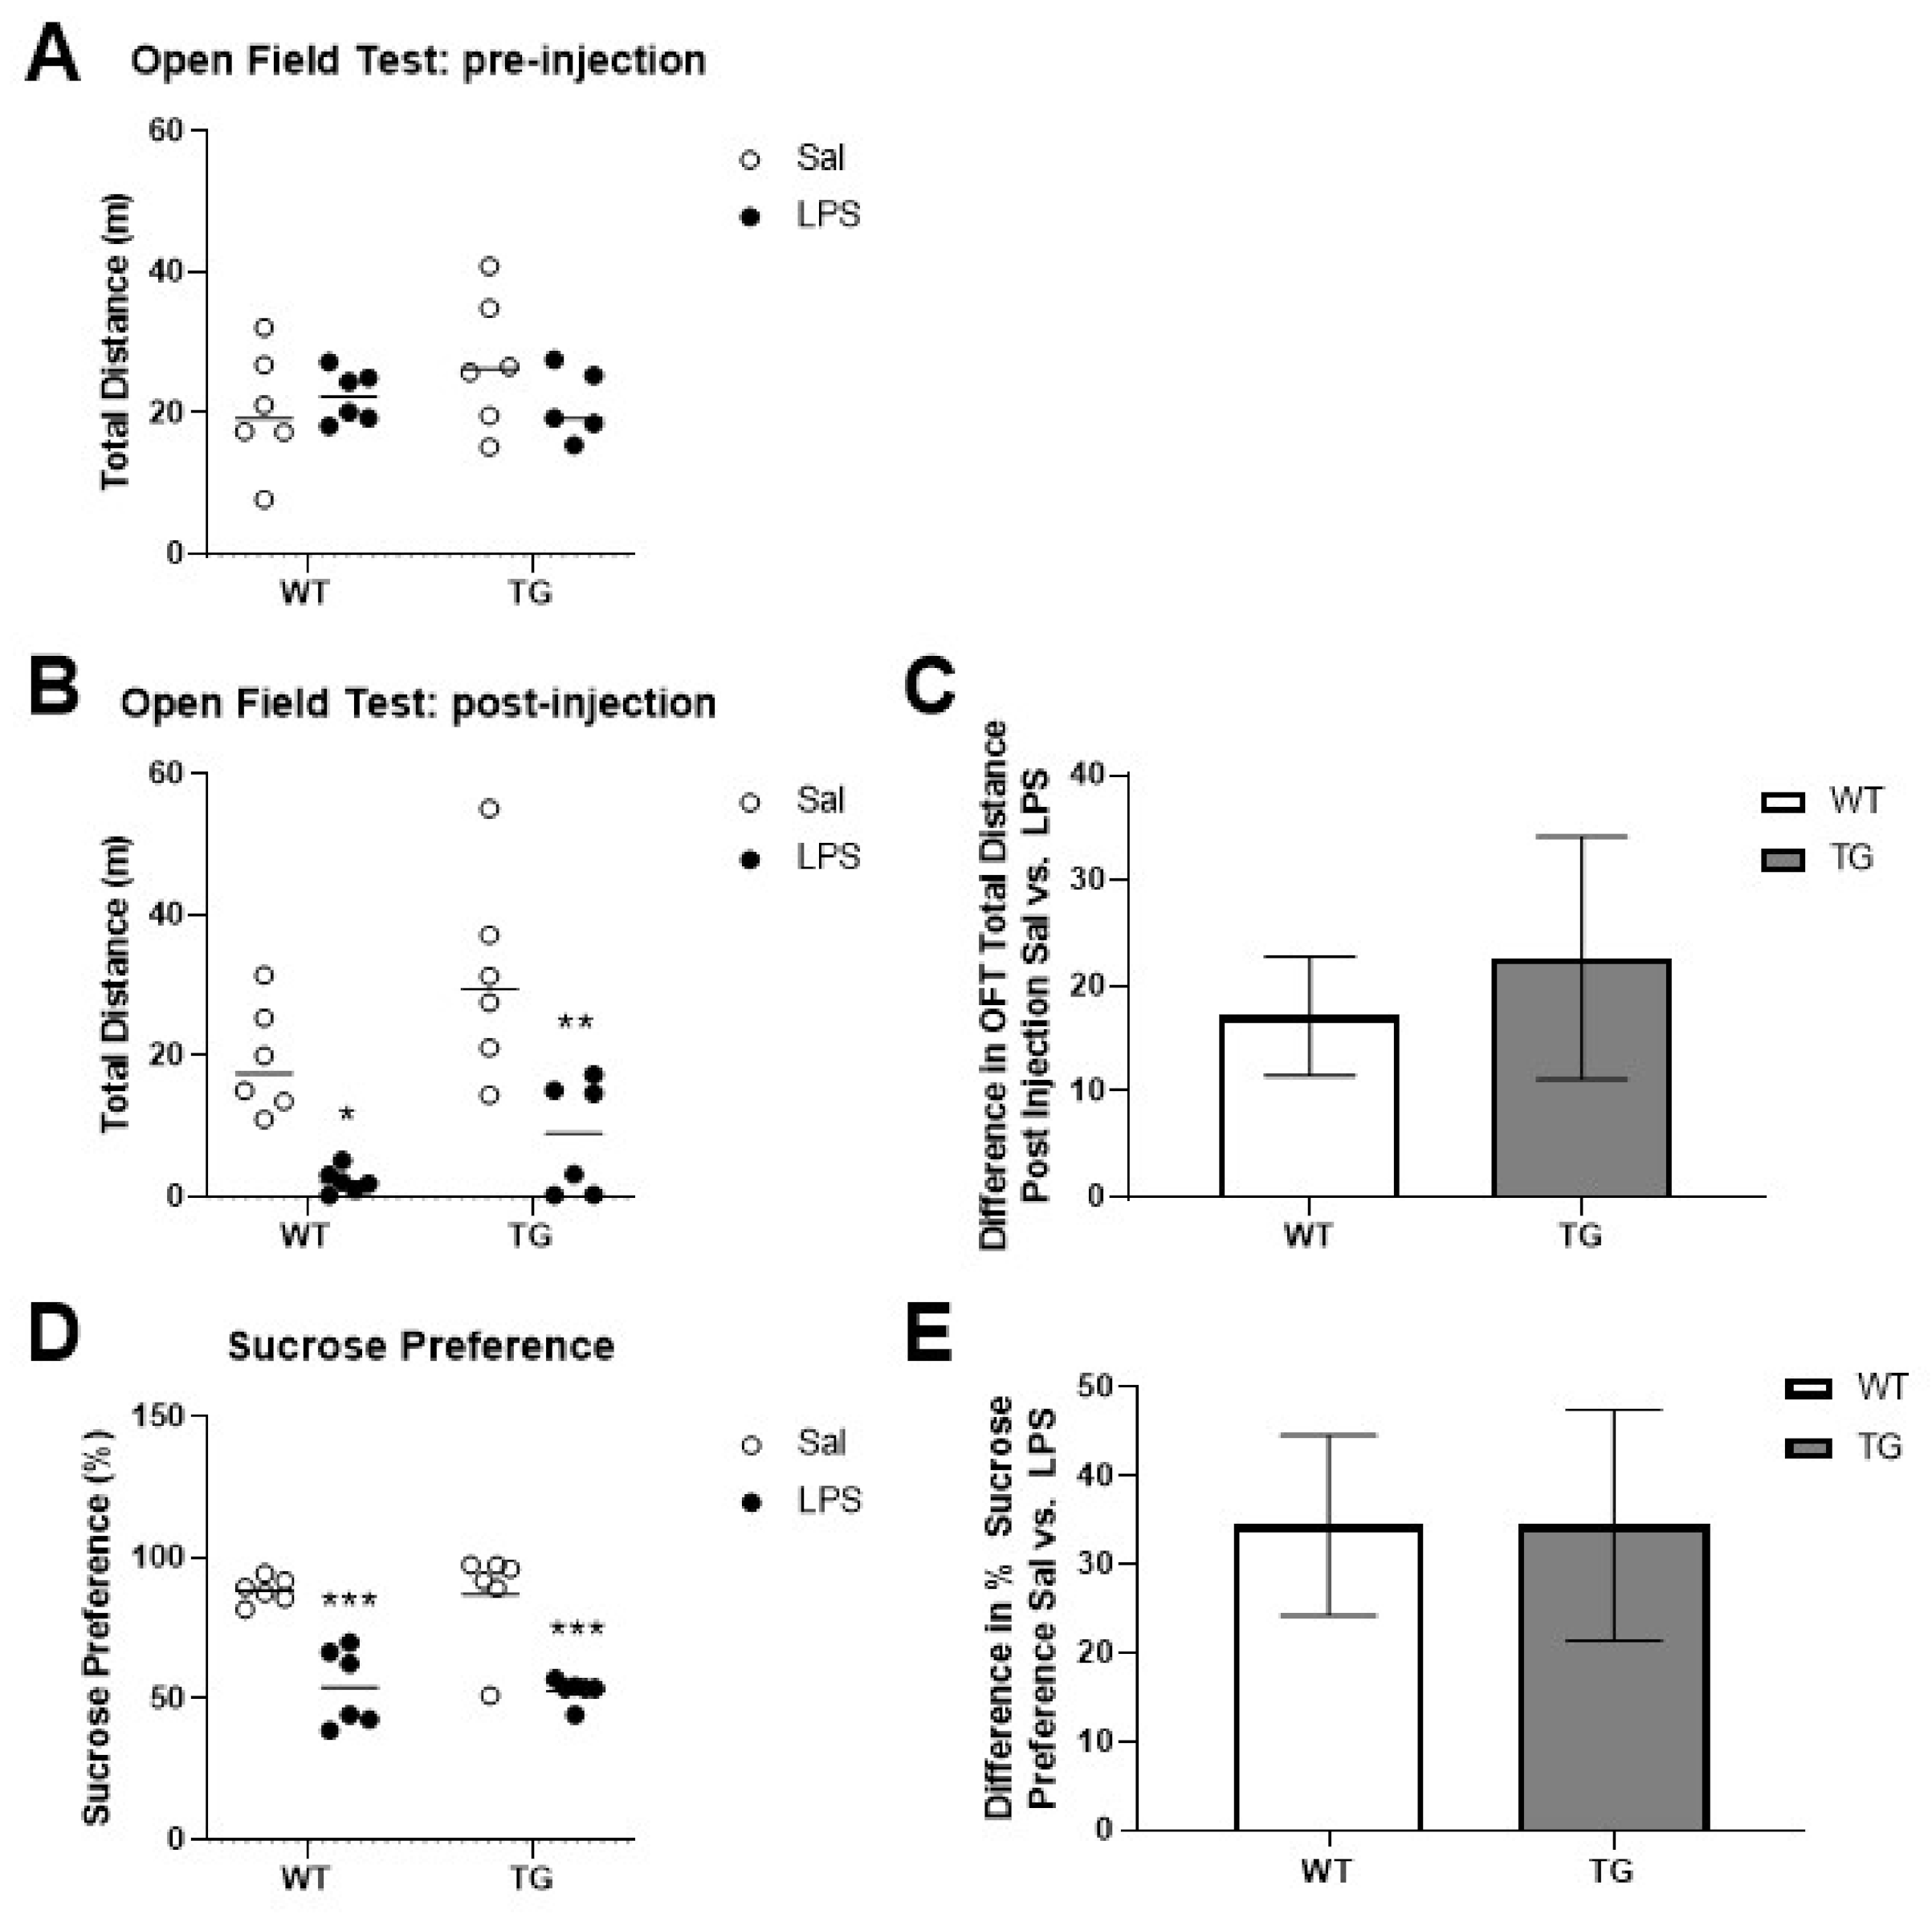
4.4. Open Field Testing
4.5. Sucrose Preference Testing
4.6. Labeling of Albumin with 99mTc-Pertechnetate
4.7. Evaluation of Blood-Brain Barrier Disruption
4.8. Protein Extractions from Brain
4.9. SAA ELISAs on Serum and Brain
4.10. Aβ ELISAs on Brain
4.11. Western Blotting
4.12. Cytokine Assay
4.13. Statistics
Supplementary Materials
Author Contributions
Funding
Institutional Review Board Statement
Informed Consent Statement
Data Availability Statement
Conflicts of Interest
References
- Jack, C.R., Jr.; Bennett, D.A.; Blennow, K.; Carrillo, M.C.; Dunn, B.; Haeberlein, S.B.; Holtzman, D.M.; Jagust, W.; Jessen, F.; Karlawish, J.; et al. Contributors, NIA-AA Research Framework: Toward a biological definition of Alzheimer’s disease. Alzheimers Dement. 2018, 14, 535–562. [Google Scholar] [CrossRef] [PubMed]
- Kinney, J.W.; Bemiller, S.M.; Murtishaw, A.S.; Leisgang, A.M.; Salazar, A.M.; Lamb, B.T. Inflammation as a central mechanism in Alzheimer’s disease. Alzheimers Dement. 2018, 4, 575–590. [Google Scholar] [CrossRef] [PubMed]
- Perez-Nievas, B.G.; Serrano-Pozo, A. Deciphering the Astrocyte Reaction in Alzheimer’s Disease. Front. Aging Neurosci. 2018, 10, 114. [Google Scholar] [CrossRef] [PubMed] [Green Version]
- Beach, T.G.; Walker, R.; McGeer, E.G. Patterns of gliosis in Alzheimer’s disease and aging cerebrum. Glia 1989, 2, 420–436. [Google Scholar] [CrossRef]
- Norden, D.M.; Godbout, J.P. Review: Microglia of the aged brain: Primed to be activated and resistant to regulation. Neuropathol. Appl. Neurobiol. 2013, 39, 19–34. [Google Scholar] [CrossRef]
- Perry, V.H.; Holmes, C. Microglial priming in neurodegenerative disease. Nat. Rev. Neurol. 2014, 10, 217–224. [Google Scholar] [CrossRef]
- Morgan, A.R.; Touchard, S.; Leckey, C.; O’Hagan, C.; Nevado-Holgado, A.J.; Consortium, N.; Barkhof, F.; Bertram, L.; Blin, O.; Bos, I.; et al. Inflammatory biomarkers in Alzhei.imer’s disease plasma. Alzheimers Dement. 2019, 15, 776–787. [Google Scholar] [CrossRef]
- Tanaka, T.; Biancotto, A.; Moaddel, R.; Moore, A.Z.; Gonzalez-Freire, M.; Aon, M.A.; Candia, J.; Zhang, P.; Cheung, F.; Fantoni, G.; et al. Plasma proteomic signature of age in healthy humans. Aging Cell 2018, 17, e12799. [Google Scholar] [CrossRef] [Green Version]
- Perry, V.H. The influence of systemic inflammation on inflammation in the brain: Implications for chronic neurodegenerative disease. Brain Behav. Immun. 2004, 18, 407–413. [Google Scholar] [CrossRef]
- Banks, W.A.; Robinson, S.M. Minimal penetration of lipopolysaccharide across the murine blood-brain barrier. Brain Behav. Immun. 2010, 24, 102–109. [Google Scholar] [CrossRef] [Green Version]
- Erickson, M.A.; Banks, W.A. Neuroimmune Axes of the Blood-Brain Barriers and Blood-Brain Interfaces: Bases for Physiological Regulation, Disease States, and Pharmacological Interventions. Pharmacol. Rev. 2018, 70, 278–314. [Google Scholar] [CrossRef] [PubMed]
- Laye, S.; Bluthe, R.M.; Kent, S.; Combe, C.; Medina, C.; Parnet, P.; Kelley, K.; Dantzer, R. Subdiaphragmatic vagotomy blocks induction of IL-1 beta mRNA in mice brain in response to peripheral LPS. Am. J. Physiol. 1995, 268 Pt 2, R1327–R1331. [Google Scholar] [CrossRef]
- Chakravarty, S.; Herkenham, M. Toll-like receptor 4 on nonhematopoietic cells sustains CNS inflammation during endotoxemia, independent of systemic cytokines. J. Neurosci. 2005, 25, 1788–1796. [Google Scholar] [CrossRef] [PubMed] [Green Version]
- Lasselin, J.; Schedlowski, M.; Karshikoff, B.; Engler, H.; Lekander, M.; Konsman, J.P. Comparison of bacterial lipopolysaccharide-induced sickness behavior in rodents and humans: Relevance for symptoms of anxiety and depression. Neurosci. Biobehav. Rev. 2020, 115, 15–24. [Google Scholar] [CrossRef] [PubMed]
- Copeland, S.; Warren, H.S.; Lowry, S.F.; Calvano, S.E.; Remick, D.; the Inflammation and the Host Response to Injury Investigators. Acute inflammatory response to endotoxin in mice and humans. Clin. Diagn. Lab. Immunol. 2005, 12, 60–67. [Google Scholar] [CrossRef] [PubMed] [Green Version]
- Maes, M.; Berk, M.; Goehler, L.; Song, C.; Anderson, G.; Galecki, P.; Leonard, B. Depression and sickness behavior are Janus-faced responses to shared inflammatory pathways. BMC Med. 2012, 10, 66. [Google Scholar] [CrossRef] [PubMed] [Green Version]
- Perry, V.H.; Cunningham, C.; Holmes, C. Systemic infections and inflammation affect chronic neurodegeneration. Nat. Rev. Immunol. 2007, 7, 161–167. [Google Scholar] [CrossRef] [PubMed]
- Dantzer, R.; Kelley, K.W. Twenty years of research on cytokine-induced sickness behavior. Brain Behav. Immun. 2007, 21, 153–160. [Google Scholar] [CrossRef] [Green Version]
- Frenois, F.; Moreau, M.; O’Connor, J.; Lawson, M.; Micon, C.; Lestage, J.; Kelley, K.W.; Dantzer, R.; Castanon, N. Lipopolysaccharide induces delayed FosB/DeltaFosB immunostaining within the mouse extended amygdala, hippocampus and hypothalamus, that parallel the expression of depressive-like behavior. Psychoneuroendocrinology 2007, 32, 516–531. [Google Scholar] [CrossRef] [Green Version]
- O’Connor, J.C.; Lawson, M.A.; Andre, C.; Moreau, M.; Lestage, J.; Castanon, N.; Kelley, K.W.; Dantzer, R. Lipopolysaccharide-induced depressive-like behavior is mediated by indoleamine 2,3-dioxygenase activation in mice. Mol. Psychiatry 2009, 14, 511–522. [Google Scholar] [CrossRef] [Green Version]
- Godbout, J.P.; Chen, J.; Abraham, J.; Richwine, A.F.; Berg, B.M.; Kelley, K.W.; Johnson, R.W. Exaggerated neuroinflammation and sickness behavior in aged mice following activation of the peripheral innate immune system. FASEB J. 2005, 19, 1329–1331. [Google Scholar] [CrossRef]
- Godbout, J.P.; Moreau, M.; Lestage, J.; Chen, J.; Sparkman, N.L.; O’Connor, J.; Castanon, N.; Kelley, K.W.; Dantzer, R.; Johnson, R.W. Aging exacerbates depressive-like behavior in mice in response to activation of the peripheral innate immune system. Neuropsychopharmacology 2008, 33, 2341–2351. [Google Scholar] [CrossRef] [Green Version]
- Cunningham, C.; Campion, S.; Lunnon, K.; Murray, C.L.; Woods, J.F.; Deacon, R.M.; Rawlins, J.N.; Perry, V.H. Systemic inflammation induces acute behavioral and cognitive changes and accelerates neurodegenerative disease. Biol. Psychiatry 2009, 65, 304–312. [Google Scholar] [CrossRef] [Green Version]
- Jendresen, C.; Digre, A.; Cui, H.; Zhang, X.; Vlodavsky, I.; Li, J.P.; Nilsson, L.N.G. Systemic LPS-induced Abeta-solubilization and clearance in AbetaPP-transgenic mice is diminished by heparanase overexpression. Sci. Rep. 2019, 9, 4600. [Google Scholar] [CrossRef]
- Fu, C.; Chute, D.J.; Farag, E.S.; Garakian, J.; Cummings, J.L.; Vinters, H.V. Comorbidity in dementia: An autopsy study. Arch. Pathol. Lab. Med. 2004, 128, 32–38. [Google Scholar] [CrossRef]
- Manabe, T.; Fujikura, Y.; Mizukami, K.; Akatsu, H.; Kudo, K. Pneumonia-associated death in patients with dementia: A systematic review and meta-analysis. PLoS ONE 2019, 14, e0213825. [Google Scholar] [CrossRef] [Green Version]
- Janbek, J.; Taudorf, L.; Musaeus, C.S.; Frimodt-Moller, N.; Laursen, T.M.; Waldemar, G. Increased short- and long-term mortality following infections in dementia: A nationwide registry-based cohort study. Eur. J. Neurol. 2021, 28, 411–420. [Google Scholar] [CrossRef]
- Takeda, S.; Sato, N.; Ikimura, K.; Nishino, H.; Rakugi, H.; Morishita, R. Increased blood-brain barrier vulnerability to systemic inflammation in an Alzheimer disease mouse model. Neurobiol. Aging 2013, 34, 2064–2070. [Google Scholar] [CrossRef]
- Sly, L.M.; Krzesicki, R.F.; Brashler, J.R.; Buhl, A.E.; McKinley, D.D.; Carter, D.B.; Chin, J.E. Endogenous brain cytokine mRNA and inflammatory responses to lipopolysaccharide are elevated in the Tg2576 transgenic mouse model of Alzheimer’s disease. Brain Res. Bull. 2001, 56, 581–588. [Google Scholar] [CrossRef]
- Fink, M.P. Animal models of sepsis. Virulence 2014, 5, 143–153. [Google Scholar] [CrossRef]
- Tateda, K.; Matsumoto, T.; Miyazaki, S.; Yamaguchi, K. Lipopolysaccharide-induced lethality and cytokine production in aged mice. Infect. Immun. 1996, 64, 769–774. [Google Scholar] [CrossRef] [PubMed] [Green Version]
- Moreira, A.L.; Wang, J.; Sarno, E.N.; Kaplan, G. Thalidomide protects mice against LPS-induced shock. Braz. J. Med. Biol. Res. 1997, 30, 1199–1207. [Google Scholar] [CrossRef] [PubMed] [Green Version]
- Erickson, M.A.; Liang, W.S.; Fernandez, E.G.; Bullock, K.M.; Thysell, J.A.; Banks, W.A. Genetics and sex influence peripheral and central innate immune responses and blood-brain barrier integrity. PLoS ONE 2018, 13, e0205769. [Google Scholar] [CrossRef] [Green Version]
- Zhang, Y.; Zhang, J.; Sheng, H.; Li, H.; Wang, R. Acute phase reactant serum amyloid A in inflammation and other diseases. Adv. Clin. Chem. 2019, 90, 25–80. [Google Scholar]
- Kindy, M.S.; Yu, J.; Guo, J.T.; Zhu, H. Apolipoprotein Serum Amyloid A in Alzheimer’s Disease. J. Alzheimers Dis. 1999, 1, 155–167. [Google Scholar] [CrossRef]
- Jang, S.; Jang, W.Y.; Choi, M.; Lee, J.; Kwon, W.; Yi, J.; Park, S.J.; Yoon, D.; Lee, S.; Kim, M.O.; et al. Serum amyloid A1 is involved in amyloid plaque aggregation and memory decline in amyloid beta abundant condition. Transgenic Res. 2019, 28, 499–508. [Google Scholar] [CrossRef]
- Lin, A.; Liu, J.; Gong, P.; Chen, Y.; Zhang, H.; Zhang, Y.; Yu, Y. Serum amyloid A inhibits astrocyte migration via activating p38 MAPK. J. Neuroinflamm. 2020, 17, 254. [Google Scholar] [CrossRef]
- Erickson, M.A.; Jude, J.; Zhao, H.; Rhea, E.M.; Salameh, T.S.; Jester, W.; Pu, S.; Harrowitz, J.; Nguyen, N.; Banks, W.A.; et al. Serum amyloid A: An ozone-induced circulating factor with potentially important functions in the lung-brain axis. FASEB J. 2017, 31, 3950–3965. [Google Scholar] [CrossRef] [Green Version]
- Jang, W.Y.; Lee, B.R.; Jeong, J.; Sung, Y.; Choi, M.; Song, P.; Kim, H.; Jang, S.; Kim, H.; Joo, K.I.; et al. Overexpression of serum amyloid a 1 induces depressive-like behavior in mice. Brain Res. 2017, 1654 Pt A, 55–65. [Google Scholar] [CrossRef]
- Schmid, S.; Rammes, G.; Blobner, M.; Kellermann, K.; Bratke, S.; Fendl, D.; Kaichuan, Z.; Schneider, G.; Jungwirth, B. Cognitive decline in Tg2576 mice shows sex-specific differences and correlates with cerebral amyloid-beta. Behav. Brain Res. 2019, 359, 408–417. [Google Scholar] [CrossRef]
- Ferretti, M.T.; Iulita, M.F.; Cavedo, E.; Chiesa, P.A.; Schumacher Dimech, A.; Santuccione Chadha, A.; Baracchi, F.; Girouard, H.; Misoch, S.; Giacobini, E.; et al. Sex differences in Alzheimer disease—the gateway to precision medicine. Nat. Rev. Neurol. 2018, 14, 457–469. [Google Scholar] [CrossRef] [PubMed]
- Katz, R.J.; Roth, K.A.; Carroll, B.J. Acute and chronic stress effects on open field activity in the rat: Implications for a model of depression. Neurosci. Biobehav. Rev. 1981, 5, 247–251. [Google Scholar] [CrossRef] [Green Version]
- Banks, W.A.; Gray, A.M.; Erickson, M.A.; Salameh, T.S.; Damodarasamy, M.; Sheibani, N.; Meabon, J.S.; Wing, E.E.; Morofuji, Y.; Cook, D.G.; et al. Lipopolysaccharide-induced blood-brain barrier disruption: Roles of cyclooxygenase, oxidative stress, neuroinflammation, and elements of the neurovascular unit. J. Neuroinflamm. 2015, 12, 223. [Google Scholar] [CrossRef] [PubMed] [Green Version]
- Kamphuis, W.; Mamber, C.; Moeton, M.; Kooijman, L.; Sluijs, J.A.; Jansen, A.H.; Verveer, M.; de Groot, L.R.; Smith, V.D.; Rangarajan, S.; et al. GFAP isoforms in adult mouse brain with a focus on neurogenic astrocytes and reactive astrogliosis in mouse models of Alzheimer disease. PLoS ONE 2012, 7, e42823. [Google Scholar] [CrossRef]
- Di Filippo, L.; De Lorenzo, R.; D’Amico, M.; Sofia, V.; Roveri, L.; Mele, R.; Saibene, A.; Rovere-Querini, P.; Conte, C. COVID-19 is associated with clinically significant weight loss and risk of malnutrition, independent of hospitalisation: A post-hoc analysis of a prospective cohort study. Clin. Nutr. 2021, 40, 2420–2426. [Google Scholar] [CrossRef]
- Grunfeld, C.; Feingold, K.R. Body weight as essential data in the management of patients with human immunodeficiency virus infection and the acquired immunodeficiency syndrome. Am. J. Clin. Nutr. 1993, 58, 317–318. [Google Scholar] [CrossRef] [Green Version]
- Uhlar, C.M.; Whitehead, A.S. Serum amyloid A, the major vertebrate acute-phase reactant. Eur. J. Biochem. 1999, 265, 501–523. [Google Scholar] [CrossRef]
- Chait, A.; den Hartigh, L.J.; Wang, S.; Goodspeed, L.; Babenko, I.; Altemeier, W.A.; Vaisar, T. Presence of serum amyloid A3 in mouse plasma is dependent on the nature and extent of the inflammatory stimulus. Sci. Rep. 2020, 10, 10397. [Google Scholar] [CrossRef]
- Sack, G.H., Jr. Serum amyloid A—A review. Mol. Med. 2018, 24, 46. [Google Scholar] [CrossRef]
- Farr, S.A.; Erickson, M.A.; Niehoff, M.L.; Banks, W.A.; Morley, J.E. Central and peripheral administration of antisense oligonucleotide targeting amyloid-beta protein precursor improves learning and memory and reduces neuroinflammatory cytokines in Tg2576 (AbetaPPswe) mice. J. Alzheimers Dis. 2014, 40, 1005–1016. [Google Scholar] [CrossRef] [Green Version]
- Salvador, A.F.; de Lima, K.A.; Kipnis, J. Neuromodulation by the immune system: A focus on cytokines. Nat. Rev. Immunol. 2021, 21, 526–541. [Google Scholar] [CrossRef]
- Konsman, J.P.; Parnet, P.; Dantzer, R. Cytokine-induced sickness behaviour: Mechanisms and implications. Trends Neurosci. 2002, 25, 154–159. [Google Scholar] [CrossRef]
- Mangold, C.A.; Wronowski, B.; Du, M.; Masser, D.R.; Hadad, N.; Bixler, G.V.; Brucklacher, R.M.; Ford, M.M.; Sonntag, W.E.; Freeman, W.M. Sexually divergent induction of microglial-associated neuroinflammation with hippocampal aging. J. Neuroinflamm. 2017, 14, 141. [Google Scholar] [CrossRef]
- Gorman, M.R.; Yellon, S. Lifespan daily locomotor activity rhythms in a mouse model of amyloid-induced neuropathology. Chronobiol. Int. 2010, 27, 1159–1177. [Google Scholar] [CrossRef]
- Kline, K.A.; Bowdish, D.M. Infection in an aging population. Curr. Opin. Microbiol. 2016, 29, 63–67. [Google Scholar] [CrossRef]
- Pettit, W.A.; DeLand, F.H.; Bennett, S.J.; Goldenberg, D.M. Improved protein labeling by stannous tartrate reduction of pertechnetate. J. Nucl. Med. 1980, 21, 59–62. [Google Scholar]


| Cytokines | Genotype Effect | Treatment Effect | Interaction | |
|---|---|---|---|---|
| No Significant Effect | IFN-γ | F (1, 20) = 2.558, p = 0.1255 | F (1, 20) = 3.503, p = 0.0760 | F (1, 20) = 1.296, p = 0.2684 |
| IL-9 | F (1, 20) = 1.000, p = 0.3292 | F (1, 20) = 3.524, p = 0.0751 | F (1, 20) = 3.408, p = 0.0797 | |
| TNF-α | F (1, 20) = 4.052, p = 0.0578 | F (1, 20) = 1.879, p = 0.1856 | F (1, 20) = 2.960, p = 0.1008 | |
| Genotype Effect | IL-12 (p70) | F (1, 20) = 5.880, p = 0.0249 | F (1, 20) = 0.05485, p = 0.8172 | F (1, 20) = 0.6215, p = 0.4397 |
| Treatment Effect | Eotaxin/CCL11 | F (1, 20) = 0.1027, p = 0.7520 | F (1, 20) = 31.34, p < 0.0001 | F (1, 20) = 0.2071, p = 0.6539 |
| G-CSF | F (1, 20) = 1.168, p = 0.2926 | F (1, 20) = 19.11, p = 0.0003 | F (1, 20) = 1.167, p = 0.2930 | |
| IL-2 | F (1, 20) = 0.06101, p = 0.8074 | F (1, 20) = 4.828, p = 0.0399 | F (1, 20) = 4.296, p = 0.0513 | |
| IL-3 | F (1, 20) = 2.263, p = 0.1481 | F (1, 20) = 4.828, p = 0.0400 | F (1, 20) = 3.040, p = 0.0966 | |
| IL-4 | F (1, 20) = 2.263, p = 0.1481 | F (1, 20) = 4.828, p = 0.0400 | F (1, 20) = 3.040, p = 0.0966 | |
| IL-5 | F (1, 20) = 0.6788, p = 0.4197 | F (1, 20) = 5.129, p = 0.0348 | F (1, 20) = 1.815, p = 0.1929 | |
| IL-13 | F (1, 18) = 0.2147, p = 0.6487 | F (1, 18) = 4.417, p = 0.0499 | F (1, 18) = 0.9062, p = 0.3537 | |
| KC/CXCL1 | F (1, 20) = 0.9386, p = 0.3442 | F (1, 20) = 22.62, p = 0.0001 | F (1, 20) = 0.9407, p = 0.3437 | |
| MCP-1/CCL2 | F (1, 20) = 0.9893, p = 0.3318 | F (1, 20) = 10.05, p = 0.0048 | F (1, 20) = 1.692, p = 0.2082 | |
| Interaction Effect | IL-17A | F (1, 20) = 0.03065, p = 0.8628 | F (1, 20) = 3.941, p = 0.0610 | F (1, 20) = 8.585, p = 0.0083 |
| Treatment and Interaction Effect | GM-CSF | F (1, 20) = 1.129, p = 0.3006 | F (1, 20) = 5.398, p = 0.0308 | F (1, 20) = 4.516, p = 0.0462 |
| IL-1α | F (1, 20) = 2.489, p = 0.1303 | F (1, 20) = 22.01, p = 0.0001 | F (1, 20) = 4.726, p = 0.0419 | |
| IL-1β | F (1, 20) = 0.01399, p = 0.9070 | F (1, 20) = 4.991, p = 0.0371 | F (1, 20) = 7.325, p = 0.0136 | |
| IL-6 | F (1, 20) = 2.324, p = 0.1431 | F (1, 20) = 12.73, p = 0.0019 | F (1, 20) = 6.331, p = 0.0205 | |
| IL-10 | F (1, 20) = 0.2897, p = 0.5963 | F (1, 20) = 6.925, p = 0.0160 | F (1, 20) = 5.684, p = 0.0271 | |
| Genotype, Treatment and Interaction | IL-12 (p40) | F (1, 20) = 6.855, p = 0.0165 | F (1, 20) = 30.22, p < 0.0001 | F (1, 20) = 7.793, p = 0.0113 |
| MIP-1α/CCL3 | F (1, 20) = 35.94, p < 0.0001 | F (1, 20) = 19.37, p = 0.0003 | F (1, 20) = 10.56, p = 0.0040 | |
| MIP-1β/CCL4 | F (1, 20) = 5.705, p = 0.0269 | F (1, 20) = 8.780, p = 0.0077 | F (1, 20) = 7.335, p = 0.0135 | |
| RANTES/CCL5 | F (1, 20) = 11.57, p = 0.0028 | F (1, 20) = 62.89, p < 0.0001 | F (1, 20) = 11.05, p = 0.0034 |
| Cytokines | Difference between Means ± SEM, p Value |
|---|---|
| IL-1α | 1.399 ± 0.6434, p = 0.0548 |
| IL-1β | 1.271 ± 0.4696, p = 0.0221 |
| IL-6 | 4.634 ± 1.842, p = 0.0306 |
| IL-12 (p40) | 144.4 ± 51.73, p = 0.0191 |
| IL-10 | 7.520 ± 3.154, p = 0.0383 |
| IL-17A | 7.157 ± 2.442, p = 0.0150 |
| GM-CSF | 4.942 ± 2.326, p = 0.0595 |
| MIP-1α/CCL3 | 23.62 ± 7.266, p = 0.0087 |
| MIP-1β/CCL4 | 26.97 ± 9.959, p = 0.0220 |
| RANTES/CCL5 | 113.4 ± 34.12, p = 0.0077 |
Publisher’s Note: MDPI stays neutral with regard to jurisdictional claims in published maps and institutional affiliations. |
© 2022 by the authors. Licensee MDPI, Basel, Switzerland. This article is an open access article distributed under the terms and conditions of the Creative Commons Attribution (CC BY) license (https://creativecommons.org/licenses/by/4.0/).
Share and Cite
Knopp, R.C.; Baumann, K.K.; Wilson, M.L.; Banks, W.A.; Erickson, M.A. Amyloid Beta Pathology Exacerbates Weight Loss and Brain Cytokine Responses following Low-Dose Lipopolysaccharide in Aged Female Tg2576 Mice. Int. J. Mol. Sci. 2022, 23, 2377. https://doi.org/10.3390/ijms23042377
Knopp RC, Baumann KK, Wilson ML, Banks WA, Erickson MA. Amyloid Beta Pathology Exacerbates Weight Loss and Brain Cytokine Responses following Low-Dose Lipopolysaccharide in Aged Female Tg2576 Mice. International Journal of Molecular Sciences. 2022; 23(4):2377. https://doi.org/10.3390/ijms23042377
Chicago/Turabian StyleKnopp, Rachel C., Kristen K. Baumann, Miranda L. Wilson, William A. Banks, and Michelle A. Erickson. 2022. "Amyloid Beta Pathology Exacerbates Weight Loss and Brain Cytokine Responses following Low-Dose Lipopolysaccharide in Aged Female Tg2576 Mice" International Journal of Molecular Sciences 23, no. 4: 2377. https://doi.org/10.3390/ijms23042377