Article

Amino Acids and IGF1 Regulation of Fish Muscle Growth Revealed by Transcriptome and microRNAome Integrative Analyses of Pacu (Piaractus mesopotamicus) Myotubes

by
Bruno Oliveira Silva Duran
1,†,
Bruna Tereza Thomazini Zanella
2,†,
Erika Stefani Perez
2,
Edson Assunção Mareco
3,
Josefina Blasco
4,
Maeli Dal-Pai-Silva
2 and
Daniel Garcia de la serrana
4,*
1
Department of Histology, Embryology and Cell Biology, Institute of Biological Sciences, Federal University of Goiás (UFG), Goiânia 74690-900, GO, Brazil
2
Department of Structural and Functional Biology, Institute of Biosciences, São Paulo State University (UNESP), Botucatu 18618-689, SP, Brazil
3
Environment and Regional Development Graduate Program, University of Western São Paulo (UNOESTE), Presidente Prudente 19050-680, SP, Brazil
4
Department of Cell Biology, Physiology and Immunology, Faculty of Biology, University of Barcelona, 08028 Barcelona, Spain
*
Author to whom correspondence should be addressed.
These authors contributed equally to this work.
Int. J. Mol. Sci. 2022, 23(3), 1180; https://doi.org/10.3390/ijms23031180
Submission received: 26 December 2021 / Revised: 12 January 2022 / Accepted: 17 January 2022 / Published: 21 January 2022
(This article belongs to the Special Issue Endocrine Control of Fish Metabolism)

Abstract

:
Amino acids (AA) and IGF1 have been demonstrated to play essential roles in protein synthesis and fish muscle growth. The myoblast cell culture is useful for studying muscle regulation, and omics data have contributed enormously to understanding its molecular biology. However, to our knowledge, no study has performed the large-scale sequencing of fish-cultured muscle cells stimulated with pro-growth signals. In this work, we obtained the transcriptome and microRNAome of pacu (Piaractus mesopotamicus)-cultured myotubes treated with AA or IGF1. We identified 1228 and 534 genes differentially expressed by AA and IGF1. An enrichment analysis showed that AA treatment induced chromosomal changes, mitosis, and muscle differentiation, while IGF1 modulated IGF/PI3K signaling, metabolic alteration, and matrix structure. In addition, potential molecular markers were similarly modulated by both treatments. Muscle-miRNAs (miR-1, -133, -206 and -499) were up-regulated, especially in AA samples, and we identified molecular networks with omics integration. Two pairs of genes and miRNAs demonstrated a high-level relationship, and involvement in myogenesis and muscle growth: marcksb and miR-29b in AA, and mmp14b and miR-338-5p in IGF1. Our work helps to elucidate fish muscle physiology and metabolism, highlights potential molecular markers, and creates a perspective for improvements in aquaculture and in in vitro meat production.

1. Introduction

The skeletal muscle in teleost fish represents up to 60% of its total body mass and is the most abundant tissue, with a set of characteristics necessary for fish physiology and metabolism, and with great importance for aquaculture industry [1,2]. Muscle growth is a multifactorial process regulated by extrinsic and intrinsic signals. Extrinsic factors include nutrient availability, temperature, salinity, oxygenation, photoperiod, pH, and water flow [3]. Intrinsic signals include transcription factors (such as myogenic regulatory factors, MRFs), hormones, cytokines, and growth factors. These inputs can shift the balance between protein synthesis and degradation pathways, promoting protein accretion by favoring protein synthesis, and therefore muscle growth [4]. Protein synthesis is strongly regulated by the IGF/PI3K/MTOR axis, while protein degradation is mediated by the ubiquitin-proteasome, calpain/calpastatin and autophagic-lysosomal systems [5,6].
Some of the main factors that regulate protein synthesis are IGFs (insulin-like growth factors), together with their own receptors (IGFR—insulin-like growth factor receptor) and binding proteins (IGFBP—insulin-like growth factor-binding protein) [7]. The IGFs are circulating peptides that comprise mostly two variants, IGF1 and IGF2, with roles in muscle cell viability, the proliferation and differentiation of myoblasts, and hypertrophy and repair after muscle injury and exercise [8,9,10]. The IGF1 is one of the most studied and characterized growth factors that promote muscle growth. When binding to its receptor (IGF1R), IGF1 triggers a phosphorylation cascade, promoting the activation of PI3K (phosphatidylinositol-3-kinase), which is necessary to produce phosphatidylinositol-3,4,5-triphosphate. This component recruits the AKT (protein kinase B), which subsequently activates MTOR (mechanistic target of rapamycin kinase) by phosphorylation [4]. The MTOR integrates endocrine signals, regulates cell cycle, gene transcription, cytoskeletal organization, and protein synthesis. Besides, the pathways involved in protein synthesis control can be activated by signals other than growth factors. Several studies have shown that amino acids promote the phosphorylation of MTOR [11,12] and regulate the transcription and activation of components of the IGF system [13,14] on their own. These studies support the existence of an independent route stimulated by amino acids to promote muscle growth in teleost fish. Given the roles of the IGF system and amino acids in promoting protein synthesis and muscle formation, the comprehension of their effects is beneficial for understanding muscle metabolism and for aquaculture.
The microRNAs (miRNAs) also play a fundamental role in controlling the progression of the myogenic program and the determination of the muscle fiber phenotypes [15,16]. The miRNAs correspond to a class of small non-coding RNAs of which the main function is the post-transcriptional regulation of genes, promoted by the translation inhibition or decay of messenger RNAs (mRNAs) [16,17,18]. miRNAs regulate their targets in a combinatorial pattern, increasing the complexity and regulatory potential of gene expression, with most of them able to finely regulate signaling pathways and common biological functions [19,20]. miRNAs in teleost fish are involved in embryogenesis and several developmental and physiological processes in different tissues [21,22,23,24,25,26,27,28]. Both muscle formation and growth are regulated by several miRNAs, with some of them considered as muscle-specific with unique or high expression in skeletal muscles, such as miR-1, miR-133, miR-206 or miR-499. These miRNAs apply a high degree of control over the different phases of myogenesis, including myoblast proliferation, myotube formation, fiber type specification, and muscle regeneration [29,30,31,32], orchestrating the fate and phenotype of muscle cells.
Fish myoblast cell cultures are a very powerful tool to study all of these molecular networks and signals regulating myogenesis and muscle growth [33,34,35,36,37,38,39,40,41,42]. This in vitro model encompasses the main stages of myogenesis, especially myoblast proliferation, differentiation, and fusion into myotubes [38,39,41]. Moreover, the cell culture system provides a more controlled environment than in vivo, allowing the analysis of many signaling pathways and molecular networks under controlled conditions. This enables a more in-depth study of regulatory molecules and the investigation of their roles at different stages of cell culture [7]. Furthermore, myoblast cell culture medium can be modified to assess the role of nutrients, growth factors or hormones in regulating the muscle growth process [12,13,14,35,38,40,42,43,44,45], such as the amino acids and IGF1.
In this context, large-scale sequencing techniques have provided enormous progress in the molecular biology field. Global approaches, such as the transcriptome and microRNAome, allow one to obtain a molecular profile of different tissues under distinct conditions or moments, providing opportunities for the identification of molecular markers, and new information on the signaling pathways that regulate a particular biological process [46]. However, to our knowledge, no study has performed large-scale sequencing in fish myotube cell cultures treated with pro-growth signals. Thus, our main objective was to obtain and evaluate the transcriptome and microRNAome of pacu (Piaractus mesopotamicus) myotubes stimulated with amino acids or IGF1. Our analysis of both omics provided new insight into different signaling pathways’ activation, potential molecular markers, and networks integrating gene and miRNA transcription, allowing better comprehension of the molecular regulation of fish myogenesis and muscle growth using pro-growth inputs.

2. Results

2.1. AA and IGF1 Treatments Were Effective, and AA Induced Higher Number of Differentially Expressed Genes (DEGs)

The sequencing of pacu myotubes transcriptome yielded a total of 70,363,951 (CTR), 69,999,996 (AA) and 76,376,683 (IGF1) paired-end reads per group (Supplementary Table S1). After trimming, 30,902,924 paired-end reads were successfully assembled into 176,103 contigs. A total of 69,932 contigs (40%) were successfully annotated, and after normalization, the myotubes treated with AA or IGF1 showed a non-redundant list of 1228 (524 down- and 704 up-regulated) and 534 (289 down- and 245 up-regulated) DEGs compared to the CTR group, respectively (Supplementary Tables S1 and S2).
The principal component analysis (PCA) plot, according to the transcriptome results, showed different profiles between CTR, AA, and IGF1 samples. The pacu myotubes were well separated according to the experimental groups, showing that the treatments were effective, and the cell culture replicates were similar to each other (Supplementary Figure S1). We further confirmed the effectiveness of our protocol via the digital expression of fbxo32 (f-box protein 32), a well-known marker of muscle protein degradation and atrophy [42,47,48,49,50], and myog (myogenin), related to myogenesis and growth [51,52,53,54]. Both AA and IGF1 groups showed decreased fbxo32 transcription (fold-change = 0.37 in AA and 0.39 in IGF1; p-adj < 0.01) and increased myog transcription (fold-change = 2.02 in AA and 1.68 in IGF1; p-adj < 0.01) compared to CTR (Figure 1).

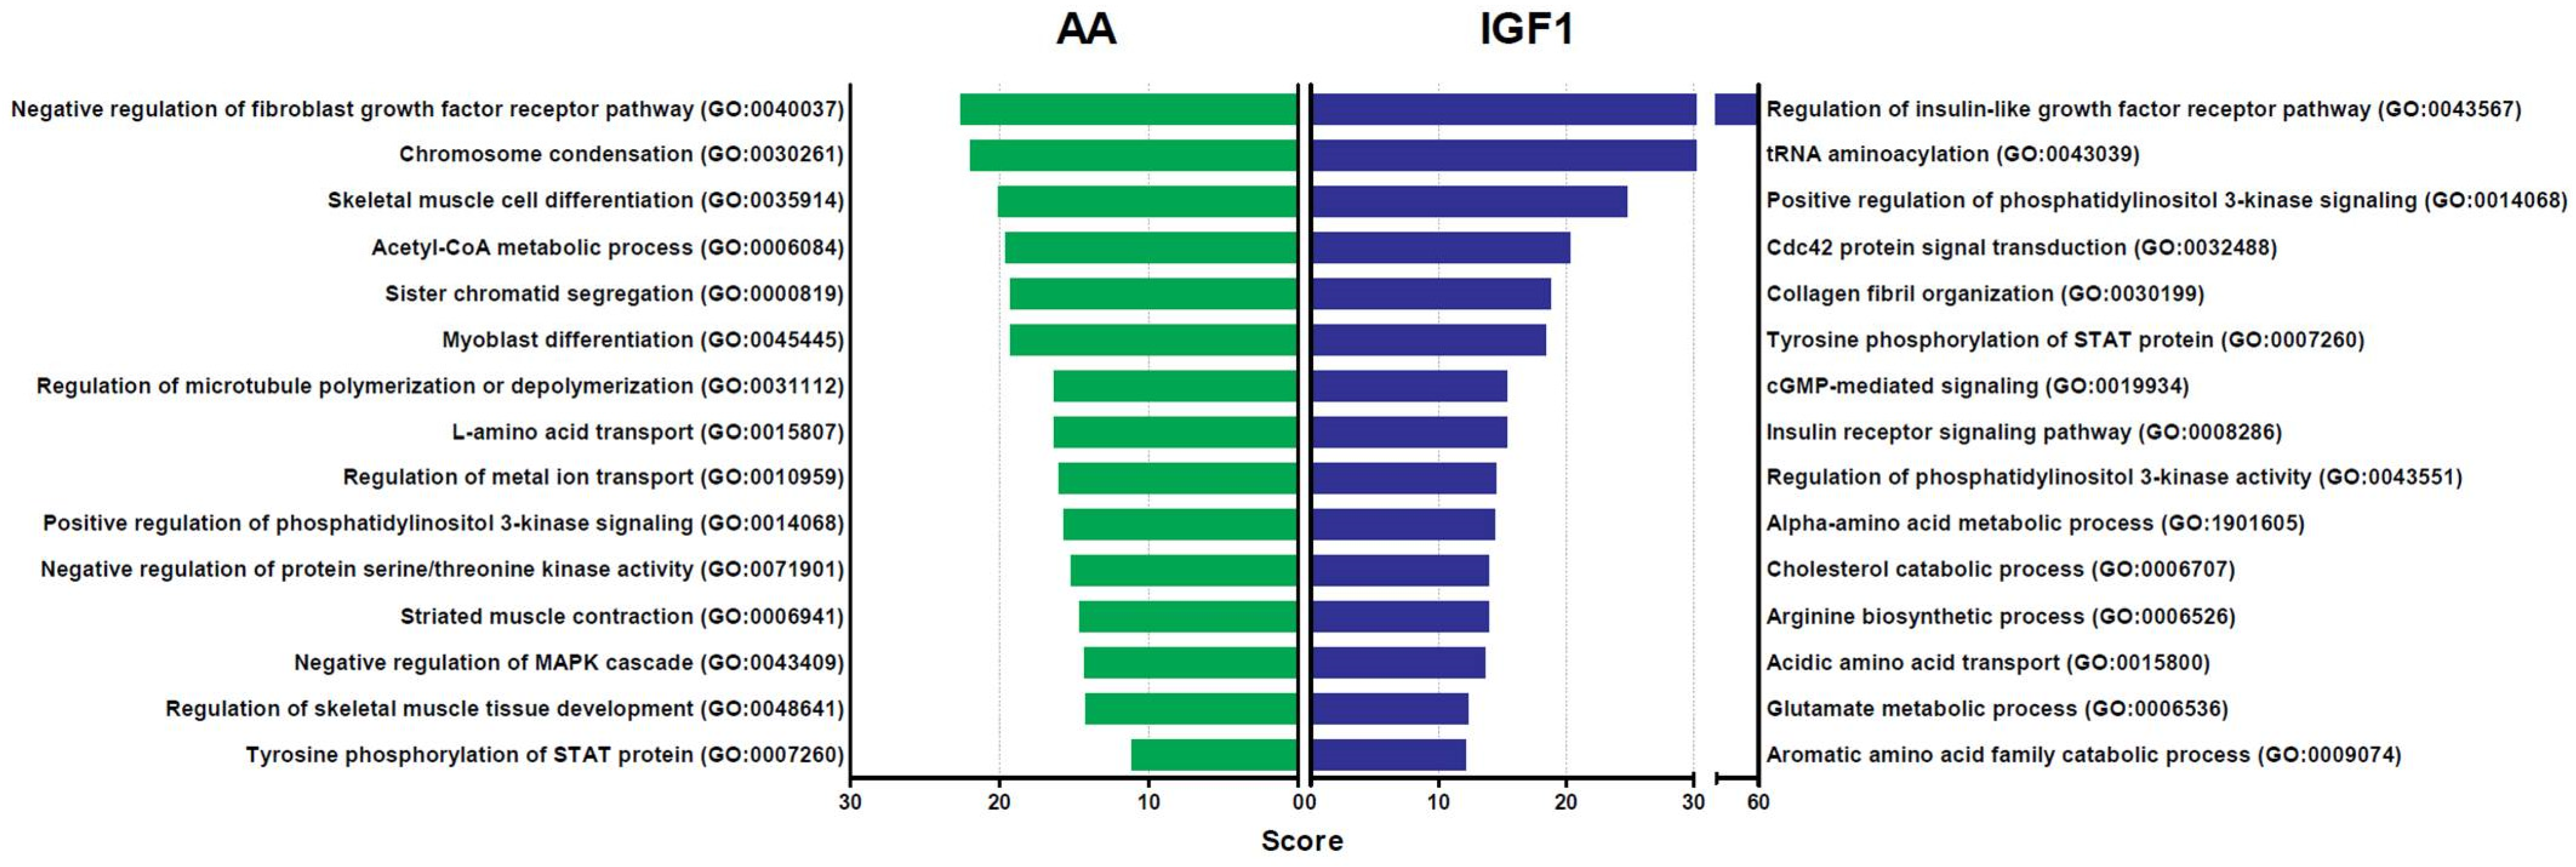
2.2. DEGs Were Specific to Each Treatment or Shared by Both AA and IGF1, Which Modulated Different Biological Processes

The heatmap of gene expression showed a different transcription pattern between the experimental groups. The hierarchical clustering revealed three main groups of genes, better defined by the K-means clustering (K-means = 3), namely Cluster I, II and III, which have increased expression respectively in AA, IGF1, and CTR treatments (Figure 2; Supplementary Table S3). In addition, we used the Venn diagram for further information about genes up- or down-regulated by both pro-growth inputs. Among the 1228 and 534 DEGs, we found that 218 genes were differentially expressed by both AA and IGF1 treatments (Figure 3; Supplementary Table S3), mainly involved with IGF/PI3K/MTOR signaling and the JAK-STAT cascade (Supplementary Figure S2).
A gene ontology enrichment analysis was performed to access the biological processes enriched by the DEGs in AA and IGF1-treated samples compared to the CTR group (Figure 4). Our results show that AA treatment induced the enrichment of many processes related to chromosomal alteration/mitosis (GO:0030261; GO:0000819; GO:0031112) and muscle differentiation (GO:0035914; GO:0045445; GO:0006941), while IGF1 modulated mostly IGF/PI3K signaling (GO:0043567; GO:0014068; GO:0008286), amino acids metabolism (GO:1901605; GO:0006526; GO:0015800), and matrix organization (GO:0030199) (Figure 4).

2.3. AA and IGF1 Treatments Resulted in Differential Expressed miRNAs, and AA Induced Higher Number of Muscle-Specific miRNAs

The sequencing of pacu myotubes microRNAome yielded a total of 40,147,542 (CTR), 40,557,507 (AA) and 44,512,081 (IGF1) single-end reads per group (Supplementary Table S1). After trimming, 122,586,164 single-end reads (98% of the total) were successfully annotated into 3579 miRNA, and after normalization, the myotubes treated with AA or IGF1 showed, respectively, 11 and 8 differentially expressed miRNA compared to the CTR group (Supplementary Tables S1 and S4).
According to the microRNAome PCA plot, the AA pacu myotubes were grouped separately from CTR and IGF1 treatments, showing that the AA input had a more distinct effect on miRNA modulation, while the samples from CTR and IGF1 groups were similar to each other (Supplementary Figure S3). In fact, the different expression analysis showed that the muscle-specific miRNAs (miR-1, -133, -206 and -499) were mainly up-regulated by AA treatment, with the presence of mature sequences derived from 3p or 5p strands. In addition, our results show different paralogous copies of miR-133 (a, b and c) up-regulated by the AA treatment (Supplementary Table S4).

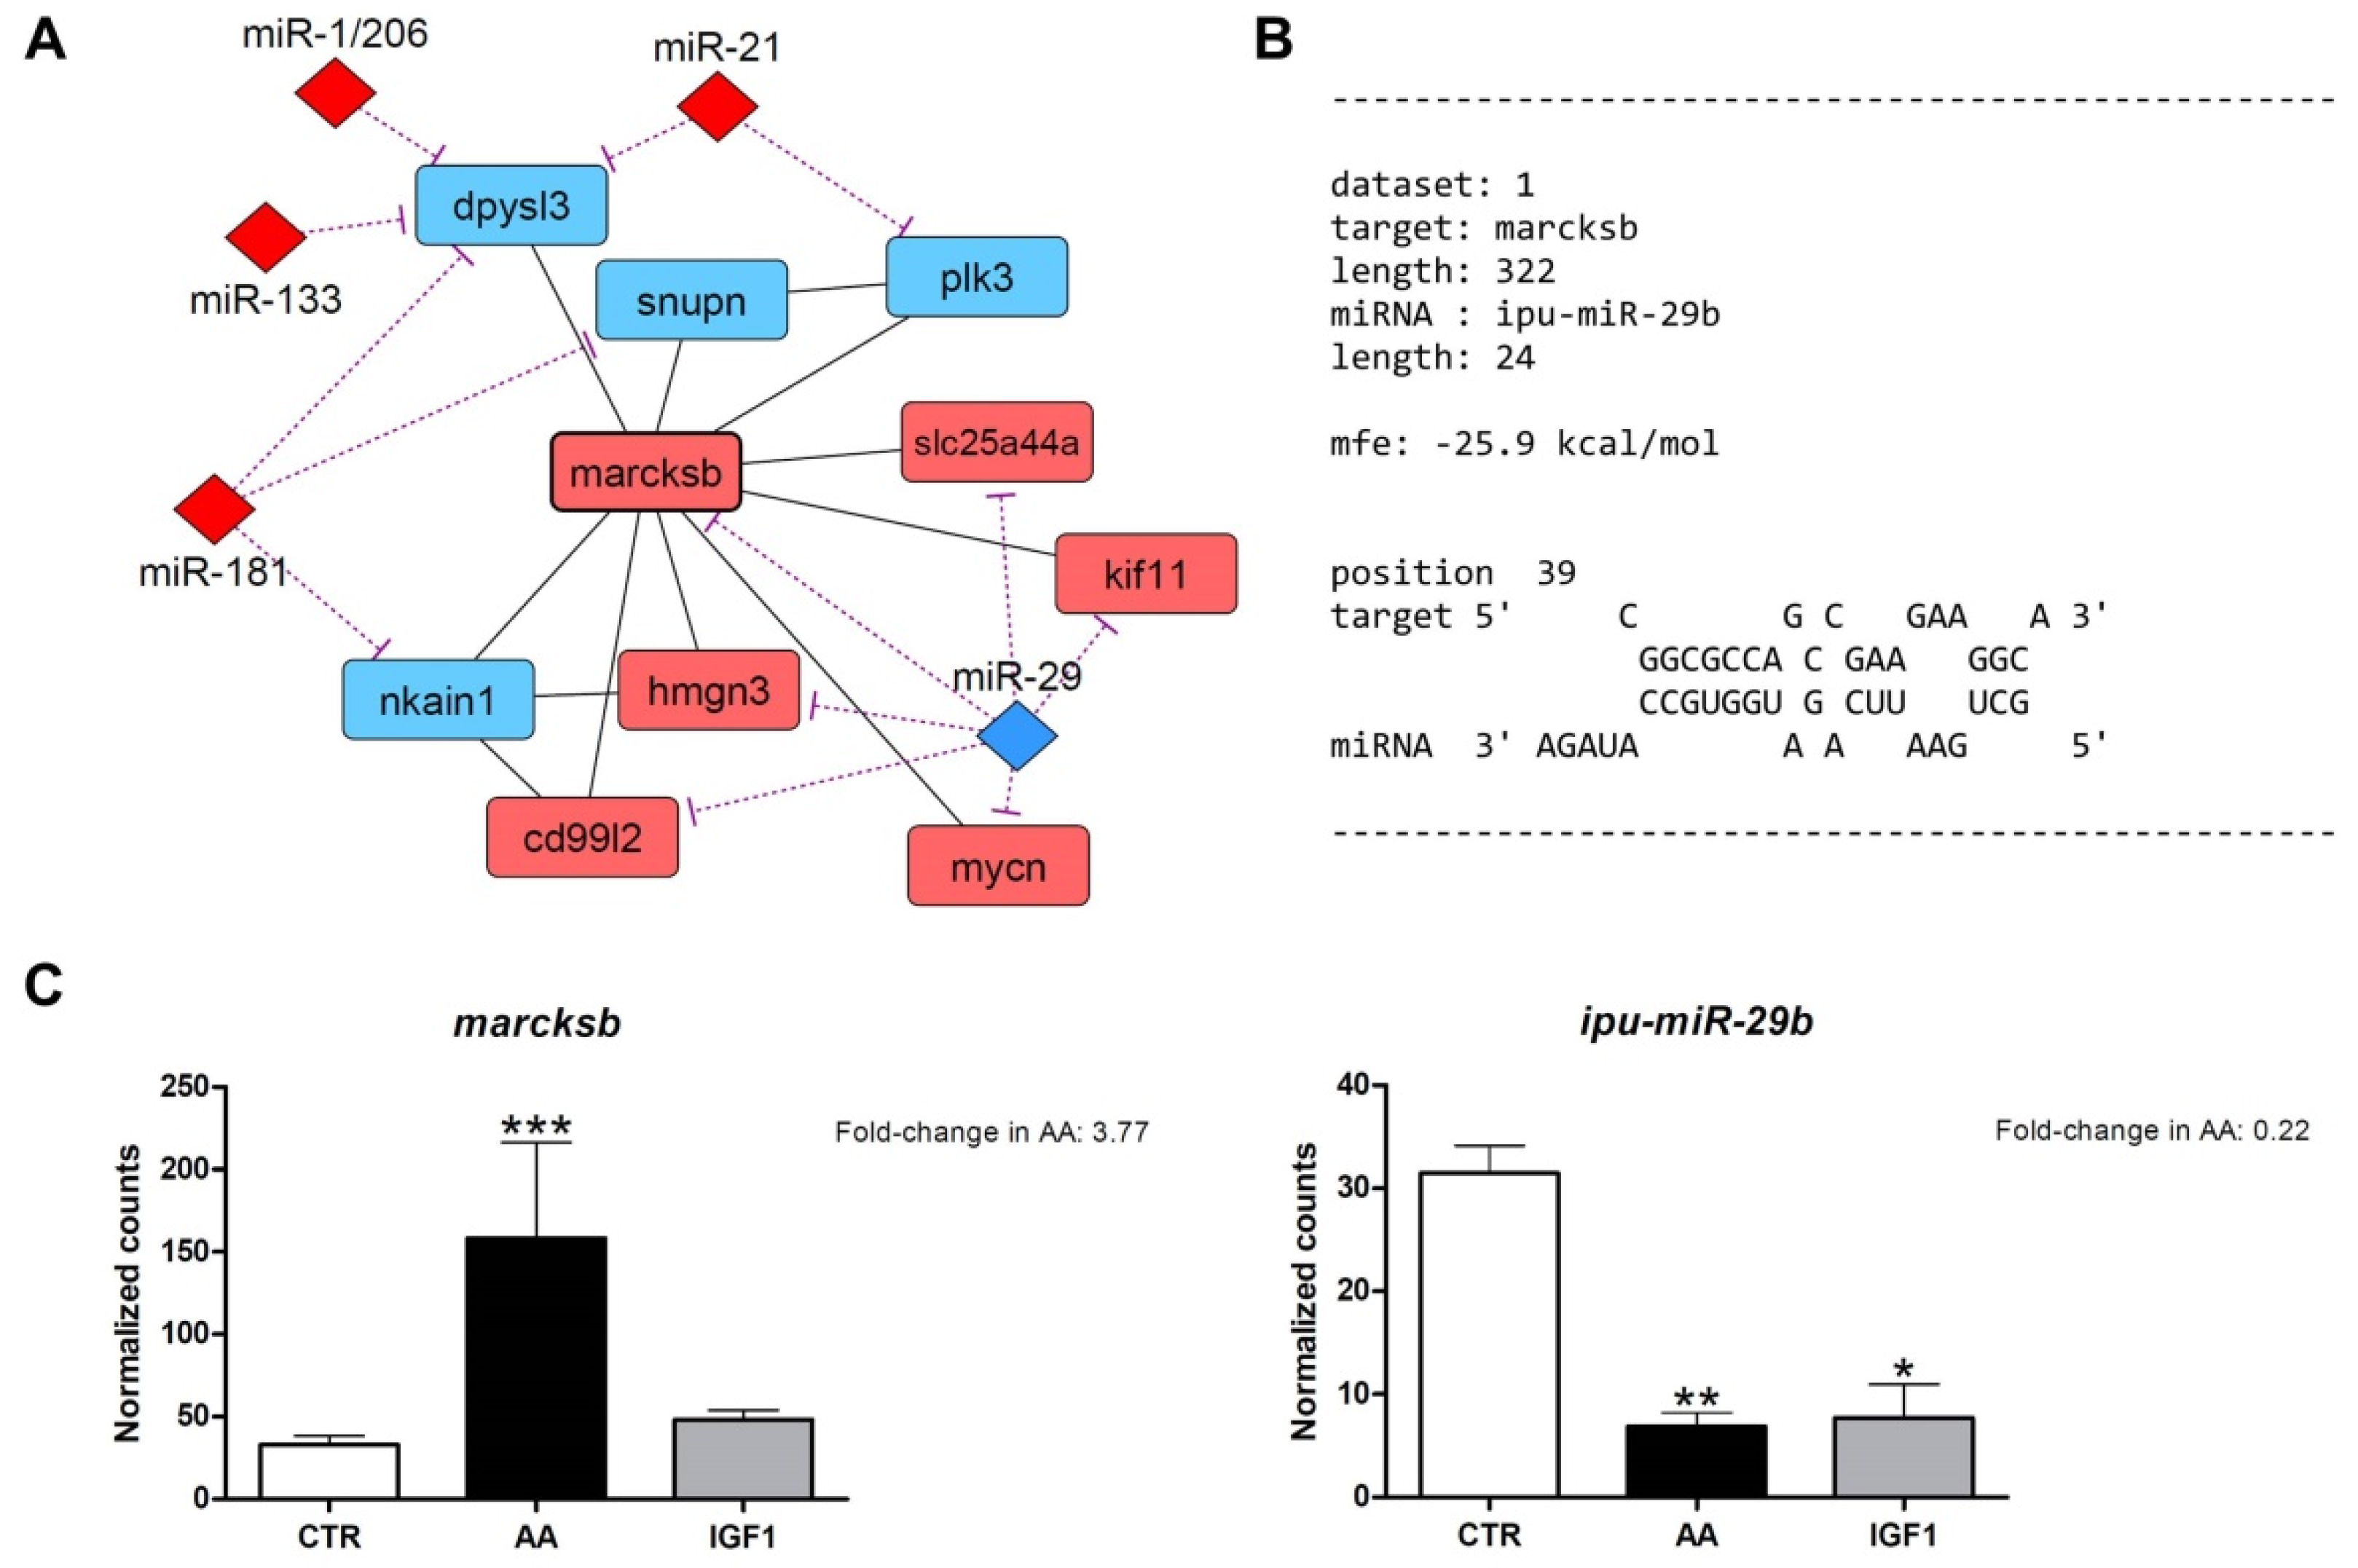
2.4. Omics Integration Showed Complex Molecular Networks, with High marcksb/miR-29b Interaction in AA and mmp14b/miR-338-5p Interaction in IGF1

After miRNA target prediction, we found interaction molecular networks with strong relationships between the differentially expressed genes from the transcriptome, with differentially expressed miRNAs from the microRNAome. These interaction networks show several up- and down-regulated genes, co-expressed according to the literature, with potential binding sites for miRNAs altered by AA or IGF1 treatments (Supplementary Figure S4). Within the networks generated for AA treatment, we found marcksb/miR-29b interaction with high hybridization (MFE = −25.9 kcal/mol). Moreover, MARCKS is involved in myogenesis and muscle differentiation [55,56,57,58,59,60], and showed a number of interactions with others DEG in transcriptome (Figure 5). In the IGF1 network, we found mmp14b/miR-338-5p interactions with high hybridization (MFE = −26 kcal/mol). MMP14 also showed interactions with other DEGs in the transcriptome, besides the involvement in muscle regeneration and fibrous tissue organization and development [61,62,63,64] (Figure 6). In addition, to complement our results and provide further insight, we used the counts obtained in our work to check the correlation between miRNA–target interactions already validated in the literature (Supplementary Figure S5).

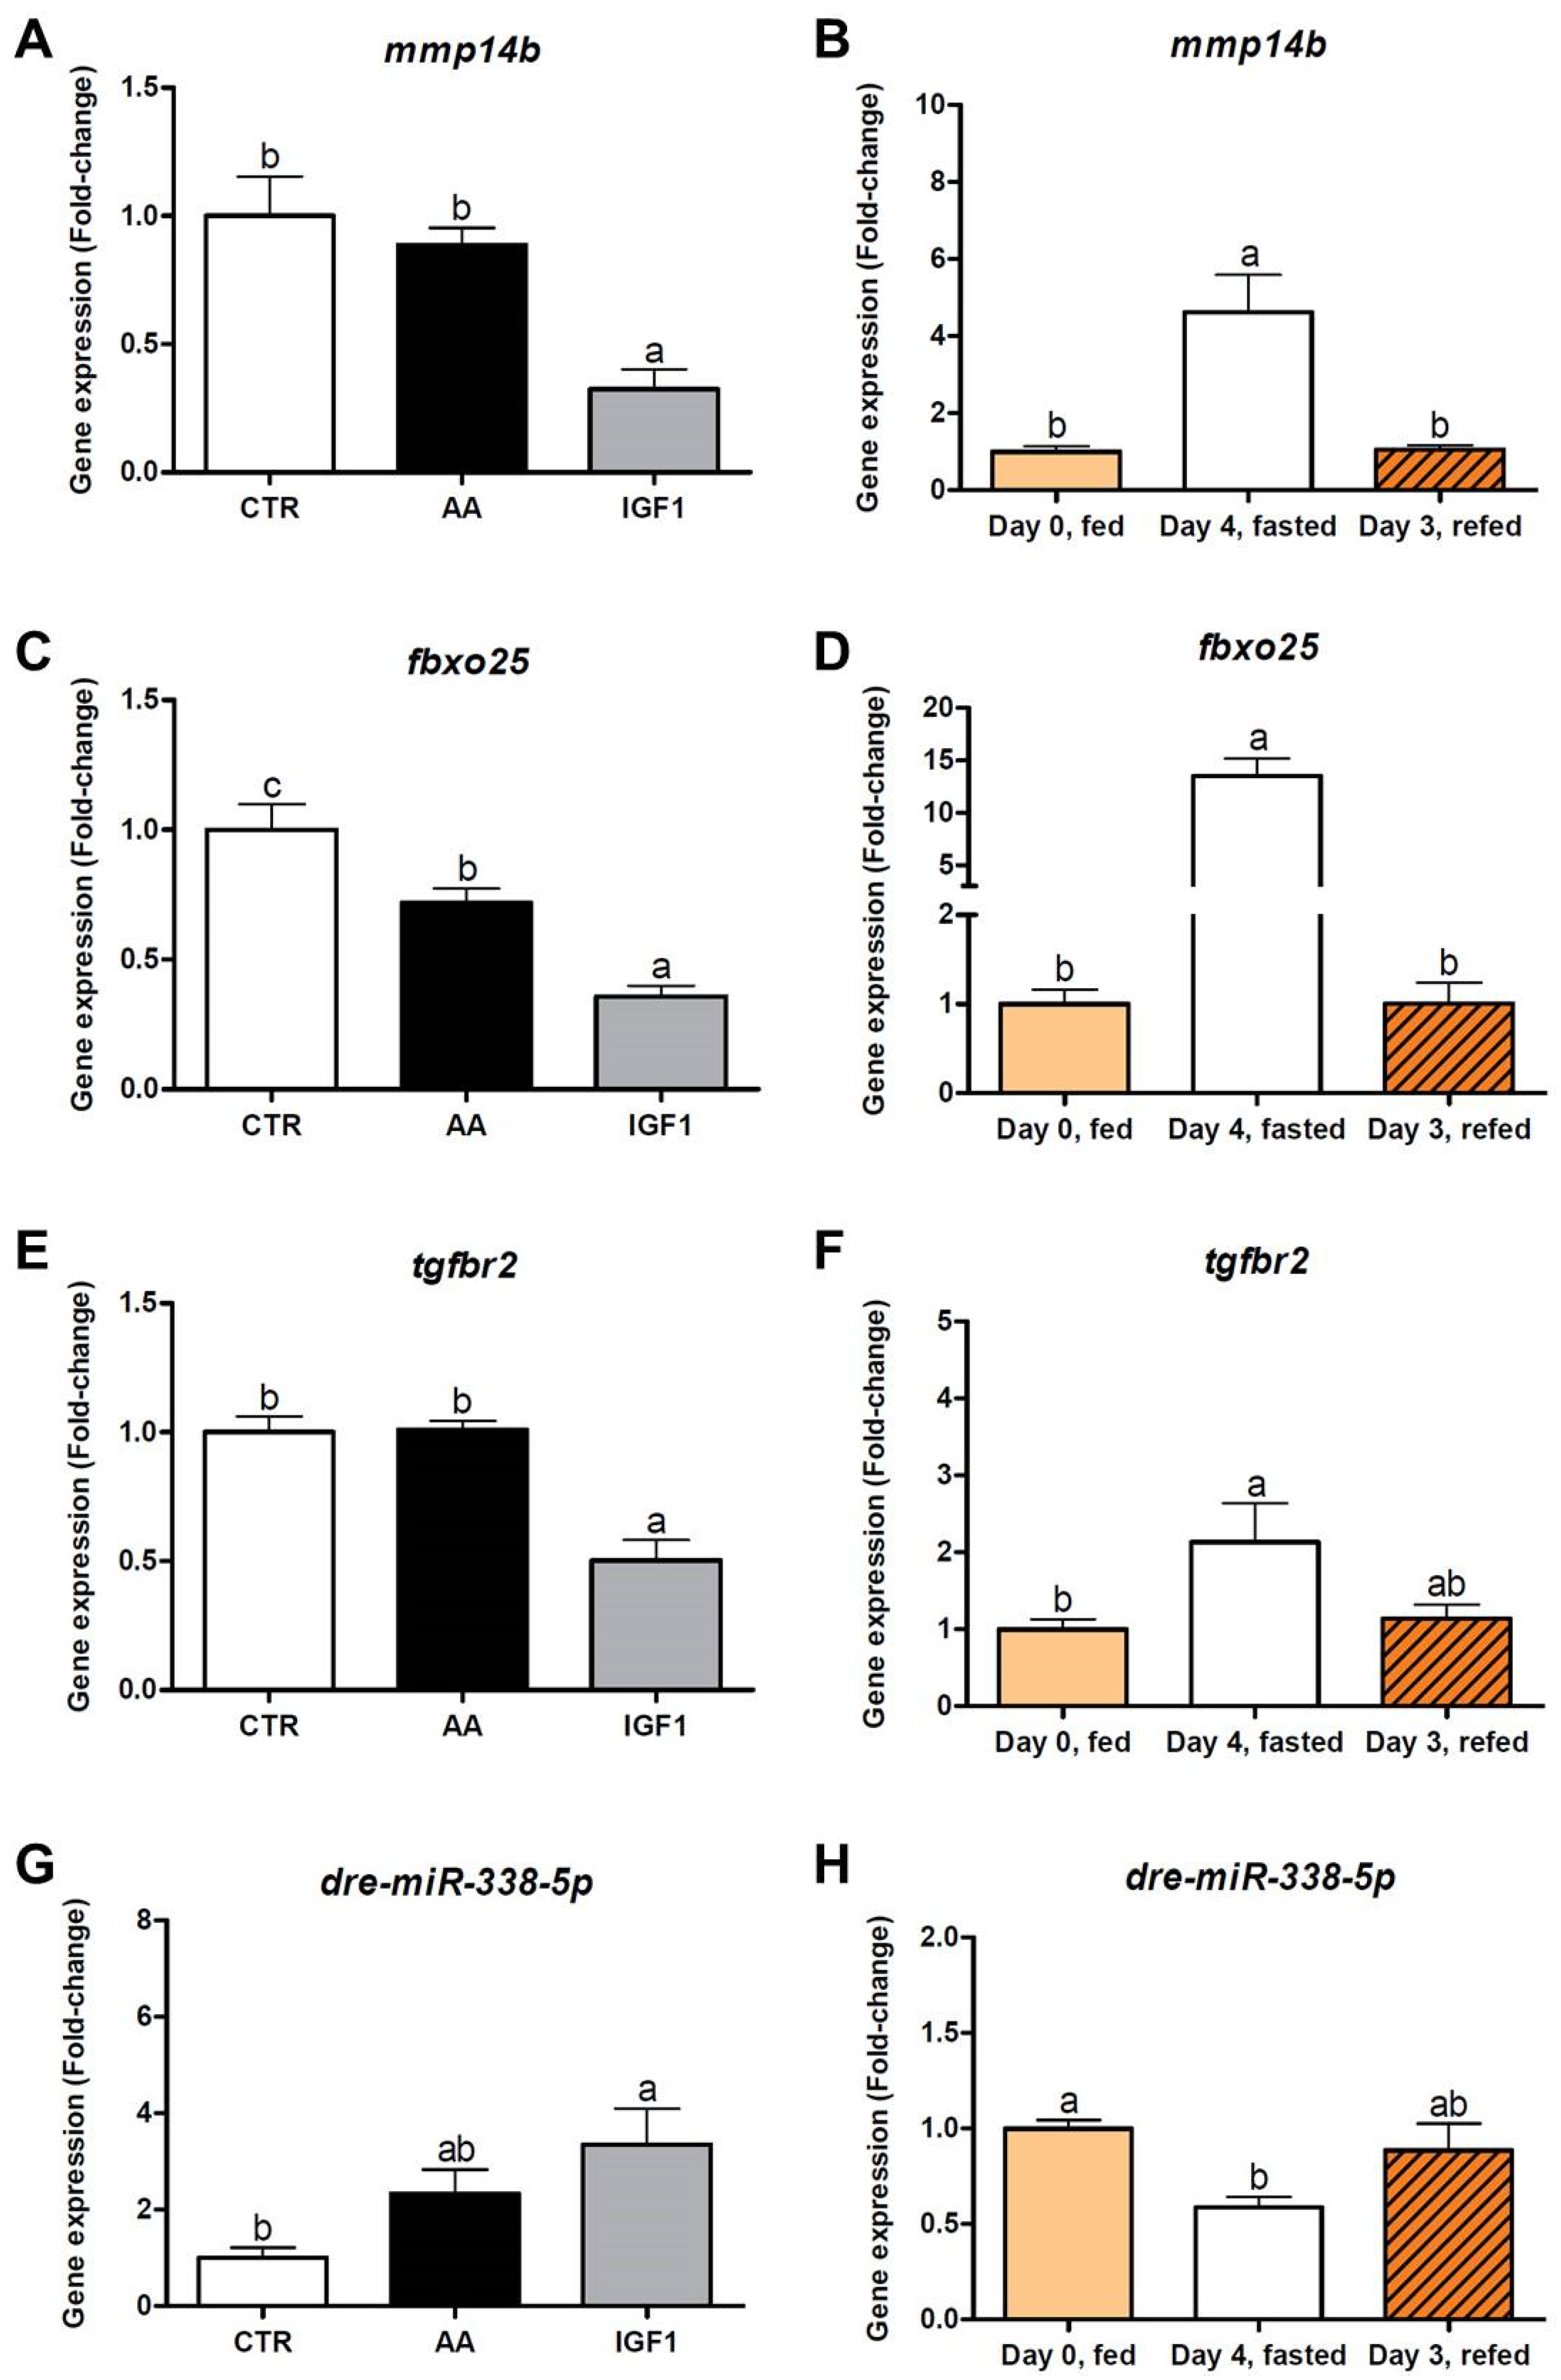
2.5. Inverse Expression Pattern Was Observed between marcksb and miR-29b, and between mmp14b and miR-338-5p, Both In Vitro and In Vivo

To validate and further explore our results, we evaluate the gene expression of marcksb, miR-29b, mmp14b, miR-338-5p, and other genes selected from AA and IGF1 networks (Supplementary Table S5). We used in vitro pacu myotubes treated with amino acids or IGF1, and in vivo muscles from pacus submitted to fasting (4 days) and re-feeding (3 days). The marcksb transcription was increased in myotubes treated with AA (fold-change = 2.23; p < 0.05) compared to CTR and IGF1, and increased in the re-fed fish (fold-change = 1.30; p < 0.01) compared to the fasting period. The expression of mycn did not show statistical differences between experimental groups. On the other hand, miR-29b expression was decreased in AA, despite the lack of statistical differences, and in IGF1, compared to CTR (fold-change = 0.30; p < 0.05). Similarly, miR-29b showed up-regulation after fasting (fold-change = 35.7; p < 0.05) and down-regulation after refeeding (fold-change = 1.64; p < 0.05) (Figure 7).
The expression of mmp14b, fbxo25 and tgfbr2 was decreased in myotubes treated with IGF1 compared to other groups (fold-change = 0.32 for mmp14b, fold-change = 0.36 for fbxo25 and fold-change = 0.50 for tgfbr2; p < 0.01), results corroborated by the increased transcription of these genes after fasting (fold-change = 4.61 for mmp14b, fold-change = 13.5 for fbxo25 and fold-change = 2.13 for tgfbr2; p < 0.05), and decreased transcription after re-feeding (fold-change = 1.04 for mmp14b and fold-change = 1.00 for fbxo25; p < 0.01). In contrast, the miR-338-5p showed up-regulation in IGF1 compared to CTR (fold-change = 3.35; p < 0.05), while the fish showed decreased transcription after fasting (fold-change = 0.59; p < 0.05), and a slight increase after re-feeding, despite the lack of statistical difference (Figure 8).
In addition, to complement our results, we checked the correlation between marcksb/miR-29b and mmp14b/miR-338-5p interactions. Both showed significant negative correlation indexes (ρ = −0.35 and ρ = −0.62, respectively; p < 0.05) (Supplementary Figure S6).

3. Discussion

Research on fish skeletal muscle growth has enormous importance in fish farming production and development, with this tissue representing the main product of the aquaculture industry [1,7]. Hyperplasic and/or hypertrophic muscle growth involve the proliferation and differentiation of myoblasts and their subsequent fusion into myotubes, steps recapitulated by the fish myoblast cell cultures [38,39,41]. In addition, fish muscle growth is influenced by different inputs that lead to increased protein synthesis, strongly regulated by the IGF/PI3K/MTOR axis. Among them, the IGF1 itself and several amino acids are the most studied factors that promote muscle growth [41].
Different studies have used the fish myoblast cell cultures to examine anabolic pathways in muscle [11,12,13,44,65]. Díaz et al. (2009) detected glut4 up-regulation (insulin-responsive glucose transporter type 4) in both myoblasts and myotubes after treatment with INS (insulin) and IGF1 [66]. Moreover, IGF1 and INS supplementation to trout myocytes promoted increased protein synthesis and decreased proteolysis, whereas the administration of leucine only reduced protein degradation [44]. In addition, the lack of amino acids increases autophagosome formation, the expression of autophagy genes [67], and the transcription of fbxo32/mafbx and murf1 (muscle-specific ring finger protein 1) [68], but there is evidence that amino acids can act as positive or negative regulators of protein turnover in fish muscle. Cleveland and Radler (2019) showed that leucine and phenylalanine directly regulate proteolysis in rainbow trout-cultured muscle cells, with leucine as a central regulator of protein turnover, while an excess of lysine and valine increased rates of protein degradation [69]. On the other hand, Azizi et al. (2016) observed that lysine deficiency down-regulated the expression of IGF signaling components and MRFs in gilthead sea bream myocytes [70].
In our study, we obtained a higher amount of DEGs in AA-treated myotubes (1228), with much fewer de-regulated genes in IGF1-treated cells (534) (Supplementary Tables S1 and S2), which could be an indicative that AA treatment was more effective or potent than the pro-growth condition, compared to the IGF1 group. However, we must consider that the strong regulation of AA treatment may result from the medium composition, which includes several amino acids with unique or overlapping roles in muscle growth and metabolism [69], representing a collection of anabolic factors, and not a single factor as the IGF1. According to the heatmap, there is a gene expression signature specific to each experimental group, CTR (Cluster III), AA (Cluster I), or IGF1 group (Cluster II) (Figure 2). Considering the distinct molecular repertories that are mobilized in each pro-growth condition, the identification of the genes in each cluster (Supplementary Table S3) could be of interest for research focusing on AA or IGF1 treatment. Our results provided important large-scale data from isolated fish muscle cells treated with the most used inputs to increase myogenesis and muscle growth [41], something not yet investigated, to the best of our knowledge. In addition, we identified 218 genes with up- or down-regulated transcription in both AA and IGF1 treatments (Figure 3; Supplementary Table S3). Among these genes, we found the down-regulation of igfbp1a (insulin-like growth factor-binding protein 1; fold-change = 0.31 in AA and 0.35 in IGF1) and up-regulation of igfbp5a (insulin-like growth factor-binding protein 5; fold-change = 2.34 in AA and 2.16 in IGF1), both with defined roles in skeletal muscle.
Despite having structural similarities, IGFBPs exert different functions according to the physiological conditions and cell types [71,72,73]. In teleost fish, as well as in mammals, the highest expression of igfbp1 occurs in the liver under normal conditions [74,75], and in skeletal muscle under low nutrient availability. To overcome this catabolic condition, IGFBP1 possibly sequesters IGFs from IGFRs, prioritizing metabolic processes associated with cell survival instead of muscle growth [72]. In this sense, Rolland et al. (2015) described that the low amino acid diet promotes the up-regulation of igfbp1 in rainbow trout, a process reversed when the anabolic environment is recovered [76]. Similarly, the down-regulation of igfbp1a in both the AA and IGF1 treatments of our study indicates the activation of anabolic pathways and the continuity of myogenic processes. On the other hand, studies have shown that igfbp5 has great importance in myogenesis, muscle growth and gill functions, regulating IGFs and calcium ion influx [77,78,79]. Atlantic salmon muscle cells had high expression of igfbp5 paralogs (igfbp5a and igfbp5b) in response to amino acids, possibly stimulating the cell cycle [13], and gilthead sea bream muscle cells showed increased igfbp5 transcription under treatment with amino acids and IGFs [70,80], similar to our data, results that corroborate and reinforce the importance of this gene in pro-growth conditions.
Moreover, our results also showed that individual AA and IGF1 treatments modulated different signaling pathways. AA samples showed the enrichment of biological processes related to chromosomal changes/mitosis and muscle differentiation, while IGF1 samples induced IGF/PI3K signaling, the metabolism of amino acids, and matrix organization (Figure 4). These same biological processes were enriched in each treatment considering the exclusive genes in heatmap clusters. Corroborating our data, studies showed that AA stimulates protein synthesis during myogenesis by themselves [11,12], through the direct activation of the MTOR complex, without affecting upstream components such as PI3K, but IGF1 only stimulates protein synthesis if AA are also present [13,14]. In fact, our results indicate that PI3K signaling is less enriched in AA myotubes, and that IGF1 requires the activation of amino acids metabolism to stimulate protein synthesis. It seems that IGF1 has an upstream effect to induce muscle growth, in accordance with its role as a binding factor at the muscle cell membrane [81], stimulating protein synthesis via an increase in PI3K signaling. On the other hand, the AA treatment appears to have a downstream effect on muscle growth, increasing myogenesis through cell proliferation/mitosis and differentiation. It is not clear why IGF1 alone fails to stimulate myogenic pathways such as AA. A hypothesis would be that amino acids are more relevant and consistent during the MTOR integration of nutritional and hormonal signals to regulate protein synthesis and cell proliferation [82,83,84]. The amino acids may facilitate IGF1 function, and their absence in IGF1 treatment possibly inhibited, or did not activate, components of the IGF and myogenic systems, similar to the results of Azizi et al. (2016) [70]. However, as discussed, this broader effect of AA treatment may result from the presence of several different amino acids in the culture medium.
The miRNAs also regulate all steps of myogenesis [29,30,31,32,85,86], through the silencing of mRNAs [16,17,18]. In our study, we observed, respectively, 11 and 8 differentially expressed miRNAs in AA and IGF1 samples (Supplementary Tables S1 and S4), with the majority of the AA up-regulating muscle-specific miRNAs (miR-1, -133, -206 and -499), which could also indicate the higher potency of AA treatment as a pro-growth input. Both in mammals and teleost fish, the miR-1 and -206 belong to the same miRNA family and are involved in muscle development by stimulating myoblast differentiation [29,30,34], while the myoblast proliferation is regulated by miR-133 [29,34]. On the other hand, miR-499 participates in the specification and maintenance of the slow-twitch muscle fiber phenotype, with increased expression in slow muscle cells [31,32,34,36,87,88]. Our work showed significant negative correlation between miRNAs and validated targets involved with myogenesis and muscle growth (Supplementary Figure S5), and the high enrichment of myogenic processes in AA myotubes could be explained by the up-regulation of several muscle-specific miRNAs. The favored cell differentiation was stimulated by miR-1 and miR-206 (fold-change = 1.25 and 2.39 in AA), while myoblast proliferation/mitosis was probably regulated by the many paralogous copies of miR-133 (fold-change = 1.75 in AA), which also showed different active strands (5p and 3p) (Supplementary Table S4). The different copies of miR-133 (-133a, -133b and -133c) and their specific functions in muscle growth constitute an interesting research field, leading to improvements in biological knowledge, and the potential to apply this in aquaculture.
Rather than individual genes and miRNAs, both AA and IGF1 treatments also activated large sets of molecular components, demonstrated by the strong relationship and high complexity of the interaction networks (Supplementary Figure S4). Within such networks, we found two interesting genes: marcksb (fold-change = 3.77 in AA), which is related to myogenesis and muscle differentiation; and mmp14b (fold-change = 0.5 in IGF1), which is related to matrix organization and development (Figure 5 and Figure 6). These de-regulated genes showed high affinity with the miRNAs miR-29b (fold-change = 0.22 in AA) and miR-338-5p (fold-change = 1.73 in IGF1), respectively. Validation through qPCR corroborated the results of differential gene expression, with increased marcksb expression and decreased mmp14b expression by pro-growth stimuli both in vitro and in vivo (Figure 7 and Figure 8), besides a significant negative correlation between these genes and miRNAs (Supplementary Figure S6).
The MARCKS is an actin-binding protein that translocates from plasma membrane to cytosol and vice versa, depending on its phosphorylation state, which is regulated mainly by protein kinase C [55,60]. Studies showed that MARCKS translocation regulates muscle cell adhesion, spreading [56], differentiation and fusion [57,58], in addition to the control of cytoskeleton dynamics [89]. Moreover, the blocking of MARCKS resulted in abnormalities in the skeletal muscle of zebrafish, with an increased number of nuclei and curve-shaped fibers [59]. Our work showed that AA treatment stimulated the enrichment of muscle differentiation processes, consistent with the up-regulation of marcksb by AA in in silico (Figure 5A,C), in vitro (Figure 7A), and in vivo re-fed pacus (Figure 7B). Interestingly, other well-characterized genes of myoblast fusion were also up-regulated by the AA in our in silico analyses, such as myogenin (fold-change = 2.02) and myomaker (fold-change = 2.12), indicating that marcksb could be a new option and a possible molecular marker of fish muscle cell differentiation in pro-growth conditions. In contrast, miR-29b was down-regulated by both AA and IGF1 in in silico (Figure 5A,C), in vitro (Figure 7E) and in vivo re-fed pacus (Figure 7F). In fact, miR-29b is commonly up-regulated in multiple types of muscle atrophy, as induced by denervation, dexamethasone, fasting, ageing or cachexia, conditions attenuated after the inhibition of this miRNA [90,91]. The reduced expression of miR-29b in our AA treatment probably allowed the effects of marcksb, and favored the environment for myogenesis and muscle growth. To obtain further information, we also evaluated the expression of mycn, a proto-oncogene required for cell proliferation which inhibits myogenic differentiation [92]. Despite the up-regulation of mycn in AA transcriptome (fold-change = 2.56) and the connection with marcksb in the molecular network (Figure 5A), we did not find statistical differences between the groups, in vitro or in vivo (Figure 7C,D), which reinforces a more active role of marcksb and enhanced muscle differentiation.
MMP14 is a collagenase and a member of the matrix metalloproteinase family, which is not fully characterized in skeletal muscle. Ohtake et al. (2006) demonstrated that MMP14 is a major contributor to the progression of myogenesis through the degradation of extracellular matrix (ECM) components. In addition, MMP14-deficient mice showed smaller and more heterogeneous muscle fibers with compromised integrity [62]. Human muscle satellite cells also showed the expression of this metalloproteinase, which is necessary for in vitro cellular invasion through collagen I [61], highlighting the relevance of MMP14 activity for muscle cell migration and ECM remodeling, which are particularly important for muscle regeneration and growth [63]. In our study, we observed the down-regulation of mmp14b by IGF1 in silico (Figure 6A,C), in vitro (Figure 8A) and in vivo re-fed pacus (Figure 8B). Although controversial, these results make sense considering that IGF1 mainly enriched processes related to IGF/PI3K signaling, and not myogenic mechanisms. In fact, mmp14b was up-regulated in the AA transcriptome (Figure 6C). As discussed, IGF1 treatment was possibly less effective as a pro-growth condition compared to the AA group, suggesting that the cells were focusing on protein turnover rather than muscle proliferation and differentiation. On the other hand, miR-338-5p was up-regulated by IGF1 in in silico (Figure 5A,C), in vitro (Figure 8G) and in vivo re-fed pacus (Figure 8H). To the best of our knowledge, no study has evaluated this miRNA in fish skeletal muscle. Lei et al. (2017) have shown roles of miR-338-5p in suppressing the proliferation and migration of glioblastoma cells through the inhibition of EFEMP1, a regulator of matrix metalloproteinases [93], and Nielsen et al. (2014) observed an up-regulation of miR-338-3p in circulation after 1 h of acute exercise [94], allowing us to draw a parallel with the pro-growth effect of IGF1.
For a deeper understanding of our in silico results, we also evaluated the expression of other de-regulated genes that showed an interaction with mmp14b and could also be regulated by miR-338-5p. In association with mmp14b, we found the decreased expression of fbxo25 and tgfbr2 after the pro-growth stimuli, both in vitro and in vivo (Figure 8C–F). The FBXO25 is classified as an E3 ubiquitin ligase with high homology to FBXO32 in fish [95]. We previously demonstrated the increased expression of fbxo25 during fasting and down-regulation during re-feeding in pacu muscle and cultured cells [42,96], and this same molecular scenario was observed in fasted and re-fed rainbow trout [97]. In the present work, a pronounced reduction in fbxo25 expression was observed in IGF1, indicating that the protein breakdown should be stopped, so that anabolism and muscle growth take place in the treatment. The TGFB pathway and its downstream components are well known as myogenic inhibitors, with MSTN (myostatin) widely studied in fish muscle development [98]. The TGFB signaling starts with the binding of the ligand to type 1 and 2 membrane receptors, forcing their assembly into a complex that initiates the phosphorylation cascade [99]. In this sense, the activation of tgfbr2 was associated with myod and myog down-regulation in C2C12 cells, and the tgfbr2 inhibition by miRNA resulted in a reversed effect [100]. In addition, Accornero et al. (2014) showed that the blocking of TGFB signaling through TGFBR2 mutant attenuated muscular dystrophy and injury, and improved muscle regeneration and satellite cell numbers in mice [101], indicating a negative regulation by tgfbr2 in muscle growth. In the present work, the down-regulation of tgfbr2, both in vitro and in vivo, demonstrates that the suppression of TGFB signaling may be necessary for fish muscle growth regulated by IGF1. Our results suggest that IGF1-induced the expression of miR-338-5p, which possibly decreased the expression of mmp14b, fbxo25 and tgfbr2, resulting in positive effects for protein synthesis and anabolism, but supressing the progression of myogenesis to avoid excessive cell energy expenditure.

4. Materials and Methods

4.1. Fish and Sample Collection

All experiments and procedures were performed in accordance with the Ethical Principles in Animal Research adopted by the National Council for the Control of Animal Experimentation (CONCEA). The protocol was approved by the Ethics Committee on Animal Use of the Institute of Biosciences, São Paulo State University (UNESP), Botucatu (protocol number 1184; 14 June 2019) and of the Federal University of Goiás (UFG), Goiânia (protocol number MB 026/21; 20 April 2021). The experiments were also conducted following the ARRIVE guidelines [102].
Fish were farmed at 28 °C under 12 h light:12 h dark photoperiod in storage tanks of 0.5 m3 equipped with water circulation system. For in vitro experiments, juvenile pacus (5–20 g, n = 20 per culture) were fed ad libitum once a day with a commercial diet, remaining 24 h in fasting before the experiments. For in vivo experiments, juvenile pacus (10–15 g, n = 6 per group) were submitted to fasting/re-feeding protocol, with a commercial diet. Fast-twitch muscles were collected from the epaxial region before the fasting protocol (Day 0), after 4 days of fasting (Day 4), and after 3 days of re-feeding (Day 3). All fish were euthanized with an excess of benzocaine (≥250 mg/L; Sigma-Aldrich, St. Louis, MO, USA) prior to body weight (g) measuring and muscle collection.

4.2. Isolation and Myoblast Cell Cultures

The myoblasts were isolated and cultured according to the protocol described by Fauconneau and Paboeuf (2000) [103]. The fast-twitch muscles were collected from the epaxial region and mechanically dissociated with scalpels. To release the muscle cells, the fragments were enzymatically digested with 0.2% collagenase type I (C9891) and 0.1% trypsin (T4799) (Sigma-Aldrich, St. Louis, MO, USA). The cell suspension was filtered in cell strainers (Corning, New York, NY, USA), allowing for the removal of debris, centrifuged, and the cell pellet was resuspended in DMEM medium (DMEM (D7777), 9 mM NaHCO3 (S5761), 20 mM HEPES (H3375), pH 7.4), with 1% antibiotics (A5955) and 10% fetal bovine serum (F7524) (Sigma-Aldrich, St. Louis, MO, USA). The cells were diluted at a concentration of 2 × 10⁶ cells/mL and plated in 6-wells plates, previously treated with poly-L-lysine (P6282) and laminin (L2020) (Sigma-Aldrich, St. Louis, MO, USA), which have high affinity for the myoblasts. The myoblasts were incubated at 28 °C, with the medium changed every day, and the myoblasts morphology was monitored regularly under a microscope (Olympus, Tokyo, Japan). The results were achieved from 3 independent cell cultures.

4.3. Amino Acids and IGF1 Treatments

After 8 days of cell culture (myotube formation), cells were incubated for 12 h with free amino acid medium (Earle’s balance salt solution 1× (E7510), 9 mM NaHCO3, 20 mM HEPES, Vitamin Mix 1× (M6895), 1% antibiotics and 4 g/L D-glucose (G8270)—Sigma-Aldrich, St. Louis, MO, USA) to reduce gene expression to basal levels. The pacu myotubes were incubated for additional 24 h in free amino acid medium (CTR group), medium with amino acids (AA group) (DMEM, 9 mM NaHCO3, 20 mM HEPES and 1% antibiotics—Sigma-Aldrich, St. Louis, MO, USA), or medium with recombinant IGF1 (IGF1 group) (free amino acid medium supplemented with IGF1 from gilthead sea bream at 100 ng/mL—ProSpec, Rehovot, Israel). The treatments were performed according to the protocol described by Bower and Johnston (2010) and Garcia de la serrana and Johnston (2013) [13,14]. Although minor differences, the final media composition between the groups differed, essentially with respect to the presence of amino acids or IGF1.

4.4. RNA Extraction and Sequencing

Total RNA was extracted from the myotubes immediately after the treatments, using TRIzol® Reagent (Thermo Fisher Scientific, Waltham, MA, USA), following the manufacturer’s guidelines. RNA quantification and purity were estimated by spectrophotometry using 260/280 and 260/230 ratios (NanoVue™ Plus GE Healthcare, Chicago, IL, USA), and only samples with ratios >2.0 were used. The RNA integrity was evaluated through capillary electrophoresis using the 2100 Bioanalyzer System (Agilent, Santa Clara, CA, USA), and samples with RNA integrity number (RIN) >9.5 were used.
The generation of DNA libraries and sequencing of mRNAs and miRNAs were performed by LC Sciences (Houston, TX, USA). Transcriptome was obtained through the NovaSeq 6000 platform (Illumina, San Diego, CA, USA) with 150 base pairs, paired-end, and 6 GB data per sample. microRNAome was obtained through the HiSeq 4000 platform (Illumina, San Diego, CA, USA) with 50 base pairs, single-end, and 7–10 million reads per sample. The resulting large-scale sequencing data were processed through the GNU/Linux operating system, based on the Linux Mint 18.1 distribution (www.linuxmint.com, accessed on 3 May 2020).

4.5. Transcriptome and microRNAome Analyses

The quality of the sequencing was evaluated through the software FastQC version 0.11.8 (www.bioinformatics.babraham.ac.uk/projects/fastqc, accessed on 3 May 2020), and the software Trimmomatic [104] was used for adapters removal and filtering of the reads by quality, using a phred score >33. Considering the mature miRNA size (~22 nucleotides), only reads more than 17 nucleotides in length were maintained for the microRNAome.
For the transcriptome, the paired-end reads were de novo assembled using the Trinity software [105,106], and the contigs were annotated using Basic Local Alignment Search Tool (BLAST) [107] and OmicsBox software (version 1.4.12, BioBam Bioinformatics; https://www.biobam.com/omicsbox, accessed on 3 May 2020). Sequences were blasted against the Ostariophysi fish proteome database (Astyanax mexicanus, Danio rerio and Pygocentrus nattereri) and downloaded from the Ensembl Genome Browser 89 (http://www.ensembl.org/index.html, accessed on 3 May 2020), using BLASTx with an e-value cut-off of 10−3. The annotated transcriptome was used to map the contigs for each sample, using the Bowtie2 aligner [108]. For the microRNAome, the Bowtie2 aligner was used for the annotation and mapping steps based on the mature miRNA list of teleost fish (Astatotilapia burtoni, Cyprinus carpio, Danio rerio, Takifugu rubripes, Gadus morhua, Ictalurus punctatus, Metriaclima zebra, Neolamprologus brichardi, Oryzias latipes, Oreochromis niloticus, Pundamilia nyererei, Salmo salar and Tetraodon nigroviridis) available in miRBase version 22.1 (www.mirbase.org, accessed on 3 May 2020), allowing us to obtain an expression profile of known miRNAs.
Tables with the contig counts were submitted to differential expression analyses using the Bioconductor/R software with the DESeq2 package [109,110]. Genes and miRNAs counts were normalized by the median of the ratios method, with the counts divided by sample-specific size factors. Considering the number of counts between the samples, only genes and miRNAs with counts mean ≥10 were maintained. The genes were considered differentially expressed with adjusted p-value ≤ 0.05 and Log2(Fold-change) ≤−1 and ≥1 (2-fold). The miRNAs were considered differentially expressed with adjusted p-value ≤ 0.05 and Log2(Fold-change) ≤−0.55 and ≥0.55 (1.5-fold). All the raw and processed data of transcriptome and microRNAome analyses are available in the Gene Expression Omnibus (GEO) DataSets under the accession number GSE192683.

4.6. Principal Component Analysis, Heatmap, Venn Diagram and Gene Ontology Enrichment Analysis

A principal component analysis (PCA) related to gene and miRNAs analysis was performed using the number of normalized counts in log2 scale in Bioconductor/R software with the DESeq2 package [109,110]. The heatmap was created using Morpheus software (https://software.broadinstitute.org/morpheus, accessed on 18 August 2020) [111] with the normalized number of counts in the transcriptome. The hierarchical clustering was performed using one minus Pearson correlation as a metric and average linkage method. Non-hierarchical K-means clustering, obtained using the same metric, was used to better define different clusters of genes among the expression data. The Venn diagram was obtained in the Venny 2.1 software (https://bioinfogp.cnb.csic.es/tools/venny/index.html, accessed on 18 August 2020) and used to show sets of DEGs appearing in one or both AA vs. CTR and IGF1 vs. CTR comparisons. A gene ontology (GO) enrichment analysis was performed using the FishEnrichr database [112,113]. Up- and down-regulated genes were used to identify over-represented gene ontology terms of biological processes based on the annotation for Danio rerio. The Fisher exact was used as test type and, for each comparison, we considered the 10–15 most enriched terms according to the highest scores and lowest p-values (≤0.05).

4.7. miRNA target Prediction and Interaction Molecular Networks

The prediction of target mRNAs of the differentially expressed miRNAs was performed using TargetScanFish 6.2 [114], by searching for the presence of 8mer and 7mer sites that match the seed region of each miRNA. Interaction molecular networks were generated with the Cytoscape software [115], based on the Danio rerio annotation, using the GeneMANIA plugin [116], in order to show the level of the relationship between genes and miRNA, and the potential altered signaling pathways.
The miRNA target predictions were further evaluated by computational approaches, using the TransDecoder version 5.5.0 software [106] to identify the open reading frame and the ExUTR version 0.1.0 [117] to extract the 3′ untranslated regions of the mRNAs’ sequences. RNAhybrid version 2.1.2 [118] was used with the default parameters to predict miRNA target interaction, providing the minimum free energy (MFE) of hybridization and potential binding sites through nucleotide base complementarity. We selected miRNA target interactions with MFE ≤ −25 kcal/mol. In addition, we used the number of counts to analyze the correlation between miRNAs and genes that are well-validated according to the literature. The correlation index and statistical significance between miRNA and their targets were estimated using a Pearson correlation test, and the graphs were constructed using the ggplot2 R package [119].

4.8. Genes and miRNAs Validation by qPCR

For qPCR validation, we selected genes and miRNAs from the molecular networks which showed better MFE values of hybridization. We used cultured pacu myotubes kept in free amino acid medium, treated with amino acids or IGF1, as described (in vitro samples; n = 4), and pacu skeletal muscles before fasting, after 4 days of fasting and 3 days of re-feeding (in vivo samples; n = 6). Extracted RNA was treated with DNase I, Amplification Grade (Thermo Fisher Scientific, Waltham, MA, USA) to eliminate any possible contaminating genomic DNA from the samples, and reverse-transcribed using the High-Capacity cDNA Archive Kit (Thermo Fisher Scientific, Waltham, MA, USA). For miRNA expression, each cDNA was amplified using the TaqMan® Universal PCR Master Mix (Thermo Fisher Scientific, Waltham, MA, USA) and the TaqMan® MicroRNA Assays (Thermo Fisher Scientific, Waltham, MA, USA), which contains primers and specific probes to miR-29b, miR-338-5p and U6 snRNA (U6 small nuclear RNA). For the marcksb (myristoylated alanine rich protein kinase C substrate b), mycn (n-myc proto-oncogene protein), mmp14b (matrix metallopeptidase 14b), fbxo25 (f-box protein 25), tgfbr2 (tgf-beta receptor type-2), ppia (peptidylprolyl isomerase a) and rpl13 (ribosomal protein l13) mRNAs, each cDNA was amplified using the GoTaq® qPCR Master Mix (Promega, Madison, WI, USA) and primers synthesized by Exxtend (Paulínia, Brazil). The primers were designed to work at 60 °C and amplify 50–200 bp regions, expanding exon–exon boundaries when possible, using Primer3 [120]. Potential hairpins, self-dimers or cross-dimers were estimated using NetPrimer software (Premier Biosoft, San Francisco, CA, USA). All qPCR were compliant with the Minimum Information for Publication of Quantitative Real Time (MIQE) guidelines [121]. The reactions were performed in duplicate, with the following conditions: 95 °C 10 min, 40 cycles at 95 °C 15 s and 65 °C 1 min, in a QuantStudioTM 12K Flex Real-Time PCR System (Thermo Fisher Scientific, Waltham, MA, USA). Primer specificity was confirmed by the presence of a single-peak dissociation curve. Relative expression was estimated using the 2−∆∆Ct method [122]. The U6 snRNA, ppia and rpl13 were selected for the normalization of expression after their stability was tested through geNorm software [123]. Statistical analyses were performed using GraphPad Prism 5 Software, as well as the construction of graphs. After a Kolmogorov–Smirnov normality test, parametric data were further analyzed by a one-way ANOVA test, followed by Tukey’s multiple comparisons test, while non-parametric data were analyzed by Kruskal–Wallis test, followed by Dunn’s multiple comparisons test. In addition, we used the fold-change values (both in vitro and in vivo experiments) to analyze and confirm the correlation between marcksb/miR-29b and mmp14b/miR-338-5p. Correlation index and statistical significance between miRNA and their targets were estimated using a Pearson correlation test, and the graphs were constructed using the ggplot2 R package [119].

5. Conclusions

We obtained transcriptomic and microRNAomic data from pacu-cultured myotubes submitted to AA and IGF1 treatments. These pro-growth inputs modulated different sets of genes, and AA seems to be more effective, giving the higher number of differentially expressed genes and miRNAs. In addition, AA treatment enriched processes related to chromosomal alteration/cell mitosis and muscle differentiation, while IGF1 modulated upstream PI3K signaling, and needed to stimulate amino acids metabolism to induce muscle growth. The AA samples also showed the up-regulation of muscle-specific miRNAs, which appeared to be involved in myogenic events, especially miR-1, -133 and -206.
In addition, both AA and IGF1 down-regulated igfbp1a and up-regulated igfbp5a, interesting genes, of which the transcriptions are modulated independently of the growth treatment. These genes represent potential molecular markers and excellent candidates to be evaluated in different conditions of muscle growth, including the gain and/or loss of function assays and other customized molecular techniques. Moreover, we identified networks linking marcksb and miR-29b in AA myotubes, and mmp14b and miR-338-5p in IGF1-treated cells. These genes and miRNAs were involved in fish myogenesis and muscle growth, and could influence the way in which AA and IGF1 inputs regulate muscle physiology and metabolism.
Our results allowed the better understanding and new insights of fish muscle growth regulation by important pro-growth inputs. Together, these findings may support future research and contribute to improvements in aquaculture programs, aiming to increase muscle mass, enhance growth rate, and/or better feed conversion efficiency, as well as background information for the development and advancement of in vitro meat production.

Supplementary Materials

The following supporting information can be downloaded at: https://www.mdpi.com/article/10.3390/ijms23031180/s1.

Author Contributions

Conceptualization, B.O.S.D., B.T.T.Z., M.D.-P.-S. and D.G.d.l.s.; methodology, B.O.S.D., B.T.T.Z., E.S.P., E.A.M., J.B. and D.G.d.l.s.; validation, B.O.S.D., B.T.T.Z. and E.S.P.; formal analysis, B.O.S.D., B.T.T.Z., E.S.P., E.A.M., J.B. and D.G.d.l.s.; investigation, B.O.S.D., B.T.T.Z. and E.S.P.; resources, J.B., M.D.-P.-S. and D.G.d.l.s.; data curation, B.O.S.D., B.T.T.Z., M.D.-P.-S. and D.G.d.l.s.; writing—original draft preparation, B.O.S.D., B.T.T.Z., E.S.P., M.D.-P.-S. and D.G.d.l.s.; writing—review and editing, B.O.S.D., B.T.T.Z., E.S.P., E.A.M., J.B., M.D.-P.-S. and D.G.d.l.s.; visualization, B.O.S.D., B.T.T.Z., E.S.P., M.D.-P.-S. and D.G.d.l.s.; supervision, M.D.-P.-S. and D.G.d.l.s.; project administration, M.D.-P.-S. and D.G.d.l.s.; funding acquisition, B.O.S.D. and M.D.-P.-S. All authors have read and agreed to the published version of the manuscript.

Funding

This research was funded by the São Paulo Research Foundation (FAPESP) (https://fapesp.br/, accessed on 18 August 2020), grant numbers #2018/24575-6 and #2018/26428-0. This study was also financed by the National Council for Scientific and Technological Development (Conselho Nacional de Desenvolvimento Científico e Tecnológico; CNPq), grant numbers #306678/2021-7 and #403305/2021-7, and in part by the Coordenação de Aperfeiçoamento de Pessoal de Nível Superior–Brasil (CAPES)–Finance Code 001, grant number #88887.482392/2020-00. Funding was granted to B.O.S.D., B.T.T.Z. and M.D.-P.-S. D.G.d.l.s. is a Serra Húnter Tenure Track Lecturer.

Institutional Review Board Statement

All experiments and procedures were performed in accordance with the Ethical Principles in Animal Research adopted by the National Council for the Control of Animal Experimentation (CONCEA). The protocol was approved by the Ethics Committee on Animal Use of the Institute of Biosciences, São Paulo State University (UNESP), Botucatu (protocol number 1184; 14 June 2019) and of the Federal University of Goiás (UFG), Goiânia (protocol number MB 026/21; 20 April 2021).

Data Availability Statement

The raw and processed data of transcriptome and microRNAome analyses have been deposited on the Gene Expression Omnibus (GEO) DataSets, under the accession number GSE192683. All the produced data of the other analysis are contained within this article, or in the supplementary material.

Acknowledgments

We would like to thank the Institute of Biosciences at the São Paulo State University (UNESP), Botucatu, to host the present research in its laboratory facilities. We also thank Bruno Evaristo de Almeida Fantinatti for his valuable discussions. Daniel Garcia de la serrana is a Serra Húnter Tenure Track Lecturer.

Conflicts of Interest

The authors declare no conflict of interest. The funders had no role in the design of the study; in the collection, analyses, or interpretation of data; in the writing of the manuscript, or in the decision to publish the results.

References

  1. Johnston, I.A. Genetic and Environmental Determinants of Muscle Growth Patterns. In Muscle Development and Growth; Johnston, I.A., Ed.; Academic Press: Cambridge, MA, USA, 2001; pp. 141–186. [Google Scholar]
  2. Sänger, A.M.; Stoiber, W. Muscle fiber diversity and plasticity. In Muscle Development and Growth; Johnston, I.A., Ed.; Fish Physiology; Academic Press: Cambridge, MA, USA, 2001; pp. 187–250. [Google Scholar]
  3. Johnston, I.A. Environment and plasticity of myogenesis in teleost fish. J. Exp. Biol. 2006, 209, 2249–2264. [Google Scholar] [CrossRef] [PubMed] [Green Version]
  4. Sandri, M. Signaling in Muscle Atrophy and Hypertrophy. Physiology 2008, 23, 160–170. [Google Scholar] [CrossRef] [Green Version]
  5. Bonaldo, P.; Sandri, M. Cellular and molecular mechanisms of muscle atrophy. Dis. Model. Mech. 2013, 6, 25–39. [Google Scholar] [CrossRef] [Green Version]
  6. Glass, D.J. Skeletal muscle hypertrophy and atrophy signaling pathways. Int. J. Biochem. Cell Biol. 2005, 37, 1974–1984. [Google Scholar] [CrossRef] [PubMed]
  7. Johnston, I.A.; Bower, N.I.; Macqueen, D.J. Growth and the regulation of myotomal muscle mass in teleost fish. J. Exp. Biol. 2011, 214, 1617–1628. [Google Scholar] [CrossRef] [Green Version]
  8. Jiao, S.; Ren, H.; Li, Y.; Zhou, J.; Duan, C.; Lu, L. Differential regulation of IGF-I and IGF-II gene expression in skeletal muscle cells. Mol. Cell. Biochem. 2013, 373, 107–113. [Google Scholar] [CrossRef] [PubMed]
  9. Lawlor, M.A.; Rotwein, P. Coordinate control of muscle cell survival by distinct insulin-like growth factor activated signaling pathways. J. Cell Biol. 2000, 151, 1131–1140. [Google Scholar] [CrossRef] [Green Version]
  10. Zanou, N.; Gailly, P. Skeletal muscle hypertrophy and regeneration: Interplay between the myogenic regulatory factors (MRFs) and insulin-like growth factors (IGFs) pathways. Cell. Mol. Life Sci. 2013, 70, 4117–4130. [Google Scholar] [CrossRef] [PubMed]
  11. Seiliez, I.; Gabillard, J.-C.; Skiba-Cassy, S.; Garcia, S.D.; Gutierrez, J.; Kaushik, S.; Panserat, S.; Tesseraud, S. An in vivo and in vitro assessment of TOR signaling cascade in rainbow trout (Oncorhynchus mykiss). AJP Regul. Integr. Comp. Physiol. 2008, 295, R329–R335. [Google Scholar] [CrossRef] [Green Version]
  12. Vélez, E.J.; Lutfi, E.; Jiménez-Amilburu, V.; Riera-Codina, M.; Capilla, E.; Navarro, I.; Gutiérrez, J. IGF-I and amino acids effects through TOR signaling on proliferation and differentiation of gilthead sea bream cultured myocytes. Gen. Comp. Endocrinol. 2014, 205, 296–304. [Google Scholar] [CrossRef]
  13. Bower, N.I.; Johnston, I.A. Transcriptional regulation of the IGF signaling pathway by amino acids and insulin-like growth factors during myogenesis in Atlantic salmon. PLoS ONE 2010, 5, e11100. [Google Scholar] [CrossRef] [Green Version]
  14. Garcia, S.D.; Johnston, I.A. Expression of Heat Shock Protein (Hsp90) Paralogues Is Regulated by Amino Acids in Skeletal Muscle of Atlantic Salmon. PLoS ONE 2013, 8, e74295. [Google Scholar] [CrossRef] [Green Version]
  15. Bizuayehu, T.T.; Babiak, I. MicroRNA in Teleost Fish. Genome Biol. Evol. 2014, 6, 1911–1937. [Google Scholar] [CrossRef] [Green Version]
  16. Ge, Y.; Chen, J. MicroRNAs in skeletal myogenesis. Cell Cycle 2011, 10, 441–448. [Google Scholar] [CrossRef] [Green Version]
  17. Bartel, D.P.; Chen, C.-Z. Micromanagers of gene expression: The potentially widespread influence of metazoan microRNAs. Nat. Rev. Genet. 2004, 5, 396–400. [Google Scholar] [CrossRef] [PubMed]
  18. Filipowicz, W.; Bhattacharyya, S.N.; Sonenberg, N. Mechanisms of post-transcriptional regulation by microRNAs: Are the answers in sight? Nat. Rev. Genet. 2008, 9, 102–114. [Google Scholar] [CrossRef] [PubMed]
  19. Goljanek-Whysall, K.; Sweetman, D.; Münsterberg, A.E. microRNAs in skeletal muscle differentiation and disease. Clin. Sci. 2012, 123, 611–625. [Google Scholar] [CrossRef] [PubMed] [Green Version]
  20. van Rooij, E.; Liu, N.; Olson, E.N. MicroRNAs flex their muscles. Trends Genet. 2008, 24, 159–166. [Google Scholar] [CrossRef] [PubMed]
  21. Biyashev, D.; Veliceasa, D.; Topczewski, J.; Topczewska, J.M.; Mizgirev, I.; Vinokour, E.; Reddi, A.L.; Licht, J.D.; Revskoy, S.Y.; Volpert, O.V. miR-27b controls venous specification and tip cell fate. Blood 2012, 119, 2679–2687. [Google Scholar] [CrossRef] [Green Version]
  22. Flynt, A.S.; Thatcher, E.J.; Burkewitz, K.; Li, N.; Liu, Y.; Patton, J.G. miR-8 microRNAs regulate the response to osmotic stress in zebrafish embryos. J. Cell Biol. 2009, 185, 115–127. [Google Scholar] [CrossRef] [Green Version]
  23. Giraldez, A.J.; Mishima, Y.; Rihel, J.; Grocock, R.J.; Van Dongen, S.; Inoue, K.; Enright, A.J.; Schier, A.F. Zebrafish MiR-430 Promotes Deadenylation and Clearance of Maternal mRNAs. Science 2006, 312, 75–79. [Google Scholar] [CrossRef] [PubMed] [Green Version]
  24. Huang, C.W.; Li, Y.H.; Hu, S.Y.; Chi, J.R.; Lin, G.H.; Lin, C.C.; Gong, H.Y.; Chen, J.Y.; Chen, R.H.; Chang, S.J.; et al. Differential expression patterns of growth-related microRNAs in the skeletal muscle of Nile tilapia (Oreochromis niloticus). J. Anim. Sci. 2012, 90, 4266–4279. [Google Scholar] [CrossRef] [Green Version]
  25. Staton, A.A.; Knaut, H.; Giraldez, A.J. miRNA regulation of Sdf1 chemokine signaling provides genetic robustness to germ cell migration. Nat. Genet. 2011, 43, 204–211. [Google Scholar] [CrossRef] [Green Version]
  26. Wienholds, E.; Kloosterman, W.P.; Miska, E.; Alvarez-Saavedra, E.; Berezikov, E.; de Bruijn, E.; Horvitz, H.R.; Kauppinen, S.; Plasterk, R.H.A. MicroRNA Expression in Zebrafish Embryonic Development. Science 2005, 309, 310–311. [Google Scholar] [CrossRef] [Green Version]
  27. Yan, B.; Guo, J.-T.; Zhao, L.-H.; Zhao, J.-L. microRNA expression signature in skeletal muscle of Nile tilapia. Aquaculture 2012, 364–365, 240–246. [Google Scholar] [CrossRef]
  28. Yin, V.P.; Thomson, J.M.; Thummel, R.; Hyde, D.R.; Hammond, S.M.; Poss, K.D. Fgf-dependent depletion of microRNA-133 promotes appendage regeneration in zebrafish. Genes Dev. 2008, 22, 728–733. [Google Scholar] [CrossRef] [PubMed] [Green Version]
  29. Chen, J.-F.; Mandel, E.M.; Thomson, J.M.; Wu, Q.; Callis, T.E.; Hammond, S.M.; Conlon, F.L.; Wang, D.-Z. The role of microRNA-1 and microRNA-133 in skeletal muscle proliferation and differentiation. Nat. Genet. 2006, 38, 228–233. [Google Scholar] [CrossRef]
  30. Chen, J.-F.; Tao, Y.; Li, J.; Deng, Z.; Yan, Z.; Xiao, X.; Wang, D.-Z. microRNA-1 and microRNA-206 regulate skeletal muscle satellite cell proliferation and differentiation by repressing Pax7. J. Cell Biol. 2010, 190, 867–879. [Google Scholar] [CrossRef] [Green Version]
  31. McCarthy, J.J. The MyomiR network in skeletal muscle plasticity. Exerc. Sport Sci. Rev. 2011, 39, 150–154. [Google Scholar] [CrossRef] [PubMed]
  32. van Rooij, E.; Quiat, D.; Johnson, B.A.; Sutherland, L.B.; Qi, X.; Richardson, J.A.; Kelm, R.J.; Olson, E.N. A family of microRNAs encoded by myosin genes governs myosin expression and muscle performance. Dev. Cell 2009, 17, 662–673. [Google Scholar] [CrossRef] [Green Version]
  33. Bower, N.I.; Johnston, I.A. Paralogs of Atlantic salmon myoblast determination factor genes are distinctly regulated in proliferating and differentiating myogenic cells. AJP Regul. Integr. Comp. Physiol. 2010, 298, R1615–R1626. [Google Scholar] [CrossRef] [PubMed] [Green Version]
  34. Duran, B.O.S.; Fernandez, G.J.; Mareco, E.A.; Moraes, L.N.; Salomão, R.A.S.; Gutierrez de Paula, T.; Santos, V.B.; Carvalho, R.F.; Dal-Pai-Silva, M. Differential microRNA Expression in Fast- and Slow-Twitch Skeletal Muscle of Piaractus mesopotamicus during Growth. PLoS ONE 2015, 10, e0141967. [Google Scholar] [CrossRef]
  35. Duran, B.O.S.; Góes, G.A.; Zanella, B.T.T.; Freire, P.P.; Valente, J.S.; Salomão, R.A.S.; Fernandes, A.; Mareco, E.A.; Carvalho, R.F.; Dal-Pai-Silva, M. Ascorbic acid stimulates the in vitro myoblast proliferation and migration of pacu (Piaractus mesopotamicus). Sci. Rep. 2019, 9, 2229. [Google Scholar] [CrossRef] [PubMed]
  36. Duran, B.O.S.; Dal-Pai-Silva, M.; Garcia, S.D. Rainbow trout slow myoblast cell culture as a model to study slow skeletal muscle, and the characterization of mir-133 and mir-499 families as a case study. J. Exp. Biol. 2020, 223, jeb216390. [Google Scholar] [CrossRef]
  37. Froehlich, J.M.; Galt, N.J.; Charging, M.J.; Meyer, B.M.; Biga, P.R. In vitro indeterminate teleost myogenesis appears to be dependent on Pax3. In Vitro Cell. Dev. Biol. Anim. 2013, 49, 371–385. [Google Scholar] [CrossRef] [Green Version]
  38. Gabillard, J.C.; Sabin, N.; Paboeuf, G. In vitro characterization of proliferation and differentiation of trout satellite cells. Cell Tissue Res. 2010, 342, 471–477. [Google Scholar] [CrossRef] [PubMed]
  39. Garcia, S.D.; Codina, M.; Capilla, E.; Jiménez-Amilburu, V.; Navarro, I.; Du, S.-J.; Johnston, I.A.; Gutiérrez, J. Characterisation and expression of myogenesis regulatory factors during in vitro myoblast development and in vivo fasting in the gilthead sea bream (Sparus aurata). Comp. Biochem. Physiol. Part A Mol. Integr. Physiol. 2014, 167, 90–99. [Google Scholar] [CrossRef]
  40. Seiliez, I.; Sabin, N.; Gabillard, J.-C. Myostatin inhibits proliferation but not differentiation of trout myoblasts. Mol. Cell. Endocrinol. 2012, 351, 220–226. [Google Scholar] [CrossRef]
  41. Vélez, E.J.; Lutfi, E.; Azizi, S.; Montserrat, N.; Riera-Codina, M.; Capilla, E.; Navarro, I.; Gutiérrez, J. Contribution of in vitro myocytes studies to understanding fish muscle physiology. Comp. Biochem. Physiol. Part B Biochem. Mol. Biol. 2016, 199, 67–73. [Google Scholar] [CrossRef]
  42. Zanella, B.T.T.; Magiore, I.C.; Duran, B.O.S.; Pereira, G.G.; Vicente, I.S.T.; Carvalho, P.L.P.F.; Salomão, R.A.S.; Mareco, E.A.; Carvalho, R.F.; Gutierrez de Paula, T.; et al. Ascorbic acid supplementation improves skeletal muscle growth in pacu (Piaractus mesopotamicus) juveniles: In vivo and in vitro studies. Int. J. Mol. Sci. 2021, 22, 2995. [Google Scholar] [CrossRef]
  43. Castillo, J.; Codina, M.; Martínez, M.L.; Navarro, I.; Gutiérrez, J. Metabolic and mitogenic effects of IGF-I and insulin on muscle cells of rainbow trout. Am. J. Physiol. Integr. Comp. Physiol. 2004, 286, R935–R941. [Google Scholar] [CrossRef] [PubMed]
  44. Cleveland, B.M.; Weber, G.M. Effects of insulin-like growth factor-I, insulin, and leucine on protein turnover and ubiquitin ligase expression in rainbow trout primary myocytes. Am. J. Physiol. Integr. Comp. Physiol. 2010, 298, R341–R350. [Google Scholar] [CrossRef] [PubMed] [Green Version]
  45. Latimer, M.; Sabin, N.; Cam, A.L.; Seiliez, I.; Biga, P.; Gabillard, J.C. miR-210 expression is associated with methionine-induced differentiation of trout satellite cells. J. Exp. Biol. 2017, 220, 2932–2938. [Google Scholar] [CrossRef] [Green Version]
  46. Qian, X.; Ba, Y.; Zhuang, Q.; Zhong, G. RNA-Seq Technology and Its Application in Fish Transcriptomics. Omi. A J. Integr. Biol. 2014, 18, 98–110. [Google Scholar] [CrossRef] [Green Version]
  47. Amaral, I.P.G.; Johnston, I.A. Insulin-like growth factor (IGF) signalling and genome-wide transcriptional regulation in fast muscle of zebrafish following a single-satiating meal. J. Exp. Biol. 2011, 214, 2125–2139. [Google Scholar] [CrossRef] [Green Version]
  48. Bower, N.I.; Garcia, S.D.; Johnston, I.A. Characterisation and differential regulation of MAFbx/Atrogin-1 α and β transcripts in skeletal muscle of Atlantic salmon (Salmo salar). Biochem. Biophys. Res. Commun. 2010, 396, 265–271. [Google Scholar] [CrossRef]
  49. Garcia, S.D.; Vieira, V.L.A.; Andree, K.B.; Darias, M.; Estévez, A.; Gisbert, E.; Johnston, I.A. Development Temperature Has Persistent Effects on Muscle Growth Responses in Gilthead Sea Bream. PLoS ONE 2012, 7, e51884. [Google Scholar] [CrossRef] [Green Version]
  50. Seiliez, I.; Médale, F.; Aguirre, P.; Larquier, M.; Lanneretonne, L.; Alami-Durante, H.; Panserat, S.; Skiba-Cassy, S. Postprandial regulation of growth- and metabolism-related factors in zebrafish. Zebrafish 2013, 10, 237–248. [Google Scholar] [CrossRef] [Green Version]
  51. Almeida, F.L.A.; Pessotti, N.S.; Pinhal, D.; Padovani, C.R.; de Leitão, N.J.; Carvalho, R.F.; Martins, C.; Portella, M.C.; Dal Pai-Silva, M. Quantitative expression of myogenic regulatory factors MyoD and myogenin in pacu (Piaractus mesopotamicus) skeletal muscle during growth. Micron 2010, 41, 997–1004. [Google Scholar] [CrossRef]
  52. Ganassi, M.; Badodi, S.; Quiroga, H.P.O.; Zammit, P.S.; Hinits, Y.; Hughes, S.M. Myogenin promotes myocyte fusion to balance fibre number and size. Nat. Commun. 2018, 9, 1–17. [Google Scholar] [CrossRef] [PubMed] [Green Version]
  53. Johansen, K.A.; Overturf, K. Quantitative expression analysis of genes affecting muscle growth during development of rainbow trout (Oncorhynchus mykiss). Mar. Biotechnol. 2005, 7, 576–587. [Google Scholar] [CrossRef]
  54. Zammit, P.S. Function of the myogenic regulatory factors Myf5, MyoD, Myogenin and MRF4 in skeletal muscle, satellite cells and regenerative myogenesis. Semin. Cell Dev. Biol. 2017, 72, 19–32. [Google Scholar] [CrossRef]
  55. Amri, M.E.; Fitzgerald, U.; Schlosser, G. MARCKS and MARCKS-like proteins in development and regeneration. J. Biomed. Sci. 2018, 25, 43. [Google Scholar] [CrossRef]
  56. Disatnik, M.H.; Boutet, S.C.; Pacio, W.; Chan, A.Y.; Ross, L.B.; Lee, C.H.; Rando, T.A. The bi-directional translocation of MARCKS between membrane and cytosol regulates integrin-mediated muscle cell spreading. J. Cell Sci. 2004, 117, 4469–4479. [Google Scholar] [CrossRef] [PubMed] [Green Version]
  57. Kim, S.S.; Kim, J.H.; Kim, H.S.; Park, D.E.; Chung, C.H. Involvement of the theta-type protein kinase C in translocation of myristoylated alanine-rich C kinase substrate (MARCKS) during myogenesis of chick embryonic myoblasts. Biochem. J. 2000, 347, 139. [Google Scholar] [CrossRef]
  58. Kim, S.S.; Kim, J.H.; Lee, S.H.; Chung, S.S.; Bang, O.S.; Park, D.; Chung, C.H. Involvement of protein phosphatase-1-mediated MARCKS translocation in myogenic differentiation of embryonic muscle cells. J. Cell Sci. 2002, 115, 2465–2473. [Google Scholar] [CrossRef] [PubMed]
  59. Ott, L.E.; Mcdowell, Z.T.; Turner, P.M.; Law, J.M.; Adler, K.B.; Yoder, J.A.; Jones, S.L. Two myristoylated alanine-rich C-kinase substrate (MARCKS) paralogs are required for normal development in zebrafish. Anat. Rec. 2011, 294, 1511–1524. [Google Scholar] [CrossRef] [Green Version]
  60. Poussard, S.; Dulong, S.; Aragon, B.; Brustis, J.J.; Veschambre, P.; Ducastaing, A.; Cottin, P. Evidence for a MARCKS-PKCalpha complex in skeletal muscle. Int. J. Biochem. Cell Biol. 2001, 33, 711–721. [Google Scholar] [CrossRef]
  61. Lund, D.K.; Mouly, V.; Cornelison, D.D.W. MMP-14 is necessary but not sufficient for invasion of three-dimensional collagen by human muscle satellite cells. Am. J. Physiol. Cell Physiol. 2014, 307, C140–C149. [Google Scholar] [CrossRef] [PubMed]
  62. Ohtake, Y.; Tojo, H.; Seiki, M. Multifunctional roles of MT1-MMP in myofiber formation and morphostatic maintenance of skeletal muscle. J. Cell Sci. 2006, 119, 3822–3832. [Google Scholar] [CrossRef] [Green Version]
  63. Snyman, C.; Niesler, C.U. MMP-14 in skeletal muscle repair. J. Muscle Res. Cell Motil. 2015, 36, 215–225. [Google Scholar] [CrossRef]
  64. Taylor, S.H.; Yeung, C.Y.C.; Kalson, N.S.; Lu, Y.; Zigrino, P.; Starborg, T.; Warwood, S.; Holmes, D.F.; Canty-Laird, E.G.; Mauch, C.; et al. Matrix metalloproteinase 14 is required for fibrous tissue expansion. Elife 2015, 4, e09345. [Google Scholar] [CrossRef]
  65. Castillo, J.; Ammendrup-Johnsen, I.; Codina, M.; Navarro, I.; Gutiérrez, J. IGF-I and insulin receptor signal transduction in trout muscle cells. Am. J. Physiol. Integr. Comp. Physiol. 2006, 290, R1683–R1690. [Google Scholar] [CrossRef] [PubMed] [Green Version]
  66. Díaz, M.; Vraskou, Y.; Gutiérrez, J.; Planas, J.V. Expression of rainbow trout glucose transporters GLUT1 and GLUT4 during in vitro muscle cell differentiation and regulation by insulin and IGF-I. Am. J. Physiol. Integr. Comp. Physiol. 2009, 296, R794–R800. [Google Scholar] [CrossRef] [Green Version]
  67. Seiliez, I.; Gabillard, J.C.; Riflade, M.; Sadoul, B.; Dias, K.; Avérous, J.; Tesseraud, S.; Skiba, S.; Panserat, S. Amino acids downregulate the expression of several autophagy-related genes in rainbow trout myoblasts. Autophagy 2012, 8, 364–375. [Google Scholar] [CrossRef] [PubMed]
  68. Vélez, E.J.; Azizi, S.; Verheyden, D.; Salmerón, C.; Lutfi, E.; Sánchez-Moya, A.; Navarro, I.; Gutiérrez, J.; Capilla, E. Proteolytic systems’ expression during myogenesis and transcriptional regulation by amino acids in gilthead sea bream cultured muscle cells. PLoS ONE 2017, 12, e0187339. [Google Scholar] [CrossRef]
  69. Cleveland, B.M.; Radler, L.M. Essential amino acids exhibit variable effects on protein degradation in rainbow trout (Oncorhynchus mykiss) primary myocytes. Comp. Biochem. Physiol. A Mol. Integr. Physiol. 2019, 229, 33–39. [Google Scholar] [CrossRef]
  70. Azizi, S.; Nematollahi, M.A.; Amiri, B.M.; Vélez, E.J.; Lutfi, E.; Navarro, I.; Capilla, E.; Gutiérrez, J. Lysine and Leucine Deficiencies Affect Myocytes Development and IGF Signaling in Gilthead Sea Bream (Sparus aurata). PLoS ONE 2016, 11, e0147618. [Google Scholar] [CrossRef] [Green Version]
  71. Garcia, S.D.; Fuentes, E.N.; Martin, S.A.M.; Johnston, I.A.; Macqueen, D.J. Divergent regulation of insulin-like growth factor binding protein genes in cultured Atlantic salmon myotubes under different models of catabolism and anabolism. Gen. Comp. Endocrinol. 2017, 247, 53–65. [Google Scholar] [CrossRef]
  72. Garcia, S.D.; Macqueen, D.J. Insulin-Like Growth Factor-Binding Proteins of Teleost Fishes. Front. Endocrinol. 2018, 9, 1. [Google Scholar] [CrossRef]
  73. Kajimura, S.; Duan, C. Insulin-like growth factor-binding protein-1: An evolutionarily conserved fine tuner of insulin-like growth factor action under catabolic and stressful conditions. J. Fish Biol. 2007, 71, 309–325. [Google Scholar] [CrossRef] [Green Version]
  74. Kamei, H.; Lu, L.; Jiao, S.; Li, Y.; Gyrup, C.; Laursen, L.S.; Oxvig, C.; Zhou, J.; Duan, C. Duplication and diversification of the hypoxia-inducible IGFBP-1 gene in zebrafish. PLoS ONE 2008, 3, e3091. [Google Scholar] [CrossRef] [Green Version]
  75. Maures, T.J.; Duan, C. Structure, developmental expression, and physiological regulation of zebrafish IGF binding protein-1. Endocrinology 2002, 143, 2722–2731. [Google Scholar] [CrossRef] [PubMed]
  76. Rolland, M.; Dalsgaard, J.; Holm, J.; Gómez-Requeni, P.; Skov, P.V. Dietary methionine level affects growth performance and hepatic gene expression of GH-IGF system and protein turnover regulators in rainbow trout (Oncorhynchus mykiss) fed plant protein-based diets. Comp. Biochem. Physiol. B Biochem. Mol. Biol. 2015, 181, 33–41. [Google Scholar] [CrossRef] [PubMed]
  77. Breves, J.P.; Fujimoto, C.K.; Phipps-Costin, S.K.; Einarsdottir, I.E.; Björnsson, B.T.; McCormick, S.D. Variation in branchial expression among insulin-like growth-factor binding proteins (igfbps) during Atlantic salmon smoltification and seawater exposure. BMC Physiol. 2017, 17, 2. [Google Scholar] [CrossRef] [Green Version]
  78. Dai, W.; Bai, Y.; Hebda, L.; Zhong, X.; Liu, J.; Kao, J.; Duan, C. Calcium deficiency-induced and TRP channel-regulated IGF1R-PI3K-Akt signaling regulates abnormal epithelial cell proliferation. Cell Death Differ. 2014, 21, 568–581. [Google Scholar] [CrossRef] [Green Version]
  79. Kusakabe, M.; Ishikawa, A.; Ravinet, M.; Yoshida, K.; Makino, T.; Toyoda, A.; Fujiyama, A.; Kitano, J. Genetic basis for variation in salinity tolerance between stickleback ecotypes. Mol. Ecol. 2017, 26, 304–319. [Google Scholar] [CrossRef] [Green Version]
  80. Azizi, S.; Nematollahi, M.A.; Amiri, B.M.; Vélez, E.J.; Salmerón, C.; Chan, S.J.; Navarro, I.; Capilla, E.; Gutiérrez, J. IGF-I and IGF-II effects on local IGF system and signaling pathways in gilthead sea bream (Sparus aurata) cultured myocytes. Gen. Comp. Endocrinol. 2016, 232, 7–16. [Google Scholar] [CrossRef]
  81. Wood, A.W.; Duan, C.; Bern, H.A. Insulin-Like Growth Factor Signaling in Fish. Int. Rev. Cytol. 2005, 243, 215–285. [Google Scholar] [CrossRef]
  82. Glass, D.J. PI3 Kinase Regulation of Skeletal Muscle Hypertrophy and Atrophy. Curr. Top. Microbiol. Immunol. 2010, 346, 267–278. [Google Scholar] [CrossRef]
  83. Kim, E. Mechanisms of amino acid sensing in mTOR signaling pathway. Nutr. Res. Pract. 2009, 3, 64. [Google Scholar] [CrossRef] [Green Version]
  84. Meijer, A.J. Amino acids as regulators and components of nonproteinogenic pathways. J. Nutr. 2003, 133, 2057S–2062S. [Google Scholar] [CrossRef] [PubMed]
  85. Hitachi, K.; Tsuchida, K. Role of microRNAs in skeletal muscle hypertrophy. Front. Physiol. 2014, 4, 408. [Google Scholar] [CrossRef] [Green Version]
  86. Wang, X.H. MicroRNA in myogenesis and muscle atrophy. Curr. Opin. Clin. Nutr. Metab. Care 2013, 16, 258–266. [Google Scholar] [CrossRef] [Green Version]
  87. Nachtigall, P.G.; Dias, M.C.; Carvalho, R.F.; Martins, C.; Pinhal, D. MicroRNA-499 expression distinctively correlates to target genes sox6 and rod1 profiles to resolve the skeletal muscle phenotype in Nile tilapia. PLoS ONE 2015, 10, e0119804. [Google Scholar] [CrossRef] [Green Version]
  88. Wang, X.; Ono, Y.; Tan, S.C.; Chai, R.J.; Parkin, C.; Ingham, P.W. Prdm1a and miR-499 act sequentially to restrict Sox6 activity to the fast-twitch muscle lineage in the zebrafish embryo. Development 2011, 138, 4399–4404. [Google Scholar] [CrossRef] [Green Version]
  89. Yarmola, E.G.; Edison, A.S.; Lenox, R.H.; Bubb, M.R. Actin Filament Cross-linking by MARCKS: Characterization of two actin-binding sites within the phosphorylation site domain. J. Biol. Chem. 2001, 276, 22351–22358. [Google Scholar] [CrossRef] [PubMed] [Green Version]
  90. Li, J.; Chan, M.C.; Yu, Y.; Bei, Y.; Chen, P.; Zhou, Q.; Cheng, L.; Chen, L.; Ziegler, O.; Rowe, G.C.; et al. miR-29b contributes to multiple types of muscle atrophy. Nat. Commun. 2017, 8, 1–15. [Google Scholar] [CrossRef] [Green Version]
  91. Li, J.; Wang, L.; Hua, X.; Tang, H.; Chen, R.; Yang, T.; Das, S.; Xiao, J. CRISPR/Cas9-Mediated miR-29b Editing as a Treatment of Different Types of Muscle Atrophy in Mice. Mol. Ther. 2020, 28, 1359–1372. [Google Scholar] [CrossRef] [PubMed] [Green Version]
  92. Pandey, P.R.; Chatterjee, B.; Olanich, M.E.; Khan, J.; Miettinen, M.M.; Hewitt, S.M.; Barr, F.G. PAX3-FOXO1 is essential for tumour initiation and maintenance but not recurrence in a human myoblast model of rhabdomyosarcoma. J. Pathol. 2017, 241, 626–637. [Google Scholar] [CrossRef] [Green Version]
  93. Lei, D.; Zhang, F.; Yao, D.; Xiong, N.; Jiang, X.; Zhao, H. MiR-338-5p suppresses proliferation, migration, invasion, and promote apoptosis of glioblastoma cells by directly targeting EFEMP1. Biomed. Pharmacother. 2017, 89, 957–965. [Google Scholar] [CrossRef] [PubMed]
  94. Nielsen, S.; Åkerström, T.; Rinnov, A.; Yfanti, C.; Scheele, C.; Pedersen, B.K.; Laye, M.J. The miRNA plasma signature in response to acute aerobic exercise and endurance training. PLoS ONE 2014, 9, e87308. [Google Scholar] [CrossRef]
  95. Tacchi, L.; Bickerdike, R.; Secombes, C.J.; Pooley, N.J.; Urquhart, K.L.; Collet, B.; Martin, S.A.M. Ubiquitin E3 ligase atrogin-1 (Fbox-32) in Atlantic salmon (Salmo salar): Sequence analysis, genomic structure and modulation of expression. Comp. Biochem. Physiol. B Biochem. Mol. Biol. 2010, 157, 364–373. [Google Scholar] [CrossRef]
  96. Gutierrez de Paula, T.; Zanella, B.T.T.; De Almeida Fantinatti, B.E.; De Moraes, L.N.; Duran, B.O.S.; De Oliveira, C.B.; Salomão, R.A.S.; Da Silva, R.N.; Padovani, C.R.; Dos Santos, V.B.; et al. Food restriction increase the expression of mTORC1 complex genes in the skeletal muscle of juvenile pacu (Piaractus mesopotamicus). PLoS ONE 2017, 12, e0177679. [Google Scholar] [CrossRef]
  97. Cleveland, B.M.; Weber, G.M. Effects of triploidy on growth and protein degradation in skeletal muscle during recovery from feed deprivation in juvenile rainbow trout (Oncorhynchus mykiss). Comp. Biochem. Physiol. A Mol. Integr. Physiol. 2013, 166, 128–137. [Google Scholar] [CrossRef]
  98. Dal-Pai-Silva, M.; Zanella, B.T.T.; Duran, B.O.S.; Almeida, F.L.A.; Mareco, E.A.; de Paula, T.G. Cellular and molecular features of skeletal muscle growth and plasticity. In Biology and Physiology of Freshwater Neotropical Fish; Baldisserotto, B., Urbinati, E.C., Cyrino, J.E.P., Eds.; Academic Press: Cambridge, MA, USA, 2020; pp. 163–183. [Google Scholar]
  99. Massagué, J. How cells read TGF-β signals. Nat. Rev. Mol. Cell Biol. 2000, 1, 169–178. [Google Scholar] [CrossRef]
  100. Ding, Z.; Lin, J.; Sun, Y.; Cong, S.; Liu, S.; Zhang, Y.; Chen, Q.; Chen, J. miR-122-5p negatively regulates the transforming growth factor-β/Smad signaling pathway in skeletal muscle myogenesis. Cell Biochem. Funct. 2020, 38, 231–238. [Google Scholar] [CrossRef] [PubMed]
  101. Accornero, F.; Kanisicak, O.; Tjondrokoesoemo, A.; Attia, A.C.; McNally, E.M.; Molkentin, J.D. Myofiber-specific inhibition of TGFβ signaling protects skeletal muscle from injury and dystrophic disease in mice. Hum. Mol. Genet. 2014, 23, 6903–6915. [Google Scholar] [CrossRef] [Green Version]
  102. Kilkenny, C.; Browne, W.J.; Cuthill, I.C.; Emerson, M.; Altman, D.G. Improving Bioscience Research Reporting: The ARRIVE Guidelines for Reporting Animal Research. PLoS Biol. 2010, 8, e1000412. [Google Scholar] [CrossRef]
  103. Fauconneau, B.; Paboeuf, G. Effect of fasting and refeeding on in vitro muscle cell proliferation in rainbow trout (Oncorhynchus mykiss). Cell Tissue Res. 2000, 301, 459–463. [Google Scholar] [CrossRef] [PubMed]
  104. Bolger, A.M.; Lohse, M.; Usadel, B. Trimmomatic: A flexible trimmer for Illumina sequence data. Bioinformatics 2014, 30, 2114–2120. [Google Scholar] [CrossRef] [Green Version]
  105. Grabherr, M.G.; Haas, B.J.; Yassour, M.; Levin, J.Z.; Thompson, D.A.; Amit, I.; Adiconis, X.; Fan, L.; Raychowdhury, R.; Zeng, Q.; et al. Full-length transcriptome assembly from RNA-Seq data without a reference genome. Nat. Biotechnol. 2011, 29, 644–652. [Google Scholar] [CrossRef] [Green Version]
  106. Haas, B.J.; Papanicolaou, A.; Yassour, M.; Grabherr, M.; Blood, P.D.; Bowden, J.; Couger, M.B.; Eccles, D.; Li, B.; Lieber, M.; et al. De novo transcript sequence reconstruction from RNA-seq using the Trinity platform for reference generation and analysis. Nat. Protoc. 2013, 8, 1494–1512. [Google Scholar] [CrossRef] [PubMed]
  107. Altschul, S.F.; Gish, W.; Miller, W.; Myers, E.W.; Lipman, D.J. Basic local alignment search tool. J. Mol. Biol. 1990, 215, 403–410. [Google Scholar] [CrossRef]
  108. Langmead, B.; Salzberg, S.L. Fast gapped-read alignment with Bowtie 2. Nat. Methods 2012, 9, 357–359. [Google Scholar] [CrossRef] [Green Version]
  109. Anders, S.; McCarthy, D.J.; Chen, Y.; Okoniewski, M.; Smyth, G.K.; Huber, W.; Robinson, M.D. Count-based differential expression analysis of RNA sequencing data using R and Bioconductor. Nat. Protoc. 2013, 8, 1765–1786. [Google Scholar] [CrossRef]
  110. Love, M.I.; Huber, W.; Anders, S. Moderated estimation of fold change and dispersion for RNA-seq data with DESeq2. Genome Biol. 2014, 15, 550. [Google Scholar] [CrossRef] [PubMed] [Green Version]
  111. Starruß, J.; de Back, W.; Brusch, L.; Deutsch, A. Morpheus: A user-friendly modeling environment for multiscale and multicellular systems biology. Bioinformatics 2014, 30, 1331–1332. [Google Scholar] [CrossRef] [Green Version]
  112. Chen, E.Y.; Tan, C.M.; Kou, Y.; Duan, Q.; Wang, Z.; Meirelles, G.; Clark, N.R.; Ma’ayan, A. Enrichr: Interactive and collaborative HTML5 gene list enrichment analysis tool. BMC Bioinform. 2013, 14, 128. [Google Scholar] [CrossRef] [Green Version]
  113. Kuleshov, M.V.; Jones, M.R.; Rouillard, A.D.; Fernandez, N.F.; Duan, Q.; Wang, Z.; Koplev, S.; Jenkins, S.L.; Jagodnik, K.M.; Lachmann, A.; et al. Enrichr: A comprehensive gene set enrichment analysis web server 2016 update. Nucleic Acids Res. 2016, 44, W90–W97. [Google Scholar] [CrossRef] [PubMed] [Green Version]
  114. Ulitsky, I.; Shkumatava, A.; Jan, C.H.; Subtelny, A.O.; Koppstein, D.; Bell, G.W.; Sive, H.; Bartel, D.P. Extensive alternative polyadenylation during zebrafish development. Genome Res. 2012, 22, 2054–2066. [Google Scholar] [CrossRef] [Green Version]
  115. Cline, M.S.; Smoot, M.; Cerami, E.; Kuchinsky, A.; Landys, N.; Workman, C.; Christmas, R.; Avila-Campilo, I.; Creech, M.; Gross, B.; et al. Integration of biological networks and gene expression data using Cytoscape. Nat. Protoc. 2007, 2, 2366–2382. [Google Scholar] [CrossRef] [Green Version]
  116. Montojo, J.; Zuberi, K.; Rodriguez, H.; Kazi, F.; Wright, G.; Donaldson, S.L.; Morris, Q.; Bader, G.D. GeneMANIA Cytoscape plugin: Fast gene function predictions on the desktop. Bioinformatics 2010, 26, 2927–2928. [Google Scholar] [CrossRef] [PubMed]
  117. Huang, Z.; Teeling, E.C. ExUTR: A novel pipeline for large-scale prediction of 3′-UTR sequences from NGS data. BMC Genom. 2017, 18, 847. [Google Scholar] [CrossRef] [PubMed] [Green Version]
  118. Krüger, J.; Rehmsmeier, M. RNAhybrid: MicroRNA target prediction easy, fast and flexible. Nucleic Acids Res. 2006, 34, W451–W454. [Google Scholar] [CrossRef]
  119. Wickham, H. Ggplot2 : Elegant Graphics for Data Analysis, 2nd ed.; Springer: Berlin/Heidelberg, Germany, 2016. [Google Scholar]
  120. Untergasser, A.; Cutcutache, I.; Koressaar, T.; Ye, J.; Faircloth, B.C.; Remm, M.; Rozen, S.G. Primer3—New capabilities and interfaces. Nucleic Acids Res. 2012, 40, e115. [Google Scholar] [CrossRef] [PubMed] [Green Version]
  121. Bustin, S.A.; Benes, V.; Garson, J.A.; Hellemans, J.; Huggett, J.; Kubista, M.; Mueller, R.; Nolan, T.; Pfaffl, M.W.; Shipley, G.L.; et al. The MIQE Guidelines: Minimum Information for Publication of Quantitative Real-Time PCR Experiments. Clin. Chem. 2009, 55, 611–622. [Google Scholar] [CrossRef] [Green Version]
  122. Livak, K.J.; Schmittgen, T.D. Analysis of relative gene expression data using real-time quantitative PCR and the 2(-Delta Delta C(T)) Method. Methods 2001, 25, 402–408. [Google Scholar] [CrossRef]
  123. Vandesompele, J.; De Preter, K.; Pattyn, F.; Poppe, B.; Van Roy, N.; De Paepe, A.; Speleman, F. Accurate normalization of real-time quantitative RT-PCR data by geometric averaging of multiple internal control genes. Genome Biol. 2002, 3, research0034.1. [Google Scholar] [CrossRef] [PubMed] [Green Version]
Figure 1. Digital expression of fbxo32 and myog. Gene expression of fbxo32 (f-box protein 32) and myog (myogenin) in CTR, AA and IGF1 groups according to the differential expression analyses. Expression is shown as number of counts, and values represent means ± s.e.m. (n = 3 independent cell cultures). The fold-changes are shown in the graphs and asterisks indicate significant differences compared to CTR: **: p-adj < 0.01; ***: p-adj < 0.001.
Ijms 23 01180 g001
Figure 2. Transcriptome heatmap of pacu-cultured myotubes in CTR, AA, and IGF1 experimental groups. Heatmap showing gene expression according to the CTR, AA and IGF1 treatments by hierarchical clustering and non-hierarchical K-means clustering (K-means = 3). Heatmap shows the normalized read counts of differentially expressed genes, and one minus Pearson correlation was used as a metric for clustering.
Ijms 23 01180 g002
Figure 3. Venn diagram of genes differentially expressed in AA and IGF1 pacu-cultured myotubes. The Venn diagram showing different sets of differentially expressed genes considering the AA and IGF1 treatments, with 218 deregulated genes by both experimental groups.
Ijms 23 01180 g003
Figure 4. Gene ontology enrichment analysis of genes differently expressed in AA and IGF1 pacu-cultured myotubes. Biological processes were identified for up- and down-regulated genes in AA and IGF1 treatments compared to CTR group. Enrichment was defined as the 15 most significant terms according to the highest scores and p-values (<0.05).
Ijms 23 01180 g004
Figure 5. Identification of marcksb as potential target of miR-29b in AA pacu-cultured myotubes. (A) Interaction molecular network between marcksb (myristoylated alanine rich protein kinase c substrate b), miR-29 and other differentially expressed genes and miRNAs. Up- and down-regulated genes are represented respectively by light red and light blue colors, and up- and down-regulated miRNAs are represented respectively by red and blue colors. Purple lines show interaction between miRNAs and genes, and black lines show interaction between the genes. (B) Bioinformatics prediction of the marcksb/miR-29b hybridization. The MFE (minimum free energy) value was within accepted range. (C) Gene expression of marcksb and ipu-miR-29b in CTR, AA and IGF1 groups according to the differential expression analyses. Expression is shown, as number of counts and values represents means ± s.e.m. (n = 3 independent cell cultures). The fold-changes in AA group are shown in the graphs, and asterisks indicate significant differences between groups: *: p-adj < 0.05; **: p-adj < 0.01; ***: p-adj < 0.001.
Ijms 23 01180 g005
Figure 6. Identification of mmp14b as potential target of miR-338-5p in IGF1 pacu-cultured myotubes. (A) Interaction molecular network between mmp14b (matrix metallopeptidase 14b), miR-338 and other differentially expressed genes and miRNAs. Down-regulated genes are represented by light blue color, and up-regulated miRNAs are represented by red color. Purple lines show interaction between miRNAs and genes, and black lines show interaction between the genes. (B) Bioinformatics prediction of the mmp14b/miR-338-5p hybridization. The MFE (minimum free energy) value was within accepted range. (C) Gene expression of mmp14b and dre-miR-338-5p in CTR, AA and IGF1 groups according to the differential expression analyses. Expression is shown as number of counts, and values represent means ± s.e.m. (n = 3 independent cell cultures). The fold-changes in IGF1 group are shown in the graphs, and asterisks indicate significant differences between groups: *: p-adj < 0.05; ***: p-adj < 0.001.
Ijms 23 01180 g006
Figure 7. (A,C,E) In vitro and (B,D,F) in vivo relative expression of marcksb, mycn and miR-29b. Relative gene expression of marcksb (myristoylated alanine rich protein kinase C substrate b), mycn (n-myc proto-oncogene protein) and ipu-miR-29b by qPCR. Validation was performed from CTR, AA, and IGF1 myotubes (in vitro samples; n = 4 independent cell cultures), and from fish muscles before fasting (Day 0, fed), after 4 days of fasting (Day 4, fasted), and 3 days of re-feeding (Day 3, refed) (in vivo samples; n = 6). Values represent means ± s.e.m. Letters indicate significant differences between groups. Parametric data were analyzed by one-way ANOVA test, followed by Tukey’s multiple comparisons test, while non-parametric data were analyzed by a Kruskal–Wallis test, followed by Dunn’s multiple comparisons test (p < 0.05).
Ijms 23 01180 g007
Figure 8. (A,C,E,G) In vitro and (B,D,F,H) in vivo relative expression of mmp14b, fbxo25, tgfbr2 and miR-338-5p. Relative gene expression of mmp14b (matrix metallopeptidase 14b), fbxo25 (f-box protein 25), tgfbr2 (tgf-beta receptor type-2) and dre-miR-338-5p by qPCR. Validation was performed from CTR, AA and IGF1 myotubes (in vitro samples; n = 4 independent cell cultures), and from fish muscles before fasting (Day 0, fed), after 4 days of fasting (Day 4, fasted), and 3 days of re-feeding (Day 3, refed) (in vivo samples; n = 6). Values represent means ± s.e.m. Letters indicate significant differences between groups. Parametric data was analyzed by one-way ANOVA test, followed by Tukey’s multiple comparisons test, while non-parametric data were analyzed by the Kruskal–Wallis test, followed by Dunn’s multiple comparisons test (p < 0.05).
Ijms 23 01180 g008
Publisher’s Note: MDPI stays neutral with regard to jurisdictional claims in published maps and institutional affiliations.

