
Low-Intensity Pulsed Ultrasound Counteracts Advanced Glycation End Products-Induced Corpus Cavernosal Endothelial Cell Dysfunction via Activating Mitophagy

 , and
, and 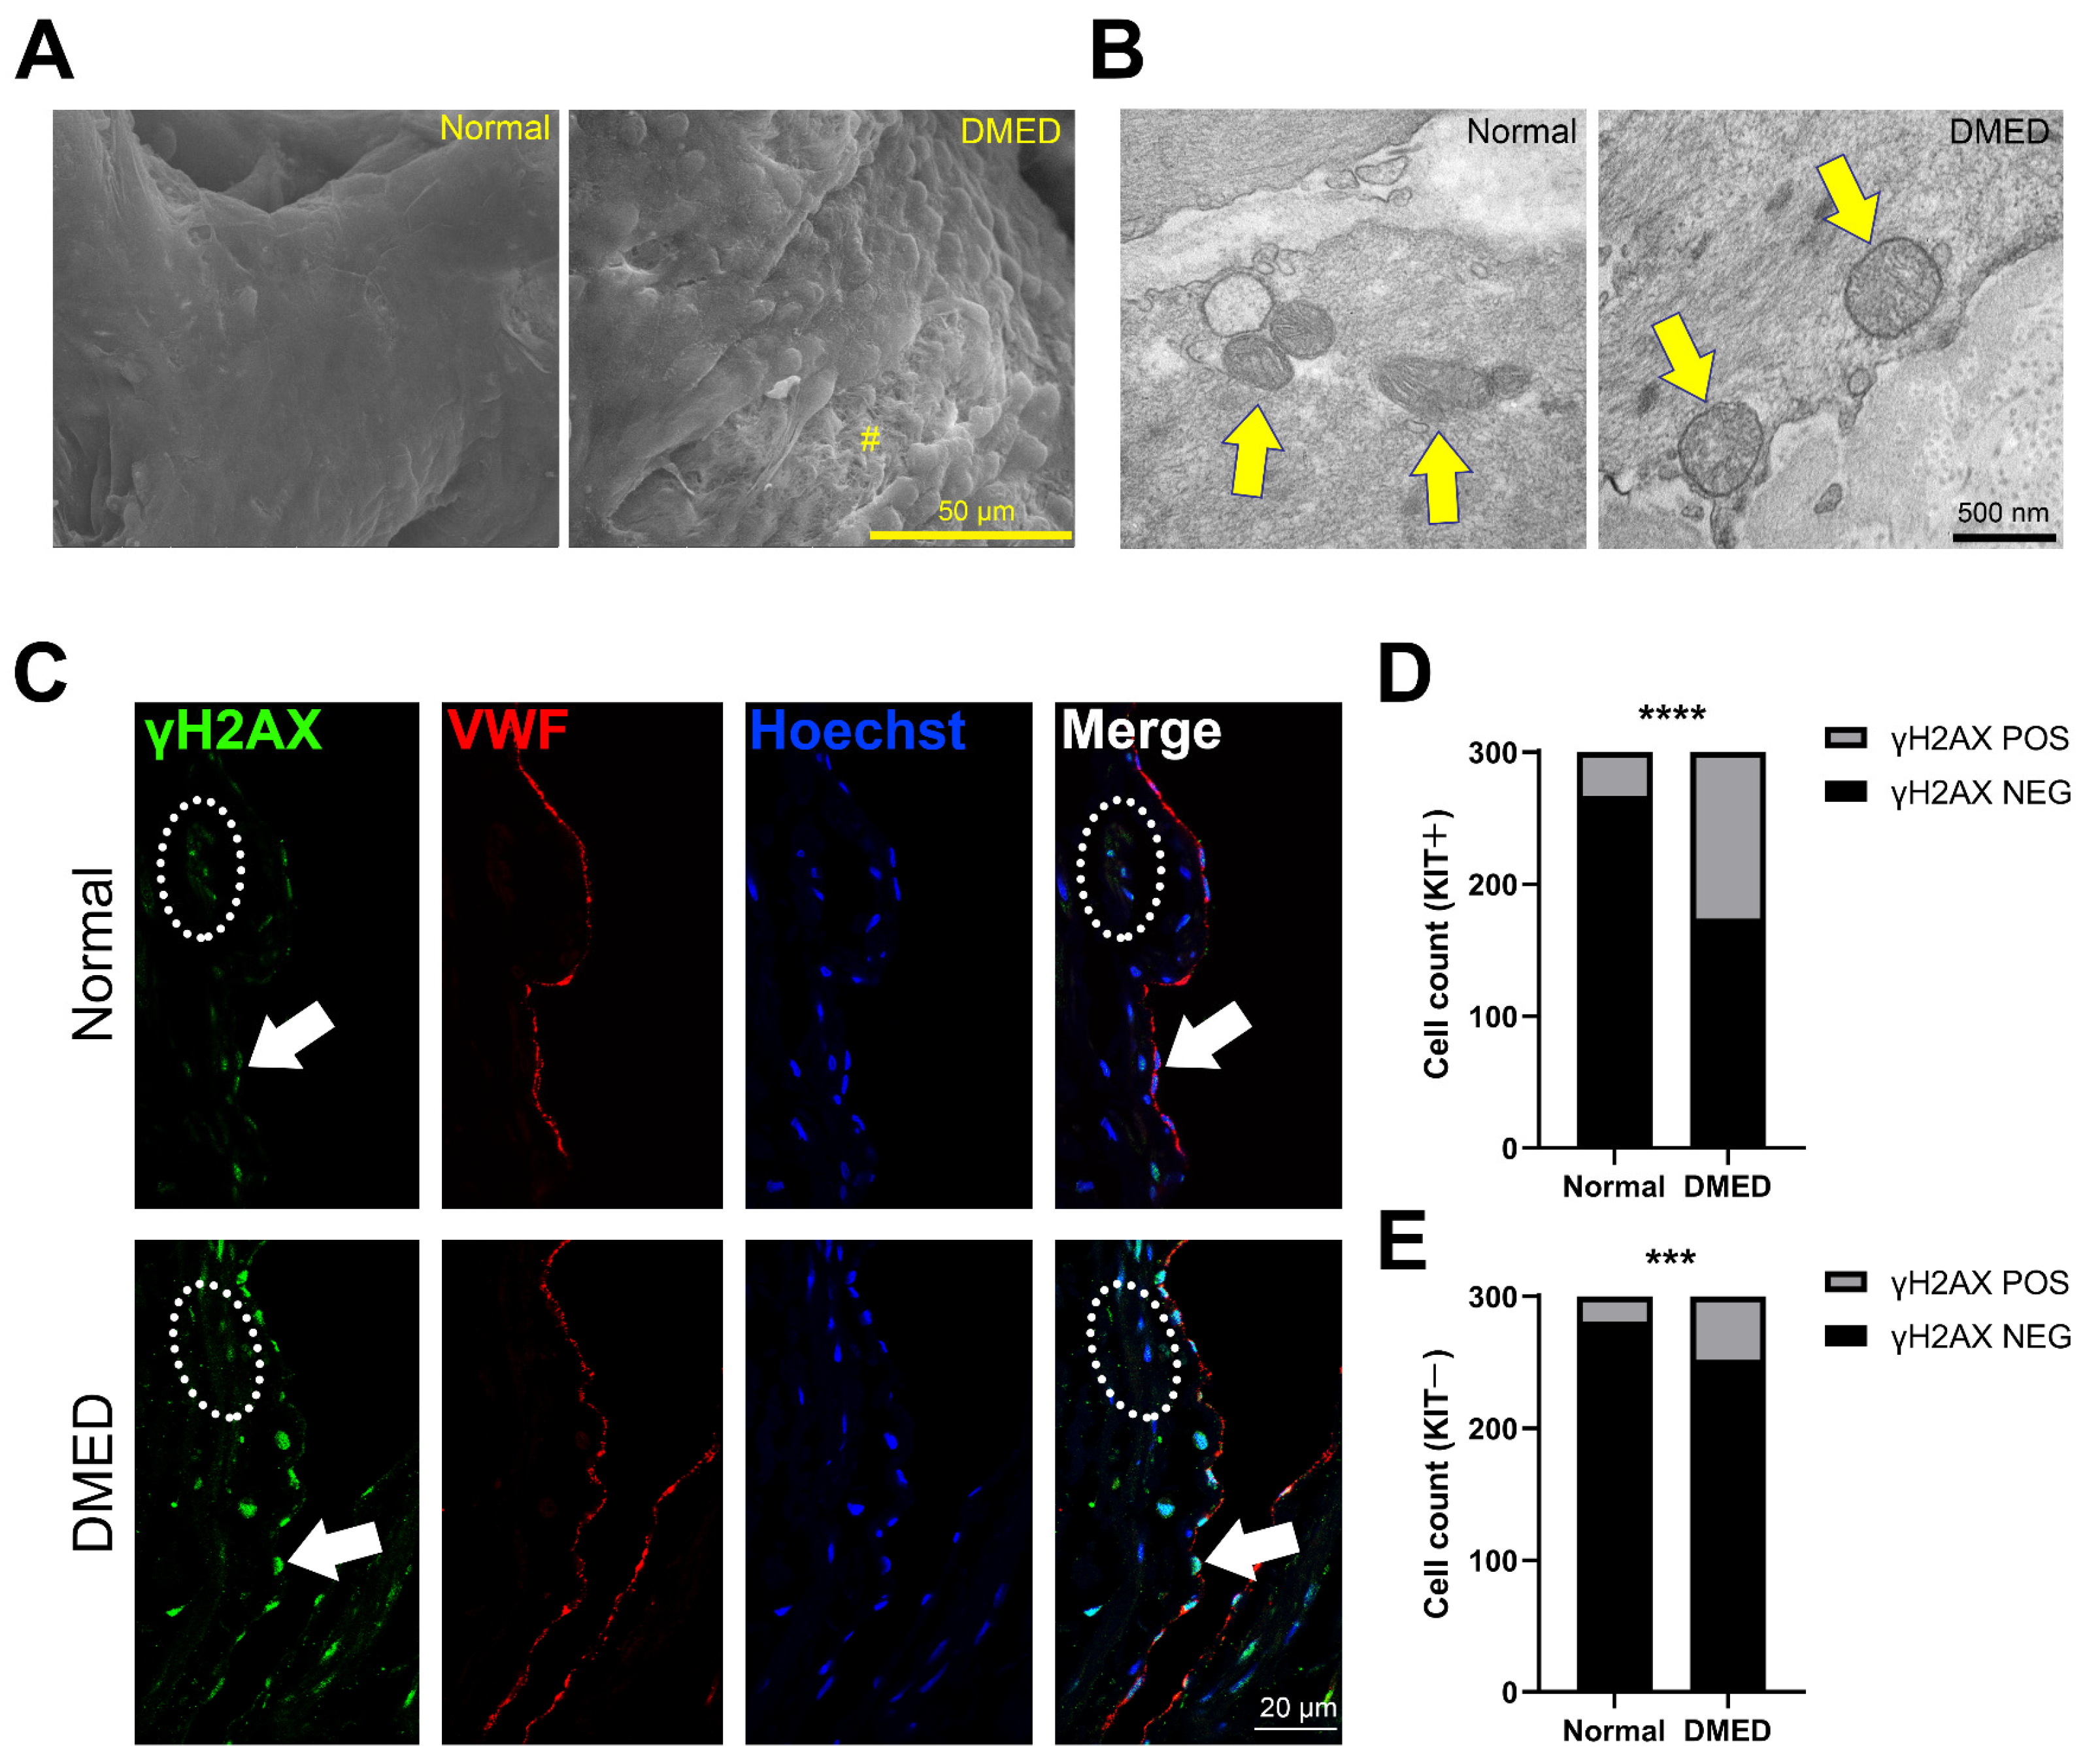
Abstract
:1. Introduction
2. Results
2.1. Mitochondrial Dysfunction and Apoptosis Are Observed in the Corpus Cavernosal Endothelium of Dmed Patients
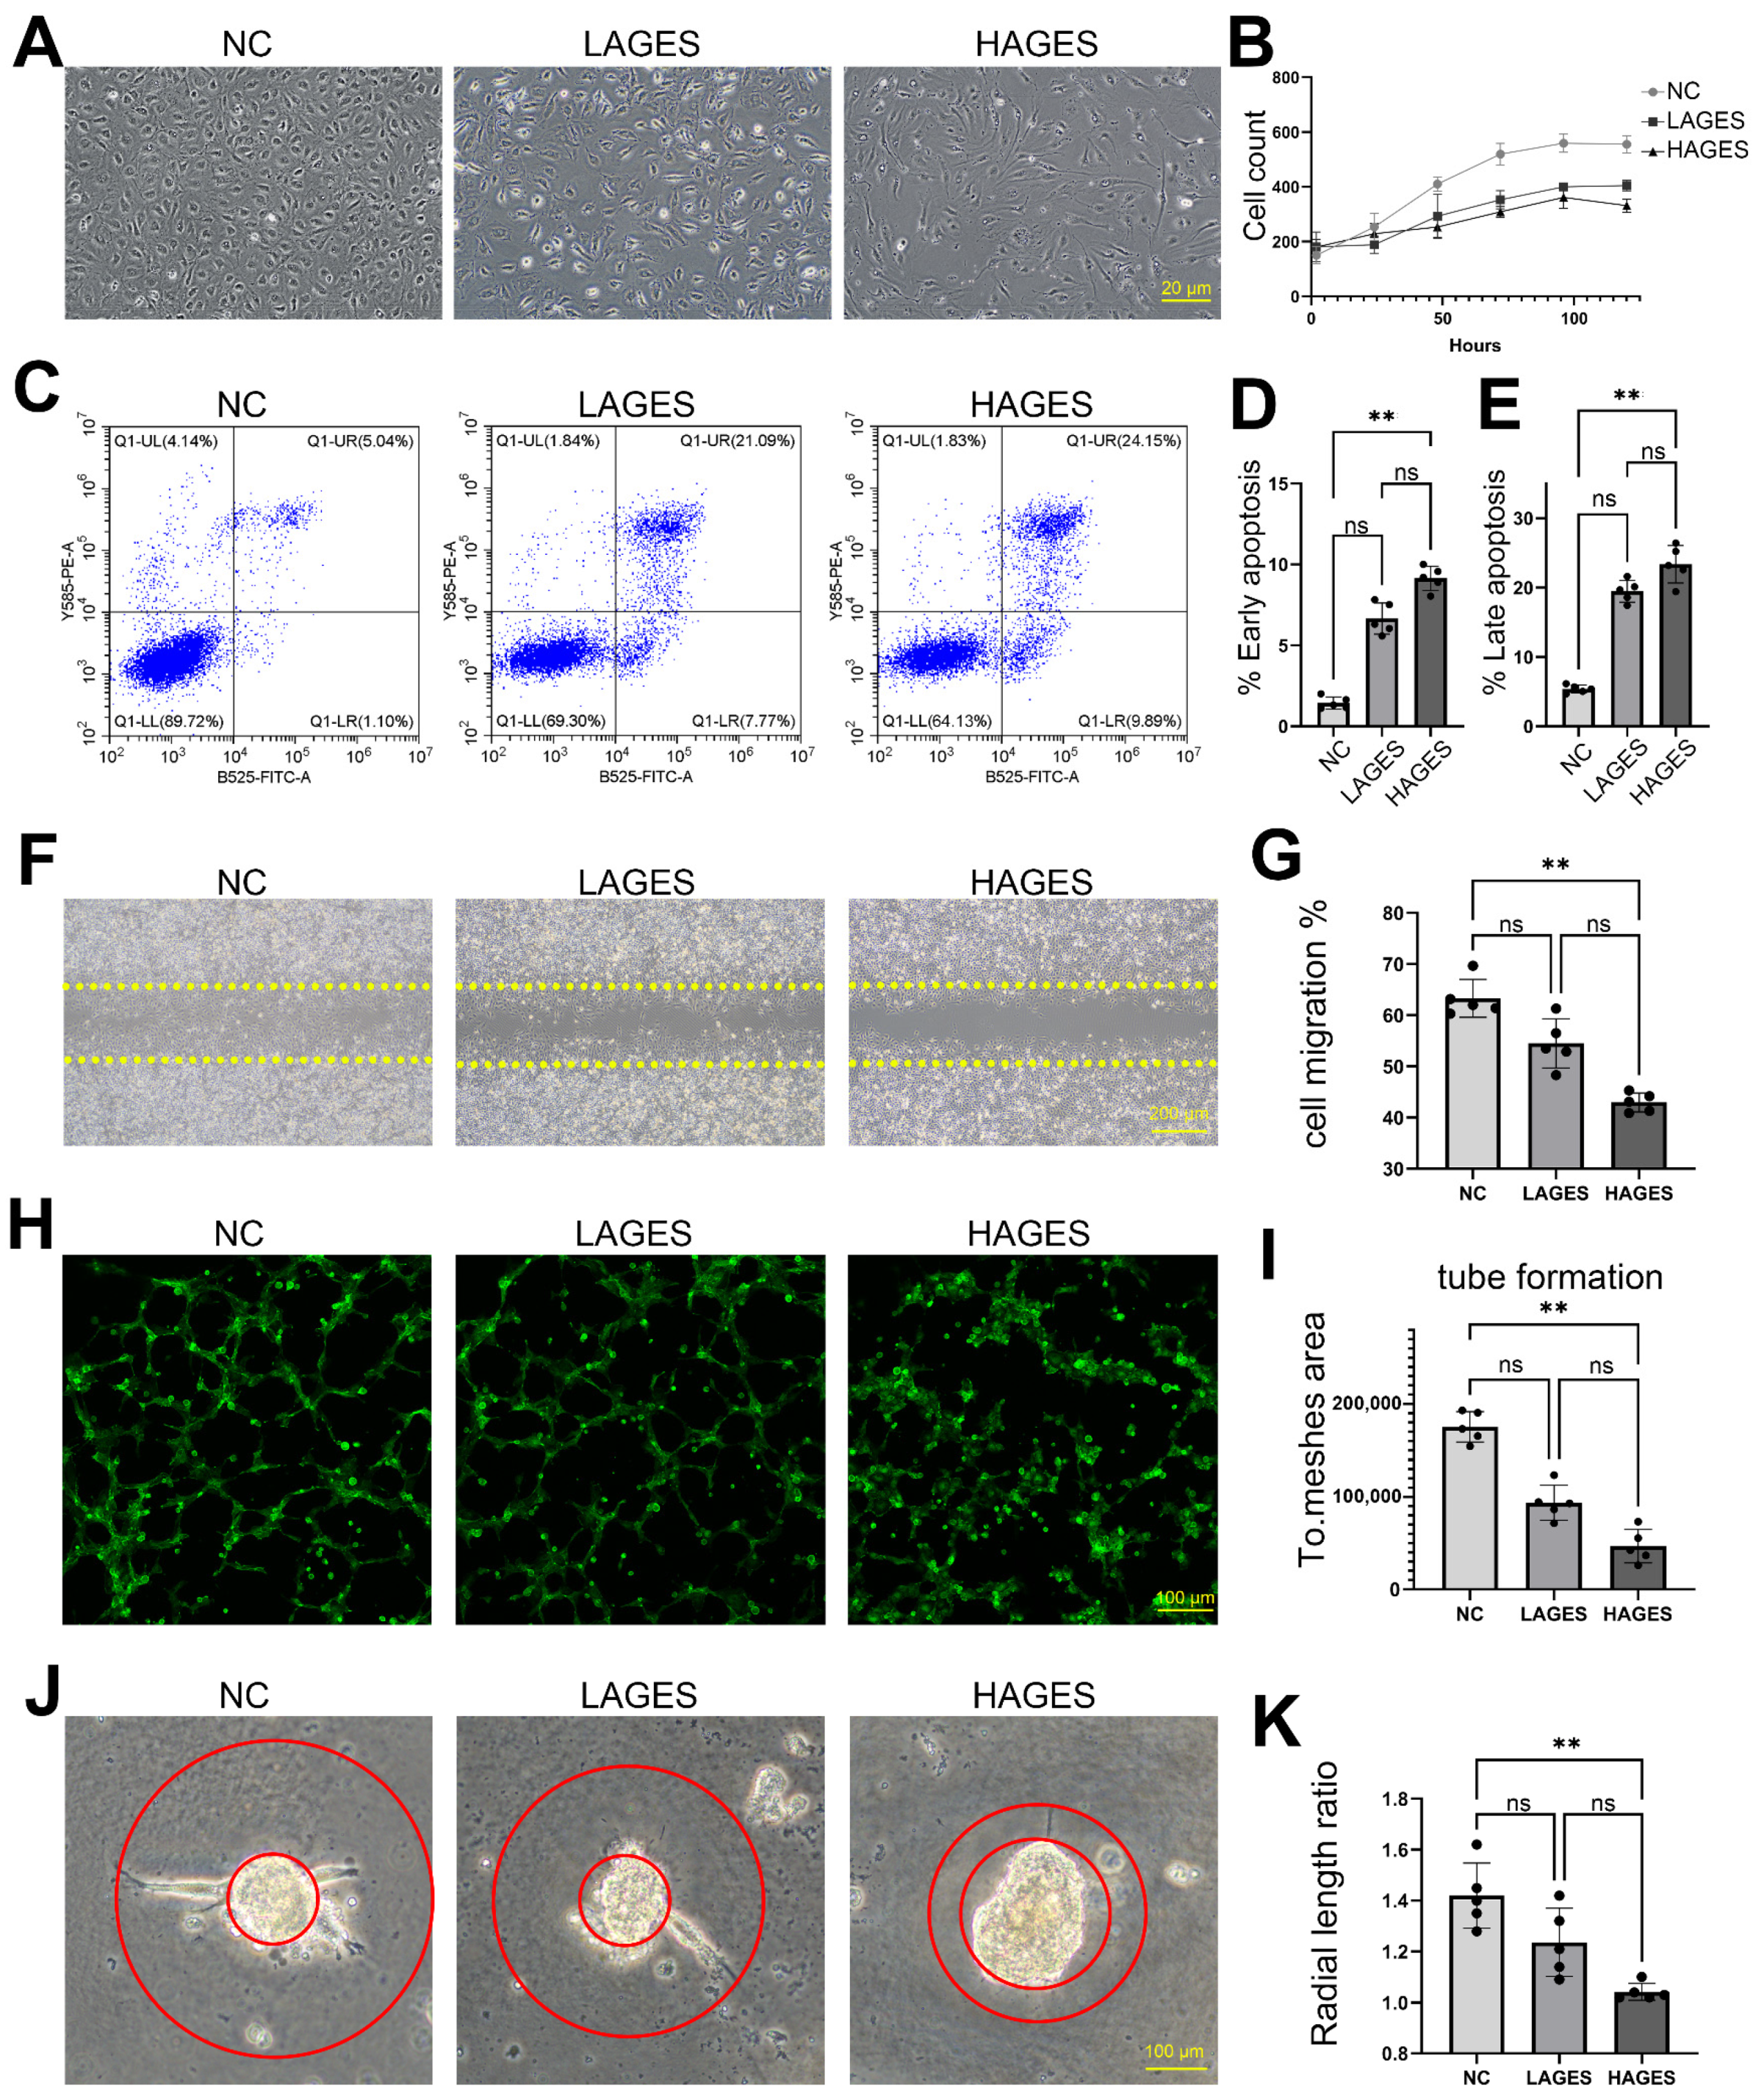
2.2. Ages Treatment Induces Apoptosis and Dysfunction of Human Ccecs In Vitro
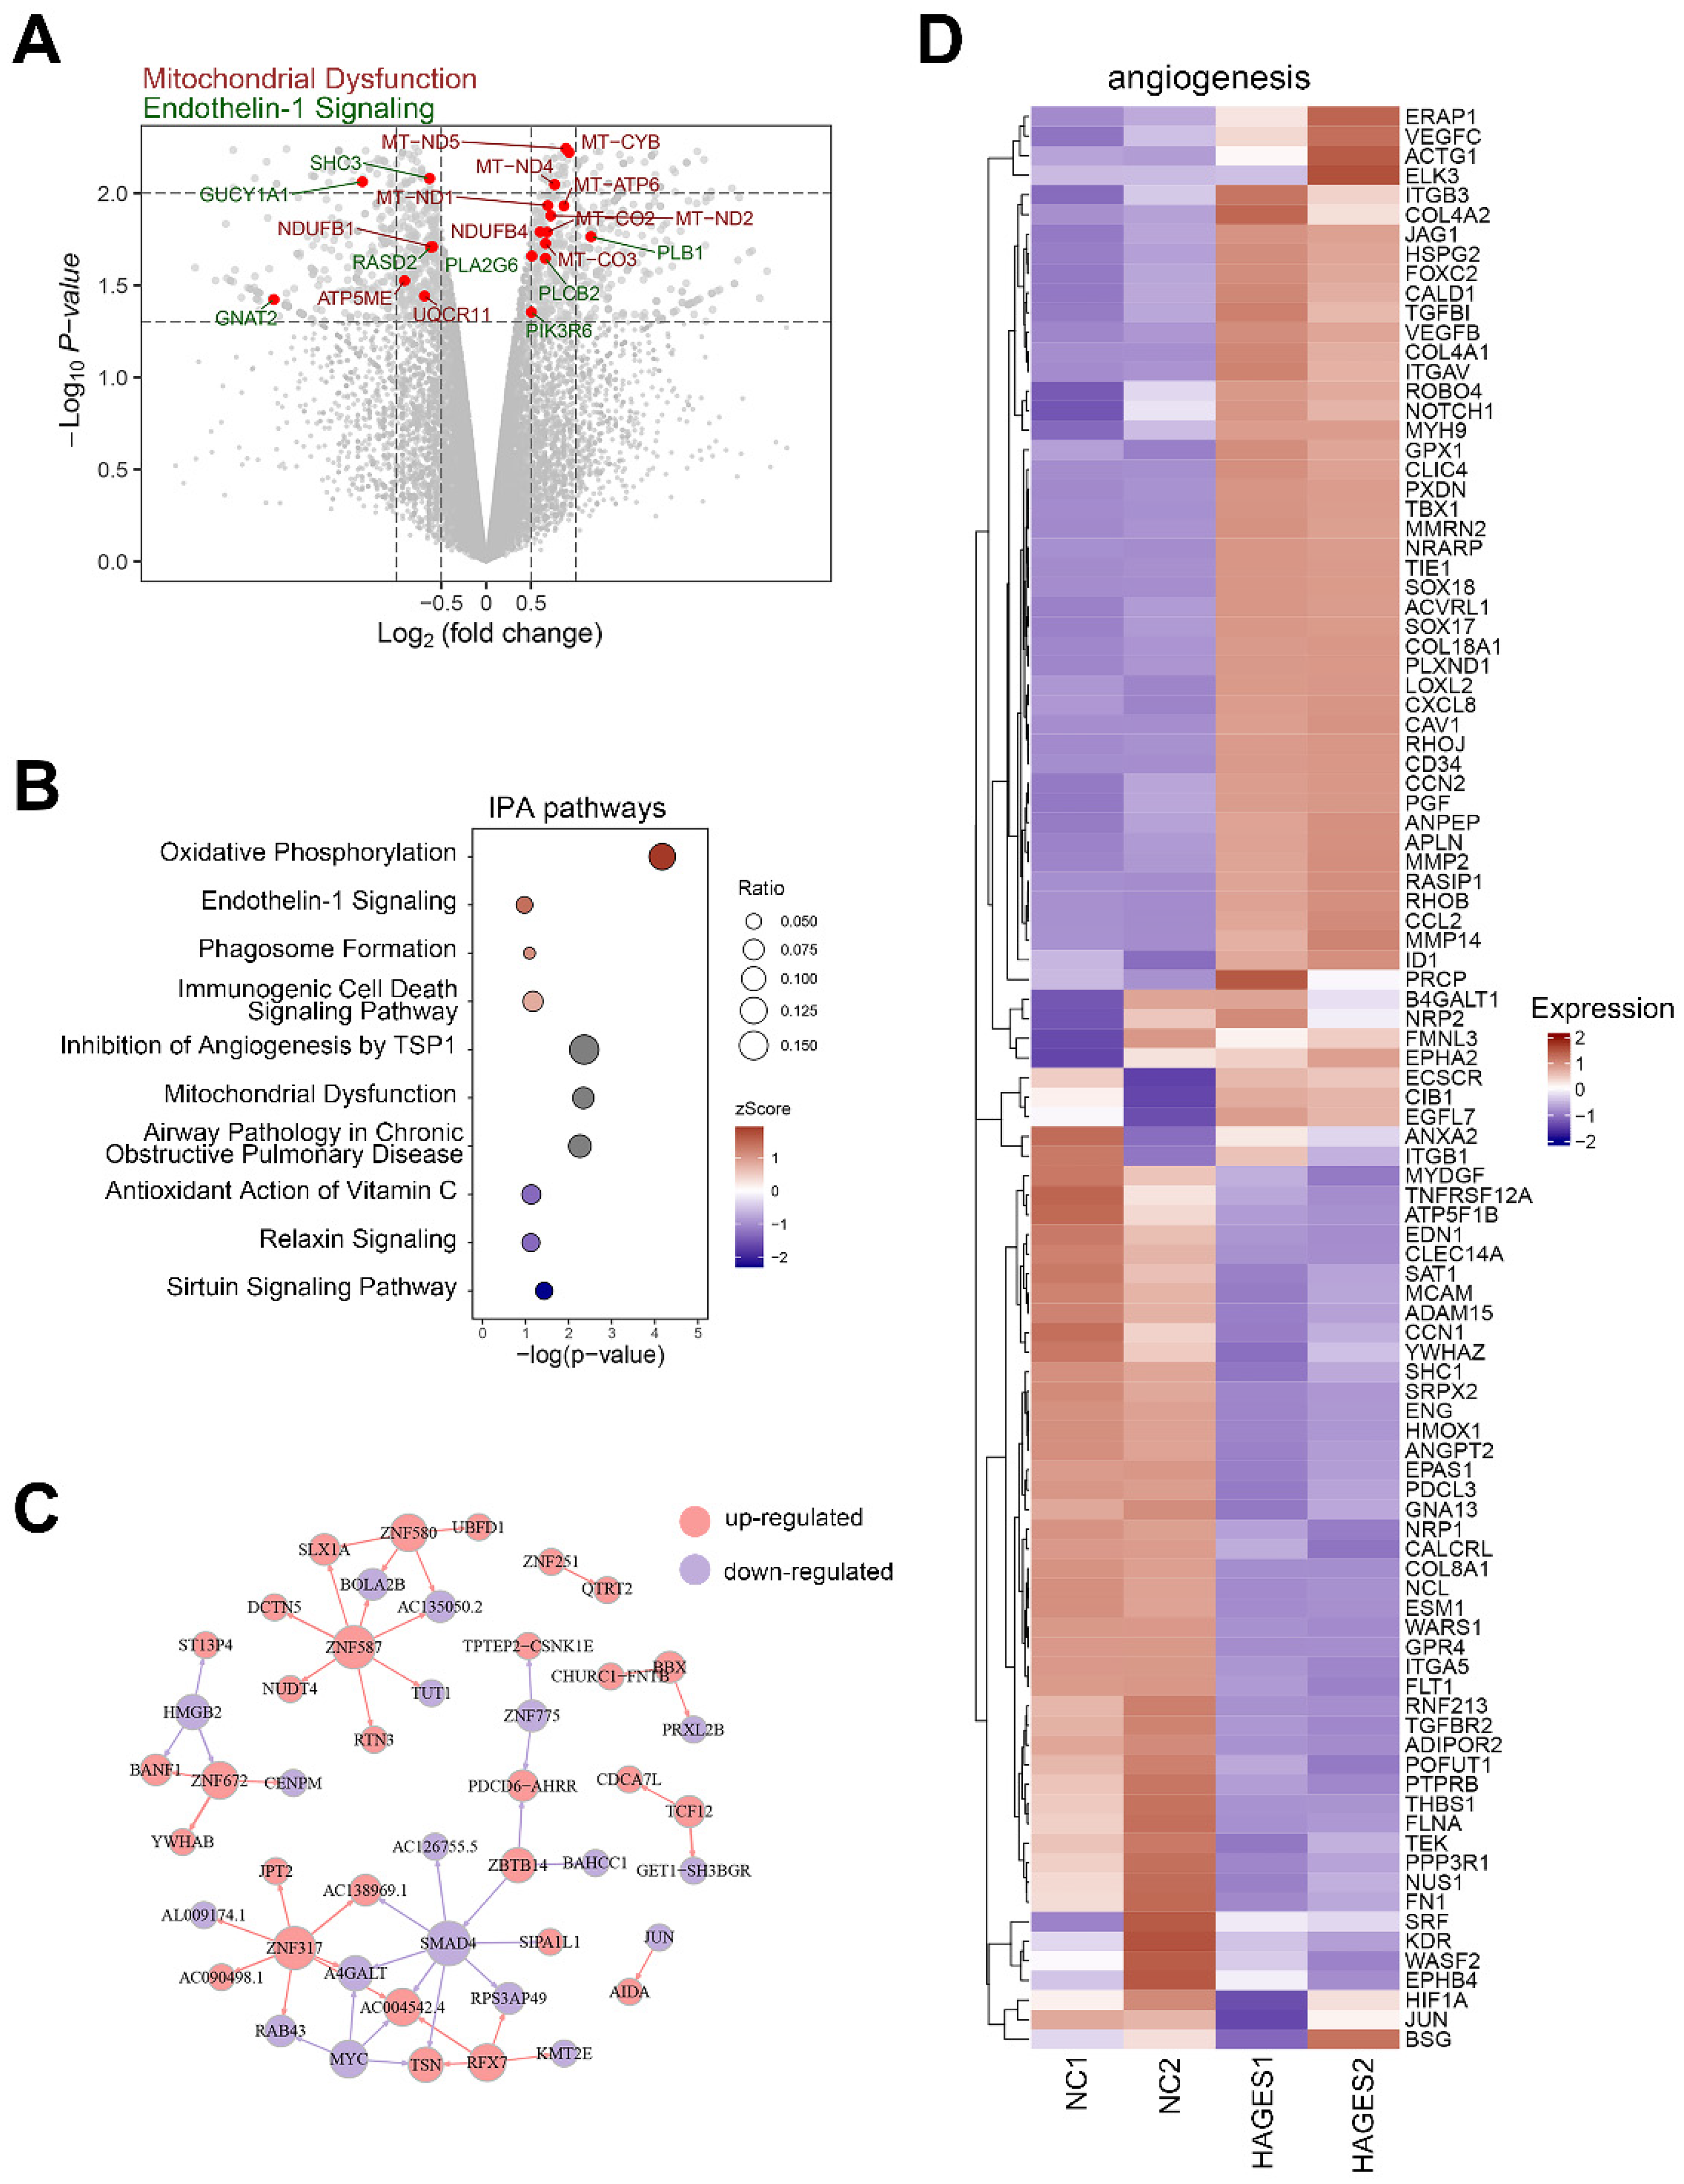
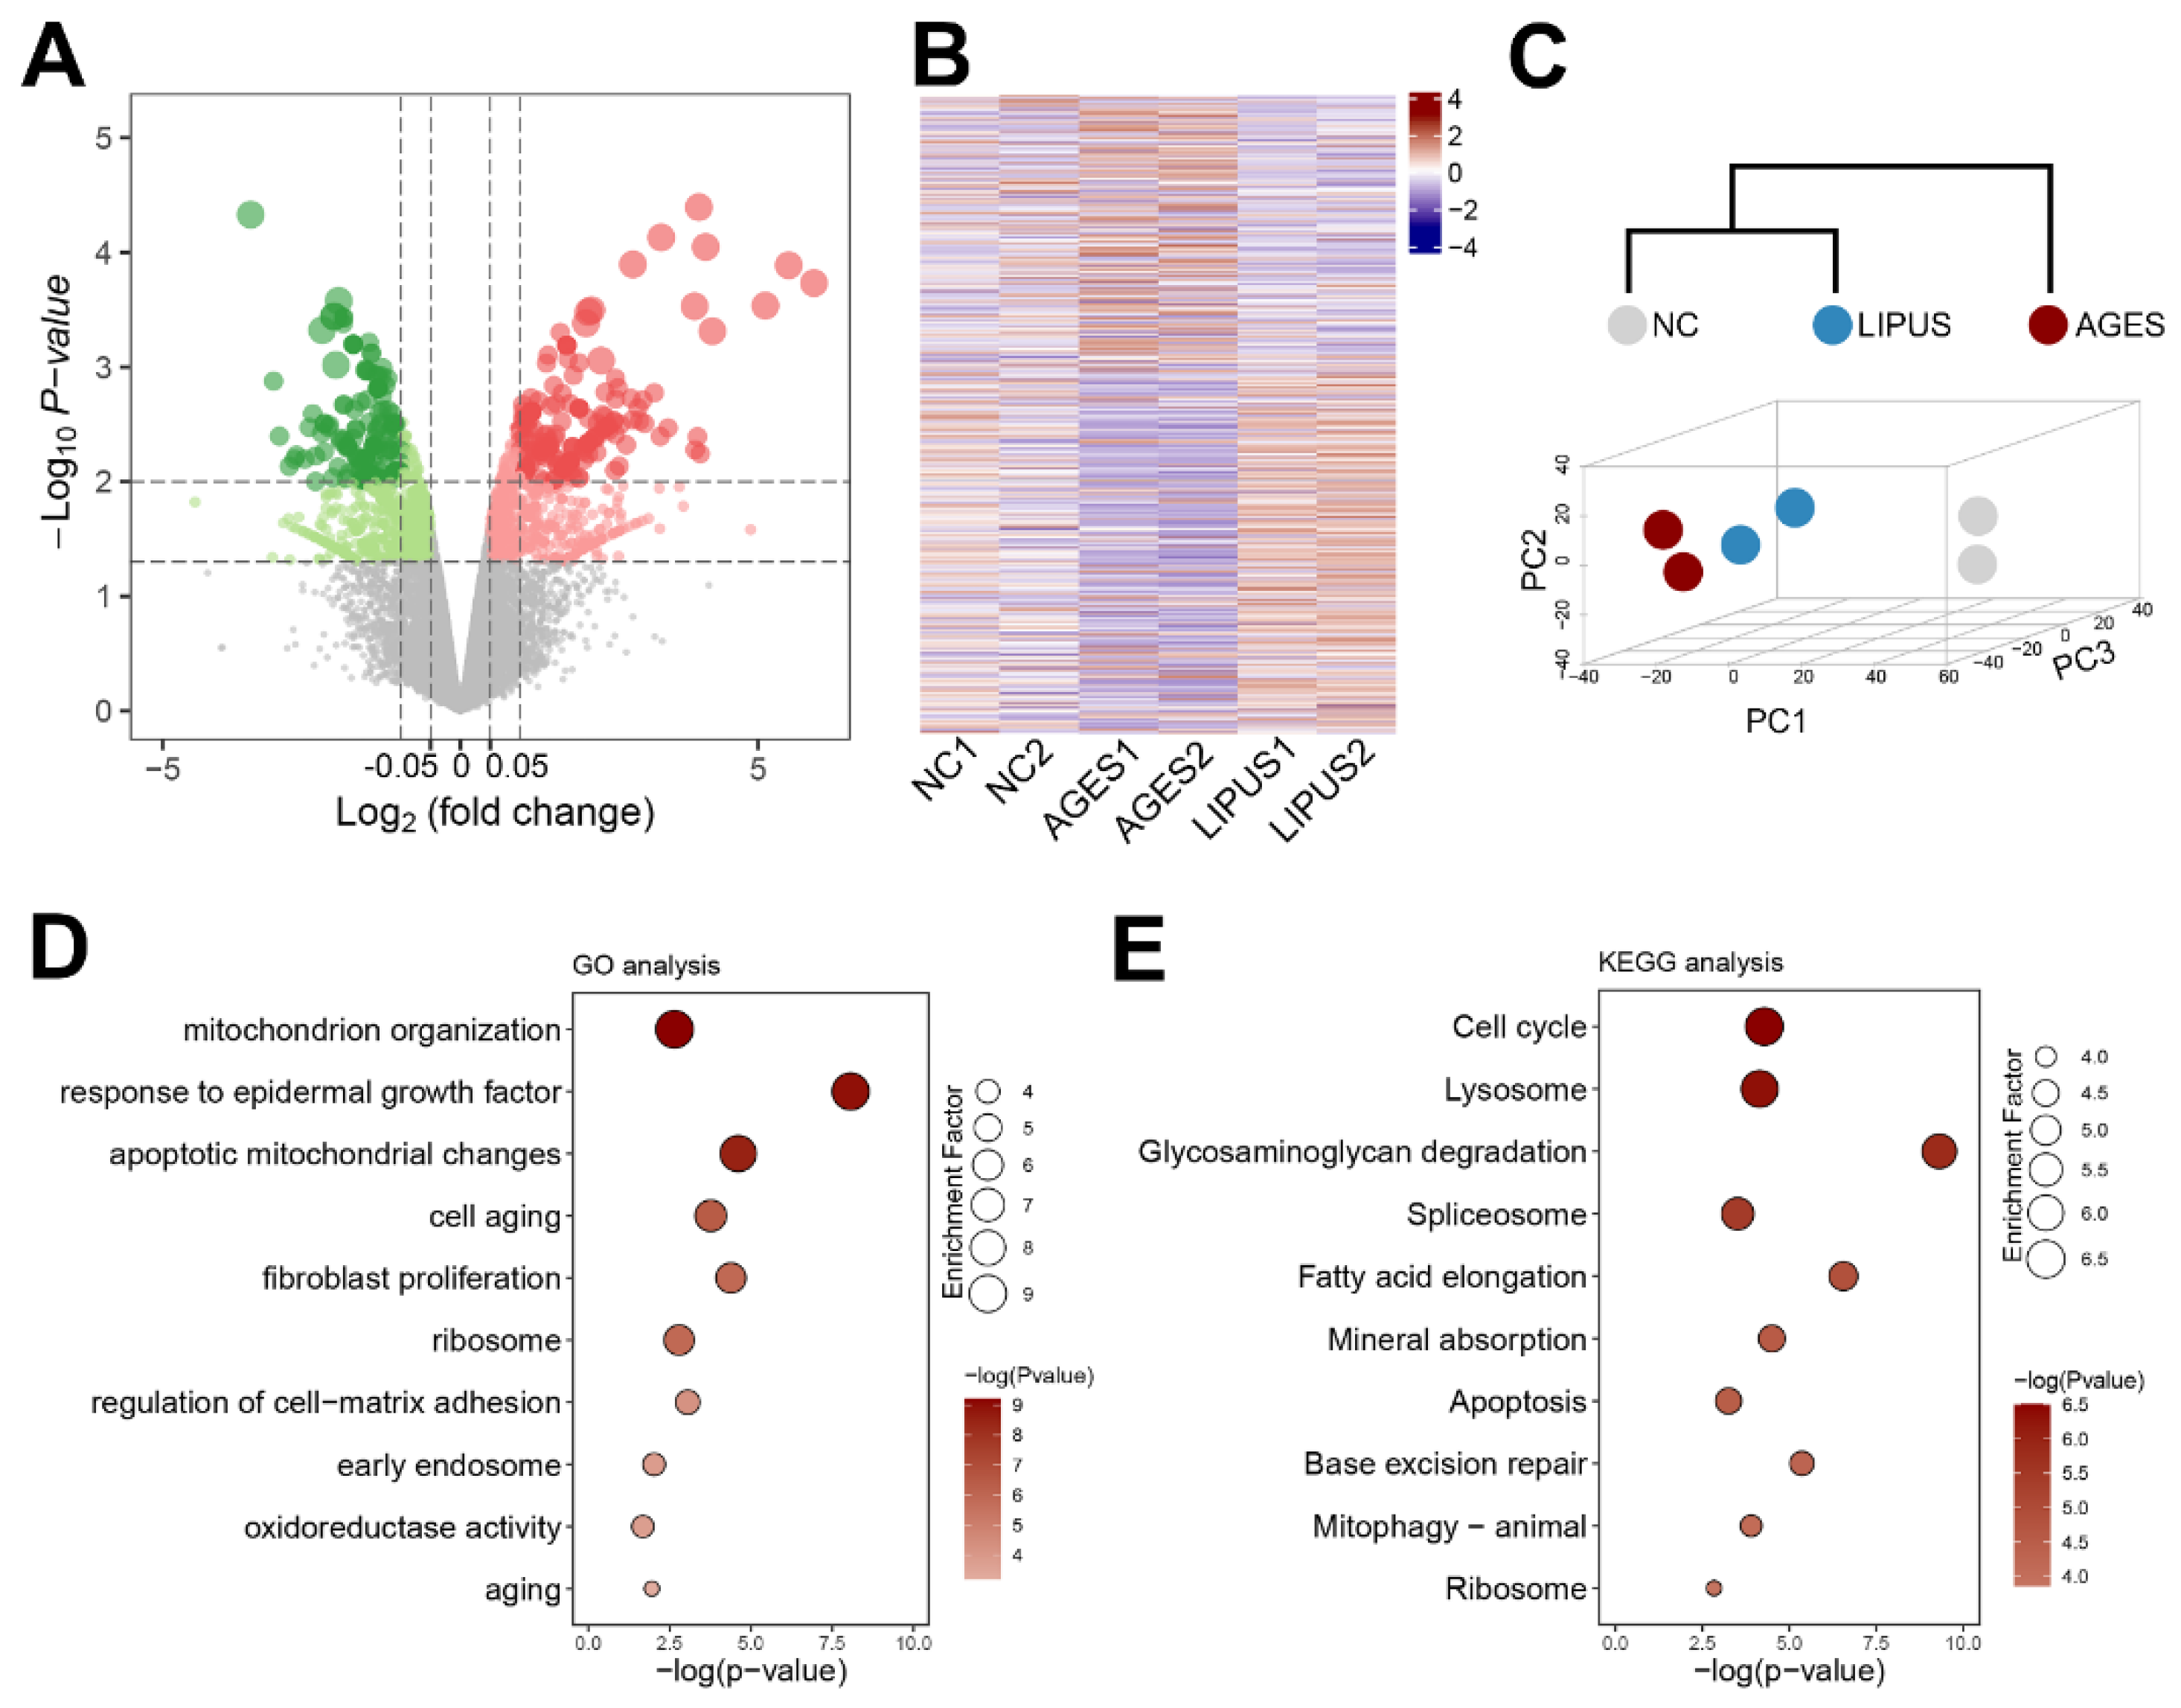
2.3. AGES Treatment Perturbs the Transcriptome in Human CCECs
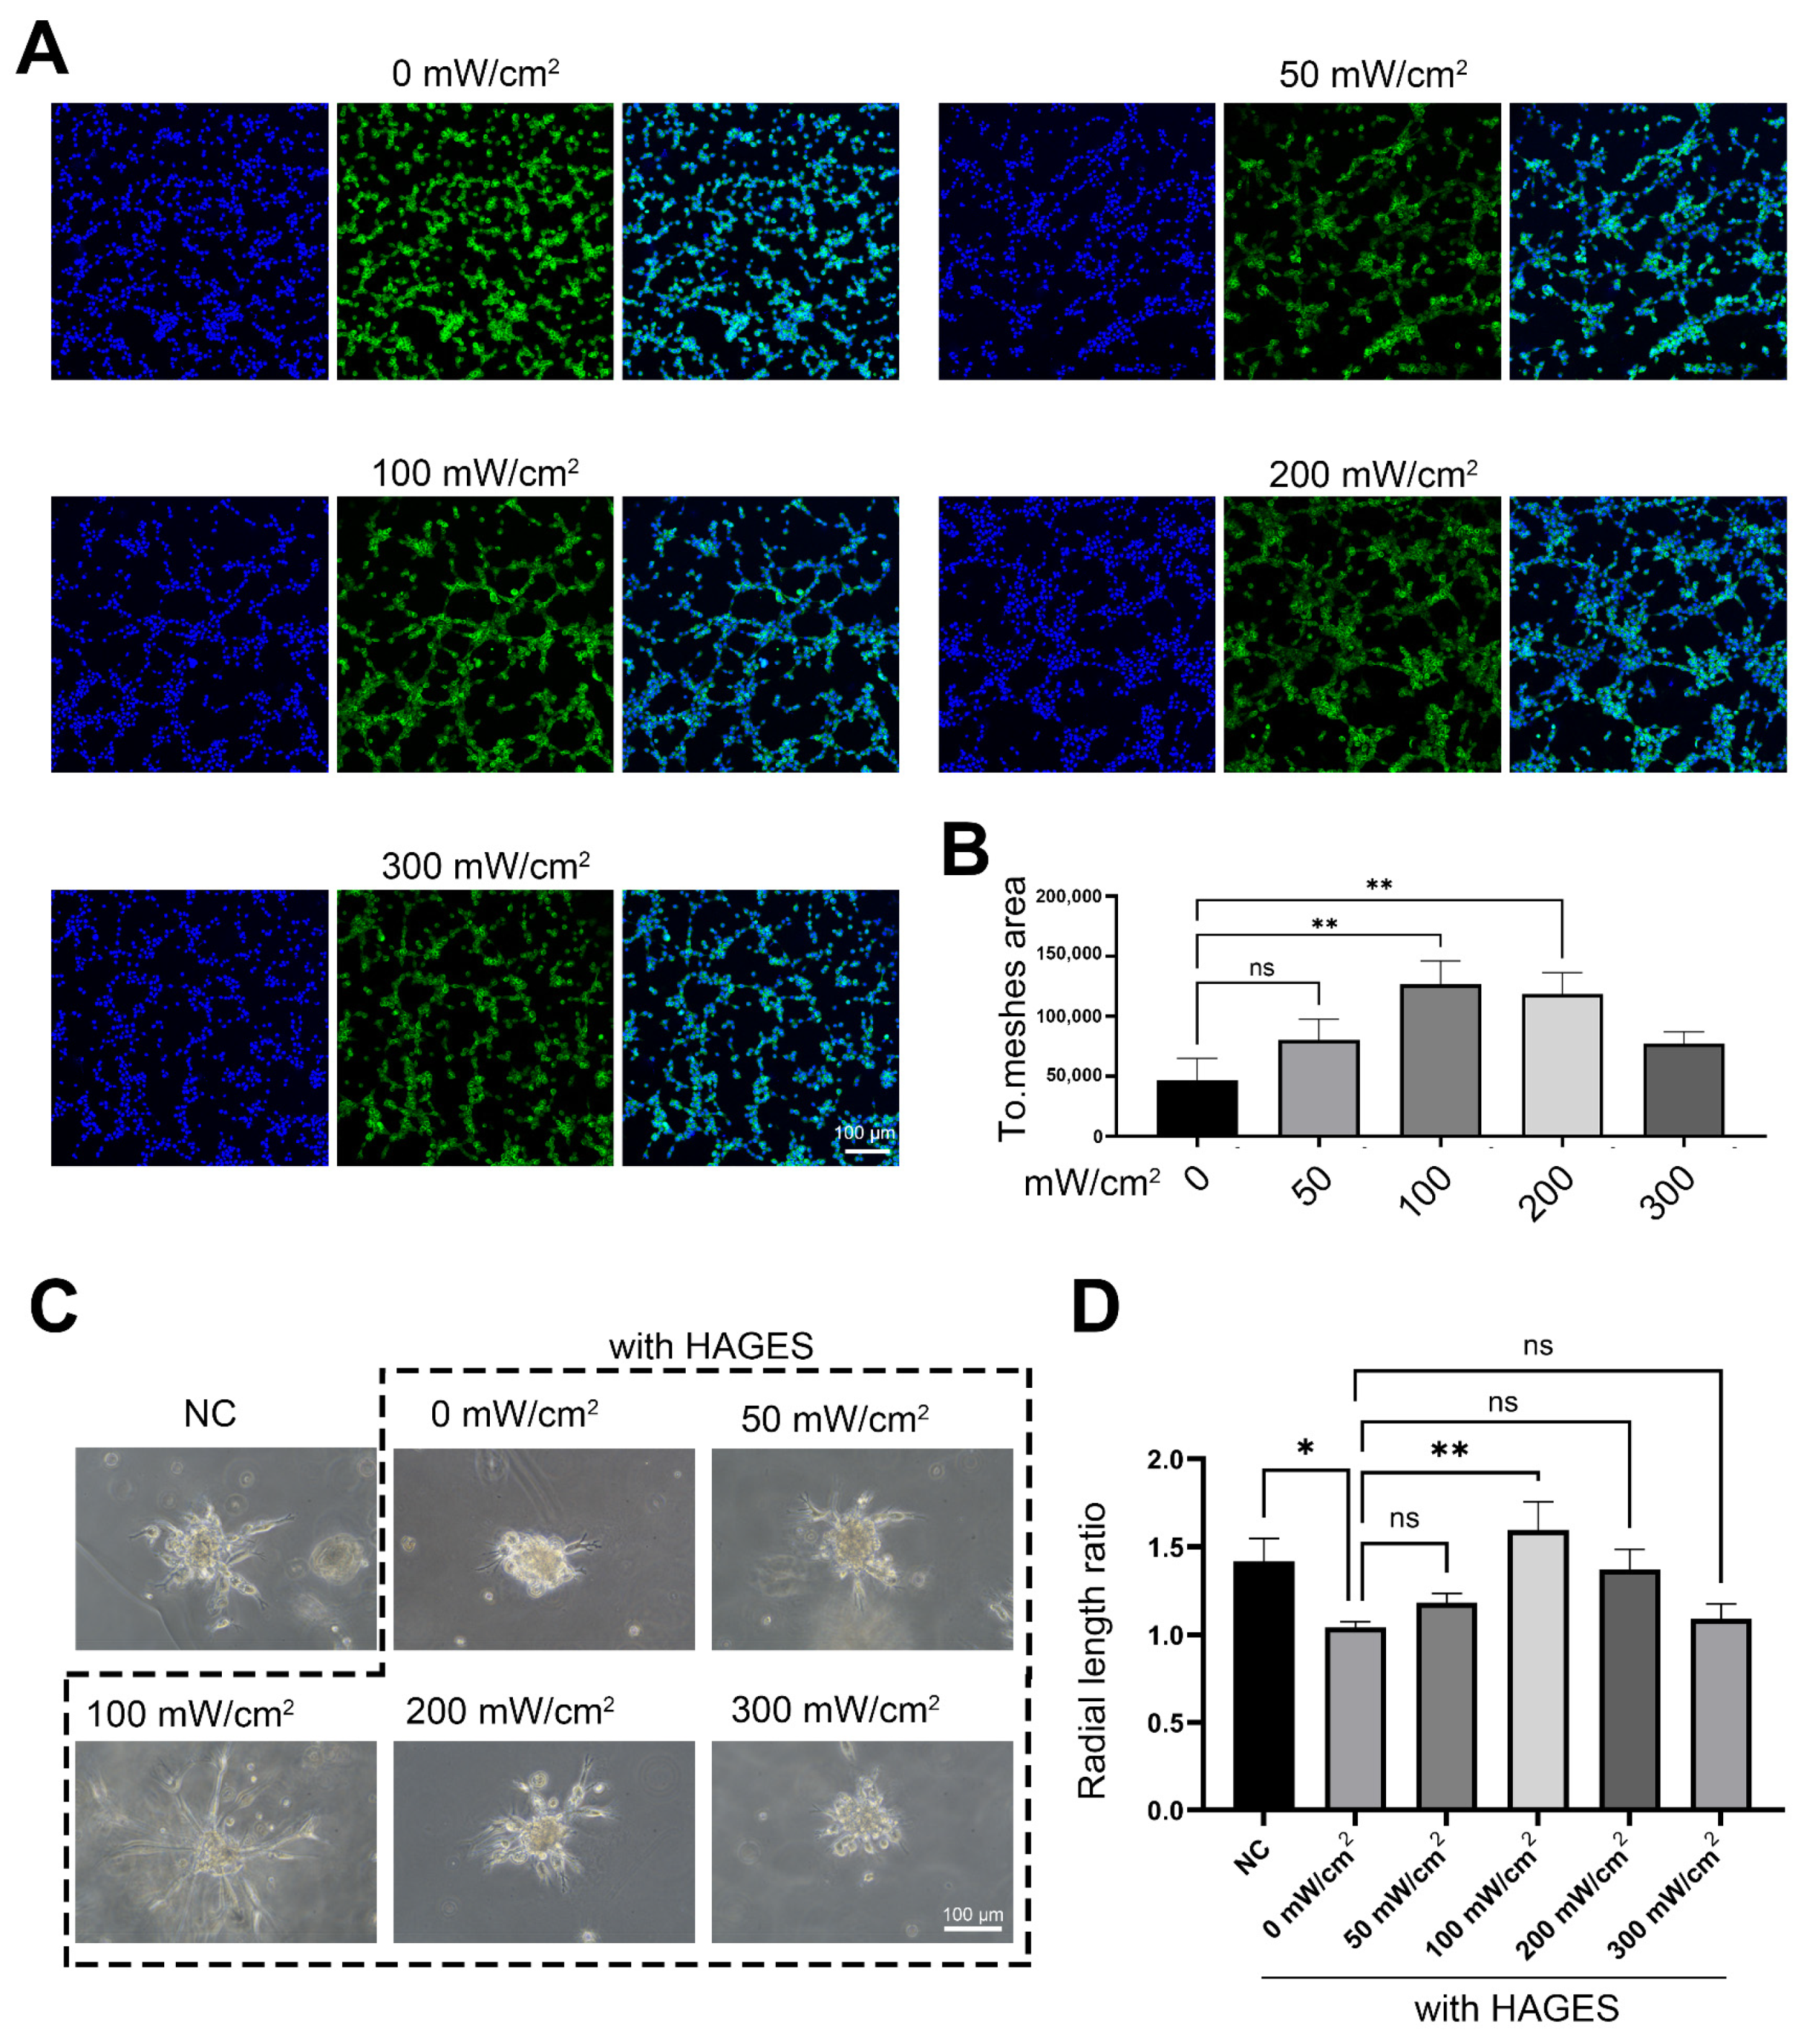
2.4. LIPUS Treatment Rescues AGES-Induced Impairment of Angiogenesis and Transcriptional Changes in CCECs
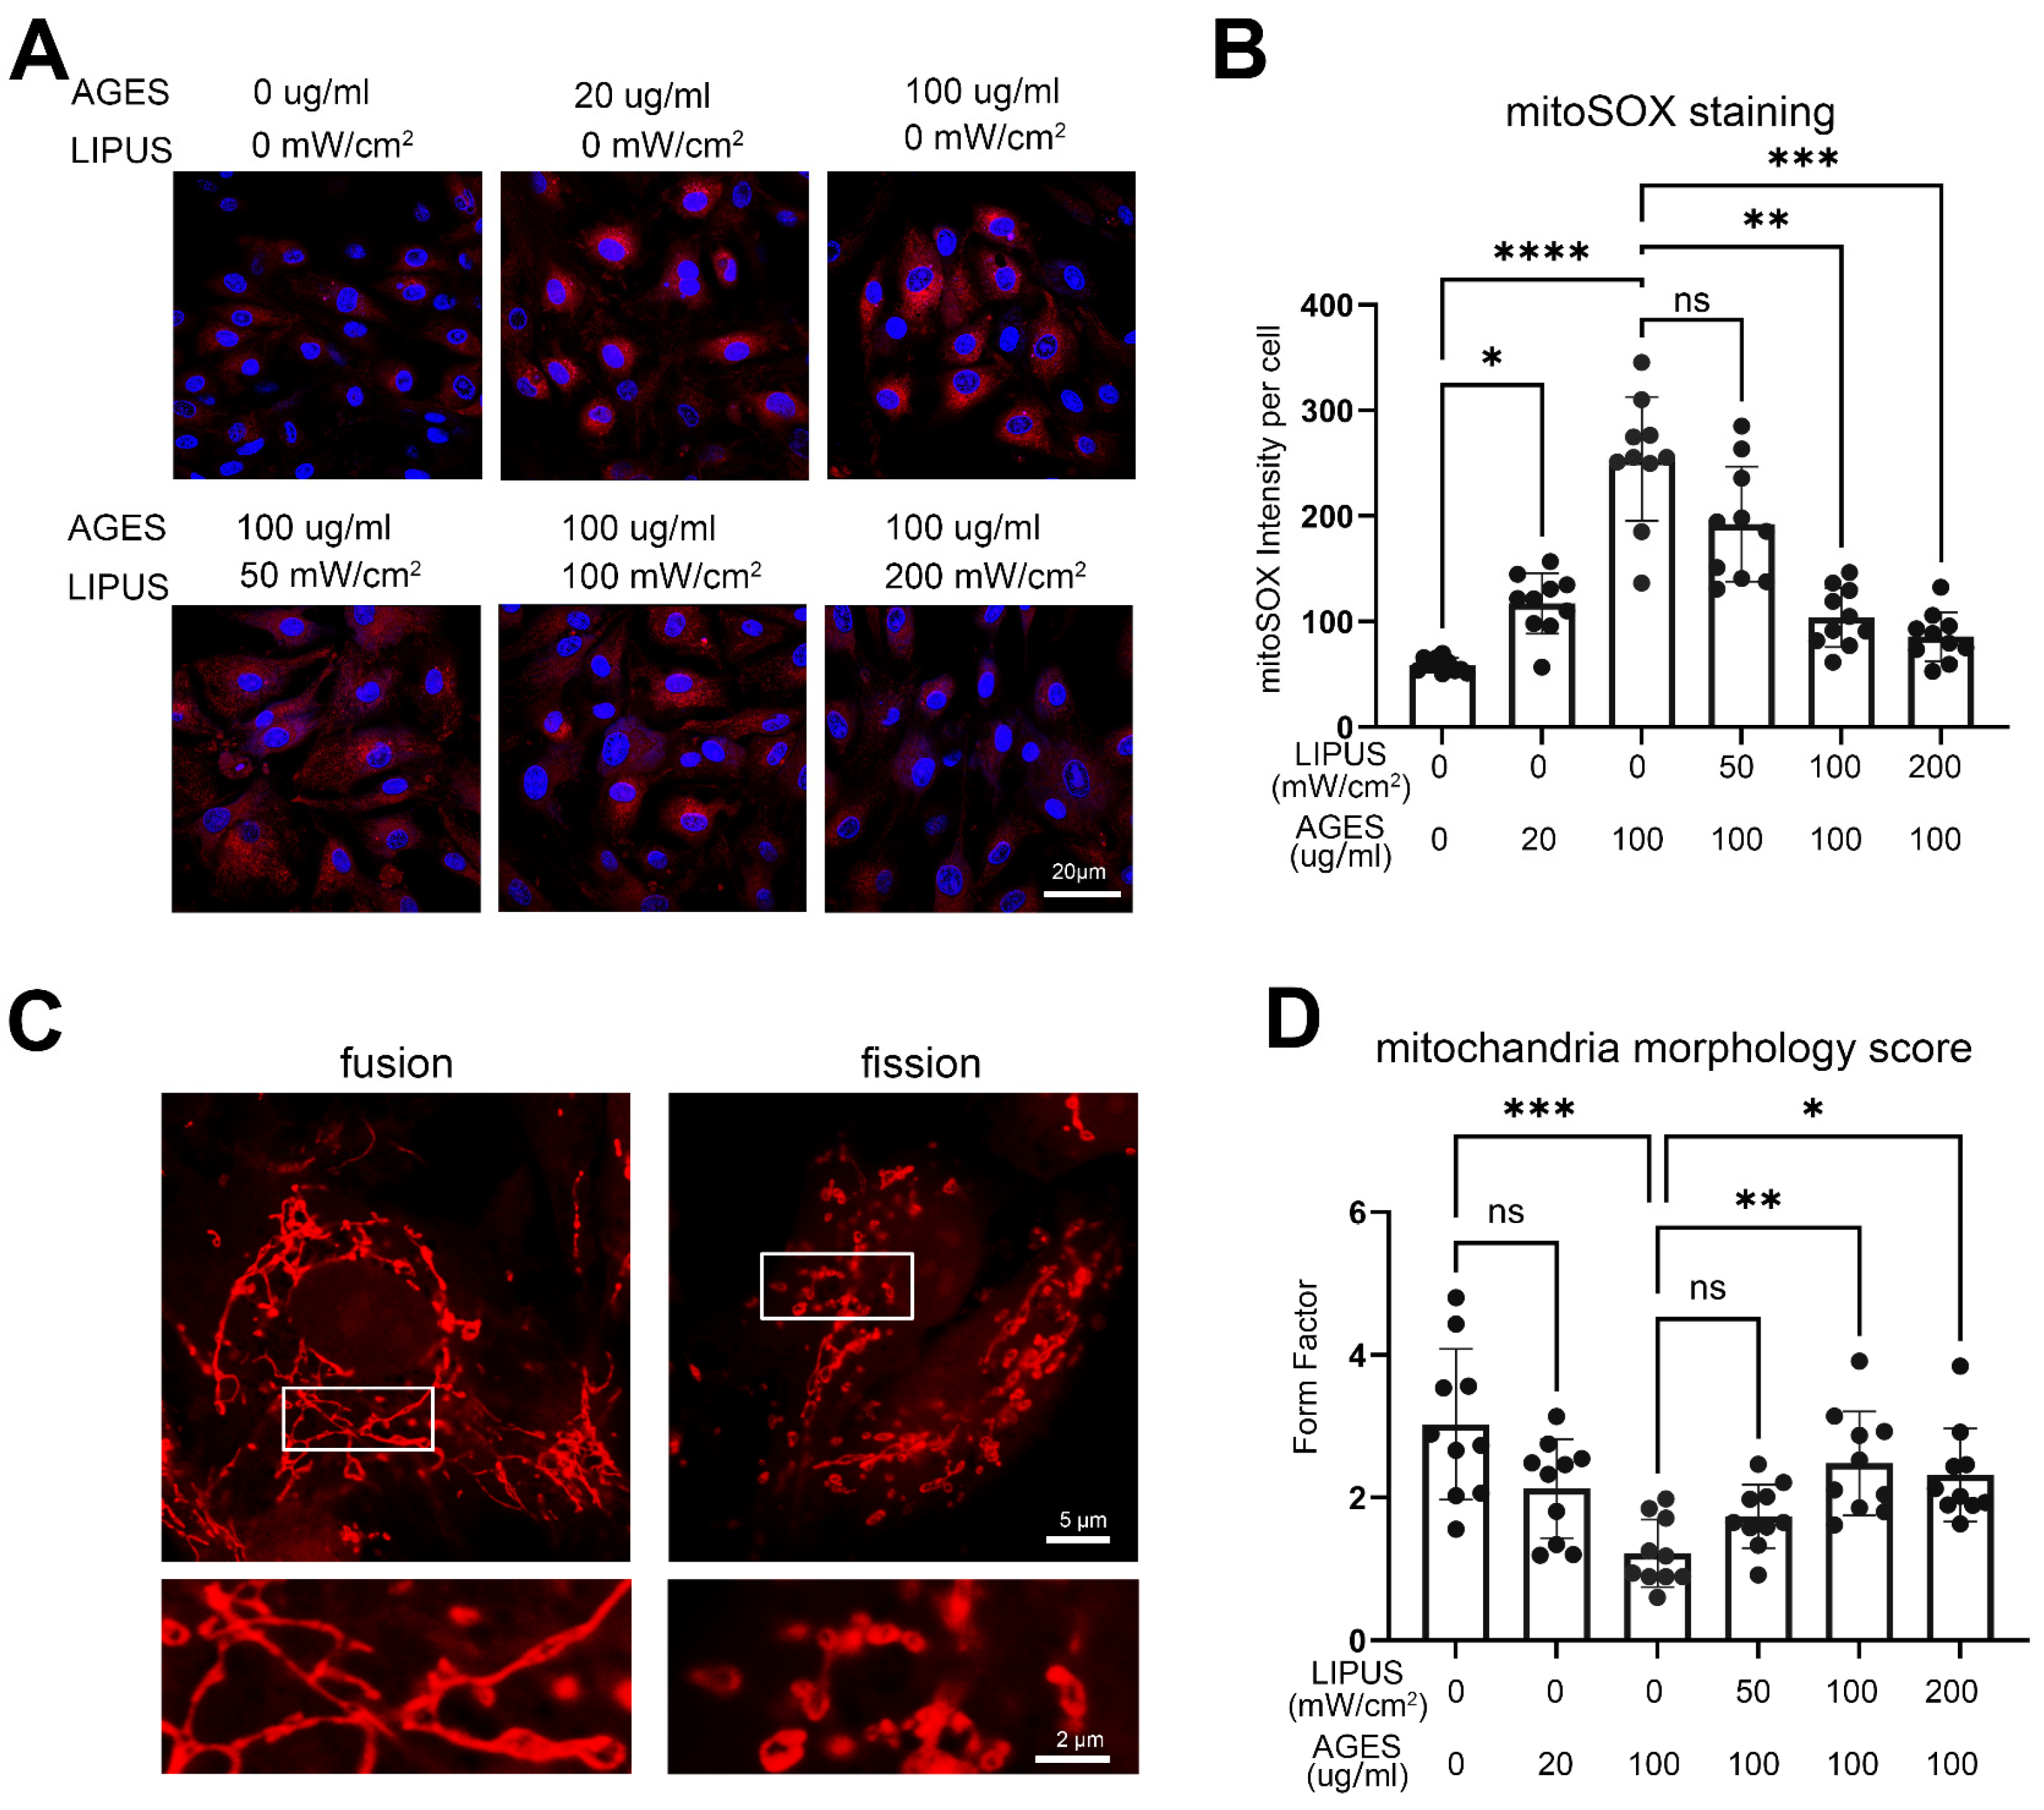
2.5. LIPUS Restores Mitochondrial Morphology and Reduces Mitochondrial ROS Production Induced by AGES in CCECs
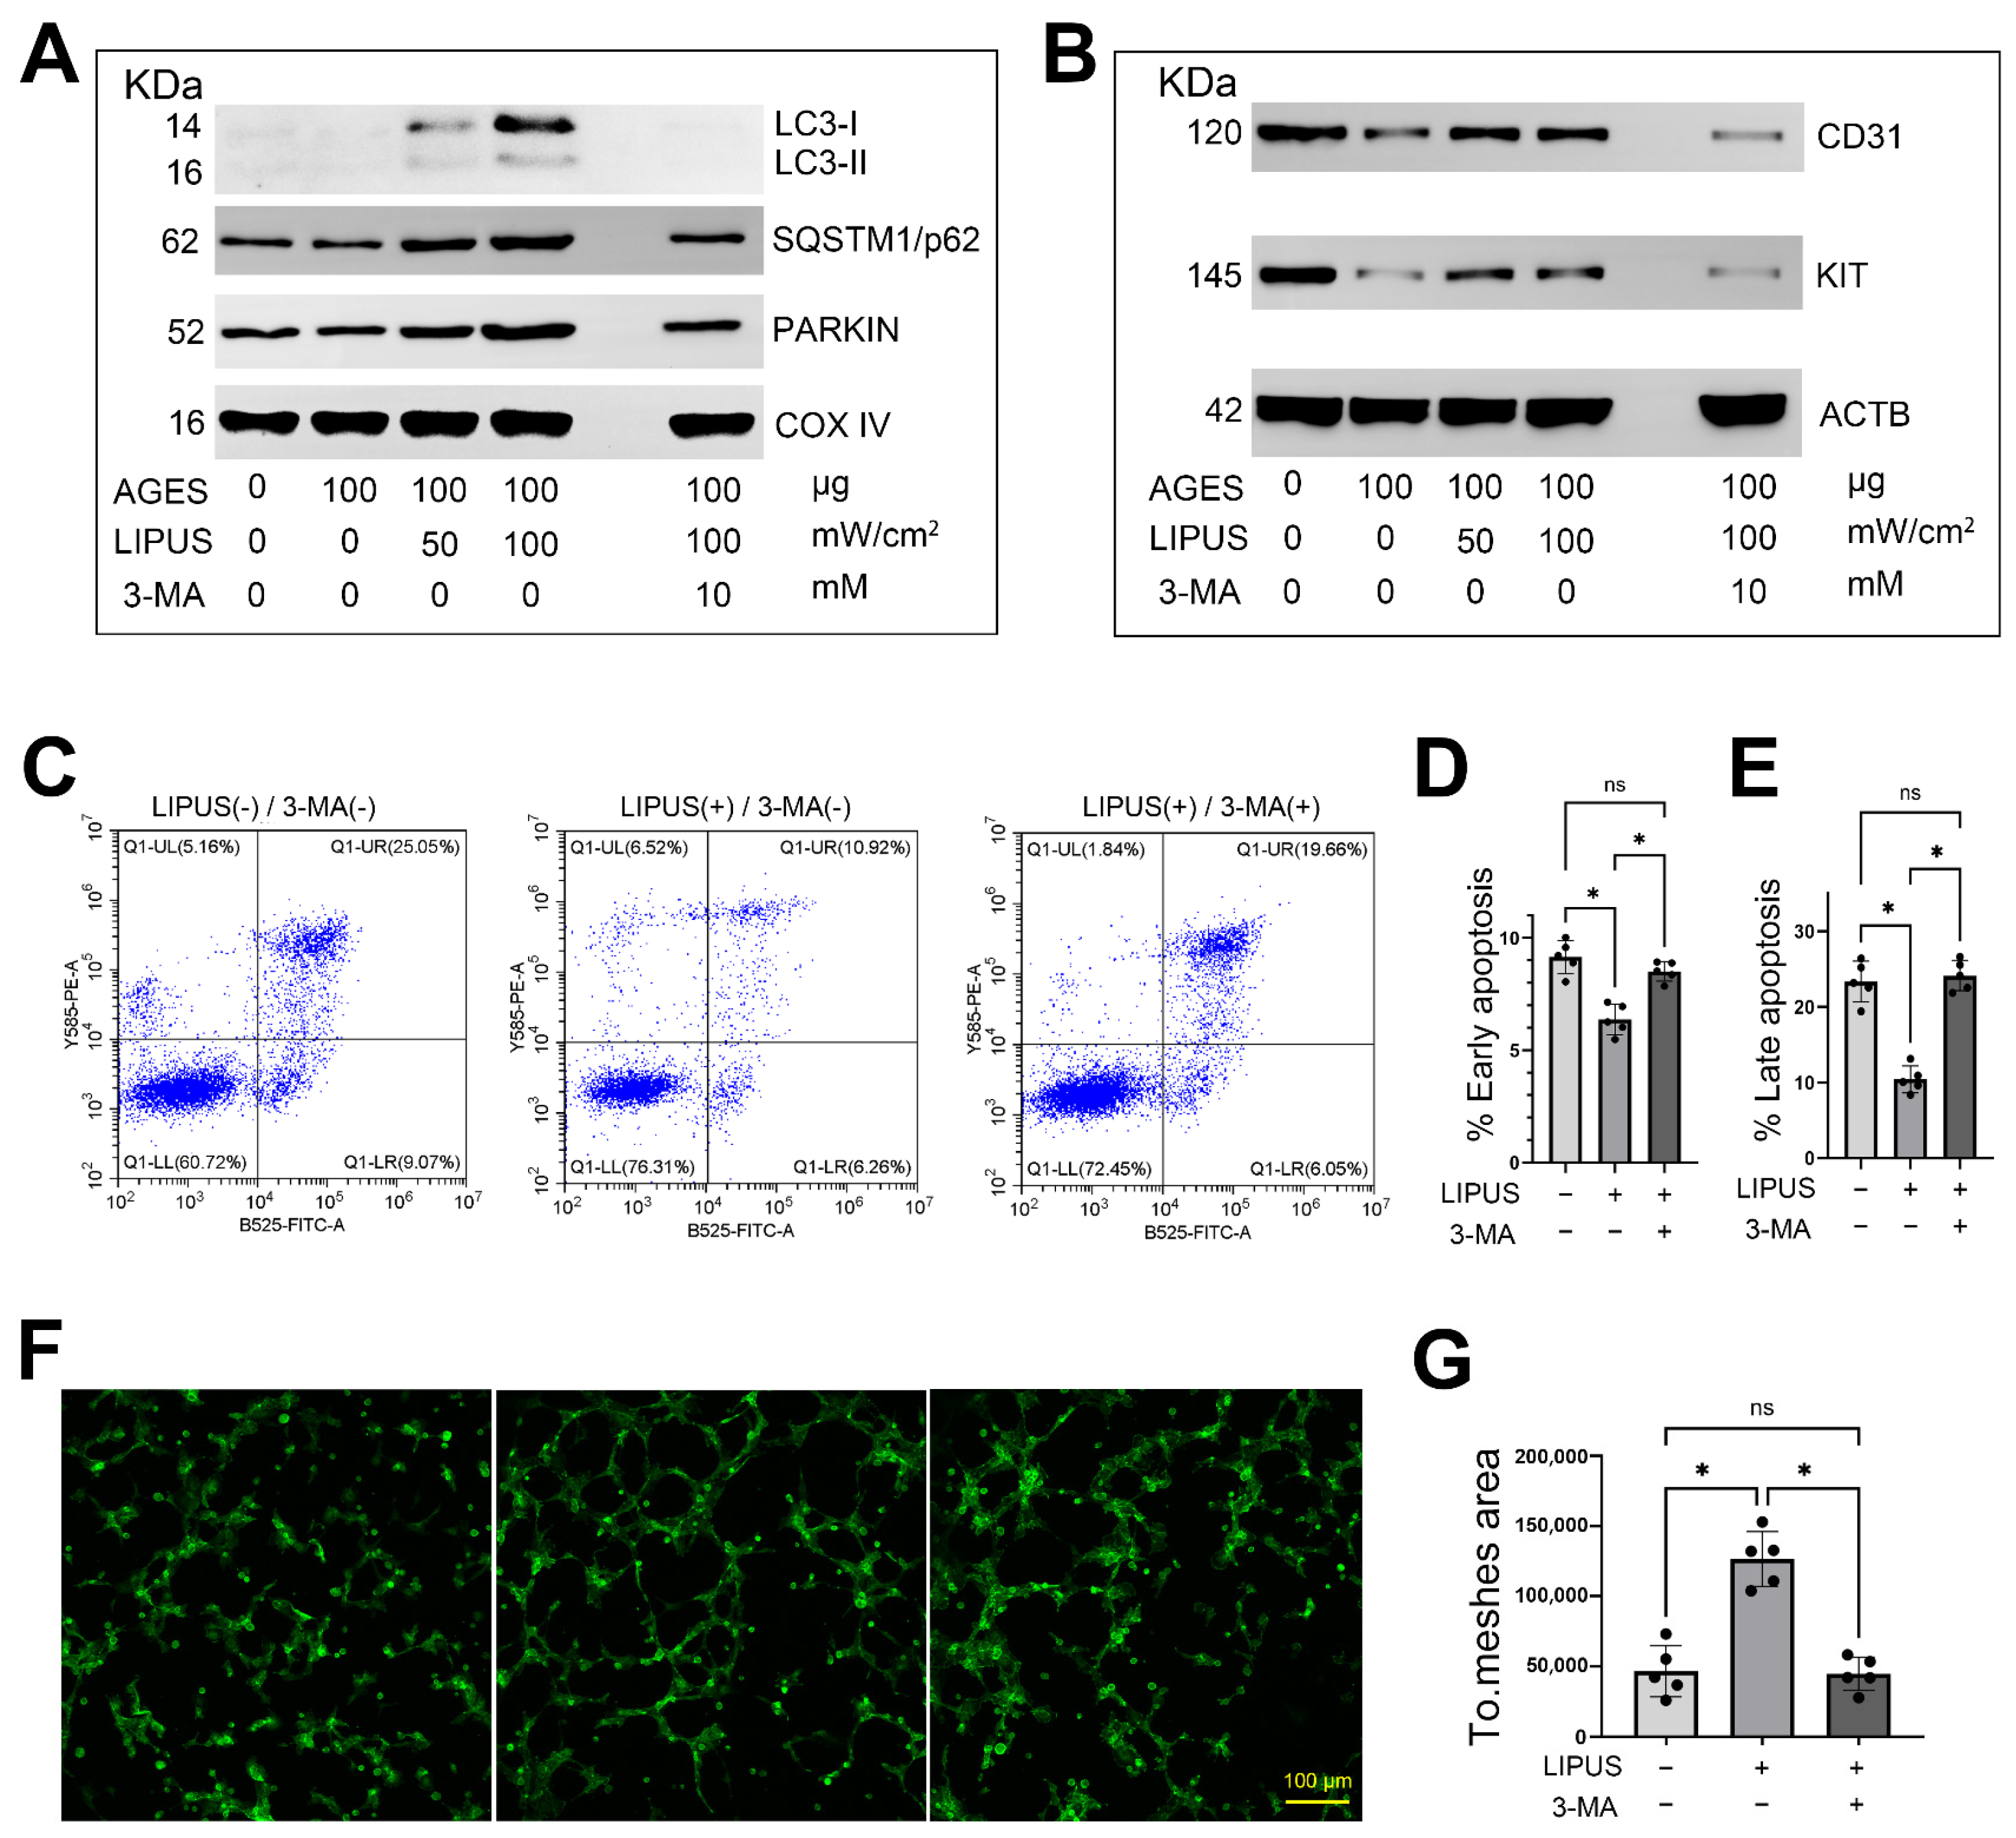
2.6. LIPUS Activates Mitophagy in CCECs In Vitro
2.7. Inhibition of Mitophagy Attenuates the Therapeutic Effects of LIPUS
3. Discussion
4. Materials and Methods
4.1. Contact Information for Reagent and Resource Sharing
4.2. Experimental Models and Subject Details
4.3. Isolation and Culture of CCECs
4.4. Immunocytochemistry (ICC) and Immunohistochemical (IHC) Staining
4.5. Endothelial Cell Functional Experiments
4.6. Cell Apoptosis Analysis
4.7. RNA-Seq of CCECs In Vitro
4.8. Statistics and Reproducibility
Supplementary Materials
Author Contributions
Funding
Institutional Review Board Statement
Informed Consent Statement
Data Availability Statement
Acknowledgments
Conflicts of Interest
References
- Kouidrat, Y.; Pizzol, D.; Cosco, T.; Thompson, T.; Carnaghi, M.; Bertoldo, A.; Solmi, M.; Stubbs, B.; Veronese, N. High prevalence of erectile dysfunction in diabetes: A systematic review and meta-analysis of 145 studies. Diabet. Med. A J. Br. Diabet. Assoc. 2017, 34, 1185–1192. [Google Scholar] [CrossRef] [PubMed]
- Brownlee, M. Biochemistry and molecular cell biology of diabetic complications. Nature 2001, 414, 813–820. [Google Scholar] [CrossRef] [PubMed]
- Castela, Â.; Costa, C. Molecular mechanisms associated with diabetic endothelial-erectile dysfunction. Nat. Rev. Urol. 2016, 13, 266–274. [Google Scholar] [CrossRef]
- Matsumoto, T.; Taguchi, K.; Kobayashi, T. Relationships between advanced glycation end products (AGEs), vasoactive substances, and vascular function. J. Smooth Muscle Res. Nihon Heikatsukin Gakkai Kikanshi 2021, 57, 94–107. [Google Scholar] [CrossRef] [PubMed]
- Matsumoto, T.; Goulopoulou, S.; Taguchi, K.; Tostes, R.C.; Kobayashi, T. Constrictor prostanoids and uridine adenosine tetraphosphate: Vascular mediators and therapeutic targets in hypertension and diabetes. Br. J. Pharm. 2015, 172, 3980–4001. [Google Scholar] [CrossRef] [PubMed]
- Goto, K.; Kitazono, T. Endothelium-Dependent Hyperpolarization (EDH) in Diabetes: Mechanistic Insights and Therapeutic Implications. Int. J. Mol. Sci. 2019, 20, 3737. [Google Scholar] [CrossRef] [PubMed]
- Bierhaus, A.; Hofmann, M.A.; Ziegler, R.; Nawroth, P.P. AGEs and their interaction with AGE-receptors in vascular disease and diabetes mellitus. I. The AGE concept. Cardiovasc. Res. 1998, 37, 586–600. [Google Scholar] [CrossRef]
- Yamagishi, S.; Maeda, S.; Matsui, T.; Ueda, S.; Fukami, K.; Okuda, S. Role of advanced glycation end products (AGEs) and oxidative stress in vascular complications in diabetes. Biochim. Biophys. Acta 2012, 1820, 663–671. [Google Scholar] [CrossRef]
- Zhao, L.; Han, S.; Su, H.; Li, J.; Zhi, E.; Li, P.; Yao, C.; Tian, R.; Chen, H.; Chen, H.; et al. Single-cell transcriptome atlas of the human corpus cavernosum. Nat. Commun. 2022, 13, 4302. [Google Scholar] [CrossRef]
- Terentes-Printzios, D.; Ioakeimidis, N.; Rokkas, K.; Vlachopoulos, C. Interactions between erectile dysfunction, cardiovascular disease and cardiovascular drugs. Nat. Rev. Cardiol. 2022, 19, 59–74. [Google Scholar] [CrossRef]
- Nishikawa, T.; Edelstein, D.; Du, X.L.; Yamagishi, S.; Matsumura, T.; Kaneda, Y.; Yorek, M.A.; Beebe, D.; Oates, P.J.; Hammes, H.P.; et al. Normalizing mitochondrial superoxide production blocks three pathways of hyperglycaemic damage. Nature 2000, 404, 787–790. [Google Scholar] [CrossRef]
- Rolo, A.P.; Palmeira, C.M. Diabetes and mitochondrial function: Role of hyperglycemia and oxidative stress. Toxicol. Appl. Pharmacol. 2006, 212, 167–178. [Google Scholar] [CrossRef] [PubMed]
- Zheng, H.; Zhu, H.; Liu, X.; Huang, X.; Huang, A.; Huang, Y. Mitophagy in Diabetic Cardiomyopathy: Roles and Mechanisms. Front. Cell Dev. Biol. 2021, 9, 750382. [Google Scholar] [CrossRef] [PubMed]
- Vásquez-Trincado, C.; García-Carvajal, I.; Pennanen, C.; Parra, V.; Hill, J.A.; Rothermel, B.A.; Lavandero, S. Mitochondrial dynamics, mitophagy and cardiovascular disease. J. Physiol. 2016, 594, 509–525. [Google Scholar] [CrossRef] [PubMed]
- Jiang, X.; Savchenko, O.; Li, Y.; Qi, S.; Yang, T.; Zhang, W.; Chen, J. A Review of Low-Intensity Pulsed Ultrasound for Therapeutic Applications. IEEE Trans. Bio-Med. Eng. 2019, 66, 2704–2718. [Google Scholar] [CrossRef]
- Cui, W.; Li, H.; Guan, R.; Li, M.; Yang, B.; Xu, Z.; Lin, M.; Tian, L.; Zhang, X.; Li, B.; et al. Efficacy and safety of novel low-intensity pulsed ultrasound (LIPUS) in treating mild to moderate erectile dysfunction: A multicenter, randomized, double-blind, sham-controlled clinical study. Transl. Urol 2019, 8, 307–319. [Google Scholar] [CrossRef]
- Huang, Y.; Xiang, X.; Luo, X.; Li, X.; Yu, X.; Li, S. Study on the emulsification and oxidative stability of ovalbumin-pectin-pumpkin seed oil emulsions using ovalbumin solution prepared by ultrasound. Ultrason. Sonochem. 2021, 78, 105717. [Google Scholar] [CrossRef] [PubMed]
- Kang, P.L.; Huang, H.H.; Chen, T.; Ju, K.C.; Kuo, S.M. Angiogenesis-promoting effect of LIPUS on hADSCs and HUVECs cultured on collagen/hyaluronan scaffolds. Mater. Sci. Eng. C Mater. Biol. Appl. 2019, 102, 22–33. [Google Scholar] [CrossRef]
- Man, V.H.; Li, M.S.; Derreumaux, P.; Wang, J.; Nguyen, T.T.; Nangia, S.; Nguyen, P.H. Molecular mechanism of ultrasound interaction with a blood brain barrier model. J. Chem. Phys. 2020, 153, 045104. [Google Scholar] [CrossRef] [PubMed]
- Guo, T.; Liu, T.; Sun, Y.; Liu, X.; Xiong, R.; Li, H.; Li, Z.; Zhang, Z.; Tian, Z.; Tian, Y. Sonodynamic therapy inhibits palmitate-induced beta cell dysfunction via PINK1/Parkin-dependent mitophagy. Cell Death Dis. 2019, 10, 457. [Google Scholar] [CrossRef] [Green Version]
- Wang, W.; Jiang, H.; Zhu, H.; Zhang, H.; Gong, J.; Zhang, L.; Ding, Q. Overexpression of high mobility group box 1 and 2 is associated with the progression and angiogenesis of human bladder carcinoma. Oncol. Lett. 2013, 5, 884–888. [Google Scholar] [CrossRef] [PubMed]
- Sun, H.Y.; Wei, S.P.; Xu, R.C.; Xu, P.X.; Zhang, W.C. Sphingosine-1-phosphate induces human endothelial VEGF and MMP-2 production via transcription factor ZNF580: Novel insights into angiogenesis. Biochem. Biophys. Res. Commun. 2010, 395, 361–366. [Google Scholar] [CrossRef] [PubMed]
- Huang, X.; Sun, J.; Chen, G.; Niu, C.; Wang, Y.; Zhao, C.; Sun, J.; Huang, H.; Huang, S.; Liang, Y.; et al. Resveratrol Promotes Diabetic Wound Healing via SIRT1-FOXO1-c-Myc Signaling Pathway-Mediated Angiogenesis. Front. Pharm. 2019, 10, 421. [Google Scholar] [CrossRef] [PubMed]
- Fan, C.S.; Chen, W.S.; Chen, L.L.; Chen, C.C.; Hsu, Y.T.; Chua, K.V.; Wang, H.D.; Huang, T.S. Osteopontin-integrin engagement induces HIF-1α-TCF12-mediated endothelial-mesenchymal transition to exacerbate colorectal cancer. Oncotarget 2018, 9, 4998–5015. [Google Scholar] [CrossRef] [PubMed]
- Lei, H.; Xin, H.; Guan, R.; Xu, Y.; Li, H.; Tian, W.; Wang, L.; Gao, Z.; Guo, Y.; Lue, T.F.; et al. Low-intensity Pulsed Ultrasound Improves Erectile Function in Streptozotocin-induced Type I Diabetic Rats. Urology 2015, 86, 1241.e1211–1248. [Google Scholar] [CrossRef] [PubMed]
- Yang, Y.; Li, T.; Li, Z.; Liu, N.; Yan, Y.; Liu, B. Role of Mitophagy in Cardiovascular Disease. Aging Dis. 2020, 11, 419–437. [Google Scholar] [CrossRef]
- Zorov, D.B.; Juhaszova, M.; Sollott, S.J. Mitochondrial reactive oxygen species (ROS) and ROS-induced ROS release. Physiol. Rev. 2014, 94, 909–950. [Google Scholar] [CrossRef] [PubMed]
- Galloway, C.A.; Yoon, Y. Mitochondrial morphology in metabolic diseases. Antioxid. Redox Signal. 2013, 19, 415–430. [Google Scholar] [CrossRef] [PubMed]
- Xu, X.M.; Xu, T.M.; Wei, Y.B.; Gao, X.X.; Sun, J.C.; Wang, Y.; Kong, Q.J.; Shi, J.G. Low-Intensity Pulsed Ultrasound Treatment Accelerates Angiogenesis by Activating YAP/TAZ in Human Umbilical Vein Endothelial Cells. Ultrasound Med. Biol. 2018, 44, 2655–2661. [Google Scholar] [CrossRef] [PubMed]
- Piera-Velazquez, S.; Jimenez, S.A. Endothelial to Mesenchymal Transition: Role in Physiology and in the Pathogenesis of Human Diseases. Physiol. Rev. 2019, 99, 1281–1324. [Google Scholar] [CrossRef]
- Shaw, J.E.; Sicree, R.A.; Zimmet, P.Z. Global estimates of the prevalence of diabetes for 2010 and 2030. Diabetes Res. Clin. Pract. 2010, 87, 4–14. [Google Scholar] [CrossRef] [PubMed]
- Boeri, L.; Capogrosso, P.; Ventimiglia, E.; Schifano, N.; Montanari, E.; Montorsi, F.; Salonia, A. Sexual Dysfunction in Men with Prediabetes. Sex. Med. Rev. 2020, 8, 622–634. [Google Scholar] [CrossRef]
- Palumbo, P.J. Metabolic risk factors, endothelial dysfunction, and erectile dysfunction in men with diabetes. Am. J. Med. Sci. 2007, 334, 466–480. [Google Scholar] [CrossRef]
- Shi, Y.; Vanhoutte, P.M. Macro- and microvascular endothelial dysfunction in diabetes. J. Diabetes 2017, 9, 434–449. [Google Scholar] [CrossRef]
- Nowotny, K.; Jung, T.; Höhn, A.; Weber, D.; Grune, T. Advanced glycation end products and oxidative stress in type 2 diabetes mellitus. Biomolecules 2015, 5, 194–222. [Google Scholar] [CrossRef]
- Goldstein, I.; Young, J.M.; Fischer, J.; Bangerter, K.; Segerson, T.; Taylor, T. Vardenafil, a new phosphodiesterase type 5 inhibitor, in the treatment of erectile dysfunction in men with diabetes: A multicenter double-blind placebo-controlled fixed-dose study. Diabetes Care 2003, 26, 777–783. [Google Scholar] [CrossRef]
- Banarjee, R.; Sharma, A.; Bai, S.; Deshmukh, A.; Kulkarni, M. Proteomic study of endothelial dysfunction induced by AGEs and its possible role in diabetic cardiovascular complications. J. Proteom. 2018, 187, 69–79. [Google Scholar] [CrossRef] [PubMed]
- Agarwal, A.; Nandipati, K.C.; Sharma, R.K.; Zippe, C.D.; Raina, R. Role of oxidative stress in the pathophysiological mechanism of erectile dysfunction. J. Androl. 2006, 27, 335–347. [Google Scholar] [CrossRef] [PubMed]
- Sarparanta, J.; García-Macia, M.; Singh, R. Autophagy and Mitochondria in Obesity and Type 2 Diabetes. Curr. Diabetes Rev. 2017, 13, 352–369. [Google Scholar] [CrossRef] [PubMed]
- Chung, E.; Lee, J.; Liu, C.C.; Taniguchi, H.; Zhou, H.L.; Park, H.J. Clinical Practice Guideline Recommendation on the Use of Low Intensity Extracorporeal Shock Wave Therapy and Low Intensity Pulsed Ultrasound Shock Wave Therapy to Treat Erectile Dysfunction: The Asia-Pacific Society for Sexual Medicine Position Statement. World J. Men’s Health 2021, 39, 1–8. [Google Scholar] [CrossRef] [PubMed]
- Chiang, P.K.; Yang, F.Y. A potential treatment of low intensity pulsed ultrasound on cavernous nerve injury for erectile dysfunction. Med. Hypotheses 2019, 122, 19–21. [Google Scholar] [CrossRef]
- Hill, J.M.; Zalos, G.; Halcox, J.P.; Schenke, W.H.; Waclawiw, M.A.; Quyyumi, A.A.; Finkel, T. Circulating endothelial progenitor cells, vascular function, and cardiovascular risk. N. Engl. J. Med. 2003, 348, 593–600. [Google Scholar] [CrossRef]
- Tsai, P.S.; Chiu, C.Y.; Sheu, M.L.; Yang, C.Y.; Lan, K.C.; Liu, S.H. Advanced glycation end products activated endothelial-to-mesenchymal transition in pancreatic islet endothelial cells and triggered islet fibrosis in diabetic mice. Chem. -Biol. Interact. 2021, 345, 109562. [Google Scholar] [CrossRef] [PubMed]
- Deng, X.; Huang, W.; Peng, J.; Zhu, T.T.; Sun, X.L.; Zhou, X.Y.; Yang, H.; Xiong, J.F.; He, H.Q.; Xu, Y.H.; et al. Irisin Alleviates Advanced Glycation End Products-Induced Inflammation and Endothelial Dysfunction via Inhibiting ROS-NLRP3 Inflammasome Signaling. Inflammation 2018, 41, 260–275. [Google Scholar] [CrossRef] [PubMed]
- Hirota, Y.; Yamashita, S.; Kurihara, Y.; Jin, X.; Aihara, M.; Saigusa, T.; Kang, D.; Kanki, T. Mitophagy is primarily due to alternative autophagy and requires the MAPK1 and MAPK14 signaling pathways. Autophagy 2015, 11, 332–343. [Google Scholar] [CrossRef]
- Zhao, L.; Yao, C.; Xing, X.; Jing, T.; Li, P.; Zhu, Z.; Yang, C.; Zhai, J.; Tian, R.; Chen, H.; et al. Single-cell analysis of developing and azoospermia human testicles reveals central role of Sertoli cells. Nat. Commun. 2020, 11, 5683. [Google Scholar] [CrossRef] [PubMed]
- Zhao, L.; Zhu, Z.; Yao, C.; Huang, Y.; Zhi, E.; Chen, H.; Tian, R.; Li, P.; Yuan, Q.; Xue, Y.; et al. VEGFC/VEGFR3 Signaling Regulates Mouse Spermatogonial Cell Proliferation via the Activation of AKT/MAPK and Cyclin D1 Pathway and Mediates the Apoptosis by affecting Caspase 3/9 and Bcl-2. Cell Cycle 2018, 17, 225–239. [Google Scholar] [CrossRef] [PubMed]
- Zudaire, E.; Gambardella, L.; Kurcz, C.; Vermeren, S. A computational tool for quantitative analysis of vascular networks. PLoS ONE 2011, 6, e27385. [Google Scholar] [CrossRef] [PubMed] [Green Version]


Publisher’s Note: MDPI stays neutral with regard to jurisdictional claims in published maps and institutional affiliations. |
© 2022 by the authors. Licensee MDPI, Basel, Switzerland. This article is an open access article distributed under the terms and conditions of the Creative Commons Attribution (CC BY) license (https://creativecommons.org/licenses/by/4.0/).
Share and Cite
Chen, Y.; Xiao, M.; Zhao, L.; Huang, Y.; Lin, Y.; Xie, T.; Tian, J.; Wang, Q.; Tang, Y.; Su, Z. Low-Intensity Pulsed Ultrasound Counteracts Advanced Glycation End Products-Induced Corpus Cavernosal Endothelial Cell Dysfunction via Activating Mitophagy. Int. J. Mol. Sci. 2022, 23, 14887. https://doi.org/10.3390/ijms232314887
Chen Y, Xiao M, Zhao L, Huang Y, Lin Y, Xie T, Tian J, Wang Q, Tang Y, Su Z. Low-Intensity Pulsed Ultrasound Counteracts Advanced Glycation End Products-Induced Corpus Cavernosal Endothelial Cell Dysfunction via Activating Mitophagy. International Journal of Molecular Sciences. 2022; 23(23):14887. https://doi.org/10.3390/ijms232314887
Chicago/Turabian StyleChen, Yuzhuo, Ming Xiao, Liangyu Zhao, Yongquan Huang, Yuhong Lin, Ting Xie, Jiali Tian, Qi Wang, Yuxin Tang, and Zhongzhen Su. 2022. "Low-Intensity Pulsed Ultrasound Counteracts Advanced Glycation End Products-Induced Corpus Cavernosal Endothelial Cell Dysfunction via Activating Mitophagy" International Journal of Molecular Sciences 23, no. 23: 14887. https://doi.org/10.3390/ijms232314887