Article

Genome-Wide Characterization and Expression Profiling of the GRAS Gene Family in Salt and Alkali Stresses in Miscanthus sinensis

1
CAS Key Laboratory of Biofuels, Shandong Provincial Key Laboratory of Energy Genetics, Qingdao Institute of Bioenergy and Bioprocess Technology, Chinese Academy of Sciences, Qingdao 266101, China
2
Shandong Energy Institute, Qingdao 266101, China
3
Qingdao New Energy Shandong Laboratory, Qingdao 266101, China
4
College of Bioscience and Technology, Hunan Agricultural University, Changsha 410128, China
*
Authors to whom correspondence should be addressed.
Int. J. Mol. Sci. 2022, 23(23), 14521; https://doi.org/10.3390/ijms232314521
Submission received: 30 September 2022 / Revised: 10 November 2022 / Accepted: 17 November 2022 / Published: 22 November 2022
(This article belongs to the Special Issue Functional Genomics of Energy Crops)

Abstract

:
The GRAS family genes encode plant-specific transcription factors that play important roles in a diverse range of developmental processes and abiotic stress responses. However, the information of GRAS gene family in the bioenergy crop Miscanthus has not been available. Here, we report the genome-wide identification of GRAS gene family in Micanthus sinensis. A total of 123 MsGRAS genes were identified, which were divided into ten subfamilies based on the phylogenetic analysis. The co-linearity analysis revealed that 59 MsGRAS genes experienced segmental duplication, forming 35 paralogous pairs. The expression of six MsGRAS genes in responding to salt, alkali, and mixed salt-alkali stresses was analyzed by transcriptome and real-time quantitative PCR (RT-qPCR) assays. Furthermore, the role of MsGRAS60 in salt and alkali stress response was characterized in transgenic Arabidopsis. The MsGRAS60 overexpression lines exhibited hyposensitivity to abscisic acid (ABA) treatment and resulted in compromised tolerance to salt and alkali stresses, suggesting that MsGRAS60 is a negative regulator of salt and alkali tolerance via an ABA-dependent signaling pathway. The salt and alkali stress-inducible MsGRAS genes identified serve as candidates for the improvement of abiotic stress tolerance in Miscanthus.

1. Introduction

Soil salinization is becoming a major global environmental concern, which substantially affects the productivity of major crops and causes the deterioration of the ecological system [1]. Global saline soil has reached 424 million hectares, covering 3.9% of the land area in 2021 [2]. Moreover, the area of saline soil keeps increasing at a rate of 1–2 million hectares per year, and it is predicted to further increase due to changing environmental factors such as global warming and climate change [3]. How to alleviate land salinization and improve crop productivity in saline soil has always been an important research topic. Although a lot of physical, chemical, and engineering practices have been implemented in the reclamation of saline soil, they are faced with various shortcomings, such as cost-ineffective, laborious, non-environment friendly, and reversible reclamation effects. As an attractive alternative, the biological measures are more economical and environment-friendly for the reclamation of saline soil [4,5]. One of the biological measures of saline soil reclamation is the improvement of plant salt stress tolerance through various breeding techniques (e.g., molecular breeding) [6]. However, identification and functional characterization of key genes regulating salt stress response is a prerequisite for the genetic improvement of salt stress tolerance through breeding.
Miscanthus is a perennial C4 grass deemed as an ideal bioenergy crop for cellulosic bioethanol production. Miscanthus has several outstanding characteristics, such as high photosynthesis efficiency, large biomass yield, superior stress tolerance, and wide adaptability to various environments, which warrant it being one of the most promising bioenergy crops in European countries and China [7]. Therefore, it has wide adaptability in a broad range of tropical and temperate regions and yields a huge amount of lignocellulosic biomass [8,9]. Cultivation of Miscanthus on marginal land (e.g., saline soil) that is not arable for agronomic crops will not only provide sufficient raw materials for the second-generation bioethanol production, but will also help in the reclamation of saline soils, reduction of CO2 emissions, and carbon sequestration and neutralization [10,11]. However, compared with the main crops, the genetic improvement of Miscanthus lags far behind because of its complex genetic background, and the unclarified molecular mechanisms underlying agronomic traits and abiotic stress tolerance [12]. Recently, the genomic sequences of three Miscanthus species (i.e., Miscanthus sinensis, Miscanthus floridulus, and Miscanthus lutarioriparius) have been released [13,14,15], which significantly facilitates the identification of candidate genes governing important agronomic traits and stress tolerance in Miscanthus. The availability of these genomic resources is expected to accelerate the application of molecular breeding approaches in this important bioenergy crop.
The GRAS family genes encode plant-specific transcription factors named after the first three discovered members, i.e., GAI (gibberellic acid-insensitive), RGA (repressor of GAI), and SCR (scarecrow) [16]. The C-terminus of GRAS proteins is highly conserved, while the N-terminus is relatively variable. The conserved C-terminal domain consists of LHRI (Leucine Heptad Repeat I), LHRII, VHIID, PFYRE, and SAW subdomains [16,17]. Based on the conserved domains, GRAS members are divided into eight subfamilies including SCL3, SHR, PAT1, LISCL, DELLA, SCR, LAS, and HAM [17]. GRAS genes play important roles in diverse physiological and developmental processes including gibberellin acid (GA) signaling, meristem initiation and maintenance, and phytochrome A signaling [18]. Recent evidence indicates that GRAS transcription factors are involved in regulating plant abiotic stress responses. For example, a subset of GRAS genes in model plant species, such as Arabidopsis (Arabidopsis thaliana), rice (Oryza sativa), and tomato (Solanum lycopersicum) are documented to be involved in drought and salt stress tolerances. For instance, the DELLA proteins play vital roles in the response to cold and salt stresses by negatively regulating plant GA signaling in Arabidopsis [19,20,21]. AtSCL14 and OsGRAS23, members of the LISCL subfamily from Arabidopsis and rice, are both positive regulators of drought stress tolerance [22,23,24]. SlGARS7 and SlGRAS10 from the PAT1 subfamily, and SlGRAS40 from the HAM subfamily, are involved in drought and salt stress responses in tomato. When ectopically expressed, the transgenic lines confer enhanced drought and salt stress tolerances in tomato [25,26,27]. Apart from these GRAS genes, an increasing number of GRAS genes from other plant species such as poplar (Populus euphratica Oliv), rapeseed (Brassica napus), and soybean (Glycine max) have been identified to be involved in tolerance against a variety of abiotic stresses. For example, the poplar GRAS gene PeSCL7 from the SCL subfamily confers enhanced drought and salt stress tolerances when overexpressed in Arabidopsis [28]. Overexpression of BrLAS from rapeseed results in improved drought tolerance in Arabidopsis [29]. Likewise, overexpression of GmGRAS37, a member of the LISCL subfamily, leads to significantly improved salt stress tolerance in transgenic soybean [30].
Despite that GRAS genes play important roles in plant development and abiotic stress responses, genome-wide identification and systematic analysis of the GARS gene family in Miscanthus has not been performed to date. Here we report the genome-wide identification of GRAS gene family in Miscanthus. A comprehensive analysis of Miscanthus GRAS gene family including sequence phylogeny, chromosomal location, segmental duplication, gene and protein structure, and expression profiling in saline and alkaline stress response are presented. In addition, we functionally characterize MsGRAS60 in response to salt and alkali stresses in transgenic Arabidopsis. Our results enrich the understanding of the roles of GRAS genes in plant abiotic stress responses. The salt and alkali stress-inducible GRAS genes identified provide valuable candidates for future functional characterization of their roles in abiotic stress tolerance, which is expected to contribute to the improvement of Miscanthus abiotic stress tolerance via genetic engineering.

2. Results

2.1. Genome-Wide Identification of GRAS Genes in M. sinensis

The GRAS protein sequences were identified by local BLAST search against the annotated genome of M. sinensis using the HMM profile of the GRAS domain. The presence of the GRAS domain was further confirmed with the conserved domain (CD) search at NCBI. Meanwhile, sequences encoding less than 100 amino acids in length were manually excluded. Ultimately, 123 GRAS genes were identified in M. sinensis genome. They were designated MsGRAS1 to MsGRAS123 based on the physical locations on chromosomes. Detailed information of M. sinensis GRAS genes and their closest Arabidopsis orthologs are provided in Table 1. Generally, there were more than two MsGRAS orthologs for each Arabidopsis GRAS gene.

2.2. Chromosomal Locations of MsGRAS Genes

Mapping of MsGRAS genes to chromosomes revealed that 108 of the 123 (87.8%) MsGRAS genes were located unevenly on 18 chromosomes, except for chromosome 13 (Figure 1 and Figure S1), while the rest were located on non-assembled scaffolds. The number of MsGRAS genes varied among different chromosomes. For example, there were 15 MsGRAS genes on chromosome 1, while only one gene was identified on chromosomes 8, 10, 14, 15, and 19, respectively. The distributions of MsGRAS genes on the chromosome were also not evenly arranged. For example, the MsGRAS genes on chromosomes 3 and 4 were concentrated in a small genomic area forming gene clusters. By contrast, the distributions of MsGRAS genes on chromosome 1 were relatively scattered.
To explore whether MsGRAS genes experienced duplication during the evolutionary process, we performed a co-linearity analysis based on the sequence homology of MsGRAS genes. The MsGRAS genes located in the same segmental duplication regions were shown in the Circos diagram (Figure 1). A total of 59 MsGRAS genes, accounting for 55% of the total genes with chromosome locations, were located in segmental duplication regions derived during the evolution of M. sinensis. The largest number of 16 MsGRAS genes derived from segmental duplications were found between chromosomes 1 and 2. These results indicated that the expansion of MsGRAS gene family is largely attributed to segmental duplication.
The segmental duplication event experienced by MsGRAS led to the formation of paralogous gene pairs. We identified a total of 35 paralogous pairs for MsGRAS genes (Table 2). The protein sequence identity between two members in the paralogous pairs ranged from 59.68% (MsGRAS9/MsGRAS15) to 98.44% (MsGRAS29/MsGRAS39). Substitution rates between non-synonymous (Ka) and synonymous (Ks) sites for each paralogous pair were lower than 1.0, suggesting that the paralogous pairs experienced purifying selection pressure during the evolution. The evolutionary divergence time for each paralogous pair was predicted. MsGRAS12/MsGRAS25 and MsGRAS45/MsGRAS49, the latest duplicated paralogous gene pairs with protein identity of 98.09% and 98.25%, respectively, occurred approximately 0.67 million years ago (Mya). By contrast, MsGRS51/MsGRAS105, the earliest duplicated gene pair with a protein identity of 63.73%, diversified about 103.83 Mya.

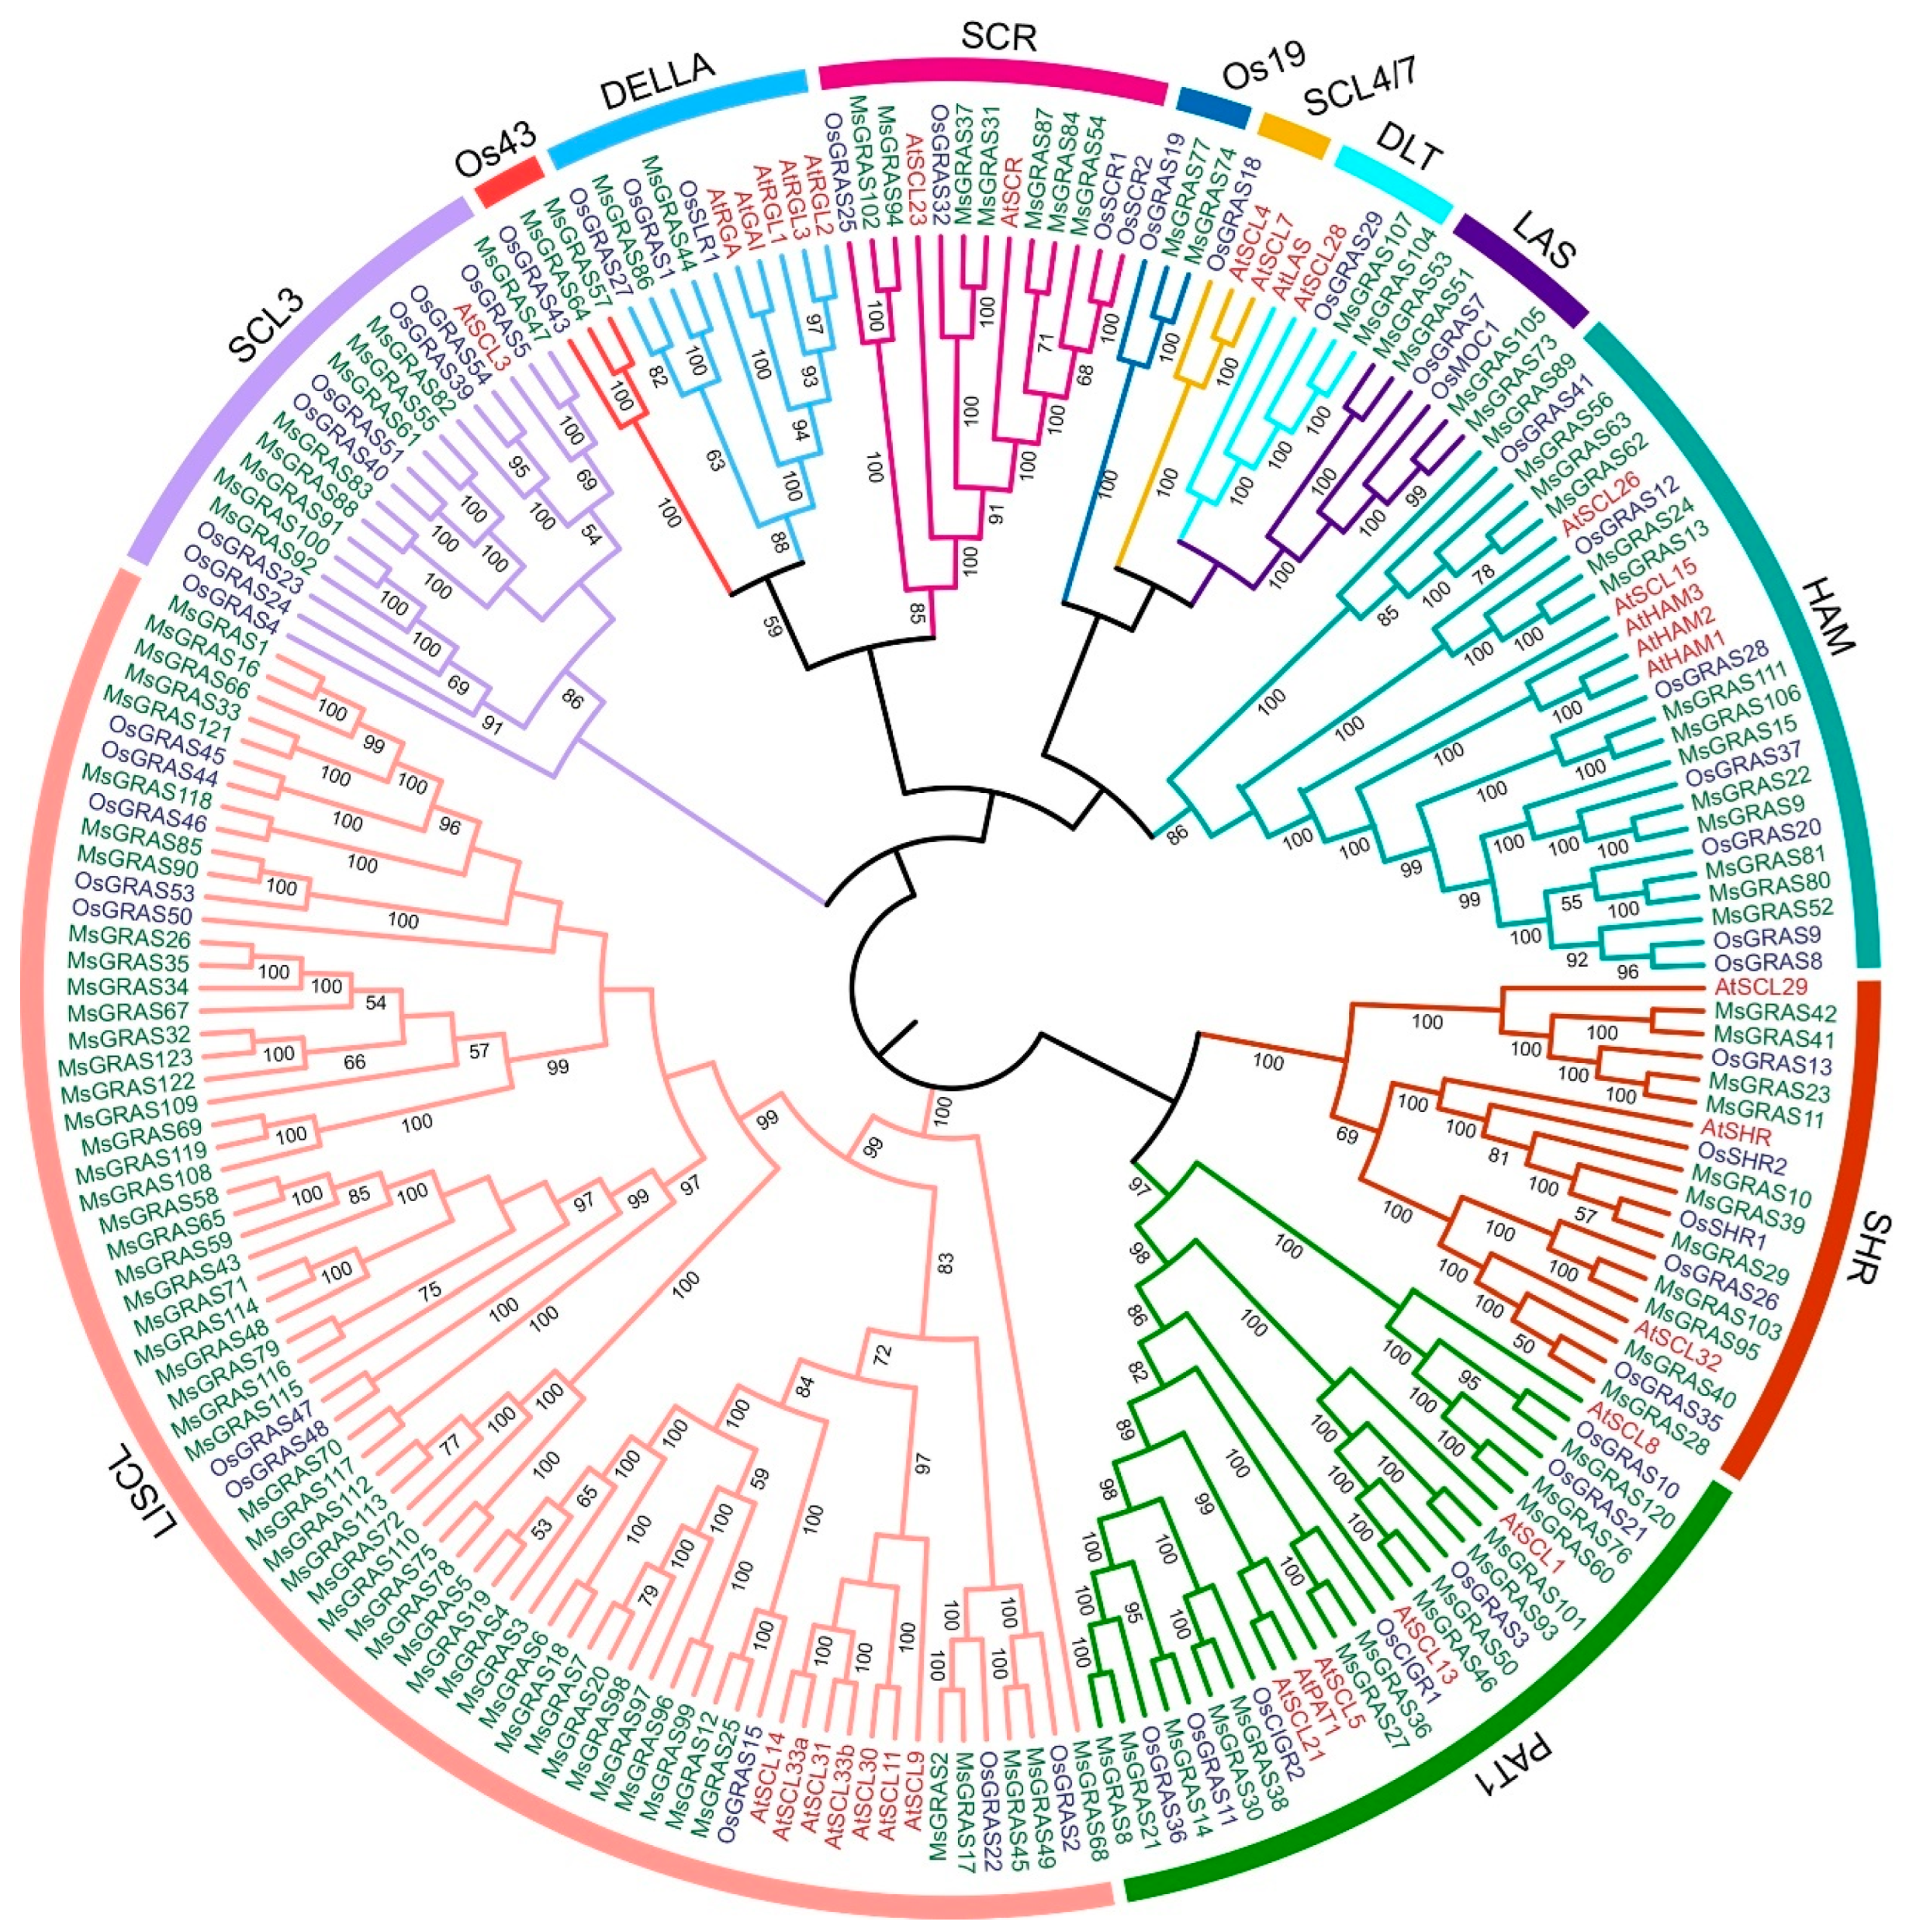
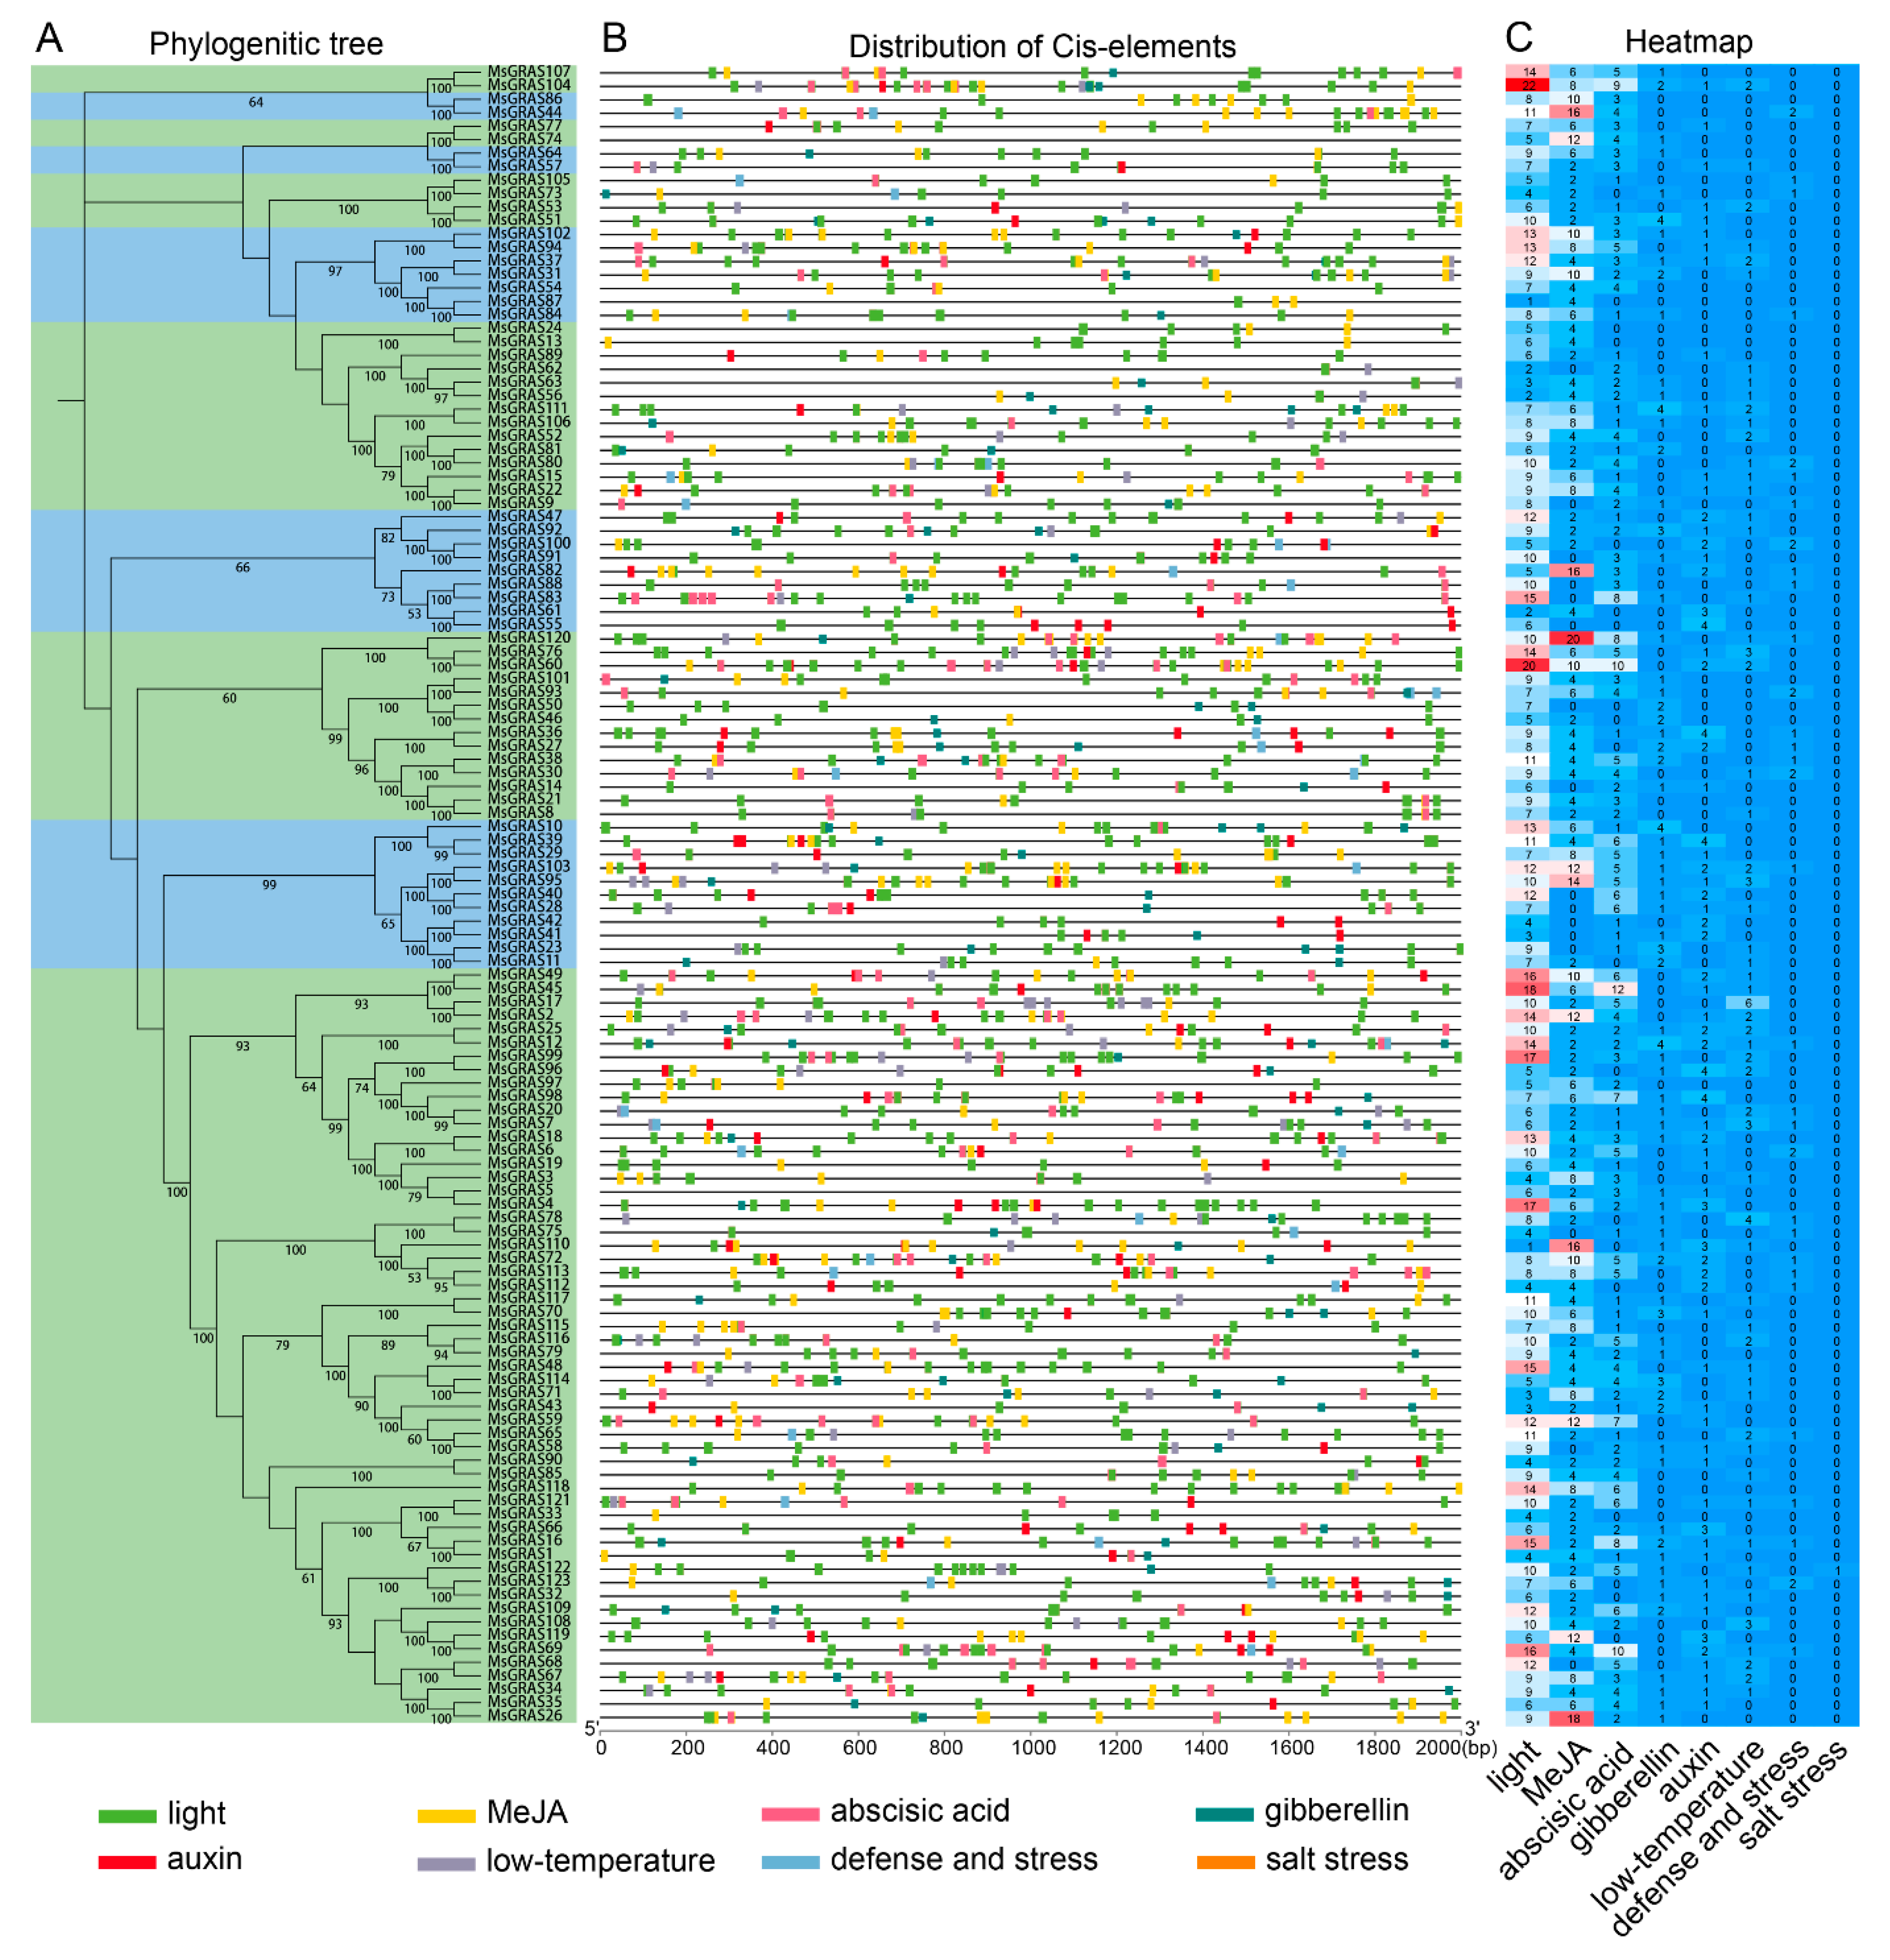
2.3. Phylogenetic Relationships, Gene Structure, and Conserved Motifs of MsGRAS

To reveal the phylogenetic relationship among MsGRAS members, the 123 full-length MsGRAS protein sequences together with GRAS members from Arabidopsis (33) and rice (50), were used to construct an un-rooted neighbor-joining (NJ) phylogenetic tree (Figure 2). The GRAS proteins were classified into 11 subfamilies according to the nomenclature of Arabidopsis and rice GRAS subfamilies in previous studies [31,32]. The MsGRAS proteins were divided into 10 subfamilies except for subfamily SCL4/7 (Figure 3A). The LISCL subfamily was the largest one with 56 MsGRAS members, followed by the HAM subfamily with 14 members. By contrast, the DLT, DELLA, Os19, and Os43 subfamilies were the smallest ones with only two MsGRAS members for each subfamily. It was noteworthy that the number of the MsGRAS members (56) in the LISCL subfamily was significantly expanded compared to the numbers of their counterparts in Arabidopsis (7) and rice (10).
To investigate the features of the conserved domain of MsGRAS, we used MEME to analyze the pattern of motifs in MsGRAS proteins. A total of 20 motifs were discovered in MsGRAS proteins (Figure 3B). The amino acid composition of these identified motifs is presented in Figure S2. The majority of motifs were located in the conserved C-terminus compared to the N-terminus, highlighting the functional importance of the C-terminal region. Twelve motifs were identified to correspond to the five sub-domains in the conserved C-terminal GRAS domain, namely LHRI (motifs 11 and 6), VHIID (motifs 1, 8, and 9), LHRII (motifs 4 and 10), PFYRE (motifs 3, 7, and 13), and SAW (motifs 2 and 5). Despite that the C-terminal region is highly conserved, not all MsGRAS proteins possessed all the five subdomains with corresponding motifs. For instance, MsGRAS18, MsGRAS48, and MsGRAS56 lacked the SAW domain, while the LHRII domain was absent in MsGRAS11, MsGRAS23, MsGRAS41, and MsGRAS42. Generally, the MsGRAS members classified in the same subfamily shared very common motif compositions. For example, the 12 MsGRAS members in the PAT1 subfamily shared 14 identical motifs that were arranged in the same order. The motif compositions of the MsGRAS members in the DLT, DELLA and Os43 subfamilies were identical. It was noteworthy that the N-terminus of MsGRAS proteins in the HAM subfamily was more variable compared with other subfamilies.
Furthermore, we analyzed the pattern of exon-intron distribution in MsGRAS genes to assess its structural diversity (Figure 3C). The results showed that 45 out of 123 genes (36.6%) were intronless genes. The pattern of the intron in terms of size and number was variable between MsGRAS genes. For instance, MsGRAS96 contained an extremely large intron (12.2 kb) whereas MsGRAS48 possessed four tiny introns with varying sizes (0.036 to 0.384 kb). Nevertheless, the pattern of the intron was highly conserved in the same MsGRAS subfamily. For example, 13 out of 14 PAT members contained introns with similar patterns, while 9 out of 11 SHR members lacked introns.

2.4. Cis-Elements in MsGRAS Promoters

We identified the putative cis-elements within 2000 bp MsGRAS promoter sequences upstream of the start codon. The display of the cis-elements in MsGRAS promoters was arranged according to their phylogenetic relationships (Figure 4A). The results showed that the majority of cis-elements identified were associated with light, hormone, and stress responses (Figure 4B). For example, light-responsive cis-elements were present in almost all MsGRAS gene promoters, while phytochrome response elements were only present in MsGRAS18 and MsGRAS47 promoters. In addition, the position and occurrence frequency of these cis-elements in each MsGRAS gene varied significantly (Figure 4C). For example, cis-elements related to MeJA, light, abscisic acid, and stress responses appeared multiple times at different positions for each MsGRAS gene, among which the cis-elements involved in MeJA and light responses appeared most frequently. However, the position and occurrence frequency of cis-elements exhibited no substantial difference among the MsGRAS genes in the same subfamily (Figure 4A,C). Moreover, the paralogous gene pairs, such as MsGRAS11/MsGRAS23, MsGRAS28/MsGRAS40, MsGRAS30/MsGRAS38, MsGRAS45/MsGRAS49, MsGRAS46/MsGRAS50, and MsGRAS91/MsGRAS100 possessed almost identical types of cis-elements with similar occurrence.

2.5. Expression Profiling of MsGRAS Genes in Salt and Alkali Stress

To explore the expression profile of MsGRAS genes in response to saline or/and alkaline stress, we mined their expression profiles using the transcriptome data (unpublished). At least 3, 4, and 8 MsGRAS genes exhibited significantly up-regulated expression (more than two-fold change) under salt, alkali, and mixed salt-alkali stresses, respectively (Figure 5A). For example, the expression of MsGRAS1 and MsGRAS22 was specifically up-regulated under salt stress, while the expression of MsGRAS47, MsGRAS49, and MsGRAS60 was specifically up-regulated under alkali and mixed salt-alkali stresses. Moreover, the expression of MsGRAS27, MsGRAS90, and MsGRAS120 was up-regulated under mixed salt-alkali stress. In addition, the expression of MsGRAS10, MsGRAS121, and MsGRAS66 was down-regulated under alkali stress, while the expression of MsGRAS10 and MsGRAS37 was down-regulated under mixed salt-alkali stress.
To verify the expression profiles of MsGRAS genes under salt and alkali treatments, the relative expression levels of six MsGRAS genes were analyzed by RT-qPCR under salt stress treatment for 8 h. Generally, the expression of MsGRAS genes by RT-qPCR was largely consistent with the transcriptome data (Figure 5A,B and Figure S3). For example, the expression of MsGRAS27, MsGRAS47, and MsGRAS60 was significantly up-regulated while MsGRAS66 and MsGRAS121 were significantly down-regulated after the alkali stress treatment. The expression of MsGRAS27, MsGRAS60 and MsGRAS120 was increased under the mixed salt-alkali stress treatment.
To investigate the expression patterns of paralogous MsGRAS gene pairs, we compared their expression levels under salt and/or alkali stress treatments. The results showed that the expression of several gene pairs, such as MsGRAS1/MsGRAS16, MsGRAS12/MsGRAS25, MsGRAS27/MsGRAS36, and MsGRAS30/MsGRAS38, exhibited significant differences in the absence of stress treatment (Control) (Figure 6). By contrast, the expression of most paralogous gene pairs displayed almost identical patterns under the salt, alkali, and mixed salt-alkali stress treatments. However, the expression of several paralogous gene pairs such as MsGRAS46/MsGRAS93 and MsGRAS50/MsGRAS101 showed divergent patterns under alkali stress treatment. Moreover, paralogous gene pairs such as MsGRAS9/MsGRAS22, MsGRAS45/MsGRAS49, MsGRAS50/MsGRAS101, and MsGRAS93/MsGRAS101 exhibited significant expression differences after the salt and alkali stress treatments. Interestingly, gene pairs (i.e., MsGRAS12/MsGRAS25 and MsGRAS27/MsGRAS36) exhibited a significant expression difference when the stress was absent whereas the difference narrowed when subjected to the alkali stress.

2.6. MsGRAS60 Overexpression Confers Compromised Salt and Alkali Tolerance in Arabidopsis

The expression analysis revealed that MsGRAS60 was up-regulated in salt and alkali stress treatments (Figure 5). We subsequently examined its functional role in response to salt and alkali stresses in transgenic Arabidopsis. At least 10 transgenic lines were obtained, and two representative lines (MsGRAS60-OX-2 and MsGRAS60-OX-5) with higher expression levels were selected for the phenotypic analyses. Firstly, we measured the greening cotyledon rate of the wild type (WT) and two MsGRAS60 overexpression lines under normal and salt stress conditions. There was no significant difference in the occurrence rate of greening cotyledons between the MsGRAS60 overexpression lines and WT under normal growth conditions (Figure 7A,B). When subjected to 100 mM and 150 mM NaCl treatments, the percentage of greening cotyledons of the MsGRAS60 overexpression lines was much lower than that of the WT (Figure 7A,B).
Furthermore, we examined the performance of the MsGRAS60 overexpression lines and WT under normal and alkali stress conditions. Although two overexpression lines exhibited comparable germination rates to the WT under normal, 8 mM, and 10 mM NaHCO3 treatments, the growth of transgenic lines was significantly inhibited compared to that of the WT (Figure 7C,D). Accordingly, the average fresh weight of the overexpression lines was significantly lower than the WT under 8 mM and 10 mM NaHCO3 treatments (Figure 7D). These results indicated that MsGRAS60 overexpression lines are more sensitive to salt and alkali stresses.

2.7. MsGRAS60 Overexpression Alleviates ABA Sensitivity in Arabidopsis

To verify if the compromised tolerance to salt and alkali stresses of MsGRAS60 transgenic lines was associated with alterations in ABA sensitivity, we measured the greening cotyledon rate of WT and two MsGRAS60 overexpression lines under 0.5 and 1.0 μM ABA treatments (Figure 8A). Under normal growth condition, the MsGRAS60 overexpression lines and WT seeds exhibited comparable greening cotyledon rates (Figure 8A,B). However, when subjected to 0.5 and 1.0 μM ABA treatments, the greening cotyledon rates of the overexpression lines were significantly higher than WT (Figure 8A,B). These results suggest that MsGRAS60 overexpression confers hyposensitivity to ABA in transgenic Arabidopsis.

3. Discussion

3.1. MsGRAS Gene Duplication and Phylogenetic Relationship

Through bioinformatic analysis, we identified 123 MsGRAS genes from the genome of M. sinensis. Compared to the reported GRAS gene family in other plant species, such as Arabidopsis (34) [31], rice (60) [31], tomato (53) [33], maize (86) [34], sorghum (81) [35], poplar (106) [31], and cotton (150) [36], the number of GRAS genes in M. sinensis was the second highest. The differences in the GRAS gene family among various plant species may be either attributed to the genome size of the species or resulted from gene duplication events during the evolutionary process [37]. Segmental and tandem duplications represent two major types of evolutionary patterns in plants. Segmental duplication is primarily derived from the chromosomal rearrangement that generates numerous duplicated chromosomal blocks in plant genomes [38]. The expansion of various gene families has been revealed to be attributed to segmental duplication during evolution. Our results showed that segmental duplication was mainly responsible for the expansion of GRAS gene family in M. sinensis. At least 59 genes accounting for 48% of the total MsGRAS genes experienced segmental duplication events (Figure 1).
Similarly, most of the plant GRAS gene families identified so far have been suggested to have experienced segmental duplication events, such as Arabidopsis (48%) [31], plum (89%) [39], rice (40%) [31], sorghum (31%) [33], alfalfa (37%) [40], and poplar (73%) [31]. Compared to the occurrence of segmental duplication events in other plant species, the ratio of MsGRAS genes experiencing segmental duplication was comparable to the other plant species. It was worth noting that MsGRAS genes exclusively experienced segmental duplication while no tandem duplication was detected (Table 2). The results are in agreement with a multilayered cross-species analysis of GRAS gene family [41]. These results imply that segmental duplication plays an indispensable role in the expansion of GRAS gene family. Nevertheless, the segmental duplication alone could not fully explain the large GRAS gene family in M. sinensis.
Gene duplication events during the evolution process provide an impetus for gene loss, functional divergence, and generation of novel gene functions [42]. Our results revealed 35 paralogous gene pairs derived from the segmental duplication (Table 2). Generally, paralogous pairs originating from segmental duplication may undergo different types of evolutionary fates [43]. The Ka/Ks ratios of the duplicated paralogous gene pairs of MsGRAS were lower than 1.0, implying that they have undergone purifying selection and experienced limited functional divergence (Table 2). Correspondingly, the two gene members in most of the paralogous pairs exhibited identical or similar salt and alkali-inducible expression patterns as revealed by the transcriptome data (Figure 6). This suggests that most of them have limited functional divergence in salt and alkali stress response in Miscanthus. However, the expression of several paralogous pairs, such as MsGRAS44/MsGRAS88 and MsGRAS48/MsGRAS96, exhibited divergent differences under salt and mixed salt-alkali stress treatments (Figure 6), implying that they might have divergent functional roles in these stressed conditions. The exact roles in salt and alkali stress tolerance await further detailed functional characterization in transgenic plants.
Previous studies revealed that genomic duplication events account for the expanding of transcription factor gene families and the enhanced plant tolerance to various stressed conditions in plants [44,45]. Our study showed that several paralogous pairs such as MsGRAS9/MsGRAS22, MsGRAS45/MsGRAS49, MsGRAS50/MsGRAS101, and MsGRAS93/MsGRAS101 exhibited almost identical expression levels under unstressed conditions, while displayed significantly diversified expression patterns under salt or mixed salt and alkali stress treatments. It implies that these paralogous pairs derived from segmental duplication could have undergone substantial functional divergence to deal with the adverse environments. The divergence of the paralogous pairs may help to enhance the adaptability of Miscanthus plants to cope with various unfavorable environments.

3.2. MsGRAS Protein Structure Characteristic and Function Prediction

GRAS proteins are characterized by a highly conserved C-terminal domain and a relatively diversified N-terminal region [16]. Our study showed that 123 MsGRAS proteins contained the conserved C-terminal domains composed of five subdomains namely LHR I, VHIID, LHR II, PFYRE, and SAW (Figure 3B), which is consistent with the previous studies of GRAS gene families in other plant species [46]. It was noteworthy that the number of conserved motif numbers and their arrangement among different MsGRAS subfamilies varied substantially, indicative of potential functional diversification of the MsGRAS members. For instance, the MsGRAS proteins in the LISCL subfamily contained eight motifs (motifs 12, 14, 15, 16, 17, 18, 19, and 20) that were rarely present in the other subfamilies. It remained to be clarified whether these motifs are associated with more variable biological roles for the MsGRAS members in the LISCL subfamily.
Previous studies revealed that the conserved C-terminal subdomains play an essential role in GA signaling, thus significantly affecting plant development. For example, mutations in the PFYRE and SAW motifs lead to enhanced growth in Arabidopsis [47,48,49]. Intriguingly, our results showed that several MsGRAS proteins, such as MsGRAS56 in the HAM subfamily and MsGRAS18 and MsGRAS48 in the LISCL subfamily, lacked the SAW subdomains (motif 2) in the GRAS domain (Figure 3B). Additionally, it was noteworthy that the SAW subdomain was nested in the C and N-terminal regions of the MsGRAS77 and MsGRAS74 in the Os19 subfamily. This is not consistent with the previous studies in other species, such as sorghum, castor beans, and cassava [32,35,50]. These differences in motif composition and arrangement could give rise to distinct roles of MsGRAS genes in Miscanthus, which warrants further investigation for their exact biological roles.
Introns play a significant role during the evolutionary progress in eukaryotes, and the evolution of intron is usually accompanied by gene segmental duplication in plants [51]. Previous studies revealed that a high percentage of intronless genes are predominant in GRAS gene families, such as Arabidopsis (67%) [31], rice (55%) [31], tomato (77%) [52], potato (90%) [53], maize (80%) [34], and common bean (93%) [18]. It implies that GRAS genes have undergone substantial intron loss events during the evolutionary process. However, our study revealed that only 45 MsGRAS genes are intronless, accounting for 37% of the total number (Figure 3C). The percentage of intronless genes in the Miscanthus GRAS gene family was much lower compared to the other species in previous studies.
Moreover, it was worth noting that the intron size and number were variable between MsGRAS members even from the same subfamily. For example, MsGRAS100 had six introns with different sizes, while its close homologs MsGRAS91 and MsGRAS92 from the same subfamily contained zero and one intron, respectively. Furthermore, several paralogous pairs derived from segmental duplication, such as MsGRAS9/MsGRAS15, MsGRAS80/MsGRAS81, and MsGRAS50/MsGRAS93, exhibited significant differences in intron composition, size, and number (Figure 3C). It remained unclear whether the diversified intron compositions are associated with the functional divergence of GRAS genes in Miscanthus.
Cis-elements play a significant role in the transcriptional regulation of gene expression in response to abiotic stresses [54]. Light-responsive elements, followed by MeJA and ABA response elements, were among the most predominant cis-elements in the MsGRAS promoters (Figure 4). Moreover, the cis-elements associated with ABA, low-temperature, defense, and salt-stress responsive elements were frequently present in MsGRAS promoters. These cis-elements provided clues for the functional roles of MsGRAS genes in regulating the growth and response to various biotic/abiotic stresses.

3.3. Overexpression of MsGRAS Gene and Abiotic Stress Response

The transcriptome profiling combined with RT-qPCR analysis led to the identification of six MsGRAS genes, belonging to three subfamilies, involved in salt and/or alkali stress response. Among these salt and/or alkali stress-inducible MsGRAS genes, MsGRAS66 and MsGRAS121 belonged to the LISCL subfamily and MsGRAS47 to the SCL3 subfamily. MsGRAS27, MsGRAS60, and MsGRAS120 were classified into the PAT subfamily. The orthologs of MsGRAS60 in Arabidopsis (AtSCL8) and rice (OsGRAS10) are involved in the regulation of salt (NaCl) stress response via an ABA-dependent signaling pathway [55]. Likewise, the expression of MsGRAS60 was significantly up-regulated under alkali, as well as the mixed salt and alkali stress treatment (Figure 5A,B). We functionally characterized the role of MsGRAS60 in salt and alkali stress tolerance in transgenic Arabidopsis. The results showed that overexpression of MsGRAS60 led to hyposensitivity to ABA, and compromised salt and alkali stress tolerance (Figure 7 and Figure 8). Therefore, MsGRAS60 acts as a negative transcriptional regulator in salt and alkali stress tolerance via an ABA-dependent manner. It can be anticipated that mutation of MsGRAS60 via Virus-induced gene silencing (VIGS), or gene editing technique with clustered regularly interspaced short palindromic repeats (CRISPR)/CRISPR-associated protein 9 (Cas9) will lead to the enhanced salt and/or alkali stress tolerance in transgenic Miscanthus. Therefore, MsGRAS60 holds a potential application as an ideal candidate for the genetic improvement of abiotic stress tolerance in Miscanthus.

4. Materials and Methods

4.1. The Identification of GRAS Genes in M. sinensis

Genome sequences of M. sinensis were downloaded from Phytozome (http://www.phytozome.net/) (accessed on 2 September 2021) and GRAS protein sequences of Arabidopsis were downloaded from the Arabidopsis Information Resource (TAIR) (https://www.arabidopsis.org/index.jsp) (accessed on 3 September 2021). The hidden Markov model (HMM) profile of GRAS domain (PF03514) was downloaded from the Pfam database (http://pfam.sanger.ac.uk/) (accessed on 3 September 2021). Local BLASTP was performed using GRAS protein sequences of Arabidopsis and HMM profile as queries against the proteome sequences of M. sinensis with an e-value cut-off at 1 × 10⁻⁵, respectively. The candidate sequences were filtered by an online conserved domain (CD) search at NCBI to confirm the GRAS domain. For genes with several alternative splicing variants, only the longest sequence was retained. The closest MsGRAS orthologs to Arabidopsis were predicted by BLASTP searching against the Arabidopsis proteome sequences (V11.0) (https://www.arabidopsis.org/) (accessed on 21 September 2021).

4.2. Phylogenetic Analysis

The neighbor-joining (NJ) tree was constructed with MEGA software (Version 11, Mega Limited, Auckland, New Zealand) [56] using the full-length sequences of MsGRAS proteins. The bootstrap analysis was carried out with 1000 replicates. Only support values higher than 50% were shown on the clades. The other parameters were adopted as default.

4.3. Gene Structure and Conserved Motif Analysis

The exon and intron structure of each MsGRAS gene was displayed using the TBtools software (Version 1.098769, South China Agricultural University, Guangzhou, China) [57]. Conserved motifs of MsGRAS protein were identified using the online MEME program (Version 5.4.1) (http://meme-suite.org/tools/meme) (accessed on 18 December 2021). The maximum motif number was set as 20, and the other parameters as default. The motifs were matched to the conserved domain (LHRI, VHIID, LHRII, PFYRE, and SAW) by the global alignments within MsGRAS proteins.

4.4. Chromosomal Mapping and Segmental Duplication Analysis

MsGRAS genes were in silico mapped onto chromosomes according to the genome annotation information obtained from Phytozome (http://www.phytozome.net/) (accessed on 2 September 2021). The substitution rates of synonymous (Ks) and non-synonymous (Ka) sites for each paralogous pair were calculated by KaKs_Calculator software (Version 3.0, Chinese Academy of Sciences, Beijing, China) [58]. The duplicated MsGRAS genes on segmental fragments were illustrated using the TBtools software [57]. The approximate divergence date (T) of paralogous pairs was calculated using the formula T = Ks/2λ (λ equals 2.1 × 10⁻⁸ for Miscanthus) [14].

4.5. Promoter Cis-Element Analysis

Promoter sequences located 2000 bp upstream of the ATG of MsGRAS genes were retrieved from Phytozome (http://www.phytozome.net/) (accessed on 29 December 2021). The cis-elements in promoter sequences were analyzed using the online Plantcare tool (http://bioinformatics.psb.ugent.be/webtools/plantcare/html/) (accessed on 30 December 2021).

4.6. Plant Materials and Abiotic Stress Treatment

The M. sinensis plants were clonally propagated and transplanted into potting soil with comparable sizes. The soil was mainly composed of coconut bran, vermiculite, perlite, humus, and peat (3:1:2:2:12, w/w). After being grown for 2 months, the plants were irrigated with salt (0.3 M NaCl and 0.3 M Na2SO4), alkali (0.315 M Na2CO3 and 0.315 M NaHCO3), and mixed salt-alkali (0.15 M NaCl, 0.15 M Na2SO4, 0.15 M Na2CO3, and 0.15 M NaHCO3) solutions, respectively. For RNA-seq, the top three fully expanded leaves from the bottom were collected at 0 and 6 h of each stress treatment. The transcriptome analysis was performed at the BGI Tech Co., Ltd. (Beijing, China) (unpublished data). For RT-qPCR analysis, the top three fully expanded leaves were harvested at 8 h of each stress treatment. Leaf samples were flash-frozen in liquid nitrogen and stored at −80 °C. Each experiment was carried out with three replicates.

4.7. RNA Isolation and RT-qPCR

Total RNA was isolated from leaves using the TRIZOL reagent following the procedure of the manufacturer. The first strand of cDNA was synthesized with 1.0 μg RNA using cDNA Synthesis SuperMix (TransGen). The real-time quantitative PCR (RT-qPCR) analysis was performed on a StepOne Plus (ABI) system using SYBR Premix ExTaq (TaKaRa). PCR reactions were carried out with triplicate. The relative expression of target genes was normalized to the internal reference gene ACTIN (Unigene33024) [59] using the 2−ΔΔCT method. Primers are listed in Table S1.

4.8. Generation of MsGRAS60 Overexpression Lines in Arabidopsis

The coding region of MsGRAS60 was amplified by PCR and fused with six copies of the MYC tag at the N-terminus under the control of CaMV35S promoter in the modified PBI121-MYC vector [60]. Arabidopsis Columbia-0 (WT) plants by Agrobacterium tumefaciens mediated transformation [61]. Positive transgenic lines were screened in 1/2 MS plates containing the kanamycin (50 mg mL−1). Two homozygous transgenic Arabidopsis lines with higher expression levels of MsGRAS60 were selected for phenotypic analysis under abiotic stress treatments.

4.9. Germination Rate and Fresh Weight Measurements under Salt and Alkali Stresses

Seeds of MsGRAS60 transgenic lines and WT were sown on 1/2 MS agar plate supplemented with different concentrations of NaCl (0, 100, and 150 mM), NaHCO3 (0, 8, and 10 mM), and ABA (0, 0.5, and 1.0 μM). After stratification at 4 °C for 3 d, seeds were germinated in a growth chamber (21 °C, relative humidity 60%) under a long-day photoperiod (16-h light/8-h dark). The percentage of seedlings with greening cotyledons out of the total seedlings was recorded at 7 d. The fresh weight of seedlings under alkali stress treatment was measured at 10 d. The assays were performed with three independent replicates with at least 20 seedlings.

5. Conclusions

In this study, we carried out a comprehensive bioinformatics analysis of the GRAS gene family in M. sinensis. A total of 123 MsGRAS genes were identified, which were phylogenetically classified into ten subfamilies. Segmental duplication predominately contributed to the expansion of MsGRAS gene family. Approximately 12% of MsGRAS genes showed inducible expression patterns under salt, alkali, and mixed salt-alkali stresses. The 35 paralogous pairs derived from segmental duplication underwent purifying selection and exhibited substantial divergences in salt and alkali stress response. Additionally, the functional role of MsGRAS60 in salt and alkali stress tolerance was analyzed in transgenic Arabidopsis. It acted as a negative regulator of salt and alkali stress tolerance via an ABA-dependent signaling pathway. Our results paved the way for future functional studies to unravel the roles of GRAS genes in abiotic stress response in Miscanthus.

Supplementary Materials

The following supporting information can be downloaded at: https://www.mdpi.com/article/10.3390/ijms232314521/s1, Figure S1. Chromosomal location of MsGRAS genes; Figure S2. Conserved motifs in MsGRAS proteins; Figure S3. Correlation analysis between the RNA-Seq and RT-qPCR data; Table S1. Primer sequences used for RT-qPCR analysis.

Author Contributions

Conceptualization, R.H. and S.L.; data curation, X.Z. and R.H.; funding acquisition, Y.X., R.H. and S.L.; investigation, X.Z., Y.X., G.H., K.H. and L.X.; methodology, Y.X., G.H., K.H. and L.X.; project administration, R.H. and S.L.; resources, G.H. and L.X.; software, G.H.; writing—original draft, X.Z.; writing—review and editing, Y X., R.H. and S.L. All authors have read and agreed to the published version of the manuscript.

Funding

This work was supported by the Innovation Fund of Shandong Energy Institute (SEI I202119 and SEI I202130), the National Natural Science Foundation of China (31970322), and the Joint Funds of the National Natural Science Foundation of China (U1432126).

Institutional Review Board Statement

Not applicable.

Informed Consent Statement

Not applicable.

Data Availability Statement

All the data in this study are included in this published article.

Conflicts of Interest

The authors declare no conflict of interest.

References

  1. Haj Amor, Z.; Araya, T.; Kim, D.G.; Bouri, S.; Lee, J.; Ghilou, W.; Yang, Y.; Kang, H.; Jhariya, M.K.; Banerjee, A.; et al. Soil salinity and its associated effects on soil microorganisms, greenhouse gas emissions, crop yield, biodiversity and desertification: A review. Sci. Total Environ. 2022, 843, 156946. [Google Scholar] [CrossRef] [PubMed]
  2. FAQ. Global Map of Salt Affected Soils Version 1.0. In 2021. Available online: https://www.fao.org/soils-portal/data-hub/soil-maps-and-databases/global-map-of-salt-affected-soils/en/ (accessed on 28 September 2022).
  3. Hassani, A.; Azapagic, A.; Shokri, N. Global predictions of primary soil salinization under changing climate in the 21st century. Nat. Commun. 2021, 12, 6663. [Google Scholar] [CrossRef] [PubMed]
  4. Jesus, J.M.; Danko, A.S.; Fiuza, A.; Borges, M.T. Phytoremediation of salt-affected soils: A review of processes, applicability, and the impact of climate change. Environ. Sci. Pollut. Res. 2015, 22, 6511–6525. [Google Scholar] [CrossRef]
  5. Shah, S.H.H.; Wang, J.Y.; Hao, X.Y.; Thomas, B. Modelling soil salinity effects on salt water uptake and crop growth using a modified denitrification-decomposition model: A phytoremediation approach. J. Environ. Manag. 2022, 301, 113820. [Google Scholar] [CrossRef] [PubMed]
  6. Hanin, M.; Ebel, C.; Ngom, M.; Laplaze, L.; Masmoudi, K. New insights on plant salt tolerance mechanisms and their potential use for breeding. Front. Plant Sci. 2016, 7, 1787. [Google Scholar] [CrossRef] [Green Version]
  7. Wang, C.; Kong, Y.; Hu, R.; Zhou, G. Miscanthus: A fast-growing crop for environmental remediation and biofuel production. Glob. Chang. Biol. Bioenergy 2021, 13, 58–69. [Google Scholar] [CrossRef]
  8. Beale, C.V.; Long, S.P. Can perennial C4 grasses attain high efficiencies of radiant energy conversion in cool climates? Plant Cell Environ. 1995, 18, 641–650. [Google Scholar] [CrossRef]
  9. Wang, D.; Portis, A.R.; Moose, S.P.; Long, S.P. Cool C4 photosynthesis: Pyruvate Pi dikinase expression and activity corresponds to the exceptional cold tolerance of carbon assimilation in Miscanthus × giganteus. Plant Physiol. 2008, 148, 557–567. [Google Scholar] [CrossRef] [Green Version]
  10. Qadir, M.; Oster, J.D.; Schubert, S.; Noble, A.D.; Sahrawat, K.L. Phytoremediation of sodic and saline-sodic soils. In Advances in Agronomy; Sparks, D.L., Ed.; Elsevier Inc.: Amsterdam, The Netherlands, 2007; Volume 96, pp. 197–247. [Google Scholar]
  11. Xu, Y.; Zheng, C.; Liang, L.; Yi, Z.; Xue, S. Quantitative assessment of the potential for soil improvement by planting Miscanthus on saline-alkaline soil and the underlying microbial mechanism. Glob. Chang. Biol. Bioenergy 2021, 13, 1191–1205. [Google Scholar] [CrossRef]
  12. Bevan, M.W.; Uauy, C.; Wulff, B.B.H.; Zhou, J.; Krasileva, K.; Clark, M.D. Genomic innovation for crop improvement. Nature 2017, 543, 346–354. [Google Scholar] [CrossRef]
  13. Miao, J.; Feng, Q.; Li, Y.; Zhao, Q.; Zhou, C.; Lu, H.; Fan, D.; Yan, J.; Lu, Y.; Tian, Q.; et al. Chromosome-scale assembly and analysis of biomass crop Miscanthus lutarioriparius genome. Nat. Commun. 2021, 12, 2458. [Google Scholar] [CrossRef] [PubMed]
  14. Mitros, T.; Session, A.M.; James, B.T.; Wu, G.A.; Belaffif, M.B.; Clark, L.V.; Shu, S.; Dong, H.; Barling, A.; Holmes, J.R.; et al. Genome biology of the paleotetraploid perennial biomass crop Miscanthus. Nat. Commun. 2020, 11, 5442. [Google Scholar] [CrossRef] [PubMed]
  15. Zhang, G.; Ge, C.; Xu, P.; Wang, S.; Cheng, S.; Han, Y.; Wang, Y.; Zhuang, Y.; Hou, X.; Yu, T.; et al. The reference genome of Miscanthus floridulus illuminates the evolution of Saccharinae. Nat. Plants 2021, 7, 608–618. [Google Scholar] [CrossRef] [PubMed]
  16. Pysh, L.D.; Wysocka-Diller, J.W.; Camilleri, C.; Bouchez, D.; Benfey, P.N. The GRAS gene family in Arabidopsis: Sequence characterization and basic expression analysis of the SCARECROW-LIKE genes. Plant J. 1999, 18, 111–119. [Google Scholar] [CrossRef] [PubMed]
  17. Tian, C.G.; Wan, P.; Sun, S.H.; Li, J.Y.; Chen, M.S. Genome-wide analysis of the GRAS gene family in rice and Arabidopsis. Plant Mol. Biol. 2004, 54, 519–532. [Google Scholar] [CrossRef] [PubMed]
  18. Laskar, P.; Bhattacharya, S.; Chaudhuri, A.; Kundu, A. Exploring the GRAS gene family in common bean (Phaseolus vulgaris L.): Characterization, evolutionary relationships, and expression analyses in response to abiotic stresses. Planta 2021, 254, 84. [Google Scholar] [CrossRef] [PubMed]
  19. Sun, T.P.; Gubler, F. Molecular mechanism of gibberellin signaling in plants. Annu. Rev. Plant Biol. 2004, 55, 197–223. [Google Scholar] [CrossRef] [Green Version]
  20. Colebrook, E.H.; Thomas, S.G.; Phillips, A.L.; Hedden, P. The role of gibberellin signalling in plant responses to abiotic stress. J. Exp. Biol. 2014, 217, 67–75. [Google Scholar] [CrossRef] [Green Version]
  21. Augstein, F.; Carlsbecker, A. Salinity induces discontinuous protoxylem via a DELLA-dependent mechanism promoting salt tolerance in Arabidopsis seedlings. New Phytol. 2022, 236, 195–209. [Google Scholar] [CrossRef]
  22. D’Alessandro, S.; Mizokami, Y.; Legeret, B.; Havaux, M. The apocarotenoid beta-Cyclocitric acid elicits drought tolerance in plants. Iscience 2019, 19, 461–473. [Google Scholar] [CrossRef]
  23. Fode, B.; Siemsen, T.; Thurow, C.; Weigel, R.; Gatz, C. The Arabidopsis GRAS protein SCL14 interacts with class II TGA transcription factors and is essential for the activation of stress-inducible promoters. Plant Cell 2008, 20, 3122–3135. [Google Scholar] [CrossRef] [PubMed] [Green Version]
  24. Xu, K.; Chen, S.; Li, T.; Ma, X.; Liang, X.; Ding, X.; Liu, H.; Luo, L. OsGRAS23, a rice GRAS transcription factor gene, is involved in drought stress response through regulating expression of stress-responsive genes. BMC Plant Biol. 2015, 15, 141. [Google Scholar] [CrossRef] [PubMed] [Green Version]
  25. Liu, Y.; Huang, W.; Xian, Z.; Hu, N.; Lin, D.; Ren, H.; Chen, J.; Su, D.; Li, Z. Overexpression of SIGRAS40 in tomato enhances tolerance to abiotic stresses and influences auxin and gibberellin signaling. Front. Plant Sci. 2017, 8, 1659. [Google Scholar] [CrossRef] [PubMed]
  26. Habib, S.; Waseem, M.; Li, N.; Yang, L.; Li, Z. Overexpression of SlGRAS7 affects multiple behaviors leading to confer abiotic stresses tolerance and impacts gibberellin and auxin signaling in tomato. Int. J. Genom. 2019, 2019, 4051981. [Google Scholar] [CrossRef] [Green Version]
  27. Habib, S.; Lwin, Y.Y.; Li, N. Down-regulation of SlGRAS10 in tomato confers abiotic stress tolerance. Genes 2021, 12, 623. [Google Scholar] [CrossRef]
  28. Ma, H.-S.; Liang, D.; Shuai, P.; Xia, X.-L.; Yin, W.-L. The salt- and drought-inducible poplar GRAS protein SCL7 confers salt and drought tolerance in Arabidopsis thaliana. J. Exp. Bot. 2010, 61, 4011–4019. [Google Scholar] [CrossRef] [Green Version]
  29. Li, P.; Zhang, B.; Su, T.; Li, P.; Xin, X.; Wang, W.; Zhao, X.; Yu, Y.; Zhang, D.; Yu, S.; et al. BrLAS, a GRAS transcription factor from Brassica rapa, is involved in drought stress tolerance in transgenic Arabidopsis. Front. Plant Sci. 2018, 9, 1792. [Google Scholar] [CrossRef] [Green Version]
  30. Wang, T.; Yu, T.; Fu, J.; Su, H.; Chen, J.; Zhou, Y.; Chen, M.; Guo, J.; Ma, Y.; Wei, W.; et al. Genome-wide analysis of the GRAS gene family and functional identification of GmGRAS37 in drought and salt tolerance. Front. Plant Sci. 2020, 11, 604690. [Google Scholar] [CrossRef]
  31. Liu, X.; Widmer, A. Genome-wide comparative analysis of the GRAS gene family in Populus, Arabidopsis and Rice. Plant Mol. Biol. Report. 2014, 32, 1129–1145. [Google Scholar] [CrossRef]
  32. Xu, W.; Chen, Z.; Ahmed, N.; Han, B.; Cui, Q.; Liu, A. Genome-wide identification, evolutionary analysis, and stress responses of the GRAS gene family in Castor beans. Int. J. Mol. Sci. 2016, 17, 1004. [Google Scholar] [CrossRef]
  33. Huang, W.; Xian, Z.; Kang, X.; Tang, N.; Li, Z. Genome-wide identification, phylogeny and expression analysis of GRAS gene family in tomato. BMC Plant Biol. 2015, 15, 209. [Google Scholar] [CrossRef] [PubMed] [Green Version]
  34. Guo, Y.; We, H.; Li, X.; Li, Q.; Zhao, X.; Duan, X.; An, Y.; Lv, W.; An, H. Identification and expression of GRAS family genes in maize (Zea mays L.). PLoS ONE 2017, 12, e0185418. [Google Scholar] [CrossRef] [PubMed] [Green Version]
  35. Fan, Y.; Yan, J.; Lai, D.; Yang, H.; Xue, G.; He, A.; Guo, T.; Chen, L.; Cheng, X.-B.; Xiang, D.-B.; et al. Genome-wide identification, expression analysis, and functional study of the GRAS transcription factor family and its response to abiotic stress in sorghum Sorghum bicolor (L.) Moench. BMC Genom. 2021, 22, 509. [Google Scholar] [CrossRef]
  36. Zhang, B.; Liu, J.; Yang, Z.E.; Chen, E.Y.; Zhang, C.J.; Zhang, X.Y.; Li, F.G. Genome-wide analysis of GRAS transcription factor gene family in Gossypium hirsutum L. BMC Genom. 2018, 19, 348. [Google Scholar] [CrossRef] [PubMed]
  37. Song, X.M.; Liu, T.K.; Duan, W.K.; Ma, Q.H.; Ren, J.; Wang, Z.; Li, Y.; Hou, X.L. Genome-wide analysis of the GRAS gene family in Chinese cabbage (Brassica rapa ssp pekinensis). Genomics 2014, 103, 135–146. [Google Scholar] [CrossRef] [PubMed] [Green Version]
  38. Cannon, S.B.; Mitra, A.; Baumgarten, A.; Young, N.D.; May, G. The roles of segmental and tandem gene duplication in the evolution of large gene families in Arabidopsis thaliana. BMC Plant Biol. 2004, 4, 10. [Google Scholar] [CrossRef] [PubMed] [Green Version]
  39. Lu, J.; Wang, T.; Xu, Z.; Sun, L.; Zhang, Q. Genome-wide analysis of the GRAS gene family in Prunus mume. Mol. Genet. Genom. 2015, 290, 303–317. [Google Scholar] [CrossRef]
  40. Zhang, H.; Liu, X.; Wang, X.; Sun, M.; Song, R.; Mao, P.; Jia, S. Genome-wide identification of GRAS gene family and their responses to abiotic stress in Medicago sativa. Int. J. Mol. Sci. 2021, 22, 7729. [Google Scholar] [CrossRef]
  41. Liu, M.; Sun, W.; Li, C.; Yu, G.; Wang, X. A multilayered cross-species analysis of GRAS transcription factors uncovered their functional networks in plant adaptation to the environment. J. Adv. Res. 2020, 29, 191–205. [Google Scholar] [CrossRef]
  42. Moore, R.C.; Purugganan, M.D. The early stages of duplicate gene evolution. Proc. Natl. Acad. Sci. USA 2003, 100, 15682–15687. [Google Scholar] [CrossRef]
  43. Prince, V.E.; Pickett, F.B. Splitting pairs: The diverging fates of duplicated genes. Nat. Rev. Genet. 2002, 3, 827–837. [Google Scholar] [CrossRef] [PubMed]
  44. Lehti-Shiu, M.D.; Panchy, N.; Wang, P.; Uygun, S.; Shiu, S.-H. Diversity, expansion, and evolutionary novelty of plant DNA-binding transcription factor families. Biochim. Et Biophys. Acta-Gene Regul. Mech. 2017, 1860, 3–20. [Google Scholar] [CrossRef] [PubMed] [Green Version]
  45. Wang, N.; Yang, Y.; Moore, M.J.; Brockington, S.F.; Walker, J.F.; Brown, J.W.; Liang, B.; Feng, T.; Edwards, C.; Mikenas, J.; et al. Evolution of portulacineae marked by gene tree conflict and gene family expansion associated with adaptation to harsh environments. Mol. Biol. Evol. 2019, 36, 112–126. [Google Scholar] [CrossRef] [PubMed]
  46. Bolle, C. The role of GRAS proteins in plant signal transduction and development. Planta 2004, 218, 683–692. [Google Scholar] [CrossRef]
  47. Silverstone, A.L.; Ciampaglio, C.N.; Sun, T.P. The Arabidopsis RGA gene encodes a transcriptional regulator repressing the gibberellin signal transduction pathway. Plant Cell 1998, 10, 155–169. [Google Scholar] [CrossRef] [Green Version]
  48. Itoh, H.; Ueguchi-Tanaka, M.; Sato, Y.; Ashikari, M.; Matsuoka, M. The gibberellin signaling pathway is regulated by the appearance and disappearance of SLENDER RICE1 in nuclei. Plant Cell 2002, 14, 57–70. [Google Scholar] [CrossRef] [Green Version]
  49. Wang, W.; Zhang, J.; Qin, Q.; Yue, J.; Huang, B.; Xu, X.; Yan, L.; Hou, S. The six conserved serine/threonine sites of REPRESSOR OF ga1-3 protein are important for its functionality and stability in gibberellin signaling in Arabidopsis. Planta 2014, 240, 763–779. [Google Scholar] [CrossRef]
  50. Shan, Z.; Luo, X.; Wu, M.; Wei, L.; Fan, Z.; Zhu, Y. Genome-wide identification and expression of GRAS gene family members in Cassava. BMC Plant Biol. 2020, 20, 46. [Google Scholar] [CrossRef] [Green Version]
  51. Patthy, L. Intron-dependent evolution-preferred types of exons and introns. Febs Lett. 1987, 214, 1–7. [Google Scholar] [CrossRef] [Green Version]
  52. Niu, Y.; Zhao, T.; Xu, X.; Li, J. Genome-wide identification and characterization of GRAS transcription factors in tomato (Solanum lycopersicum). PeerJ 2017, 5, e3955. [Google Scholar] [CrossRef]
  53. Wang, S.; Zhang, N.; Zhu, X.; Yang, J.; Li, S.; Che, Y.; Liu, W.; Si, H. Identification and expression analysis of StGRAS gene family in potato (Solanum tuberosum L.). Comput. Biol. Chem. 2019, 80, 195–205. [Google Scholar] [CrossRef]
  54. Yamaguchi-Shinozaki, K.; Shinozaki, K. Transcriptional regulatory networks in cellular responses and tolerance to dehydration and cold stresses. Annu. Rev. Plant Biol. 2006, 57, 781–803. [Google Scholar] [CrossRef] [PubMed] [Green Version]
  55. Dutta, M.; Saha, A.; Moin, M.; Kirti, P.B. Genome-wide identification, transcript profiling and bioinformatic analyses of GRAS transcription factor genes in Rice. Front. Plant Sci. 2021, 12, 2649. [Google Scholar] [CrossRef] [PubMed]
  56. Tamura, K.; Stecher, G.; Kumar, S. MEGA11: Molecular evolutionary genetics analysis Version 11. Mol. Biol. Evol. 2021, 38, 3022–3027. [Google Scholar] [CrossRef] [PubMed]
  57. Chen, C.; Chen, H.; Zhang, Y.; Thomas, H.R.; Frank, M.H.; He, Y.; Xia, R. TBtools: An Integrative toolkit developed for interactive analyses of big biological data. Mol. Plant 2020, 13, 1194–1202. [Google Scholar] [CrossRef]
  58. Zhang, Z. KaKs_calculator 3.0: Calculating selective pressure on coding and non-coding sequences. Genom. Proteom. Bioinform. 2022; in press. [Google Scholar]
  59. Nie, G.; Yang, Z.; He, J.; Liu, A.; Chen, J.; Wang, S.; Wang, X.; Feng, G.; Li, D.; Peng, Y.; et al. Genome-wide investigation of the NAC transcription factor family in Miscanthus sinensis and expression analysis under various abiotic stress. Front. Plant Sci. 2021, 12, 766550. [Google Scholar] [CrossRef]
  60. Xu, Y.; Wang, Y.; Du, J.; Pei, S.; Guo, S.; Hao, R.; Wang, D.; Zhou, G.; Li, S.; O’Neill, M.; et al. A DE1 BINDING FACTOR 1-GLABRA2 module regulates rhamnogalacturonan I biosynthesis in Arabidopsis seed coat mucilage. Plant Cell 2022, 34, 1396–1414. [Google Scholar] [CrossRef]
  61. Clough, S.J.; Bent, A.F. Floral dip: A simplified method for Agrobacterium-mediated transformation of Arabidopsis thaliana. Plant J. 1998, 16, 735–743. [Google Scholar] [CrossRef]
Figure 1. Segmental duplication relationships of MsGRAS genes. Grey lines indicate all synteny blocks in the M.sinensis genome. Lines in the same colors indicate duplicated GRAS gene pairs. The chromosomes are marked with Chr01 to Chr19 in blue for each chromosome.
Ijms 23 14521 g001
Figure 2. Phylogenetic relationships of GRAS proteins in M. sinensis, Arabidopsis, and rice. The un-rooted phylogenetic tree was generated by neighbor-joining (NJ) method with 1000 bootstrap replicates. Proteins were clustered into 12 clades and illustrated by specific colors belonging to the same subfamily. Bootstrap values larger than 50% were shown. GRAS members from M. sinensis, Arabidopsis, and rice are indicated with green, red, and blue colors, respectively.
Ijms 23 14521 g002
Figure 3. Phylogenetic relationship, motif distribution, and gene structure of MsGRAS. (A) Phylogenetic tree constructed based on the alignments of 123 MsGRAS full-length amino acid sequences. Bootstrap values higher than 50% are shown. (B) Conserved motifs in MsGRAS proteins. Each motif is shaded with colored boxes. (C) Gene structure of MsGRAS. Un-translated region (UTR), exons, and introns are indicated by green rectangles and yellow and black lines, respectively.
Ijms 23 14521 g003
Figure 4. Predicted cis-elements in the promoter sequences of MsGRAS genes. (A) Phylogenetic tree of MsGRAS. (B) Distributions of cis-elements in MsGRAS promoters. The rectangles with different colors indicate various cis-elements. The number at the bottom indicates the 2000 bp upstream nucleotides to the transcription start codon. (C) Heat map showing the occurrence of cis-elements in MsGRAS gene promoters. The scale bar indicates the occurrence of cis-elements with red indicating a larger number and blue denoting a smaller number.
Ijms 23 14521 g004
Figure 5. Expression profiling of MsGRAS genes and verification by RT-qPCR. (A) Expression profiling of MsGRAS genes under salt, alkali, and mixed salt-alkali stresses. The transcriptome sequencing was performed using Miscanthus leaves subjected to salt (0.3M NaCl + 0.3M Na2SO4), alkali (0.315M Na2CO3 + 0.315M NaHCO3), and salt-alkali (0.15M NaCl, 0.15M Na2SO4, 0.15M Na2CO3, and 0.15M NaHCO3) treatments for 6 h. The genes in red were selected for RT-qPCR verification. (B) Comparison of RT-qPCR and RNA-seq analyses of six MsGRAS gene expression in salt, alkali, and mixed salt-alkali treatments. The bars represent the standard error (SE) of three biological repeats.
Ijms 23 14521 g005
Figure 6. Differential expression of MsGRAS paralogous pairs under salt, alkali and mixed salt-alkali stresses. The same letters (a/a) mean no significant differences between paralogous genes. The different letters (a/b) represent significant differences between paralogous genes (p < 0.05). Error bars indicate the standard error (SE) of three biological replicates.
Ijms 23 14521 g006
Figure 7. Salt and alkali stress tolerance assay of MsGRAS60 overexpression lines. (A) Germination assay of WT and MsGRAS60 overexpression lines under mock, 100 mM, and 150 mM NaCl treatments. (B) Quantification of greening cotyledon frequency in salt stress treatment. The greening cotyledon rate was calculated as the percentage of seedlings with green cotyledon out of the whole seedlings in three biological replicates. (C) Germination assay of MsGRAS60 transgenic lines and WT seedlings under mock, 8 mM, and 10 mM NaCHO3 treatments (D) Quantification of fresh weight of seedlings under alkali stress treatment. At least 20 seedlings for each background were measured with three biological replicates. Values represent mean ± SE. Asterisks indicate significant differences between transgenic plants and WT based on Student’s t-test (* p < 0.05; ** p < 0.01).
Ijms 23 14521 g007
Figure 8. ABA sensitivity assay of MsGRAS60 overexpression lines. (A) Germination assay of WT and two MsGRAS60 overexpression lines. Seeds were sown on the 1/2 MS plate supplemented with 0, 0.5, and 1.0 μM ABA. (B) Statistics of greening cotyledon rates of WT and MsGRAS60 overexpression lines on 1/2 MS plate supplemented with 0, 0.5, and 1.0 μM ABA. Values represent mean ± SE of three biological replicates. Asterisks indicate significant differences between transgenic plants and WT based on Student’s t-test (* p < 0.05; ** p < 0.01).
Ijms 23 14521 g008
Table 1. List of MsGRAS genes and their closest orthologs to Arabidopsis.
No.Gene SymbolGene LociArabidopsis Ortholog LociArabidopsis Ortholog SymbolScoreE-Value
1MsGRAS1Misin01G020500.1AT2G37650.14211 × 10−136
2MsGRAS2Misin01G025400.1AT1G07530.1GRAS2/SCL144997 × 10−162
3MsGRAS3Misin01G152800.1AT2G37650.14272 × 10−139
4MsGRAS4Misin01G152900.1AT2G37650.14292 × 10−140
5MsGRAS5Misin01G153100.1AT2G37650.13073 × 10−95
6MsGRAS6Misin01G153200.1AT2G29065.13905 × 10−127
7MsGRAS7Misin01G161800.1AT2G37650.13973 × 10−130
8MsGRAS8Misin01G246900.1AT5G48150.1PAT15660
9MsGRAS9Misin01G287600.1AT4G00150.1HAM3/LOM32717 × 10−83
10MsGRAS10Misin01G310300.1AT4G37650.1SHR/SGR73405 × 10−110
11MsGRAS11Misin01G323700.1AT3G13840.12344 × 10−70
12MsGRAS12Misin01G403600.1AT2G37650.15450
13MsGRAS13Misin01G408100.1AT4G08250.12972 × 10−94
14MsGRAS14Misin01G449800.1AT5G48150.1PAT15230
15MsGRAS15Misin01G513100.1AT4G00150.1HAM3/LOM32444 × 10−74
16MsGRAS16Misin02G001900.1AT1G07530.1GRAS2/SCL144093 × 10−131
17MsGRAS17Misin02G014100.1AT1G07530.1GRAS2/SCL144967 × 10−167
18MsGRAS18Misin02G151300.1AT2G29060.13246 × 10−102
19MsGRAS19Misin02G151700.1AT2G37650.14242 × 10−138
20MsGRAS20Misin02G158600.1AT2G37650.14577 × 10−153
21MsGRAS21Misin02G234500.1AT5G48150.1PAT15760
22MsGRAS22Misin02G277200.1AT4G00150.1HAM3/LOM32581 × 10−77
23MsGRAS23Misin02G312300.1AT3G13840.12393 × 10−72
24MsGRAS24Misin02G400500.1AT4G08250.12951 × 10−93
25MsGRAS25Misin02G410600.1AT2G37650.15420
26MsGRAS26Misin03G277400.1AT1G07530.1GRAS2/SCL144231 × 10−137
27MsGRAS27Misin03G288500.1AT5G48150.1PAT15190
28MsGRAS28Misin03G304000.1AT3G49950.14222 × 10−145
29MsGRAS29Misin03G306000.1AT4G37650.1SHR/SGR7/4102 × 10−137
30MsGRAS30Misin03G309100.1AT1G50600.1SCL55250
31MsGRAS31Misin03G322400.1AT5G41920.1 AtSCL23/SCL234283 × 10−148
32MsGRAS32Misin04G284300.1AT1G07530.1GRAS2/SCL144214 × 10−137
33MsGRAS33Misin04G284400.1AT2G37650.1 4424 × 10−148
34MsGRAS34Misin04G299900.1AT2G37650.14423 × 10−145
35MsGRAS35Misin04G300000.1AT2G37650.13571 × 10−113
36MsGRAS36Misin04G313500.1AT5G48150.1PAT15174 × 10−180
37MsGRAS37Misin04G325100.1AT5G41920.1SCL23 4322 × 10−149
38MsGRAS38Misin04G335700.1AT5G48150.1PAT1 5240
39MsGRAS39Misin04G338800.1AT4G37650.1SHR/SGR73931 × 10−133
40MsGRAS40Misin04G340300.1AT3G49950.14272 × 10−147
41MsGRAS41Misin04G350600.1AT3G13840.12532 × 10−77
42MsGRAS42Misin04G351200.1AT3G13840.12629 × 10−81
43MsGRAS43Misin05G054400.1AT2G37650.12982 × 10−94
44MsGRAS44Misin05G234500.1AT1G14920.1RGA2/GAI3071 × 10−98
45MsGRAS45Misin05G342400.1AT2G37650.15252 × 10−176
46MsGRAS46Misin05G352700.1AT1G21450.1SCL1 5560
47MsGRAS47Misin05G394400.1AT1G50420.1SCL33783 × 10−127
48MsGRAS48Misin05G411500.1AT2G37650.12018 × 10−59
49MsGRAS49Misin06G319300.1AT2G37650.15272 × 10−177
50MsGRAS50Misin06G347800.1AT1G21450.1SCL15500
51MsGRAS51Misin07G079700.1AT1G55580.1SCL18/LAS2452 × 10−76
52MsGRAS52Misin07G432500.1AT4G00150.1HAM3/LOM32617 × 10−81
53MsGRAS53Misin08G098200.1AT1G55580.1 SCL18/LAS 2285 × 10−70
54MsGRAS54Misin09G001300.1AT3G54220.1 SGR1/SCR5530
55MsGRAS55Misin09G017500.1AT1G50420.1SCL32641 × 10−82
56MsGRAS56Misin09G032300.1AT5G41920.1SCL231304 × 10−32
57MsGRAS57Misin09G129300.1AT1G66350.1RGL13122 × 10−97
58MsGRAS58Misin09G205000.1AT2G37650.13335 × 10−105
59MsGRAS59Misin09G205200.1AT2G29060.12682 × 10−81
60MsGRAS60Misin10G000200.1AT5G52510.1SCL82497 × 10−74
61MsGRAS61Misin10G015400.1AT1G50420.1SCL32541 × 10−78
62MsGRAS62Misin10G037000.1AT4G08250.11154 × 10−28
63MsGRAS63Misin10G037100.1AT5G41920.1SCL231526 × 10−41
64MsGRAS64Misin10G088000.1AT1G66350.1RGL1/RGL3071 × 10−95
65MsGRAS65Misin10G180800.1AT2G37650.1 3177 × 10−99
66MsGRAS66Misin10G200900.1AT2G37650.14366 × 10−144
67MsGRAS67Misin10G201300.1AT2G29060.14301 × 10−142
68MsGRAS68Misin10G201500.1AT2G37650.11302.68 × 10−31
69MsGRAS69Misin10G201800.1AT1G07530.1GRAS2/SCL144343.88 × 10−142
70MsGRAS70Misin10G202000.1AT1G07530.1GRAS2/SCL143993.77 × 10−130
71MsGRAS71Misin10G202100.1AT1G07530.1GRAS2/SCL143031.14 × 10−93
72MsGRAS72Misin10G202300.1AT2G37650.12424.29 × 10−74
73MsGRAS73Misin11G037100.1AT1G55580.1SCL18/LAS2252.42 × 10−68
74MsGRAS74Misin11G080600.1AT5G41920.1SCL231209.17 × 10−30
75MsGRAS75Misin11G092500.1AT2G29065.13336.82 × 10−106
76MsGRAS76Misin11G188000.1AT5G52510.1SCL82613 × 10−78
77MsGRAS77Misin12G082800.1AT3G03450.1RGL21293.96 × 10−32
78MsGRAS78Misin12G093700.1AT2G37650.13281.11 × 10−103
79MsGRAS79Misin12G093800.1AT2G37650.13356.9 × 10−105
80MsGRAS80Misin12G179500.1AT4G00150.1HAM3/LOM32865.04 × 10−88
81MsGRAS81Misin12G181200.1AT4G00150.1HAM3/LOM32863.27 × 10−87
82MsGRAS82Misin14G012600.1AT1G50420.1SCL33051 × 10−97
83MsGRAS83Misin14G013500.1AT1G50420.1SCL32701.33 × 10−85
84MsGRAS84Misin14G050000.1AT3G54220.1SCR/SGR15246.24 × 10−179
85MsGRAS85Misin14G112500.1AT2G37650.14591.56 × 10−152
86MsGRAS86Misin14G164000.1AT2G01570.1RGA/RGA1/RGA242469.53 × 10−75
87MsGRAS87Misin15G009500.1AT3G54220.1SCR/SGR15530
88MsGRAS88Misin15G025900.1AT1G50420.1SCL32666.14 × 10−84
89MsGRAS89Misin15G070400.1AT4G08250.11166.37 × 10−28
90MsGRAS90Misin15G148100.1AT2G37650.14614.96 × 10−153
91MsGRAS91Misin16G120300.1AT1G50420.1SCL31646.3 × 10−45
92MsGRAS92Misin16G120400.1AT1G50420.1SCL32239.28 × 10−68
93MsGRAS93Misin16G145600.1AT1G21450.1SCL15230
94MsGRAS94Misin16G178000.1AT3G54220.1SCR/SGR12697.51 × 10−83
95MsGRAS95Misin16G190800.1AT3G49950.12938.04 × 10−96
96MsGRAS96Misin17G020200.1AT2G37650.13501.88 × 10−115
97MsGRAS97Misin17G020300.1AT2G37650.14793.77 × 10−161
98MsGRAS98Misin17G020400.1AT2G37650.14292.77 × 10−142
99MsGRAS99Misin17G049900.1AT2G37650.14091.46 × 10−132
100MsGRAS100Misin17G120700.1AT1G50420.1SCL31304.04 × 10−33
101MsGRAS101Misin17G146900.1AT1G21450.1SCL15410
102MsGRAS102Misin17G169300.1AT3G54220.1SCR/SGR12749.87 × 10−85
103MsGRAS103Misin17G191000.1AT3G49950.12972.89 × 10−97
104MsGRAS104Misin18G011200.1AT1G63100.1SCL283741.49 × 10−121
105MsGRAS105Misin18G187000.1AT1G55580.1SCL18/LAS2252.17 × 10−68
106MsGRAS106Misin19G008400.1AT4G00150.1HAM3/LOM32422.74 × 10−73
107MsGRAS107Misin19G015600.1AT1G63100.1SCL283751.19 × 10−121
108MsGRAS108MisinT086900.1AT4G00150.1HAM3/LOM32331.74 × 10−69
109MsGRAS109MisinT072400.1AT1G07530.1GRAS2/SCL144303.89 × 10−140
110MsGRAS110MisinT072600.1AT2G37650.13232.94 × 10−101
111MsGRAS111MisinT074500.1AT2G37650.13932.46 × 10−127
112MsGRAS112MisinT131300.1AT2G37650.13759.91 × 10−121
113MsGRAS113MisinT131400.1AT2G29065.13055.61 × 10−95
114MsGRAS114MisinT131700.1AT1G07530.1GRAS2/SCL143107.58 × 10−96
115MsGRAS115MisinT131900.1AT2G29060.13472.12 × 10−111
116MsGRAS116MisinT132000.1AT2G37650.13281.36 × 10−101
117MsGRAS117MisinT132100.1AT1G07530.1GRAS2/SCL144001.09 × 10−130
118MsGRAS118MisinT132200.1AT2G37650.12943.81 × 10−90
119MsGRAS119MisinT132300.1AT1G07530.1GRAS2/SCL143422.5 × 10−108
120MsGRAS120MisinT322700.1AT5G52510.1SCL82584.98 × 10−77
121MsGRAS121MisinT390500.1AT1G07530.1GRAS2/SCL144534.6 × 10−148
122MsGRAS122MisinT390800.1AT2G37650.14468.22 × 10−148
123MsGRAS123MisinT390900.1AT1G07530.1GRAS2/SCL144372.07 × 10−143
Table 2. Ka/Ks ratio of paralogous pairs of MsGRAS genes.
No.Locus 1Locus 2Protein Identity (%)KaKsKa/KsDuplication TypePurify SelectionDivergence Time (Mya)
1MsGRAS1MsGRAS1693.390.0350.0890.392SegmentalYes2.12
2MsGRAS2MsGRAS1797.390.0130.0470.280SegmentalYes1.12
3MsGRAS3MsGRAS1871.100.1690.2880.588SegmentalYes6.85
4MsGRAS9MsGRAS1559.680.2722.8550.095SegmentalYes67.97
5MsGRAS9MsGRAS2295.020.0190.0830.234SegmentalYes1.97
6MsGRAS10MsGRAS3985.310.0751.6610.045SegmentalYes39.54
7MsGRAS11MsGRAS2395.600.0120.1610.074SegmentalYes3.84
8MsGRAS11MsGRAS4261.640.2312.5910.089SegmentalYes61.68
9MsGRAS12MsGRAS2598.090.0100.0280.341SegmentalYes0.67
10MsGRAS13MsGRAS2497.160.0100.0710.136SegmentalYes1.68
11MsGRAS15MsGRAS2265.690.2753.1080.089SegmentalYes73.99
12MsGRAS23MsGRAS4162.290.2313.0890.075SegmentalYes73.56
13MsGRAS27MsGRAS3697.720.0110.0610.176SegmentalYes1.45
14MsGRAS28MsGRAS4097.820.0060.2300.026SegmentalYes5.47
15MsGRAS29MsGRAS3998.440.0050.1100.049SegmentalYes2.61
16MsGRAS30MsGRAS3895.730.0220.1090.200SegmentalYes2.59
17MsGRAS31MsGRAS3796.720.0110.1470.076SegmentalYes3.49
18MsGRAS45MsGRAS4998.250.0100.0280.360SegmentalYes0.67
19MsGRAS46MsGRAS5097.190.0130.0410.310SegmentalYes0.97
20MsGRAS46MsGRAS9373.040.1581.3270.119SegmentalYes31.60
21MsGRAS50MsGRAS9373.040.1561.3500.116SegmentalYes32.14
22MsGRAS50MsGRAS10172.310.1581.3830.114SegmentalYes32.92
23MsGRAS51MsGRAS5393.480.0230.2340.098SegmentalYes5.57
24MsGRAS51MsGRAS10563.730.2004.3610.046SegmentalYes103.83
25MsGRAS52MsGRAS8067.610.2201.1720.187SegmentalYes27.91
26MsGRAS52MsGRAS8177.600.2251.1520.195SegmentalYes27.42
27MsGRAS57MsGRAS6495.310.0160.1640.095SegmentalYes3.92
28MsGRAS74MsGRAS7791.530.0380.1430.264SegmentalYes3.40
29MsGRAS75MsGRAS7884.440.0730.2210.332SegmentalYes5.26
30MsGRAS80MsGRAS8197.610.0110.0600.185SegmentalYes1.44
31MsGRAS91MsGRAS10088.210.0530.1400.379SegmentalYes3.32
32MsGRAS93MsGRAS10196.800.0150.0580.266SegmentalYes1.38
33MsGRAS94MsGRAS10297.590.0090.0480.195SegmentalYes1.15
34MsGRAS95MsGRAS10393.870.0180.1810.098SegmentalYes4.30
35MsGRAS104MsGRAS10797.270.0100.0490.199SegmentalYes1.16
Publisher’s Note: MDPI stays neutral with regard to jurisdictional claims in published maps and institutional affiliations.

