
Correlation of Immunological and Histopathological Features with Gene Expression-Based Classifiers in Colon Cancer Patients
 , , ,
, , ,
Abstract
:1. Introduction
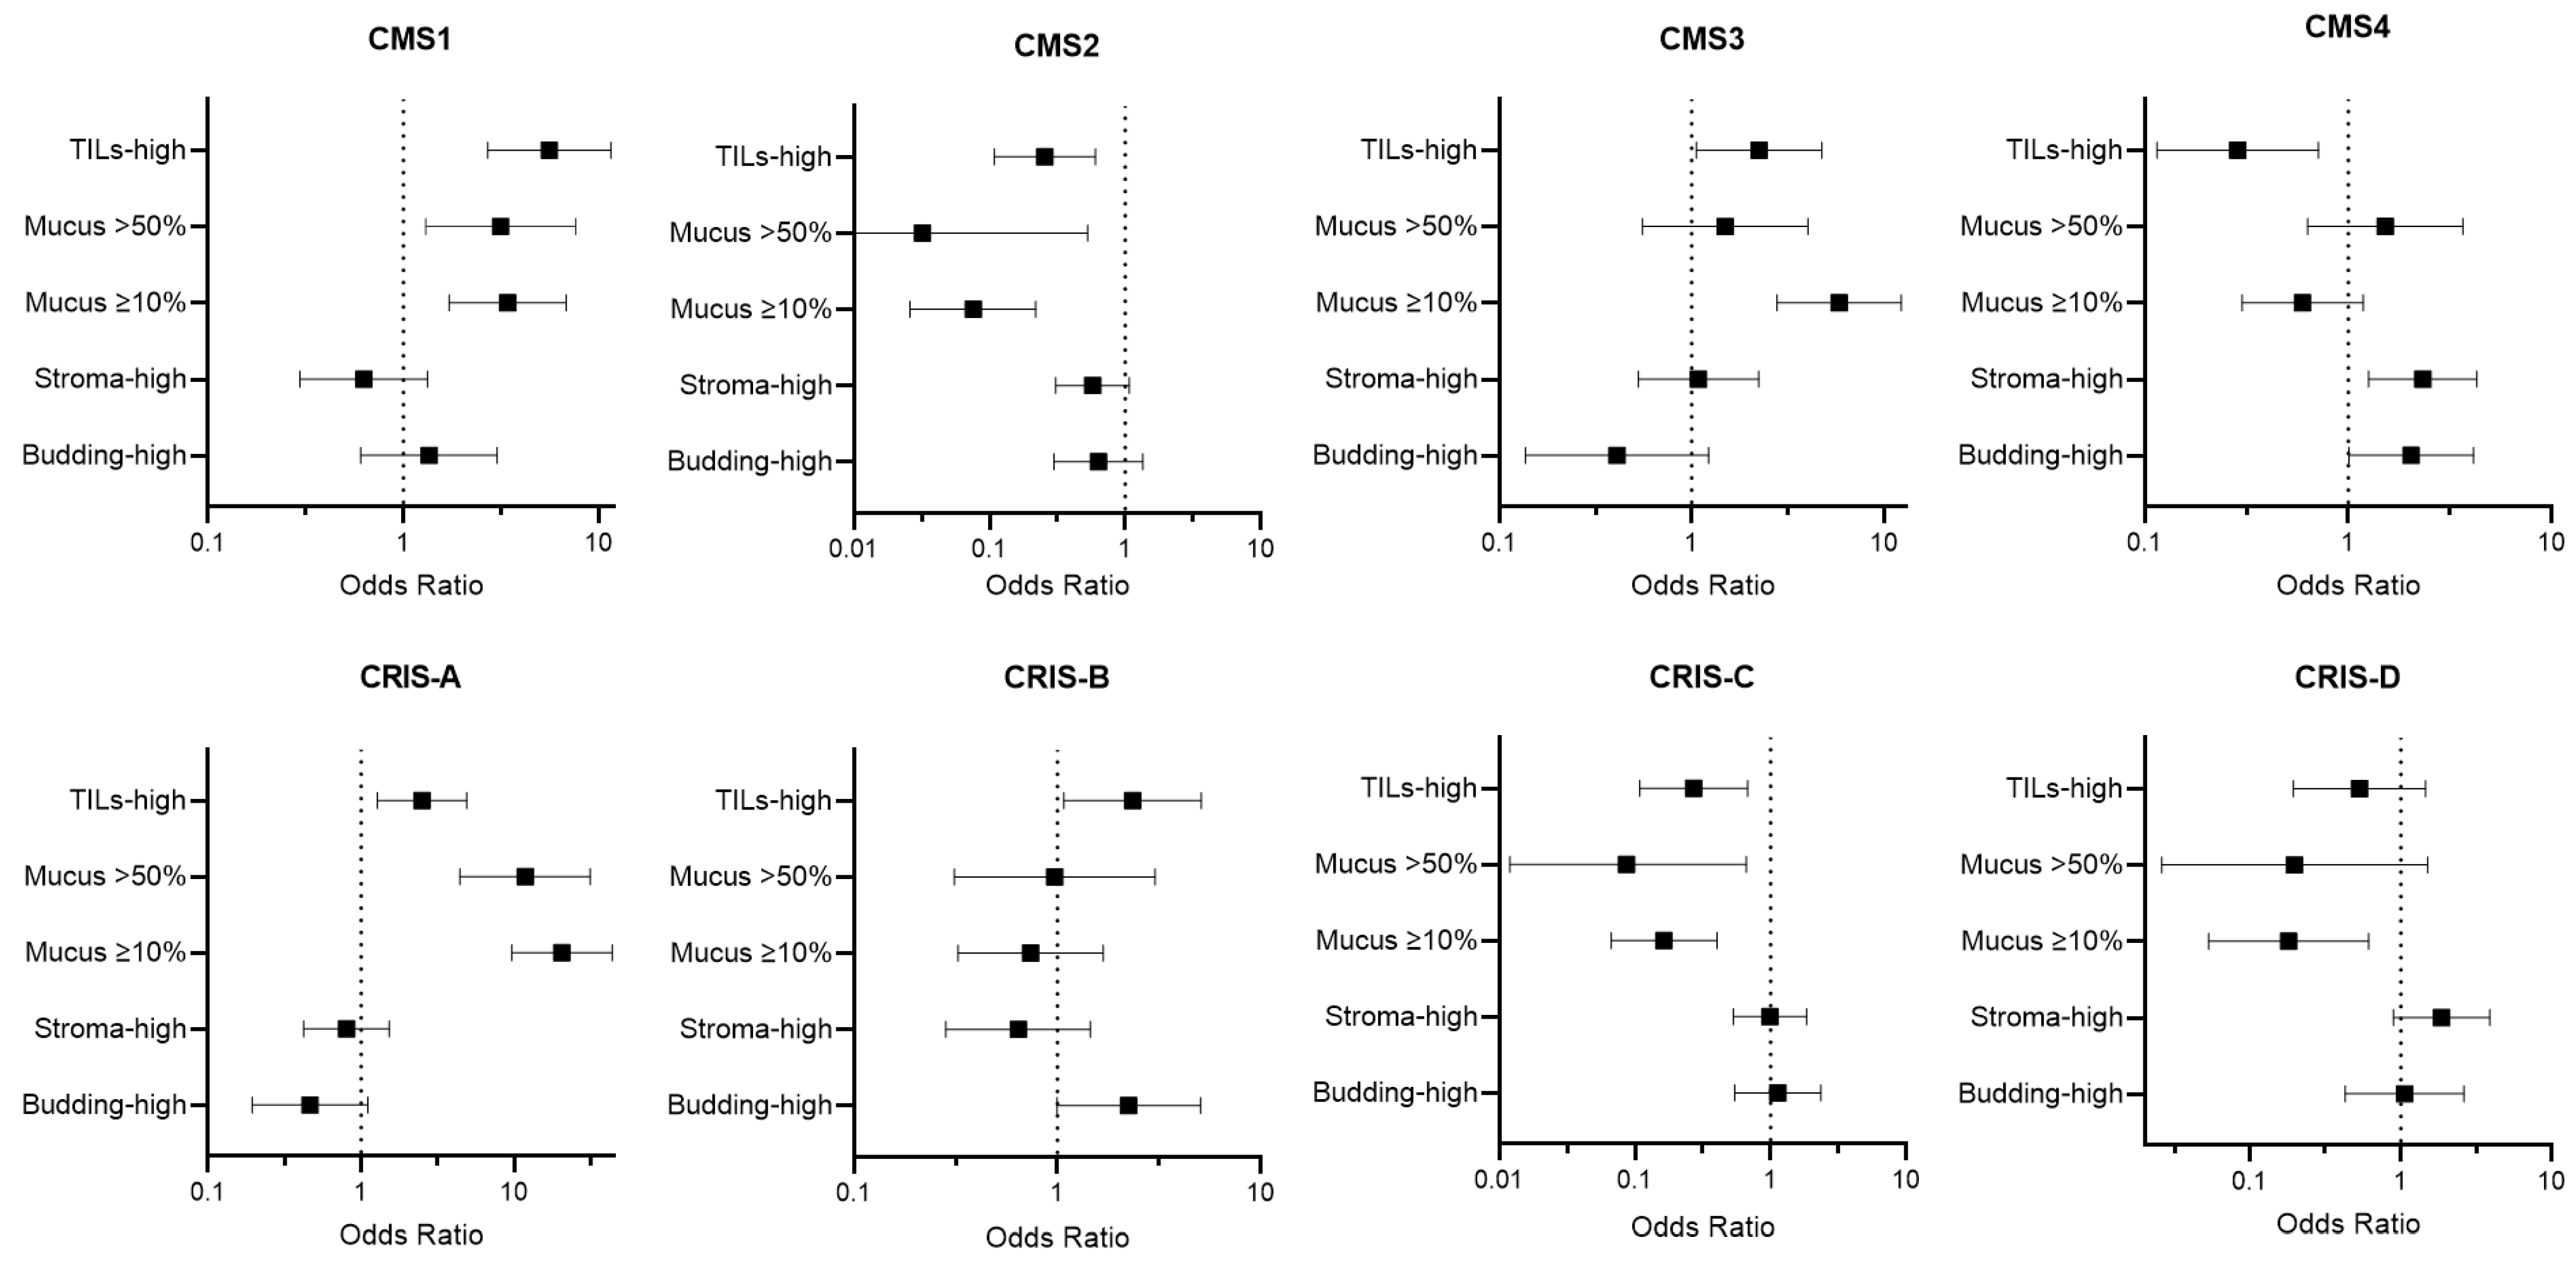
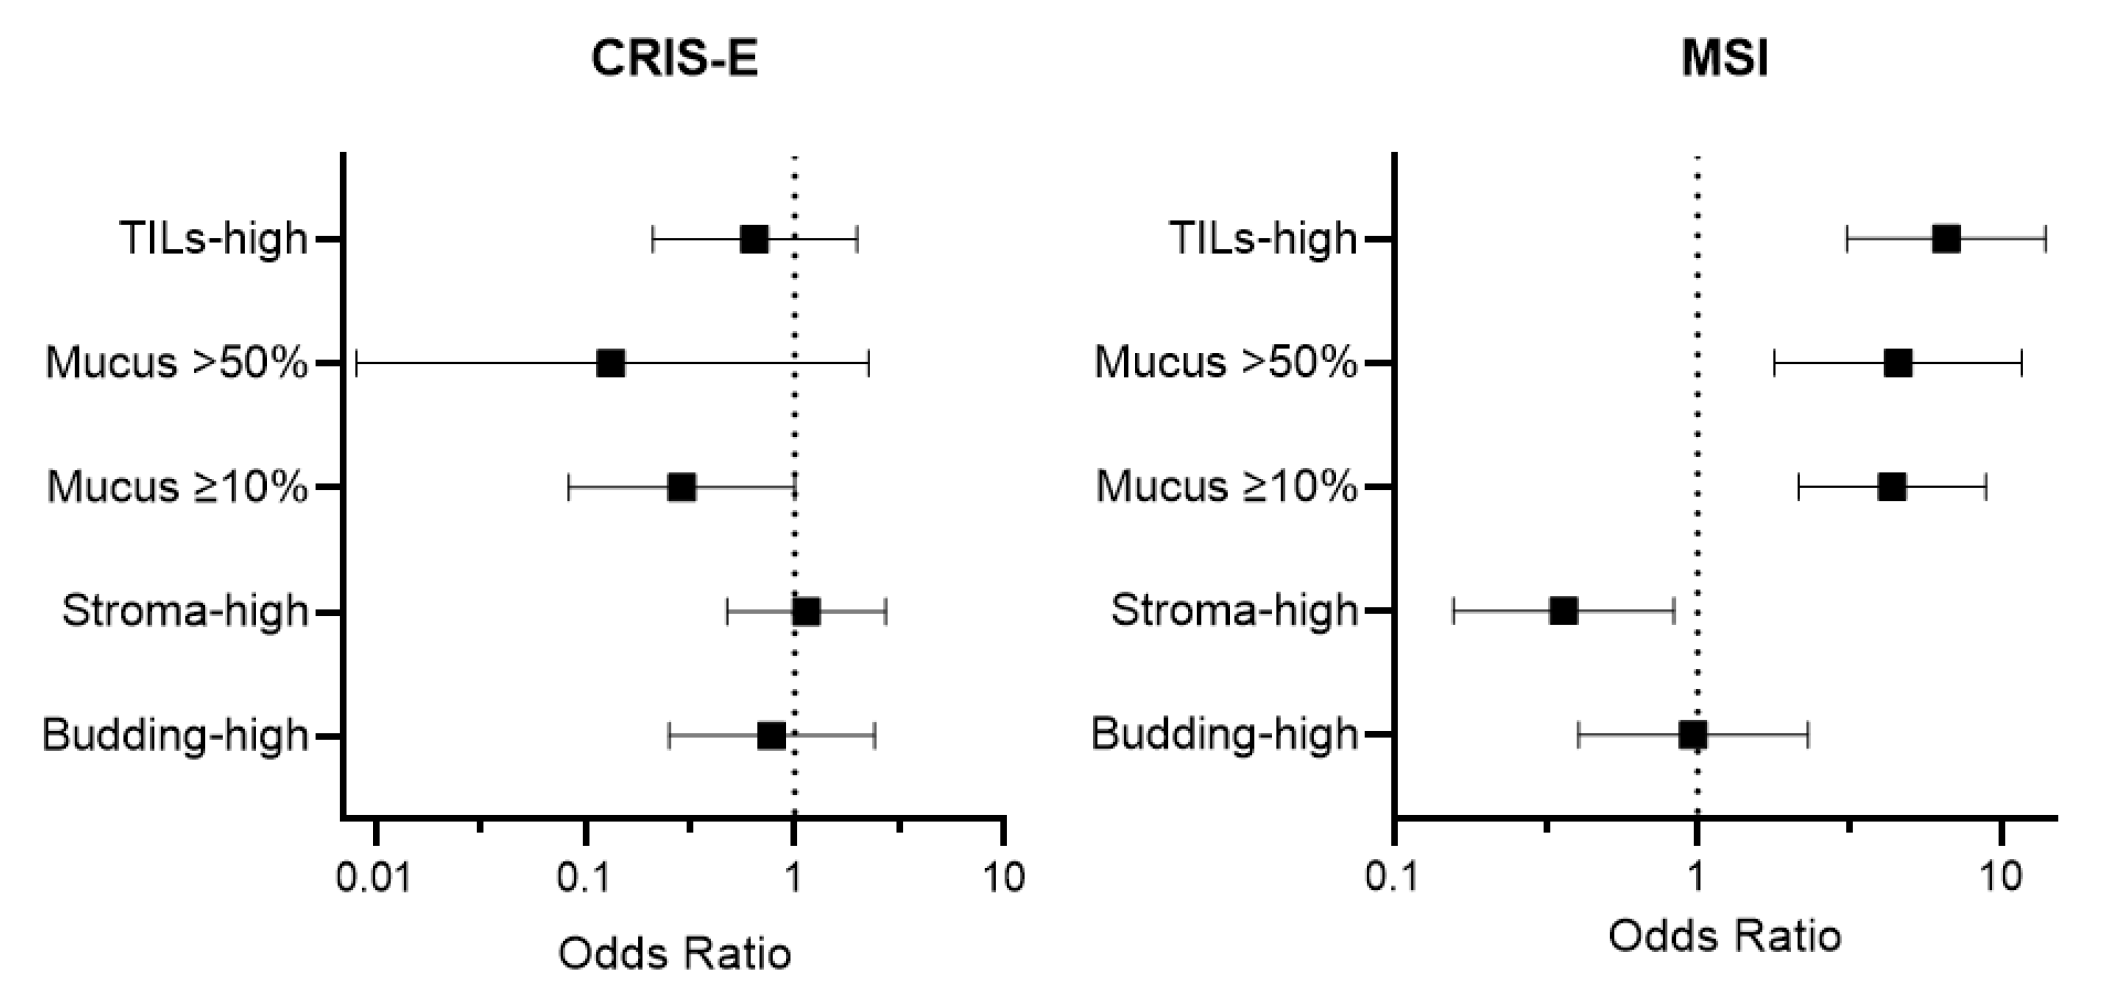
2. Results
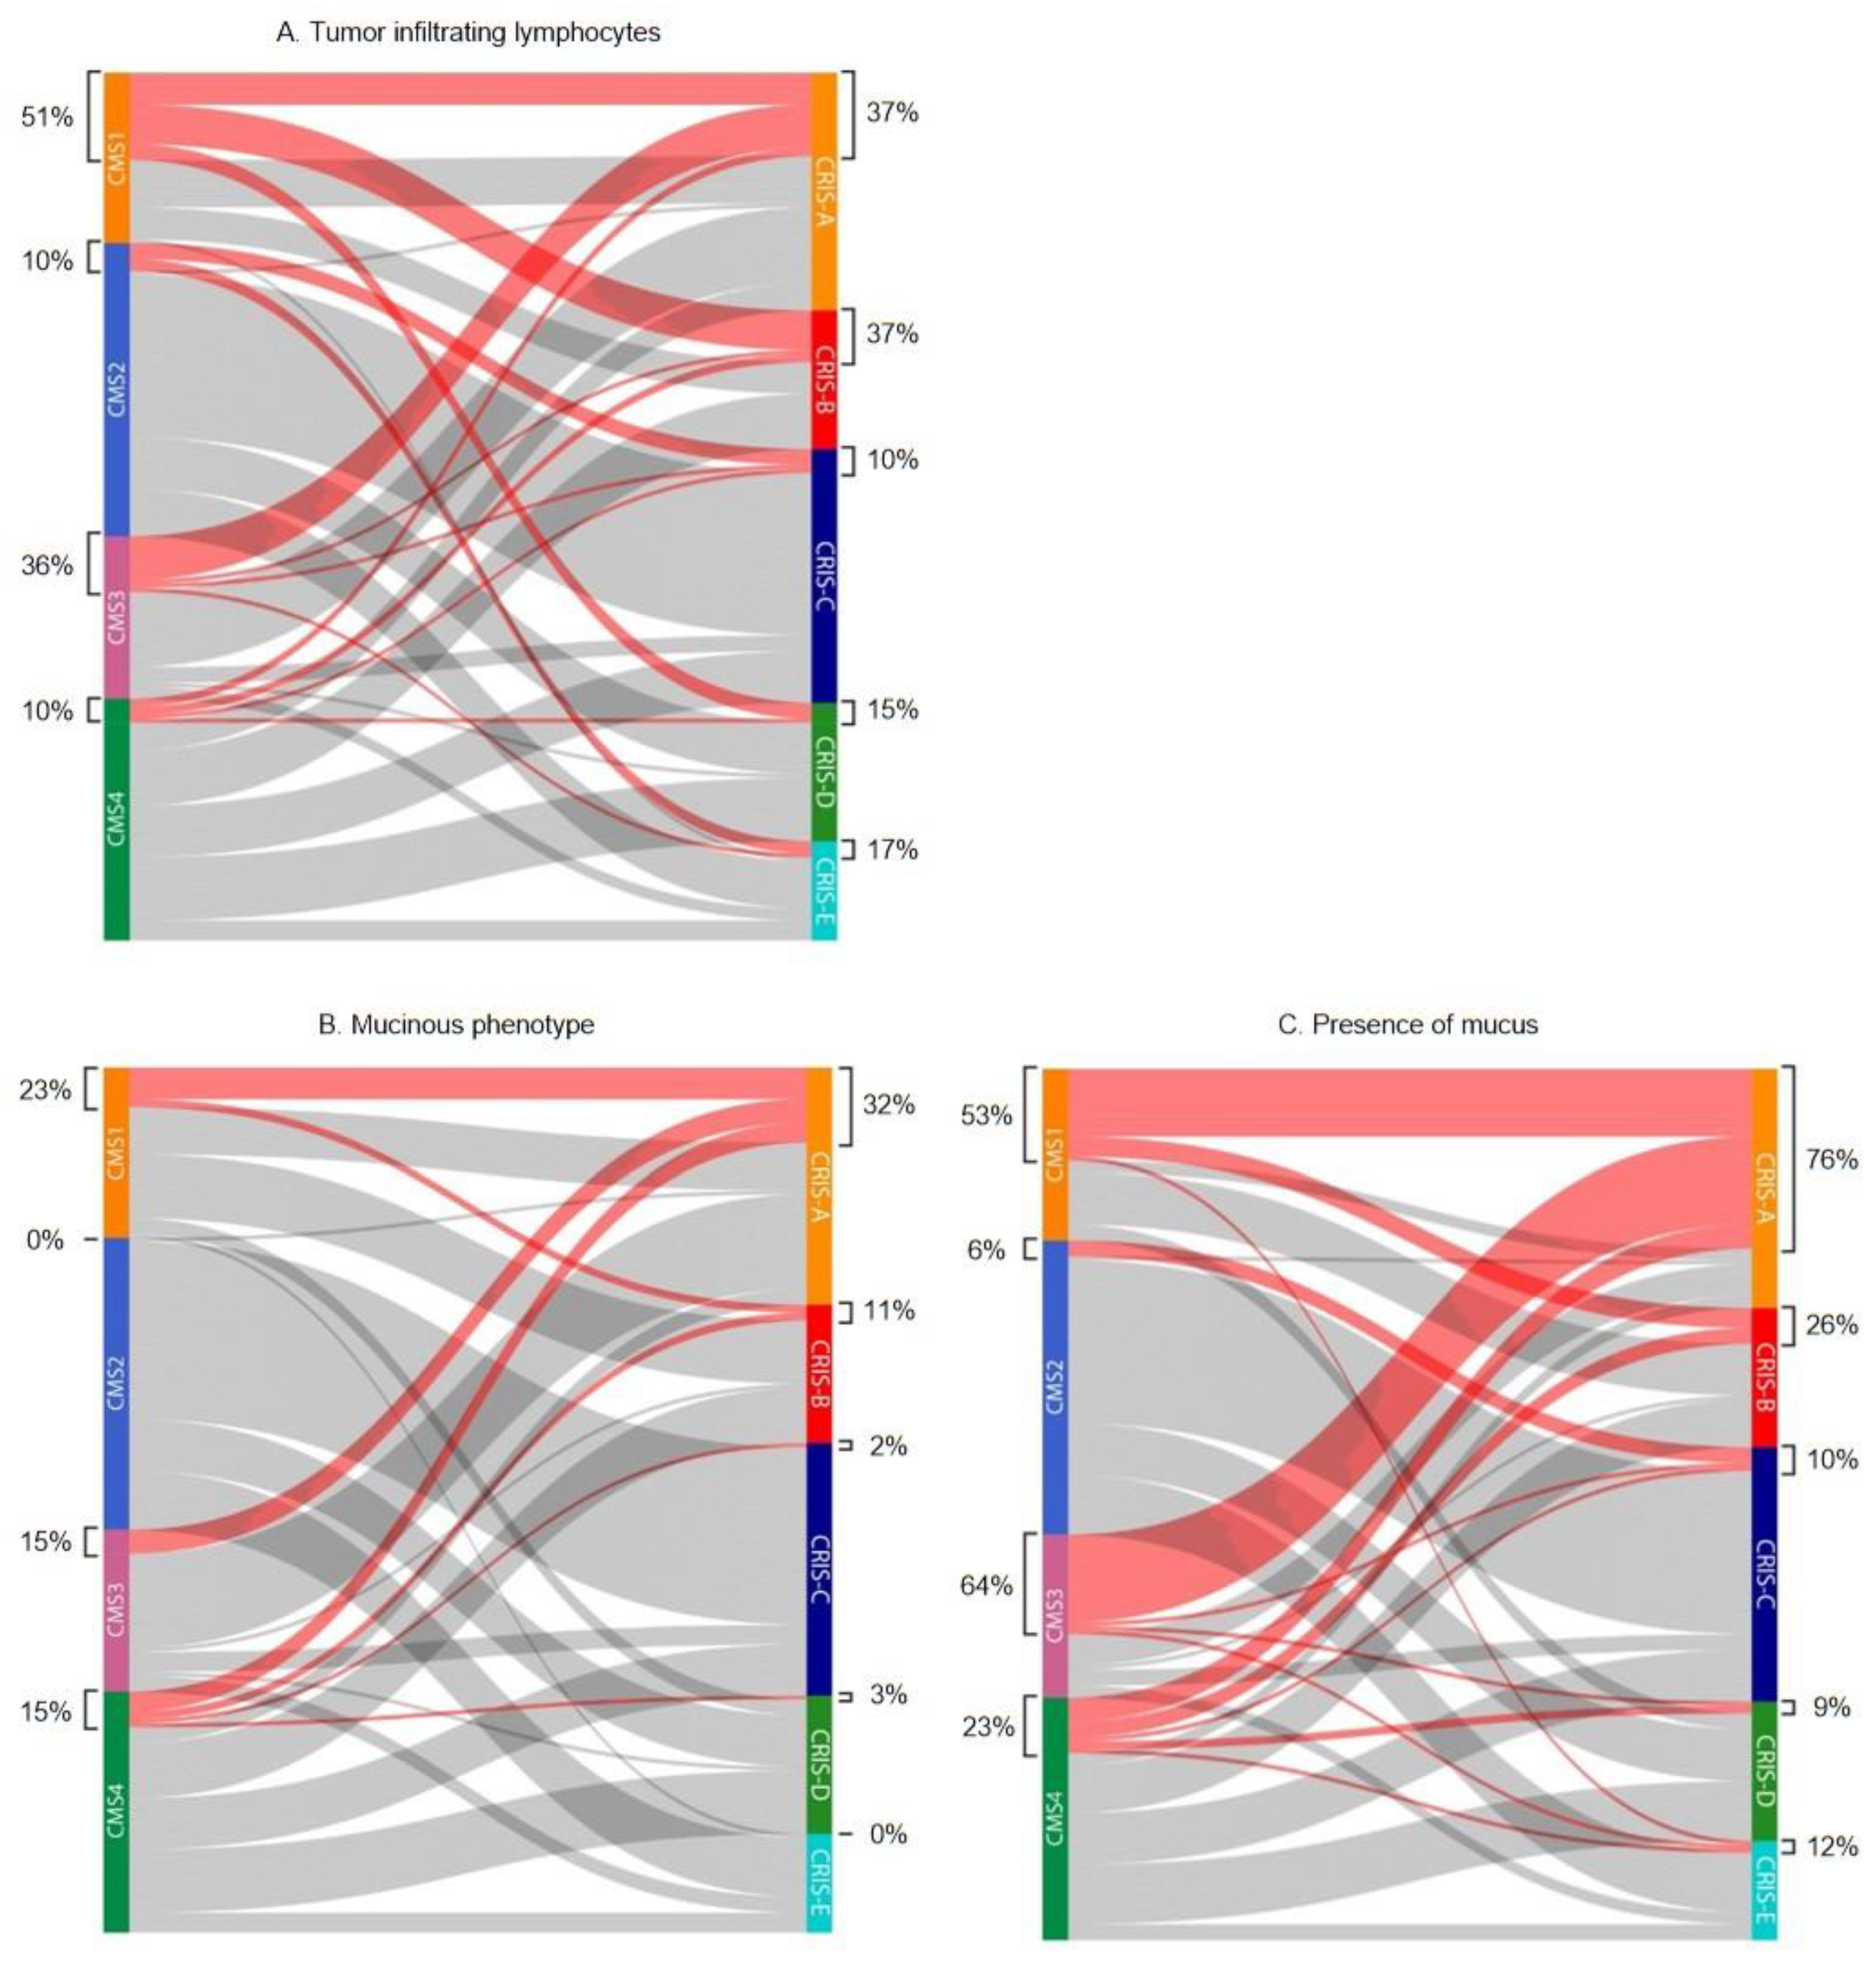
2.1. Tumor Infiltrating Lymphocytes
2.2. Mucinous Differentiation
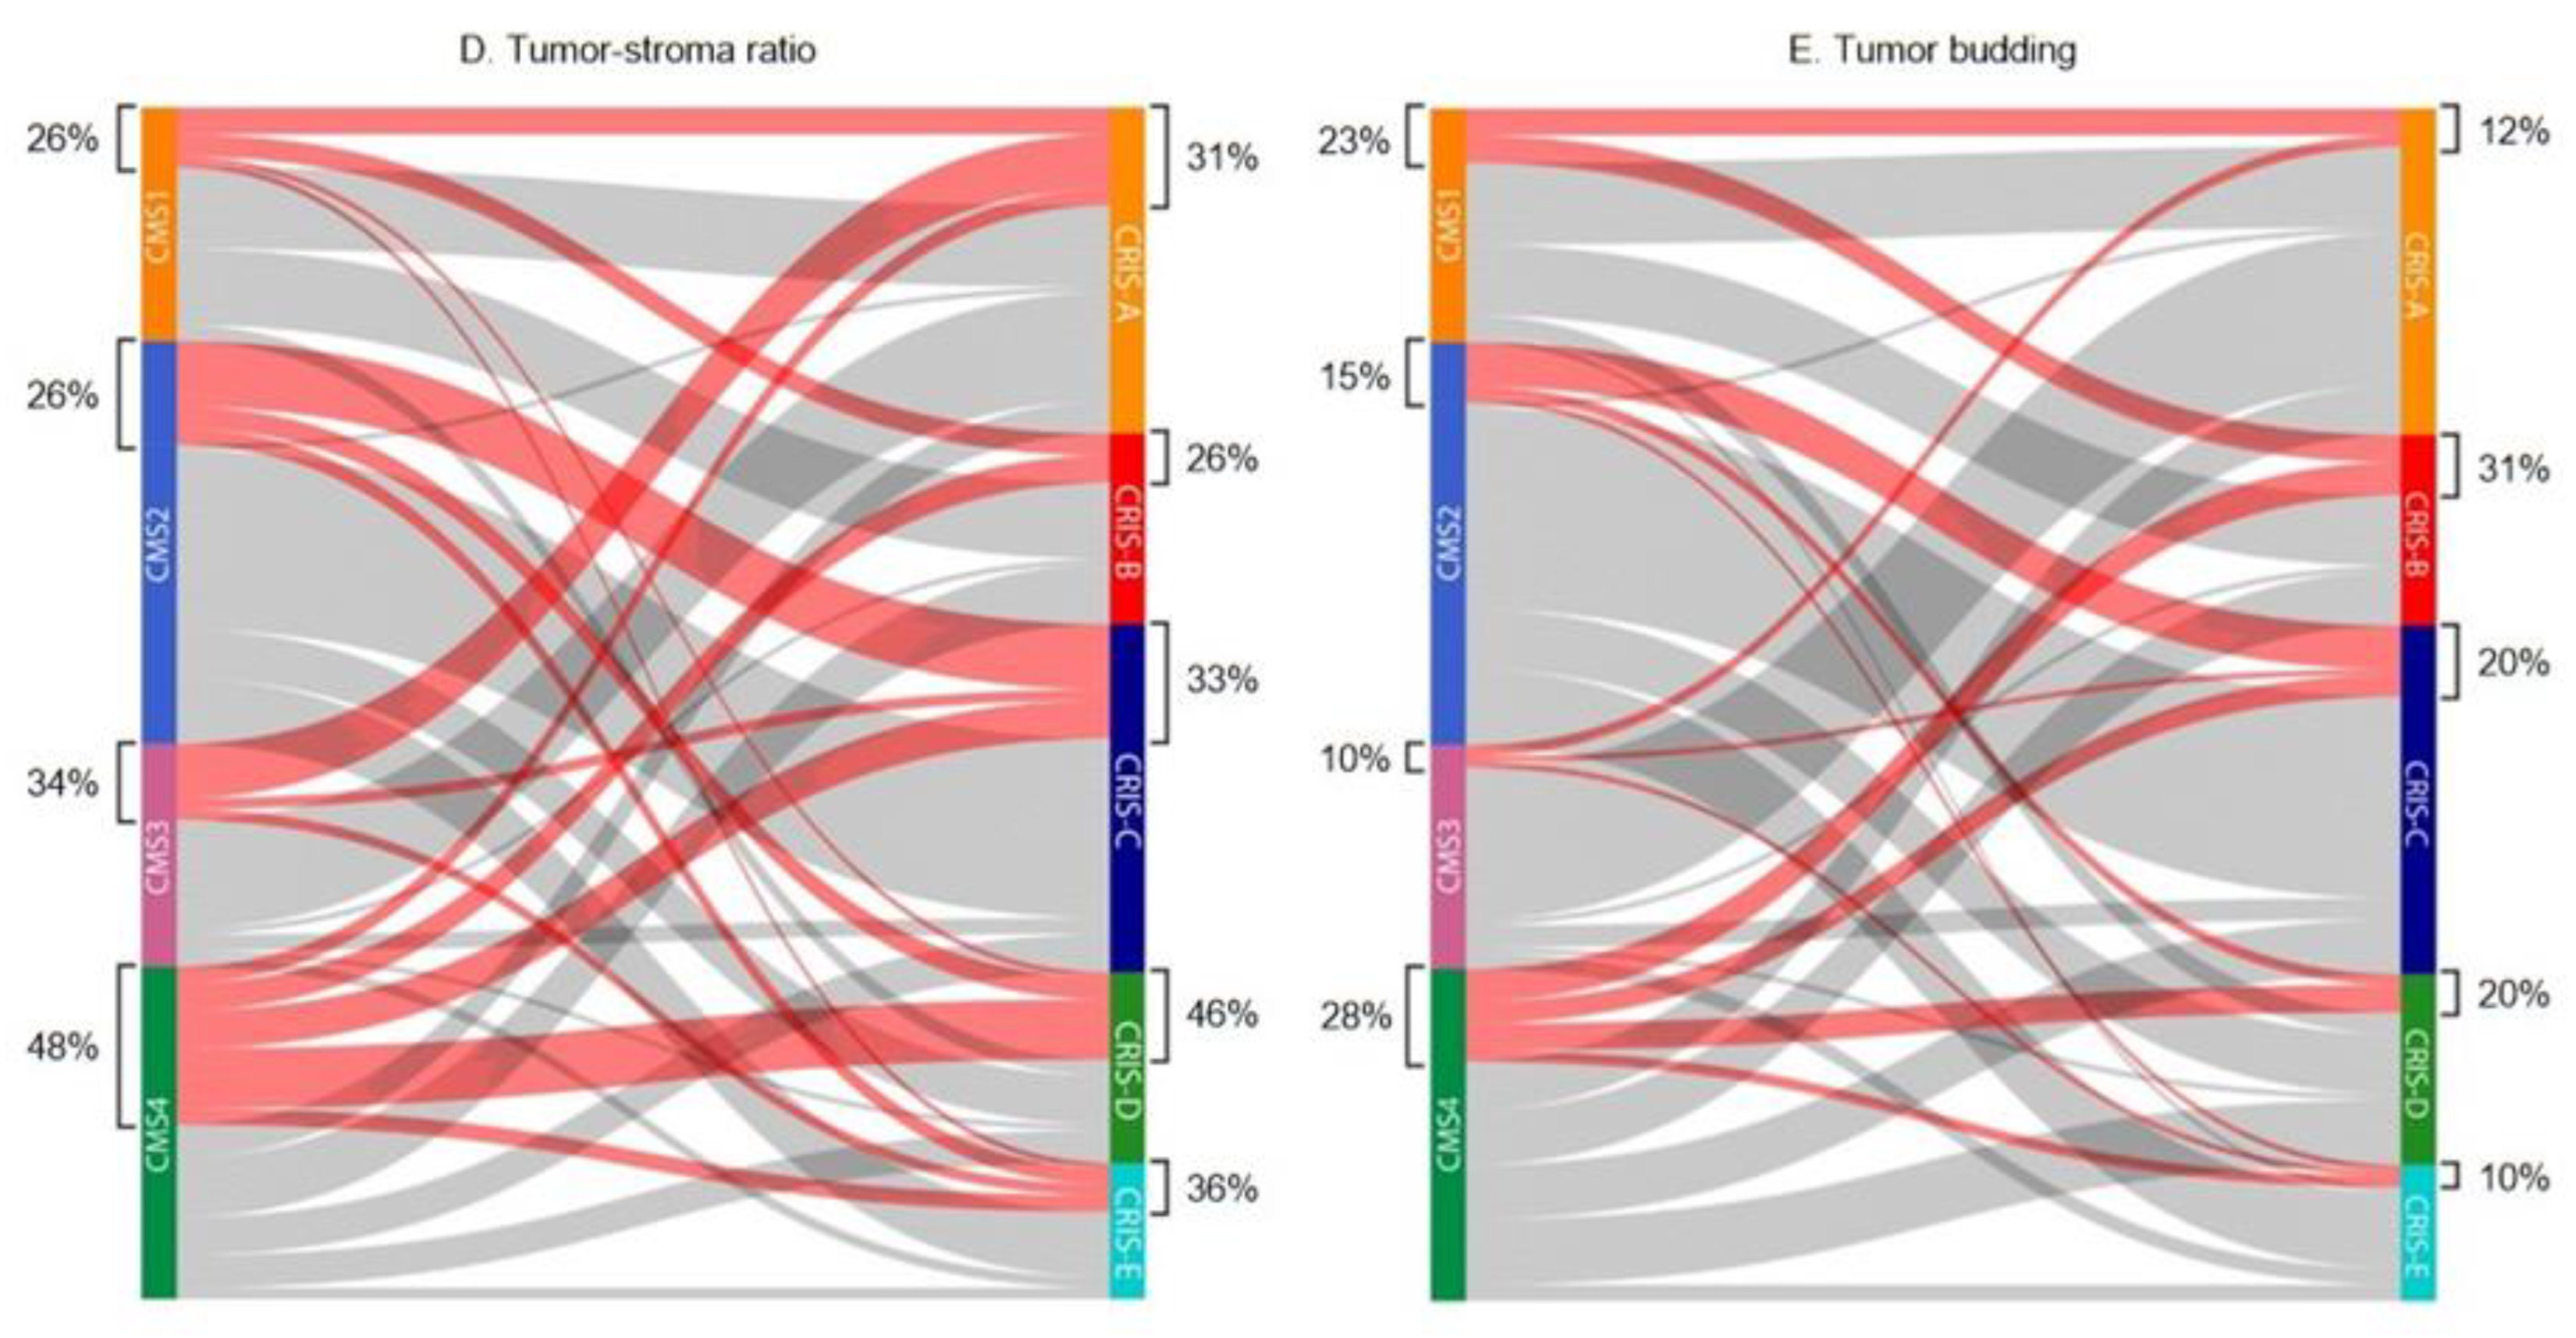
2.3. Tumor-Stroma Ratio
2.4. Tumor Budding
2.5. Combination of Histopathologic Features
2.6. Microsatellite Instability
3. Discussion
4. Materials and Methods
4.1. Patient Cohorts
4.2. CMS and CRIS Classification
4.3. MSI Status
4.4. Ethical Considerations
4.5. Histopathological Features
4.5.1. Tumor Infiltrating Lymphocytes
4.5.2. Mucinous Differentiation
4.5.3. Tumor-Stroma Ratio
4.5.4. Tumor Budding
4.6. Statistical Analysis
Supplementary Materials
Author Contributions
Funding
Institutional Review Board Statement
Informed Consent Statement
Data Availability Statement
Conflicts of Interest
References
- Amin, M.B.; Greene, F.L.; Edge, S.B.; Compton, C.C.; Gershenwald, J.E.; Brookland, R.K.; Meyer, L.; Gress, D.M.; Byrd, D.R.; Winchester, D.P. The Eighth Edition AJCC Cancer Staging Manual: Continuing to build a bridge from a population-based to a more “personalized” approach to cancer staging. CA Cancer J. Clin. 2017, 67, 93–99. [Google Scholar] [CrossRef] [PubMed]
- Boland, C.R.; Goel, A. Microsatellite instability in colorectal cancer. Gastroenterology 2010, 138, 2073–2087.e3. [Google Scholar] [CrossRef] [PubMed]
- Sinicrope, F.A.; Foster, N.R.; Thibodeau, S.N.; Marsoni, S.; Monges, G.; Labianca, R.; Kim, G.P.; Yothers, G.; Allegra, C.; Moore, M.J.; et al. DNA mismatch repair status and colon cancer recurrence and survival in clinical trials of 5-fluorouracil-based adjuvant therapy. J. Natl. Cancer Inst. 2011, 103, 863–875. [Google Scholar] [CrossRef] [Green Version]
- Sargent, D.J.; Marsoni, S.; Monges, G.; Thibodeau, S.N.; Labianca, R.; Hamilton, S.R.; French, A.J.; Kabat, B.; Foster, N.R.; Torri, V.; et al. Defective mismatch repair as a predictive marker for lack of efficacy of fluorouracil-based adjuvant therapy in colon cancer. J. Clin. Oncol. Off. J. Am. Soc. Clin. Oncol. 2010, 28, 3219–3226. [Google Scholar] [CrossRef] [PubMed] [Green Version]
- Aasebø, K.; Dragomir, A.; Sundström, M.; Mezheyeuski, A.; Edqvist, P.H.; Eide, G.E.; Ponten, F.; Pfeiffer, P.; Glimelius, B.; Sorbye, H. Consequences of a high incidence of microsatellite instability and BRAF-mutated tumors: A population-based cohort of metastatic colorectal cancer patients. Cancer Med. 2019, 8, 3623–3635. [Google Scholar] [CrossRef] [Green Version]
- Kim, C.G.; Ahn, J.B.; Jung, M.; Beom, S.H.; Kim, C.; Kim, J.H.; Heo, S.J.; Park, H.S.; Kim, J.H.; Kim, N.K.; et al. Effects of microsatellite instability on recurrence patterns and outcomes in colorectal cancers. Br. J. Cancer 2016, 115, 25–33. [Google Scholar] [CrossRef] [Green Version]
- Venderbosch, S.; Nagtegaal, I.D.; Maughan, T.S.; Smith, C.G.; Cheadle, J.P.; Fisher, D.; Kaplan, R.; Quirke, P.; Seymour, M.T.; Richman, S.D.; et al. Mismatch repair status and BRAF mutation status in metastatic colorectal cancer patients: A pooled analysis of the CAIRO, CAIRO2, COIN, and FOCUS studies. Clin. Cancer Res. Off. J. Am. Assoc. Cancer Res. 2014, 20, 5322–5330. [Google Scholar] [CrossRef] [Green Version]
- Umar, A.; Boland, C.R.; Terdiman, J.P.; Syngal, S.; de la Chapelle, A.; Rüschoff, J.; Fishel, R.; Lindor, N.M.; Burgart, L.J.; Hamelin, R.; et al. Revised Bethesda Guidelines for hereditary nonpolyposis colorectal cancer (Lynch syndrome) and microsatellite instability. J. Natl. Cancer Inst. 2004, 96, 261–268. [Google Scholar] [CrossRef]
- Suraweera, N.; Duval, A.; Reperant, M.; Vaury, C.; Furlan, D.; Leroy, K.; Seruca, R.; Iacopetta, B.; Hamelin, R. Evaluation of tumor microsatellite instability using five quasimonomorphic mononucleotide repeats and pentaplex PCR. Gastroenterology 2002, 123, 1804–1811. [Google Scholar] [CrossRef]
- Lindor, N.M.; Burgart, L.J.; Leontovich, O.; Goldberg, R.M.; Cunningham, J.M.; Sargent, D.J.; Walsh-Vockley, C.; Petersen, G.M.; Walsh, M.D.; Leggett, B.A.; et al. Immunohistochemistry versus microsatellite instability testing in phenotyping colorectal tumors. J. Clin. Oncol. Off. J. Am. Soc. Clin. Oncol. 2002, 20, 1043–1048. [Google Scholar] [CrossRef]
- Zhang, X.; Li, J. Era of universal testing of microsatellite instability in colorectal cancer. World J. Gastrointest. Oncol. 2013, 5, 12–19. [Google Scholar] [CrossRef] [PubMed]
- Hissong, E.; Crowe, E.P.; Yantiss, R.K.; Chen, Y.T. Assessing colorectal cancer mismatch repair status in the modern era: A survey of current practices and re-evaluation of the role of microsatellite instability testing. Mod. Pathol. 2018, 31, 1756–1766. [Google Scholar] [CrossRef] [PubMed] [Green Version]
- Asif, P.J.; Longobardi, C.; Hahne, M.; Medema, J.P. The Role of Cancer-Associated Fibroblasts in Cancer Invasion and Metastasis. Cancers 2021, 13, 4720. [Google Scholar] [CrossRef]
- Quante, M.; Varga, J.; Wang, T.C.; Greten, F.R. The gastrointestinal tumor microenvironment. Gastroenterology 2013, 145, 63–78. [Google Scholar] [CrossRef] [PubMed] [Green Version]
- Marliot, F.; Pagès, F.; Galon, J. Usefulness and robustness of Immunoscore for personalized management of cancer patients. Oncoimmunology 2020, 9, 1832324. [Google Scholar] [CrossRef] [PubMed]
- Idos, G.E.; Kwok, J.; Bonthala, N.; Kysh, L.; Gruber, S.B.; Qu, C. The Prognostic Implications of Tumor Infiltrating Lymphocytes in Colorectal Cancer: A Systematic Review and Meta-Analysis. Sci. Rep. 2020, 10, 3360. [Google Scholar] [CrossRef] [Green Version]
- Pagès, F.; Mlecnik, B.; Marliot, F.; Bindea, G.; Ou, F.S.; Bifulco, C.; Lugli, A.; Zlobec, I.; Rau, T.T.; Berger, M.D.; et al. International validation of the consensus Immunoscore for the classification of colon cancer: A prognostic and accuracy study. Lancet 2018, 391, 2128–2139. [Google Scholar] [CrossRef]
- Galon, J.; Mlecnik, B.; Bindea, G.; Angell, H.K.; Berger, A.; Lagorce, C.; Lugli, A.; Zlobec, I.; Hartmann, A.; Bifulco, C.; et al. Towards the introduction of the ‘Immunoscore’ in the classification of malignant tumours. J. Pathol. 2014, 232, 199–209. [Google Scholar] [CrossRef] [Green Version]
- Pagès, F.; Kirilovsky, A.; Mlecnik, B.; Asslaber, M.; Tosolini, M.; Bindea, G.; Lagorce, C.; Wind, P.; Marliot, F.; Bruneval, P.; et al. In situ cytotoxic and memory T cells predict outcome in patients with early-stage colorectal cancer. J. Clin. Oncol. Off. J. Am. Soc. Clin. Oncol. 2009, 27, 5944–5951. [Google Scholar] [CrossRef]
- van Pelt, G.W.; Sandberg, T.P.; Morreau, H.; Gelderblom, H.; van Krieken, J.; Tollenaar, R.; Mesker, W.E. The tumour-stroma ratio in colon cancer: The biological role and its prognostic impact. Histopathology 2018, 73, 197–206. [Google Scholar] [CrossRef]
- van Pelt, G.W.; Kjaer-Frifeldt, S.; van Krieken, J.; Al Dieri, R.; Morreau, H.; Tollenaar, R.; Sorensen, F.B.; Mesker, W.E. Scoring the tumor-stroma ratio in colon cancer: Procedure and recommendations. Virchows Arch. 2018, 473, 405–412. [Google Scholar] [CrossRef] [PubMed] [Green Version]
- Huijbers, A.; Tollenaar, R.A.; v Pelt, G.W.; Zeestraten, E.C.; Dutton, S.; McConkey, C.C.; Domingo, E.; Smit, V.T.; Midgley, R.; Warren, B.F. The proportion of tumor-stroma as a strong prognosticator for stage II and III colon cancer patients: Validation in the VICTOR trial. Ann. Oncol. Off. J. Eur. Soc. Med. Oncol. 2013, 24, 179–185. [Google Scholar] [CrossRef] [PubMed]
- Nagtegaal, I.D.; Odze, R.D.; Klimstra, D.; Paradis, V.; Rugge, M.; Schirmacher, P.; Washington, K.M.; Carneiro, F.; Cree, I.A. The 2019 WHO classification of tumours of the digestive system. Histopathology 2020, 76, 182–188. [Google Scholar] [CrossRef] [PubMed] [Green Version]
- Verhulst, J.; Ferdinande, L.; Demetter, P.; Ceelen, W. Mucinous subtype as prognostic factor in colorectal cancer: A systematic review and meta-analysis. J. Clin. Pathol. 2012, 65, 381–388. [Google Scholar] [CrossRef] [PubMed] [Green Version]
- Khan, M.; Loree, J.M.; Advani, S.M.; Ning, J.; Li, W.; Pereira, A.A.L.; Lam, M.; Raghav, K.; Morris, V.K.; Broaddus, R.; et al. Prognostic Implications of Mucinous Differentiation in Metastatic Colorectal Carcinoma Can Be Explained by Distinct Molecular and Clinicopathologic Characteristics. Clin. Color. Cancer 2018, 17, e699–e709. [Google Scholar] [CrossRef] [Green Version]
- Nguyen, H.G.; Lundström, O.; Blank, A.; Dawson, H.; Lugli, A.; Anisimova, M.; Zlobec, I. Image-based assessment of extracellular mucin-to-tumor area predicts consensus molecular subtypes (CMS) in colorectal cancer. Mod. Pathol. 2021, 35, 240–248. [Google Scholar] [CrossRef]
- Wang, L.; Hirano, Y.; Heng, G.; Ishii, T.; Kondo, H.; Hara, K.; Obara, N.; Asari, M.; Kato, T.; Yamaguchi, S. Mucinous Adenocarcinoma as a High-risk Factor in Stage II Colorectal Cancer: A Propensity Score-matched Study from Japan. Anticancer. Res. 2020, 40, 1651–1659. [Google Scholar] [CrossRef]
- Lugli, A.; Kirsch, R.; Ajioka, Y.; Bosman, F.; Cathomas, G.; Dawson, H.; El Zimaity, H.; Flejou, J.F.; Hansen, T.P.; Hartmann, A.; et al. Recommendations for reporting tumor budding in colorectal cancer based on the International Tumor Budding Consensus Conference (ITBCC) 2016. Mod. Pathol. 2017, 30, 1299–1311. [Google Scholar] [CrossRef] [Green Version]
- De Smedt, L.; Palmans, S.; Andel, D.; Govaere, O.; Boeckx, B.; Smeets, D.; Galle, E.; Wouters, J.; Barras, D.; Suffiotti, M.; et al. Expression profiling of budding cells in colorectal cancer reveals an EMT-like phenotype and molecular subtype switching. Br. J. Cancer 2017, 116, 58–65. [Google Scholar] [CrossRef]
- Guinney, J.; Dienstmann, R.; Wang, X.; de Reynies, A.; Schlicker, A.; Soneson, C.; Marisa, L.; Roepman, P.; Nyamundanda, G.; Angelino, P.; et al. The consensus molecular subtypes of colorectal cancer. Nat. Med. 2015, 21, 1350–1356. [Google Scholar] [CrossRef]
- Isella, C.; Brundu, F.; Bellomo, S.E.; Galimi, F.; Zanella, E.; Porporato, R.; Petti, C.; Fiori, A.; Orzan, F.; Senetta, R.; et al. Selective analysis of cancer-cell intrinsic transcriptional traits defines novel clinically relevant subtypes of colorectal cancer. Nat. Commun. 2017, 8, 15107. [Google Scholar] [CrossRef] [PubMed]
- Allen, W.L.; Dunne, P.D.; McDade, S.; Scanlon, E.; Loughrey, M.; Coleman, H.; McCann, C.; McLaughlin, K.; Nemeth, Z.; Syed, N.; et al. Transcriptional subtyping and CD8 immunohistochemistry identifies poor prognosis stage II/III colorectal cancer patients who benefit from adjuvant chemotherapy. JCO Precis. Oncol. 2018, 2, 1–15. [Google Scholar] [CrossRef] [PubMed]
- Alderdice, M.; Richman, S.D.; Gollins, S.; Stewart, J.P.; Hurt, C.; Adams, R.; McCorry, A.M.; Roddy, A.C.; Vimalachandran, D.; Isella, C.; et al. Prospective patient stratification into robust cancer-cell intrinsic subtypes from colorectal cancer biopsies. J. Pathol. 2018, 245, 19–28. [Google Scholar] [CrossRef] [Green Version]
- Leopoldo, S.; Lorena, B.; Cinzia, A.; Gabriella, D.C.; Angela Luciana, B.; Renato, C.; Antonio, M.; Carlo, S.; Cristina, P.; Stefano, C.; et al. Two subtypes of mucinous adenocarcinoma of the colorectum: Clinicopathological and genetic features. Ann. Surg. Oncol. 2008, 15, 1429–1439. [Google Scholar] [CrossRef]
- Glasgow, S.C.; Yu, J.; Carvalho, L.P.; Shannon, W.D.; Fleshman, J.W.; McLeod, H.L. Unfavourable expression of pharmacologic markers in mucinous colorectal cancer. Br. J. Cancer 2005, 92, 259–264. [Google Scholar] [CrossRef] [PubMed]
- Mesker, W.E.; Liefers, G.J.; Junggeburt, J.M.; van Pelt, G.W.; Alberici, P.; Kuppen, P.J.; Miranda, N.F.; van Leeuwen, K.A.; Morreau, H.; Szuhai, K.; et al. Presence of a high amount of stroma and downregulation of SMAD4 predict for worse survival for stage I-II colon cancer patients. Anal. Cell. Pathol. 2009, 31, 169–178. [Google Scholar] [CrossRef]
- Mesker, W.E.; Junggeburt, J.M.; Szuhai, K.; de Heer, P.; Morreau, H.; Tanke, H.J.; Tollenaar, R.A. The carcinoma-stromal ratio of colon carcinoma is an independent factor for survival compared to lymph node status and tumor stage. Anal. Cell. Pathol. 2007, 29, 387–398. [Google Scholar] [CrossRef]
- Trinh, A.; Ladrach, C.; Dawson, H.E.; Ten Hoorn, S.; Kuppen, P.J.K.; Reimers, M.S.; Koopman, M.; Punt, C.J.A.; Lugli, A.; Vermeulen, L.; et al. Tumour budding is associated with the mesenchymal colon cancer subtype and RAS/RAF mutations: A study of 1320 colorectal cancers with Consensus Molecular Subgroup (CMS) data. Br. J. Cancer 2018, 119, 1244–1251. [Google Scholar] [CrossRef] [Green Version]
- Lang-Schwarz, C.; Melcher, B.; Haumaier, F.; Lang-Schwarz, K.; Rupprecht, T.; Vieth, M.; Sterlacci, W. Budding and tumor-infiltrating lymphocytes—Combination of both parameters predicts survival in colorectal cancer and leads to new prognostic subgroups. Hum Pathol. 2018, 79, 160–167. [Google Scholar] [CrossRef]
- Zlobec, I.; Dawson, H.E.; Blank, A.; Bokhorst, J.M.; Berger, M.D.; Nagtegaal, I.D.; Lugli, A. Are tumour grade and tumour budding equivalent in colorectal cancer? A retrospective analysis of 771 patients. Eur. J. Cancer 2020, 130, 139–145. [Google Scholar] [CrossRef]
- Jenkins, M.A.; Hayashi, S.; O’Shea, A.M.; Burgart, L.J.; Smyrk, T.C.; Shimizu, D.; Waring, P.M.; Ruszkiewicz, A.R.; Pollett, A.F.; Redston, M.; et al. Pathology features in Bethesda guidelines predict colorectal cancer microsatellite instability: A population-based study. Gastroenterology 2007, 133, 48–56. [Google Scholar] [CrossRef] [PubMed] [Green Version]
- Roelands, J.; Kuppen, P.J.K.; Vermeulen, L.; Maccalli, C.; Decock, J.; Wang, E.; Marincola, F.M.; Bedognetti, D.; Hendrickx, W. Immunogenomic Classification of Colorectal Cancer and Therapeutic Implications. Int. J. Mol. Sci. 2017, 18, 2229. [Google Scholar] [CrossRef] [Green Version]
- Picard, E.; Verschoor, C.P.; Ma, G.W.; Pawelec, G. Relationships Between Immune Landscapes, Genetic Subtypes and Responses to Immunotherapy in Colorectal Cancer. Front. Immunol. 2020, 11, 369. [Google Scholar] [CrossRef] [PubMed]
- Karpinski, P.; Rossowska, J.; Sasiadek, M.M. Immunological landscape of consensus clusters in colorectal cancer. Oncotarget 2017, 8, 105299–105311. [Google Scholar] [CrossRef] [PubMed] [Green Version]
- Becht, E.; de Reynies, A.; Giraldo, N.A.; Pilati, C.; Buttard, B.; Lacroix, L.; Selves, J.; Sautes-Fridman, C.; Laurent-Puig, P.; Fridman, W.H. Immune and Stromal Classification of Colorectal Cancer Is Associated with Molecular Subtypes and Relevant for Precision Immunotherapy. Clin. Cancer Res. 2016, 22, 4057–4066. [Google Scholar] [CrossRef] [Green Version]
- Sirinukunwattana, K.; Domingo, E.; Richman, S.D.; Redmond, K.L.; Blake, A.; Verrill, C.; Leedham, S.J.; Chatzipli, A.; Hardy, C.; Whalley, C.M.; et al. Image-based consensus molecular subtype (imCMS) classification of colorectal cancer using deep learning. Gut 2020, 70, 544–554. [Google Scholar] [CrossRef]
- Chen, Y.P.; Zhang, Y.; Lv, J.W.; Li, Y.Q.; Wang, Y.Q.; He, Q.M.; Yang, X.J.; Sun, Y.; Mao, Y.P.; Yun, J.P.; et al. Genomic Analysis of Tumor Microenvironment Immune Types across 14 Solid Cancer Types: Immunotherapeutic Implications. Theranostics 2017, 7, 3585–3594. [Google Scholar] [CrossRef]
- Schumacher, T.N.; Schreiber, R.D. Neoantigens in cancer immunotherapy. Science 2015, 348, 69–74. [Google Scholar] [CrossRef] [Green Version]
- Joost, P.; Bendahl, P.O.; Halvarsson, B.; Rambech, E.; Nilbert, M. Efficient and reproducible identification of mismatch repair deficient colon cancer: Validation of the MMR index and comparison with other predictive models. BMC Clin. Pathol. 2013, 13, 33. [Google Scholar] [CrossRef] [Green Version]
- Greenson, J.K.; Bonner, J.D.; Ben-Yzhak, O.; Cohen, H.I.; Miselevich, I.; Resnick, M.B.; Trougouboff, P.; Tomsho, L.D.; Kim, E.; Low, M.; et al. Phenotype of microsatellite unstable colorectal carcinomas: Well-differentiated and focally mucinous tumors and the absence of dirty necrosis correlate with microsatellite instability. Am. J. Surg. Pathol. 2003, 27, 563–570. [Google Scholar] [CrossRef]
- Smyrk, T.C.; Watson, P.; Kaul, K.; Lynch, H.T. Tumor-infiltrating lymphocytes are a marker for microsatellite instability in colorectal carcinoma. Cancer 2001, 91, 2417–2422. [Google Scholar] [CrossRef]
- Alexander, J.; Watanabe, T.; Wu, T.T.; Rashid, A.; Li, S.; Hamilton, S.R. Histopathological identification of colon cancer with microsatellite instability. Am. J. Pathol. 2001, 158, 527–535. [Google Scholar] [CrossRef] [Green Version]
- Reynolds, I.S.; Furney, S.J.; Kay, E.W.; McNamara, D.A.; Prehn, J.H.M.; Burke, J.P. Meta-analysis of the molecular associations of mucinous colorectal cancer. Br. J. Surg. 2019, 106, 682–691. [Google Scholar] [CrossRef]
- Sandberg, T.P.; Stuart, M.; Oosting, J.; Tollenaar, R.; Sier, C.F.M.; Mesker, W.E. Increased expression of cancer-associated fibroblast markers at the invasive front and its association with tumor-stroma ratio in colorectal cancer. BMC Cancer 2019, 19, 284. [Google Scholar] [CrossRef] [Green Version]
- Sandberg, T.P.; Oosting, J.; van Pelt, G.W.; Mesker, W.E.; Tollenaar, R.; Morreau, H. Molecular profiling of colorectal tumors stratified by the histological tumor-stroma ratio—Increased expression of galectin-1 in tumors with high stromal content. Oncotarget 2018, 9, 31502–31515. [Google Scholar] [CrossRef] [PubMed]
- De Sousa, E.M.F.; Wang, X.; Jansen, M.; Fessler, E.; Trinh, A.; de Rooij, L.P.; de Jong, J.H.; de Boer, O.J.; van Leersum, R.; Bijlsma, M.F.; et al. Poor-prognosis colon cancer is defined by a molecularly distinct subtype and develops from serrated precursor lesions. Nat. Med. 2013, 19, 614–618. [Google Scholar] [CrossRef]
- Smit, M. Tumour-stroma ratio outperforms tumour budding as biomarker in colon cancer: A cohort study. Int. J. Color. Dis. 2021, 36, 2729–2737. [Google Scholar] [CrossRef]
- Kautto, E.A.; Bonneville, R.; Miya, J.; Yu, L.; Krook, M.A.; Reeser, J.W.; Roychowdhury, S. Performance evaluation for rapid detection of pan-cancer microsatellite instability with MANTIS. Oncotarget 2017, 8, 7452–7463. [Google Scholar] [CrossRef]


| Combined | AMC-AJCC-90 | AC-ICAM | |||
|---|---|---|---|---|---|
| (n = 218) | (n = 83) | (n = 135) | p-Value | ||
| Age | |||||
| Mean (SD) | 69.2 (11.8) | 69.5 (13.1) | 69.1 (10.9) | 0.818 | |
| Gender | |||||
| Male | 112 (51.4) | 38 (45.8) | 74 (54.8) | 0.195 | |
| Female | 106 (48.6) | 45 (54.2) | 61 (45.2) | ||
| Localization | |||||
| Right | 113 (51.8) | 44 (53.0) | 69 (51.1) | 0.785 | |
| Left | 105 (48.2) | 39 (47.0) | 66 (48.9) | ||
| pT stage | |||||
| 2 | 7 (3.2) | 0 (0) | 7 (5.2) | 0.103 | |
| 3 | 189 (86.7) | 75 (90.4) | 114 (84.4) | ||
| 4 | 22 (10.1) | 8 (9.6) | 14 (10.4) | ||
| CMS | |||||
| 1 | 43 (19.7) | 20 (24.1) | 23 (17.0) | 0.310 | |
| 2 | 74 (33.9) | 31 (37.3) | 43 (31.9) | ||
| 3 | 40 (18.3) | 12 (14.5) | 28 (20.7) | ||
| 4 | 61 (28.0) | 20 (24.1) | 41 (30.4) | ||
| CRIS | |||||
| A | 60 (27.5) | 26 (31.3) | 34 (25.2) | 0.754 | |
| B | 35 (16.1) | 12 (14.5) | 23 (17.0) | ||
| C | 63 (28.9) | 21 (25.3) | 42 (31.1) | ||
| D | 35 (16.1) | 15 (18.1) | 20 (14.8) | ||
| E | 25 (11.5) | 9 (10.8) | 16 (11.9) | ||
| CMS1 | CMS2 | CMS3 | CMS4 | p-Value | ||
|---|---|---|---|---|---|---|
| TILs | ||||||
| None/low | 21 (48.8) | 65 (90.3) | 25 (64.1) | 54 (90.0) | <0.001 | |
| Intermediate | 11 (25.6) | 7 (9.7) | 12 (30.8) | 5 (8.3) | ||
| High | 11 (25.6) | 0 (0) | 2 (5.1) | 1 (1.7) | ||
| Mucus | ||||||
| ≤50% | 33 (76.7) | 72 (100) | 33 (84.6) | 51 (85.0) | 0.001 | |
| >50% | 10 (23.3) | 0 (0) | 6 (15.4) | 9 (15.0) | ||
| Mucus | ||||||
| <10% | 20 (46.5) | 68 (94.4) | 14 (35.9) | 46 (76.7) | <0.001 | |
| ≥10% | 23 (53.5) | 4 (5.6) | 25 (64.1) | 14 (23.3) | ||
| TSR | ||||||
| Stroma-low | 32 (74.4) | 55 (74.3) | 26 (65.0) | 32 (52.5) | 0.034 | |
| Stroma-high | 11 (25.6) | 19 (25.7) | 14 (35.0) | 29 (47.5) | ||
| Tumor Budding | ||||||
| Low (<5) | 33 (76.7) | 63 (85.1) | 36 (90.0) | 44 (72.1) | 0.271 | |
| Intermediate (5–9) | 7 (16.3) | 7 (9.5) | 2 (5.0) | 13 (21.3) | ||
| High (≥10) | 3 (7.0) | 4 (5.4) | 2 (5.0) | 4 (6.6) | ||
| CRIS-A | CRIS-B | CRIS-C | CRIS-D | CRIS-E | p-Value | ||
|---|---|---|---|---|---|---|---|
| TILs | |||||||
| None/low | 38 (64.4) | 22 (62.9) | 56 (90.3) | 29 (85.3) | 20 (83.3) | 0.001 | |
| Intermediate | 17 (28.8) | 7 (20.0) | 6 (9.7) | 2 (5.9) | 3 (12.5) | ||
| High | 4 (6.8) | 6 (17.1) | 0 (0) | 3 (8.8) | 1 (4.2) | ||
| Mucus | |||||||
| ≤50% | 40 (67.8) | 31 (88.6) | 61 (98.4) | 33 (97.1) | 24 (100) | <0.001 | |
| >50% | 19 (32.2) | 4 (11.4) | 1 (1.6) | 1 (2.9) | 0 (0) | ||
| Mucus | |||||||
| <10% | 14 (23.7) | 26 (74.3) | 56 (90.3) | 31 (91.2) | 21 (87.5) | <0.001 | |
| ≥10% | 45 (76.3) | 9 (25.7) | 6 (9.7) | 3 (8.8) | 3 (12.5) | ||
| TSR | |||||||
| Stroma-low | 42 (70.0) | 26 (74.3) | 42 (66.7) | 19 (54.3) | 16 (64.0) | 0.448 | |
| Stroma-high | 18 (30.0) | 9 (25.7) | 21 (33.3) | 16 (45.7) | 9 (36.0) | ||
| Tumor Budding | |||||||
| Low (<5) | 53 (88.3) | 24 (68.6) | 50 (79.4) | 28 (80.0) | 21 (84.0) | 0.429 | |
| Intermediate (5–9) | 4 (6.7) | 9 (25.7) | 9 (14.3) | 5 (14.3) | 2 (8.0) | ||
| High (≥10) | 3 (5.0) | 2 (5.7) | 4 (6.3) | 2 (5.7) | 2 (8.0) | ||
Publisher’s Note: MDPI stays neutral with regard to jurisdictional claims in published maps and institutional affiliations. |
© 2022 by the authors. Licensee MDPI, Basel, Switzerland. This article is an open access article distributed under the terms and conditions of the Creative Commons Attribution (CC BY) license (https://creativecommons.org/licenses/by/4.0/).
Share and Cite
van de Weerd, S.; Smit, M.A.; Roelands, J.; Mesker, W.E.; Bedognetti, D.; Kuppen, P.J.K.; Putter, H.; Tollenaar, R.A.E.M.; Roodhart, J.M.L.; Hendrickx, W.; et al. Correlation of Immunological and Histopathological Features with Gene Expression-Based Classifiers in Colon Cancer Patients. Int. J. Mol. Sci. 2022, 23, 12707. https://doi.org/10.3390/ijms232012707
van de Weerd S, Smit MA, Roelands J, Mesker WE, Bedognetti D, Kuppen PJK, Putter H, Tollenaar RAEM, Roodhart JML, Hendrickx W, et al. Correlation of Immunological and Histopathological Features with Gene Expression-Based Classifiers in Colon Cancer Patients. International Journal of Molecular Sciences. 2022; 23(20):12707. https://doi.org/10.3390/ijms232012707
Chicago/Turabian Stylevan de Weerd, Simone, Marloes A. Smit, Jessica Roelands, Wilma E. Mesker, Davide Bedognetti, Peter J. K. Kuppen, Hein Putter, Rob A. E. M. Tollenaar, Jeanine M. L. Roodhart, Wouter Hendrickx, and et al. 2022. "Correlation of Immunological and Histopathological Features with Gene Expression-Based Classifiers in Colon Cancer Patients" International Journal of Molecular Sciences 23, no. 20: 12707. https://doi.org/10.3390/ijms232012707