Article

P=O Functionalized Black Phosphorus/1T-WS2 Nanocomposite High Efficiency Hybrid Photocatalyst for Air/Water Pollutant Degradation

1
Department of Chemistry, Sungkyunkwan University, Suwon 16419, Korea
2
Institue of Basic Science, Sungkyunkwan University, Suwon 16419, Korea
3
Thin Film Materials Research Center, Korea Research Institute of Chemical Technology, Daejeon 34114, Korea
*
Author to whom correspondence should be addressed.
Int. J. Mol. Sci. 2022, 23(2), 733; https://doi.org/10.3390/ijms23020733
Submission received: 16 December 2021 / Revised: 30 December 2021 / Accepted: 8 January 2022 / Published: 10 January 2022
(This article belongs to the Special Issue Nano-Materials and Methods 3.0)

Abstract

:
Research on layered two-dimensional (2D) materials is at the forefront of material science. Because 2D materialshave variousplate shapes, there is a great deal of research on the layer-by-layer-type junction structure. In this study, we designed a composite catalyst with a dimension lower than two dimensions and with catalysts that canbe combined so that the band structures can be designed to suit various applications and cover for each other’s disadvantages. Among transition metal dichalcogenides, 1T-WS2 can be a promising catalytic material because of its unique electrical properties. Black phosphorus with properly controlled surface oxidation can act as a redox functional group. We synthesized black phosphorus that was properly surface oxidized by oxygen plasma treatment and made a catalyst for water quality improvement through composite with 1T-WS2. This photocatalytic activity was highly efficient such that the reaction rate constant k was 10.31 × 10⁻² min−1. In addition, a high-concentration methylene blue solution (20 ppm) was rapidly decomposed after more than 10 cycles and showed photo stability. Designing and fabricating bandgap energy-matching nanocomposite photocatalysts could provide a fundamental direction in solving the future’s clean energy problem.

1. Introduction

The pollution of the environment from chemicals used in industrial processes is a major concern, and the use of these chemicals continues to increase worldwide. Among these pollution types, water pollution is becoming increasingly alarming as the industry further develops. It is also a fundamental cause that can lead to soil pollution. Methylene blue (MB), a cationic thiazine dye widely used in fields such as the chemical and biological industries, can cause various health problems, including vomiting, nausea, extreme sweating, restless breathing, eye irritation, and mental disorders. Synthetic dyes are most widely used in the textile, leather, pharmaceutical, and food industries [1]. The use of dye-rich wastewater in many manufacturing industries can cause many health and environmental problems [2]. Synthetic dyes are toxic even at low concentrations and must be removed from industrial wastewater before discharge to aquatic systems. Over the past decades, many researchers have tried to find various systems and technologies to remove these dyes from industrial wastewater. Typically, adsorption [3,4,5], coagulation [6], ultraviolet decomposition [7], oxidation and reduction treatments are used to remove dyes [8,9,10]. However, many of these technologies are expensive and pose secondary risks, including toxic and hazardous chemicals. Conversely, the decomposition of organic dyes through a photocatalyst does not generate secondary chemicals. It is harmless to nature, making it convenient for industrial applications [11,12]. Photocatalytic decomposition of MB has long been attempted using various materials [13,14,15,16,17,18,19]. Additionally, in recent years, there has been a growing interest in volatile organic chemicals (VOCs) that are harmful to air quality and human health. Long-term exposure to VOCs can cause respiratory problems, such as lung cancer. In addition, VOCs can greatly affect the increase in fine dust by accelerating the formation of secondary organic aerosols that change into particles under oxidized conditions through complex heterogeneous reactions.
The discovery of graphene, a hot issue in the field of materials science, has clearly attracted great interest worldwide and has had a tremendous impact in many fields [20,21,22,23]. In the past few years, research into 2D materials has greatly advanced [24,25]. Research into layered 2D materials is at the forefront of materials science [26]. Among these materials, layered black phosphorus (BP) plays a vital role in several applications [27,28,29,30]. Phosphorene exhibits a layer-dependent bandgap ranging from 0.3 to 1.7 eV for monolayers in bulk [31]. Moreover, phosphorene is advantageous for optical applications because the bandgap depends only on the number of layers [32]. In addition, phosphorene has demonstrated high carrier mobility [33], layer-dependent photoluminescence (PL) [34], and anisotropic behavior [35]. Recently, Kim’s group showed that a bipolar pseudospin semiconductor could control the crystal structure of BP [36]. However, one major obstacle that phosphorene still suffers from is long-term stability in ambient conditions, and methods to overcome this through layer passivation or layer functionalization are being studied [37,38,39].
Contrary to these widely studied obstacles, oxidized BP remains largely unexplored [40]. Black phosphorus oxide can be produced using BP with differing oxygen content (PxOy). Theoretical calculations predict a wide bandgap range with increased oxygen concentrationfor BP oxide [41]. There have also been studies to improve battery performance by using P=O bonding as a redox functional group [42] and studies to dramatically improve the performance of reduction catalysts [43]. Tungsten disulfide (WS2), an important member of the layered TMD compounds, is widely applied in lubrication [44], field-effect transistors [45], electrocatalysts [46], and photocatalysts [47,48]. WS2 is a nonprecious metal–semiconductor material with a broad spectrum response and isused as a photocatalyst. In particular, single- and multiple-layer WS2 can be obtained through ultrasonic treatment or hydrothermal [49] or chemical vapor deposition [50] and exhibits excellent catalytic activity for visible light photocatalysts. It is often used as a cocatalystalong with other semiconductor photocatalysts [51,52]. Polymorphs of MX2 compounds, such as MoS2 and WS2, are usually ofseveral types, including 1T and 2H phases, based on the M and X atoms’ different coordination modes. The 2H phase can be described as consisting of two S-M-S layers composed of edge-shared MS6 triangular prisms. The 1T phase is characterized by one S-M-S layer composed of edge-shared MS6 octahedrons [53,54,55]. Compared withthe 2H phase with semiconductor characteristics, the 1T phase exhibits metallic characteristics and has high electrical conductivity, showing excellent performance [56]. However, the metal-phase WS2 nanostructure, especially the 1T phase, has been much less explored. Recent colloidal chemical synthesis has been proven impressive. It retains the stability of the synthesized metal-phase MoS2 over three months, which is much longer than 12 days of chemically exfoliated MoS2 that can be converted back from 1T to 2H [49]. Gopannagari et al. reported the composite of several layers of WS2 nanosheets and CdS nanorodscans [57]. The lifetime of the photogenerated carriers was effectively extended, and the surface migration properties were improved through the active edge sites and the intrinsic electrical conductivity around them. Therefore, the formation of heterojunctions is an effective way of improving photocatalytic performance [58]. These complex catalysts are designed to be bonded to each other, so that the band structure is designed for the purpose and can compensate for each other’s shortcomings. Among TMDCs, WS2 can be a promising cocatalyst material due to its unique electrical properties [59], and black phosphorus, which has been properly regulated for oxidation, can act as a redox functional group [42,43].
In this study, a photocatalyst for decomposition of water and air pollution was made through WS2 and composite materials by synthesizing black phosphorus, which is inexpensive, suitable, and easily controlled in oxidation state. A hybrid photocatalyst that satisfies the bandgap alignment and shortcomings through a nanocomposite material was studied. In addition, it was utilized as a functional group for P=O bonding, thereby having an additional effect of increasing efficiency and exhibiting improved catalytic efficiency to prevent electron-hole recombination. In addition, in terms of stability, which is a chronic problem of BP, the passivation effect was obtained with WS2 composite, and it was greatly improved. A synergistic effect was obtained from the excellent performance of the two materials, which are promising two-dimensional materials, and stability was also secured. In the field of two-dimensional materials, visible light photocatalytic materials may be additionally promising in various fields such as hydrogen generation and air and water purification. It can also be a way to overcome the limitations of BP with excellent performance.

2. Results and Discussion

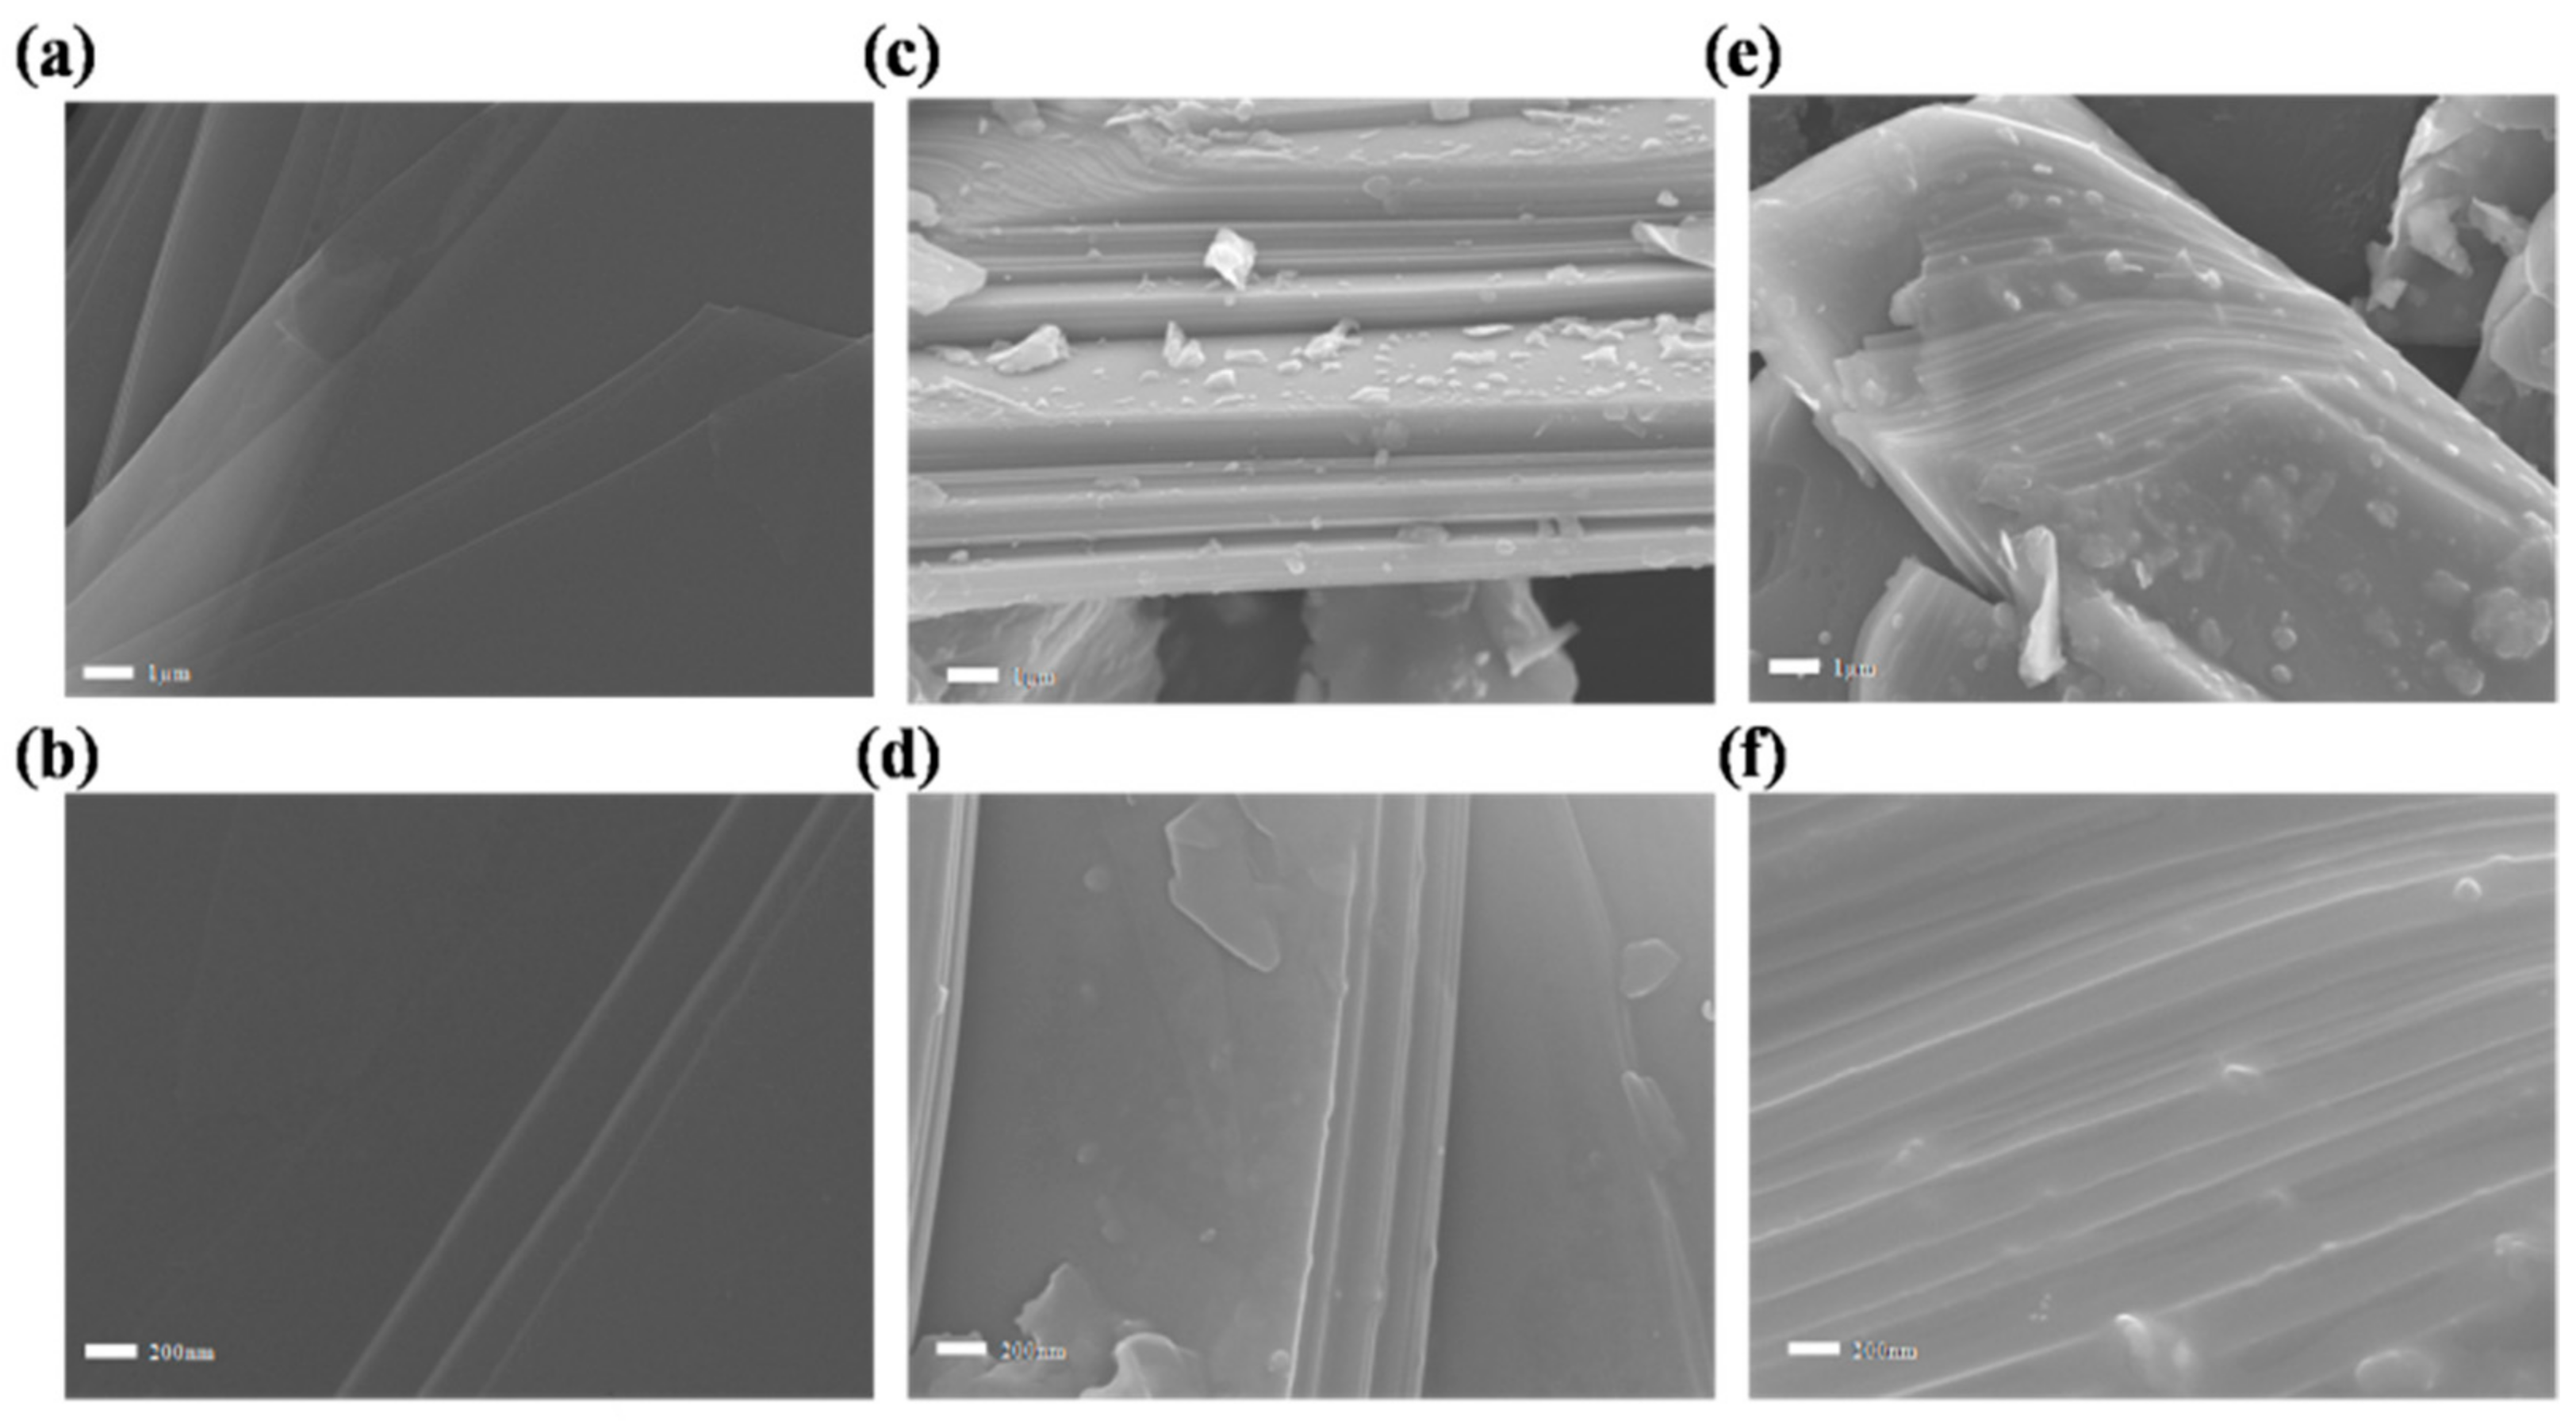
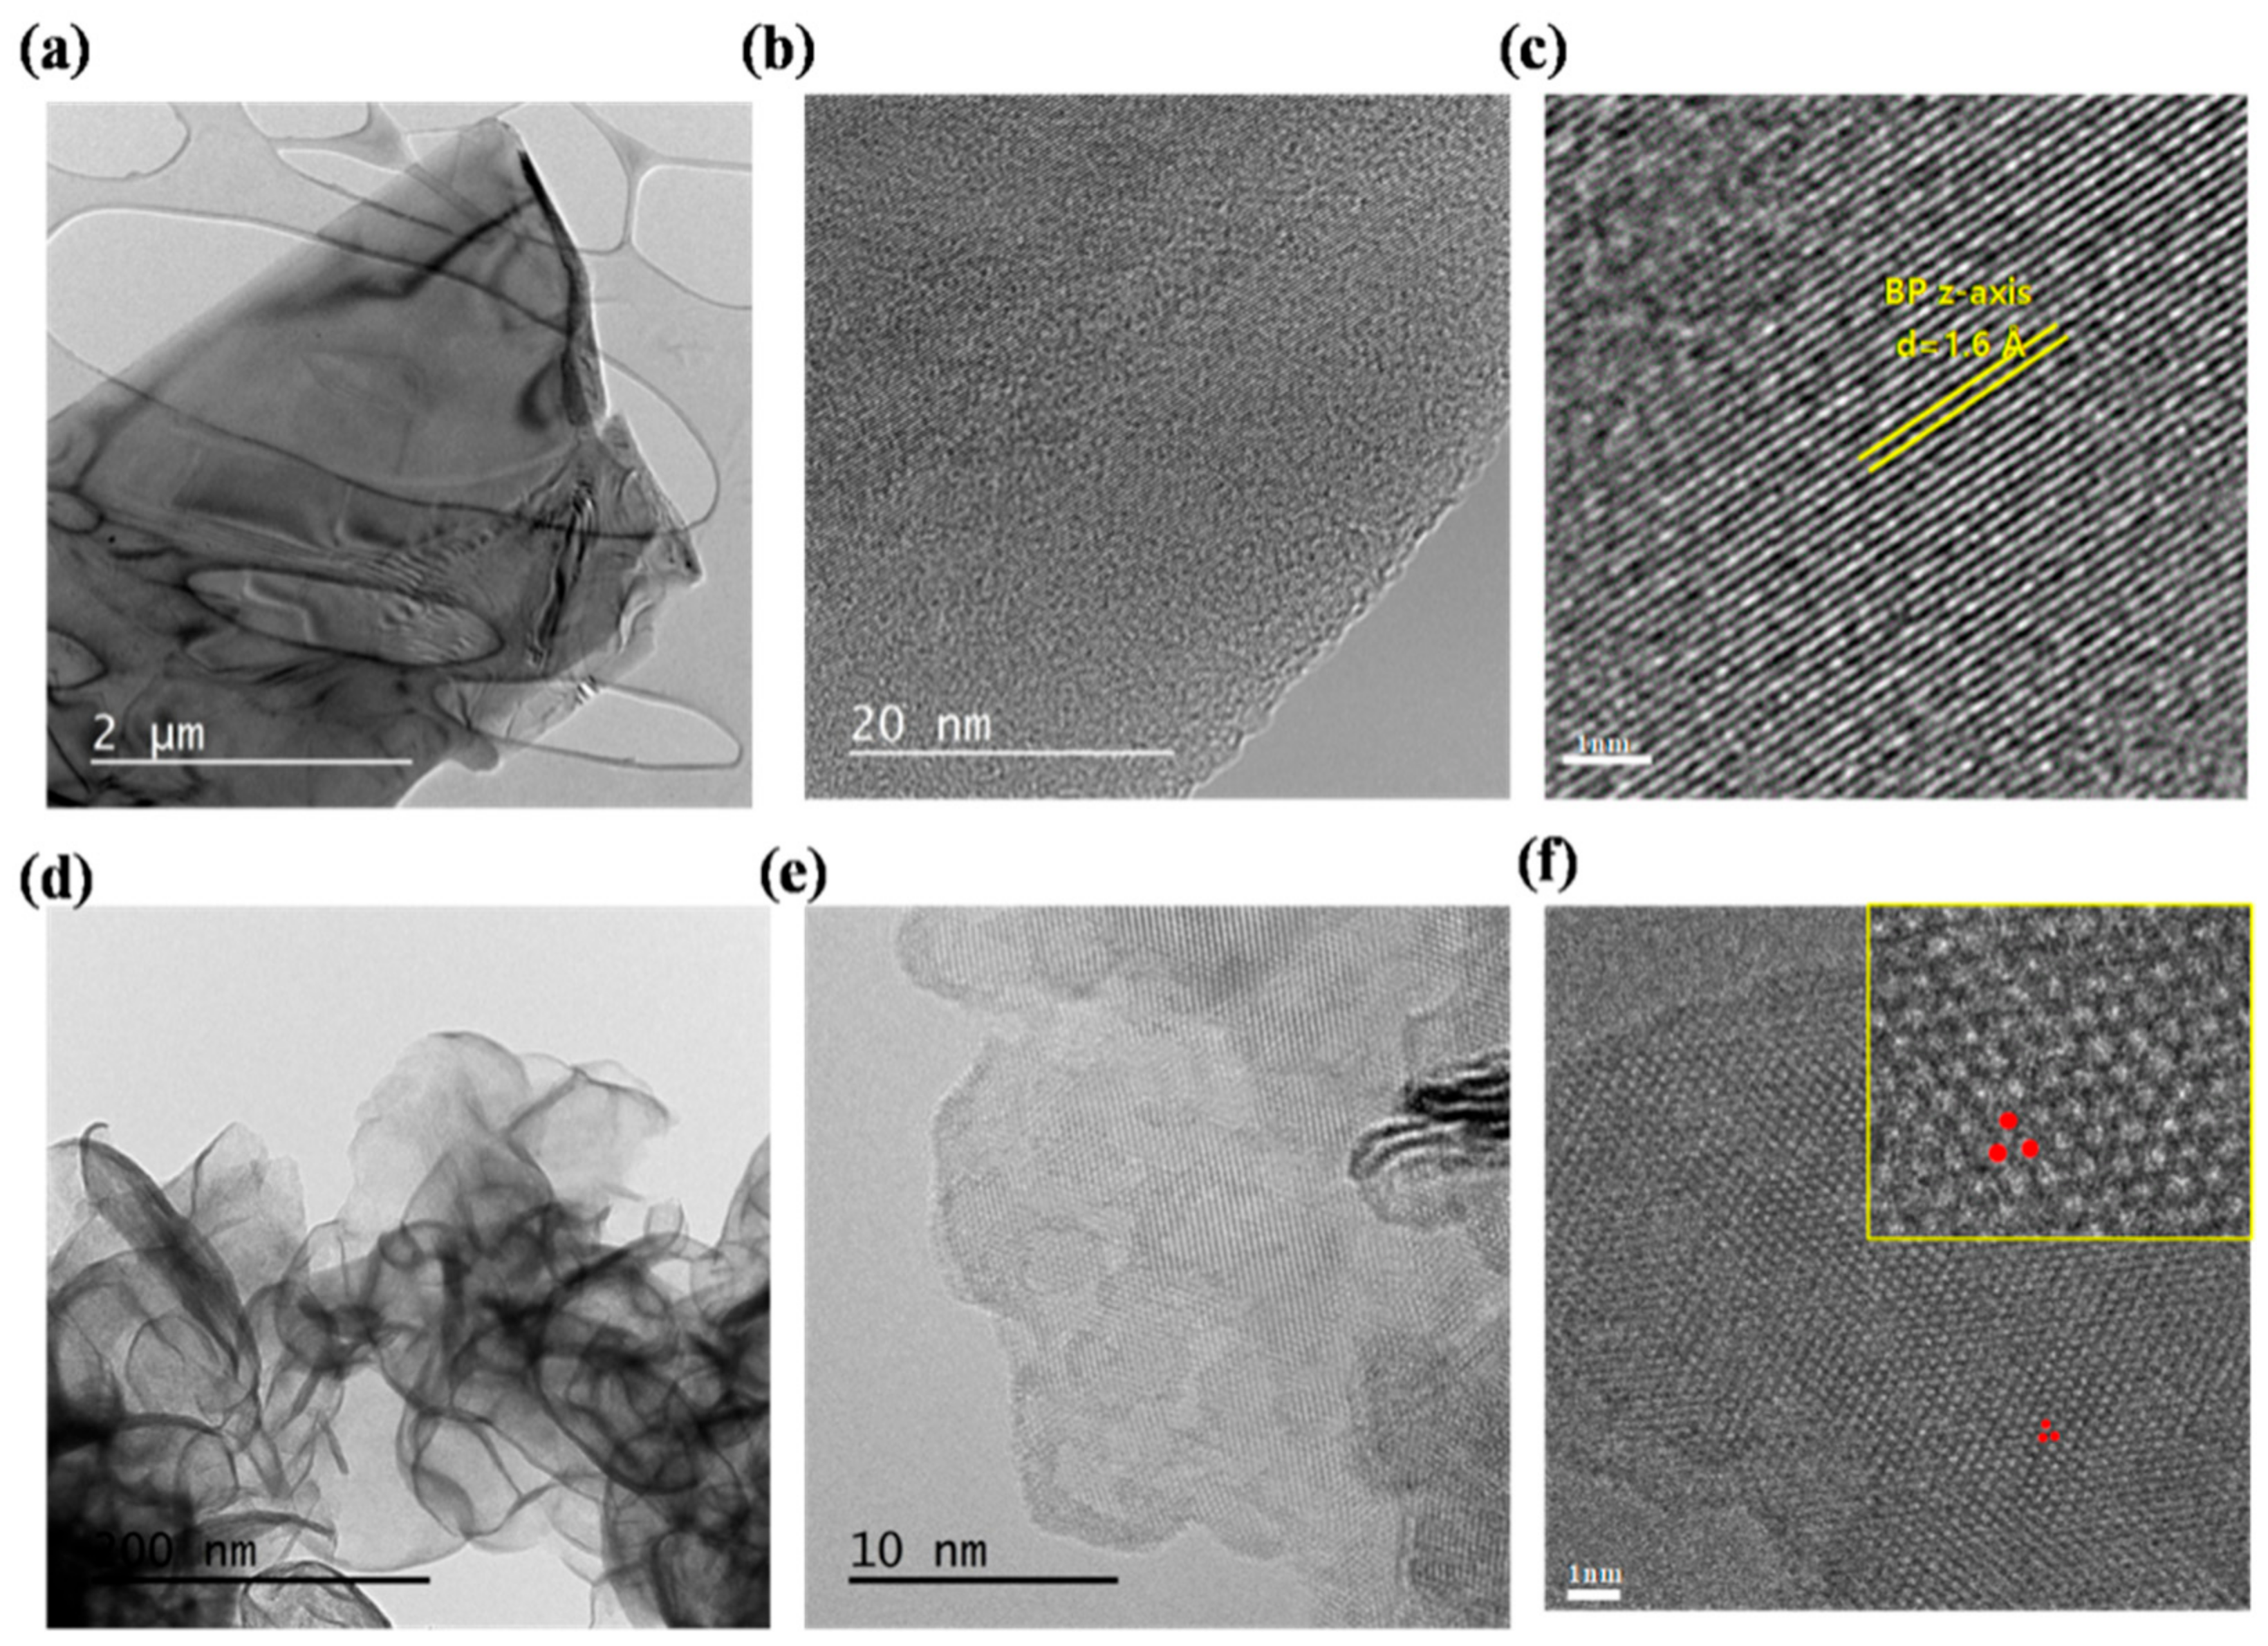
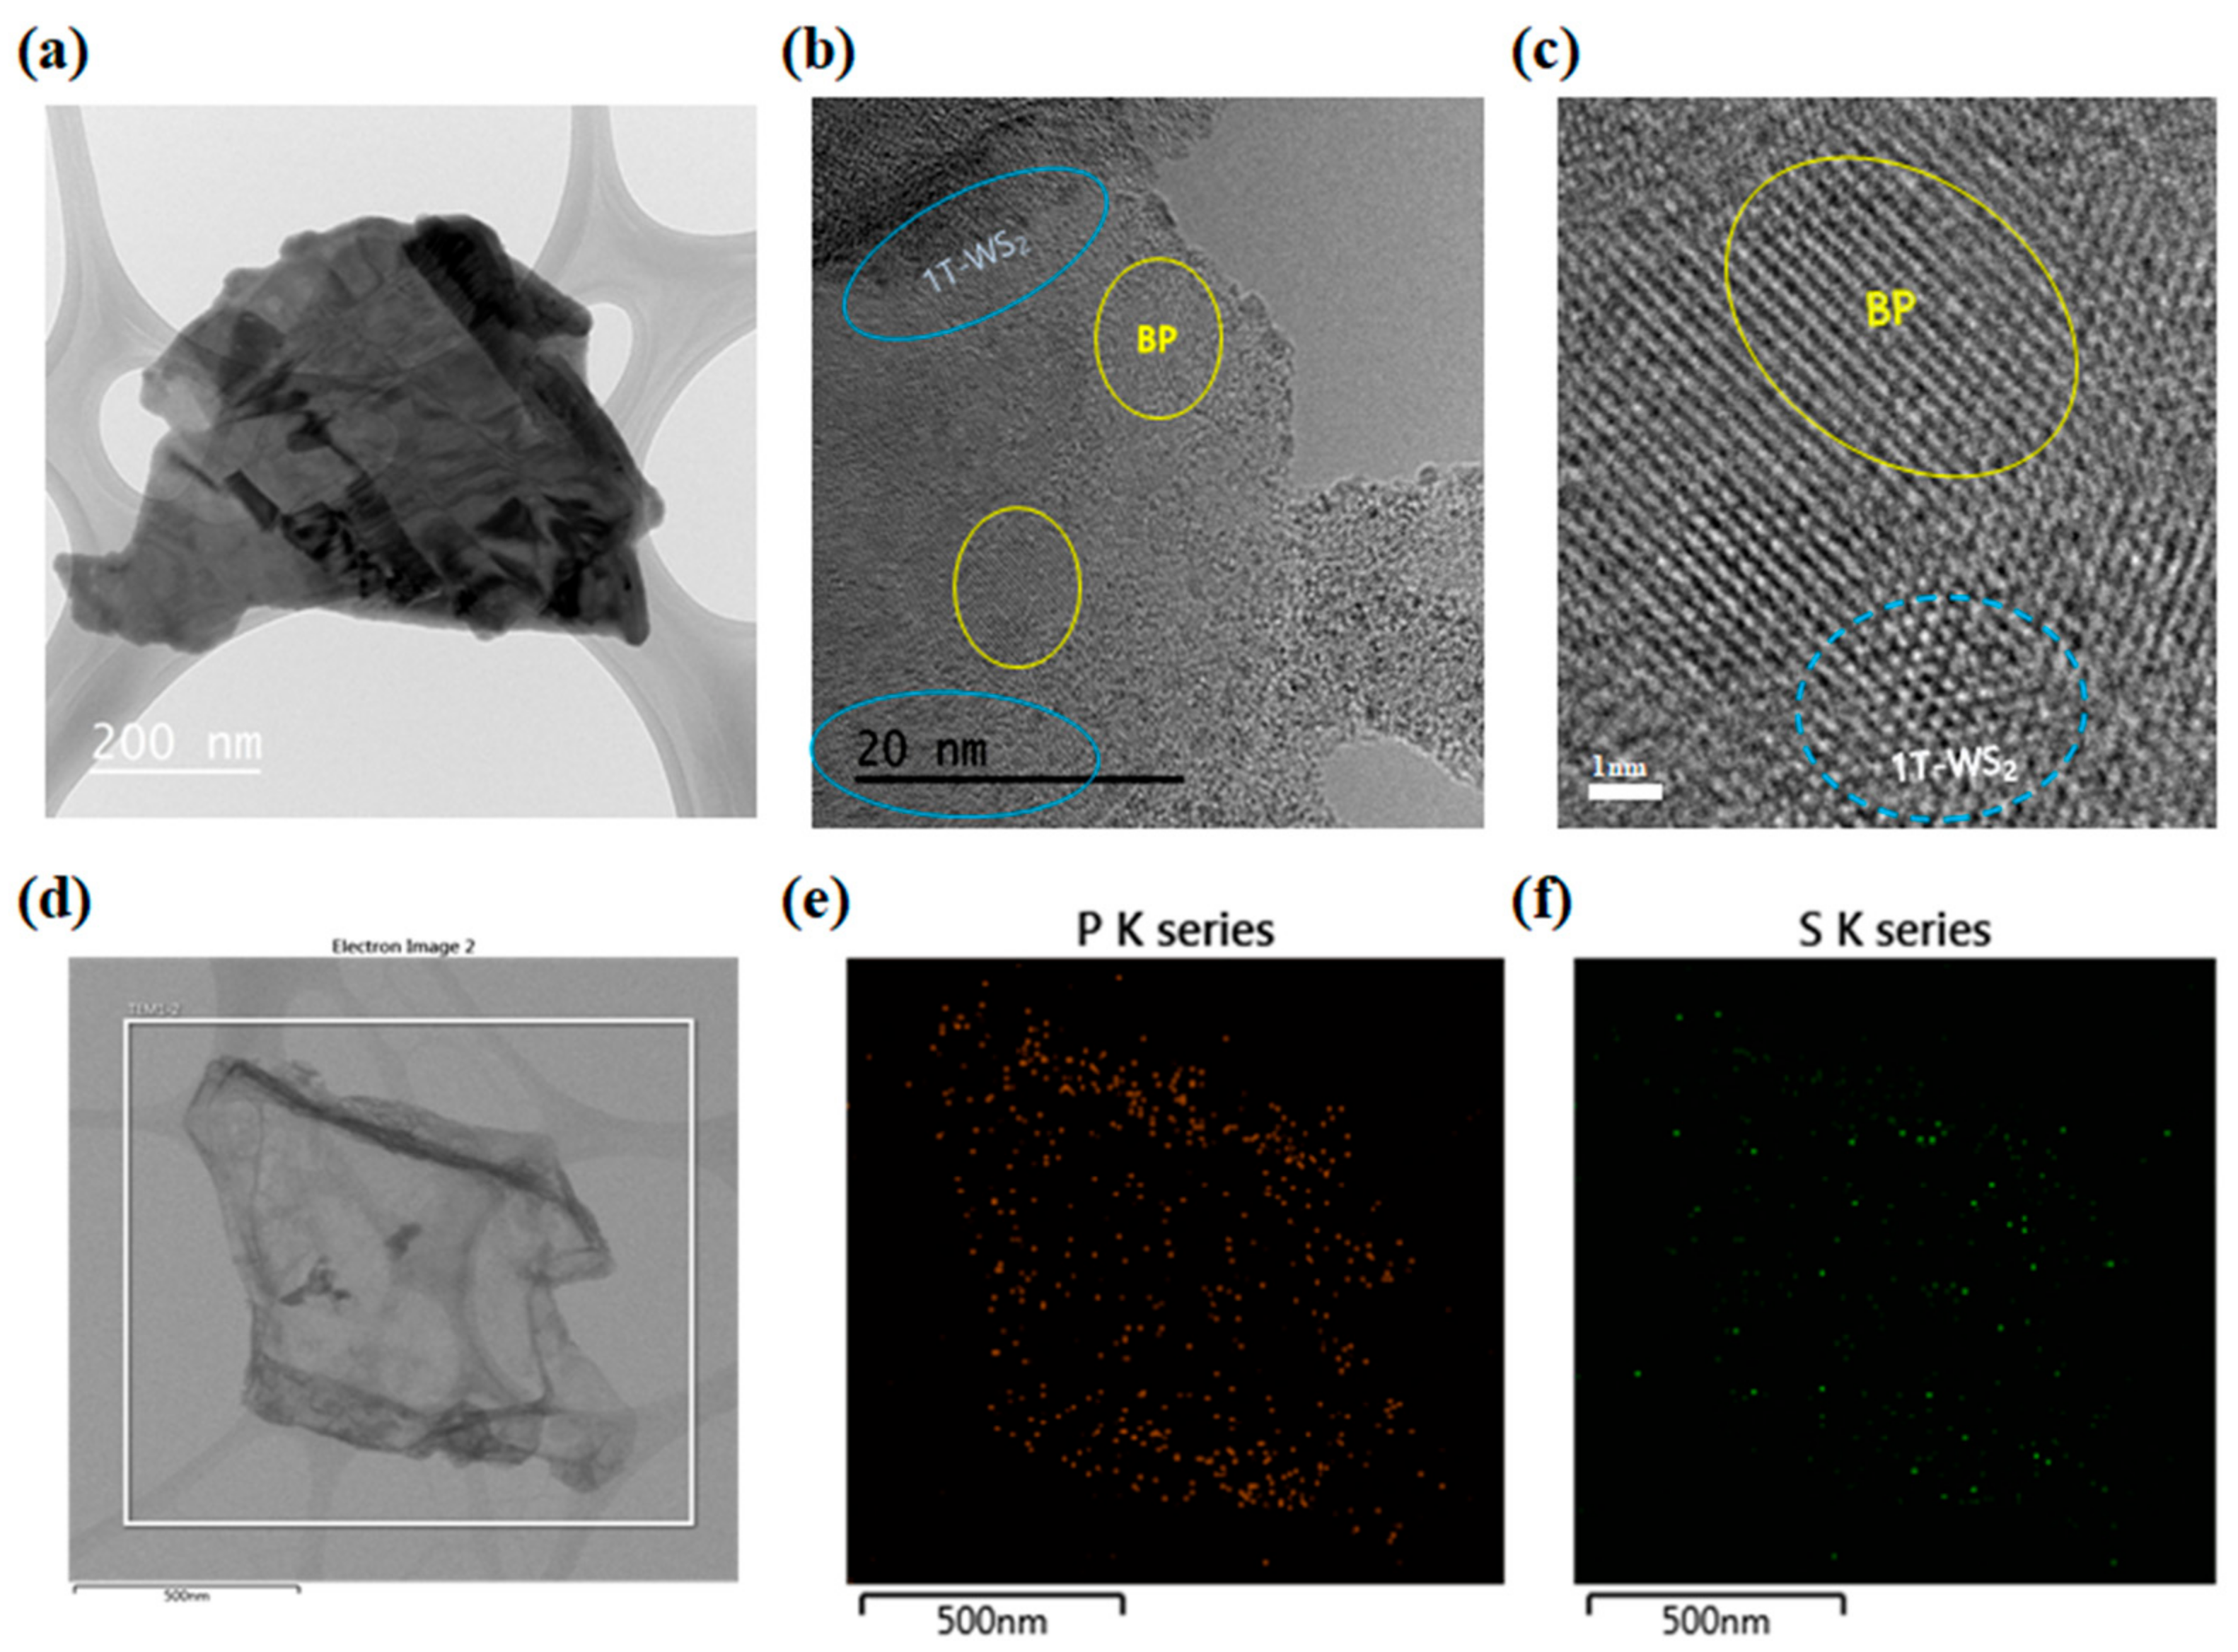
2.1. Material Morphology Characterization

First, the oxidation state of BP was observed using SEM. The images in Figure 1 are samples before exfoliation, so several sheets are stacked. The exfoliated BP was measured using the sample before exfoliation to avoid electron beam damage and because it is difficult to observe with SEM. It observed that the initially cleaned bare BP is the same as the sheet-shaped commercial BP and that the surface is clean (Figure 1a,b). In addition, It observed that the surface is smooth even in high-magnification images. As the sample in this state is oxidated, P=O bonding occurs with increased amounts of PxOy on the surface. When the sample is washed with water, PxOy dissolves and disappears, leaving only partial P–O and P=O bonding. Figure 1c–f are the results of 5-W O2 plasma treatment for 5 and 10 min, respectively. This confirmed that the surface oxidation proceeds and is covered with PxOy, as can be seen clearly. At this time, in addition to the generation of the PxOy layer, P–O bonding and P=O bonding are also formed [50].
Figure 2 shows the data obtained by measuring 1T-WS2 nanosheets synthesized with oxidation controlled BP (OBP) using high-resolution transmission electron microscopy (HR-TEM). HR-TEM measurements were obtained by dispersion in ethanol at 10 mg L−1 sample concentration and sampling in TEM 200-mesh Cu-carbon holey grid.
Figure 2a–c shows OBP TEM images. Wide and thin sheets can be seen at low magnification, and the appearance of the aligned grid structure at high magnification is clearly seen. This sample is partially oxidized. The BP can be damaged by a strong beam, so it was measured by lowering the laser power specifically. The observed high-resolution BP lattice distance is approximately 1.6 Å, which is confirmed in the BP’s z-axis direction [51,52]. It can be seen that the crystalline lattice is preserved even after the exfoliation of BP flakes, and there is a partial oxidation area. Figure 2d–f shows the HR-TEM images of the synthesized 1T-WS2 nanosheet. In the low-magnification image of Figure 2d, the shape of the thin nanosheet WS2 can be confirmed, and the lattice structures of 1T-WS2 are predominantly observed in the high-resolution image at high magnification. In Figure 2f, in the case of 1T-WS2, the six S atoms closest to the W atom are covalently bonded in a hexagonal shape [53]. In addition, the distance between the W–W atoms is as much as 3.1 Å in a uniform lattice structure.
Figure 3 shows the TEM and EDS data of the 1T-WS2 nanocomposite synthesized with the BP in the controlled oxidation state. As shown in Figure 3a, when viewed under low-magnification HR-TEM, two materials in the form of a sheet are combined. On average, the area of the WS2 sheet was often smaller than that of the BP sheet, and the ratio was formed randomly. Figure 3b,c shows HR-TEM images under high magnification, and both the BP and 1T-WS2 lattices seen in Figure 2 are observed. The observed samples had a random size through the exfoliation process, and WS2 sheets standing vertically in several layers were also observed. After checking the distribution of P, S, and W elements through TEM EDS mapping in Figure 3d–f, it was confirmed that the BP and WS2 nanosheets were bonded. Compared with the synthesized 1T-WS2, the BP material forms a much flatter and wider sheet, so most of the smaller 1T-WS2 sheets are distributed on the BP sheet.

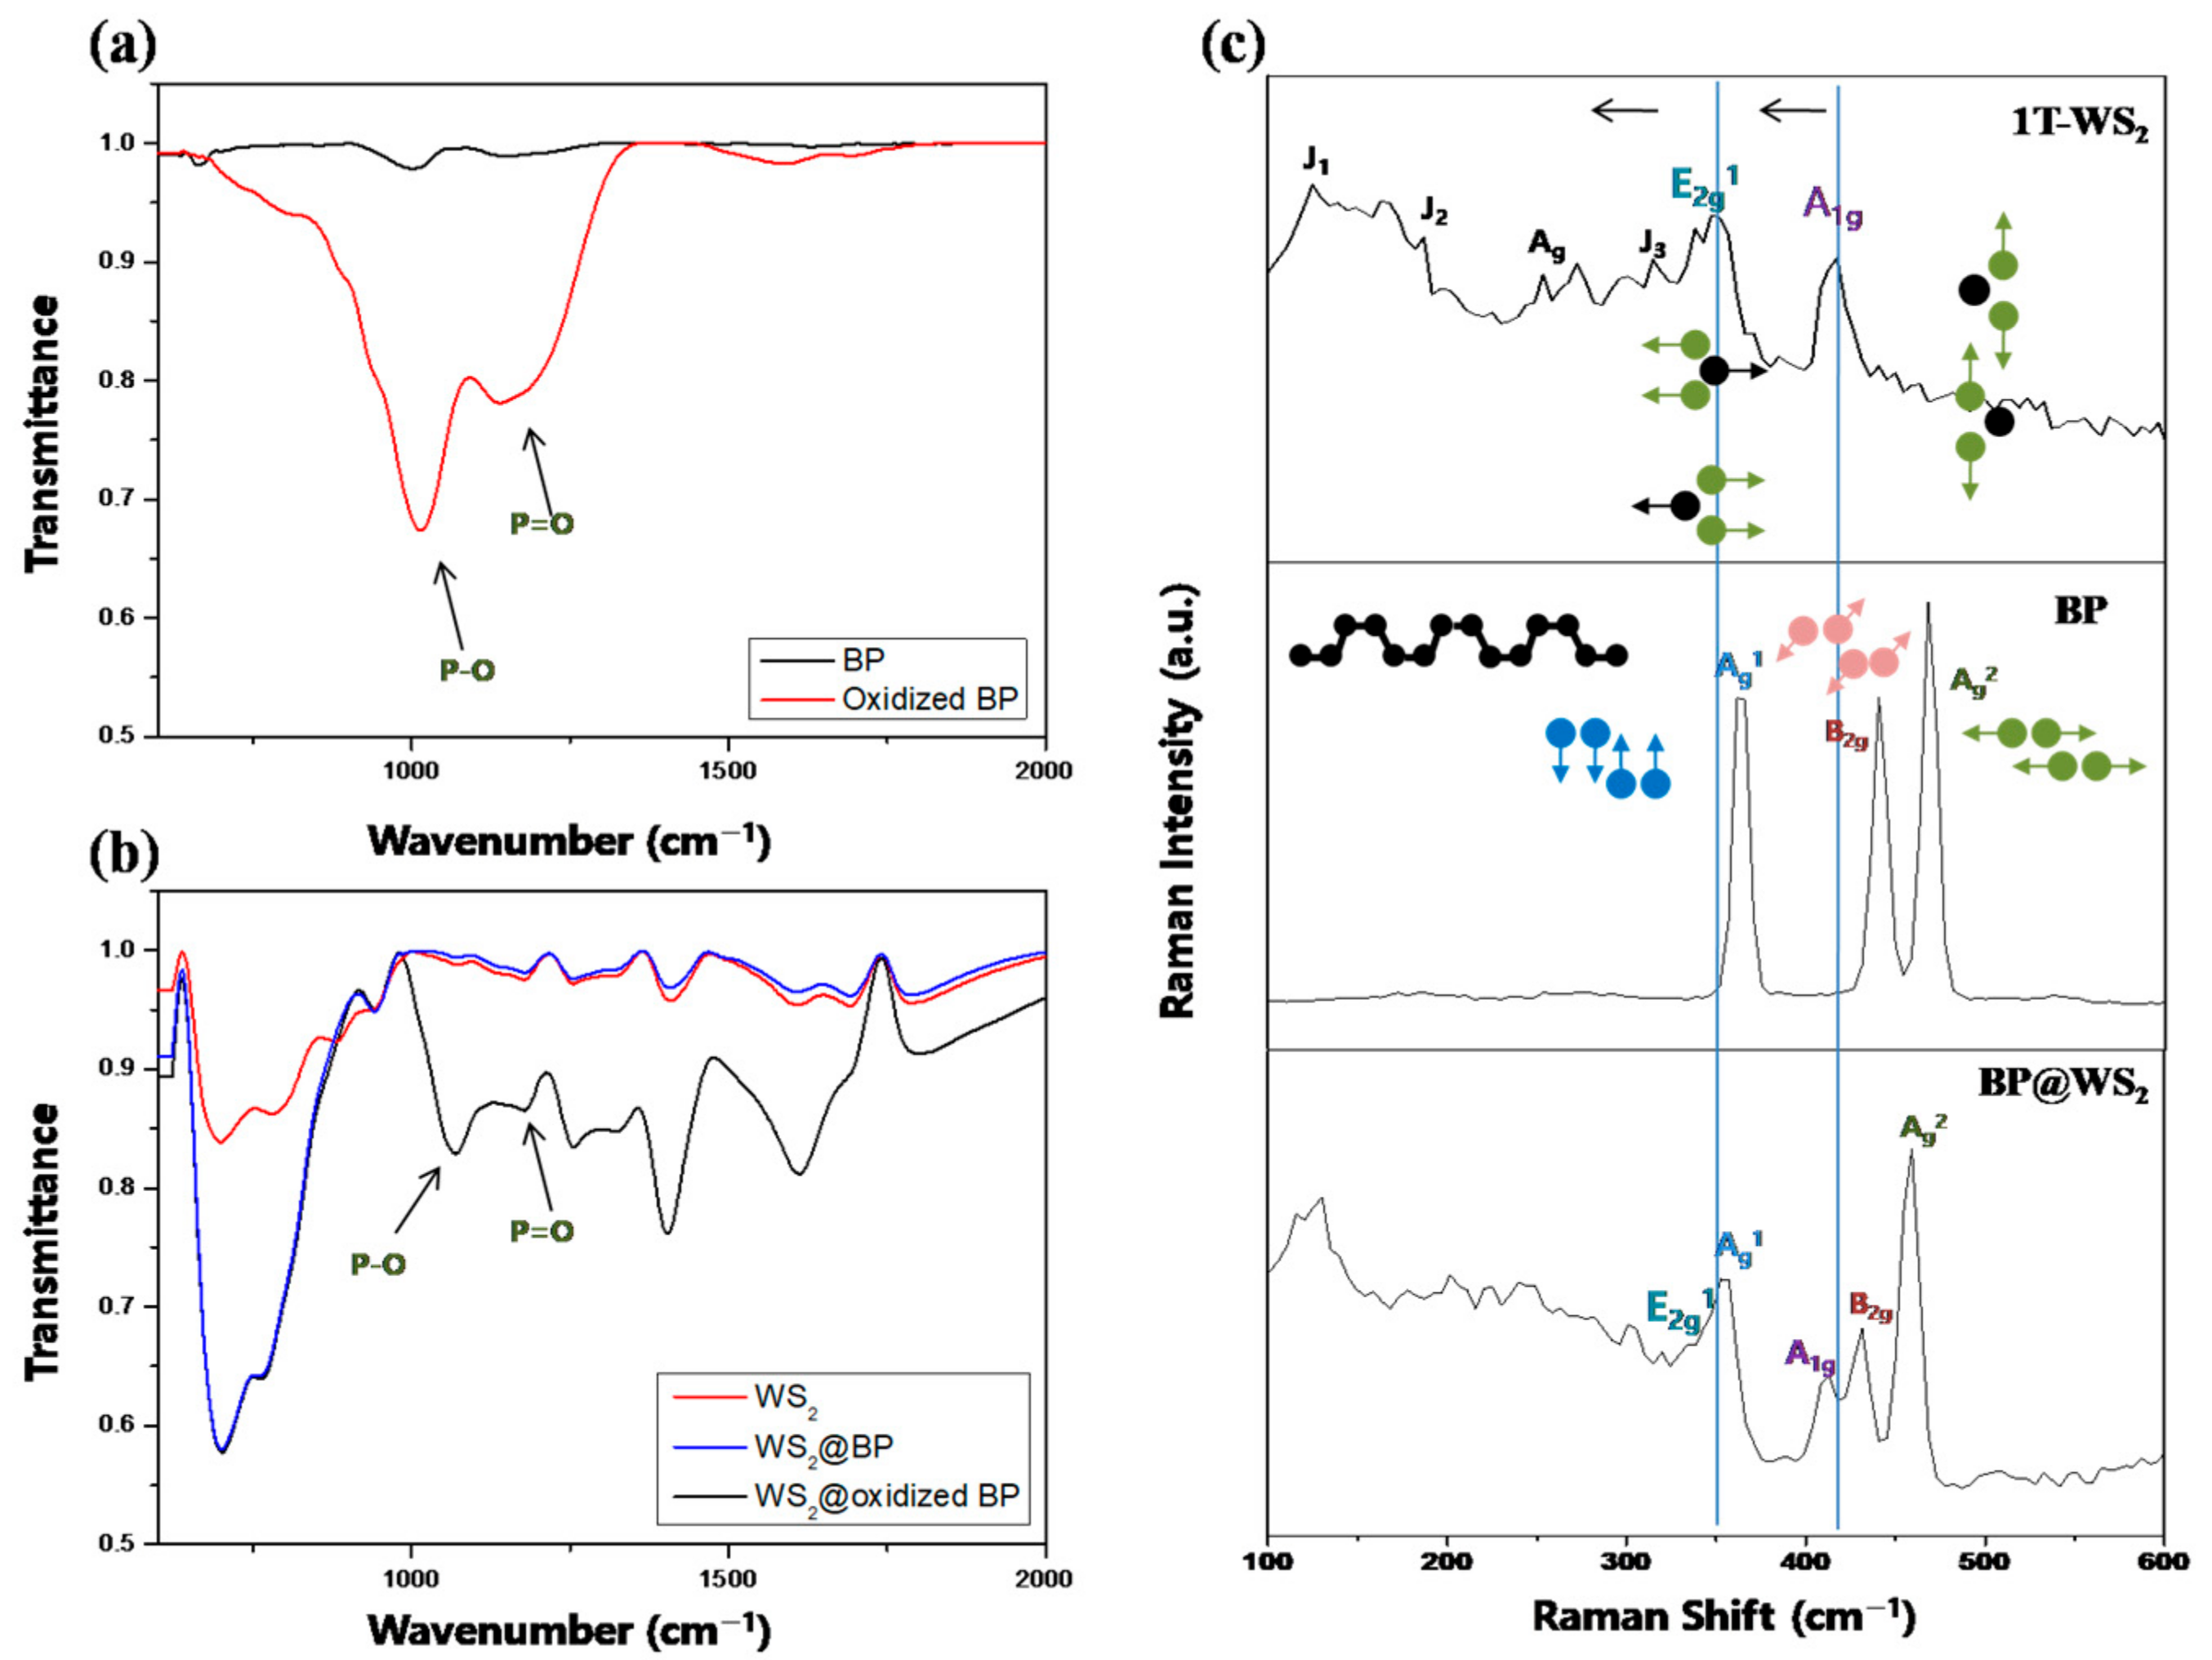
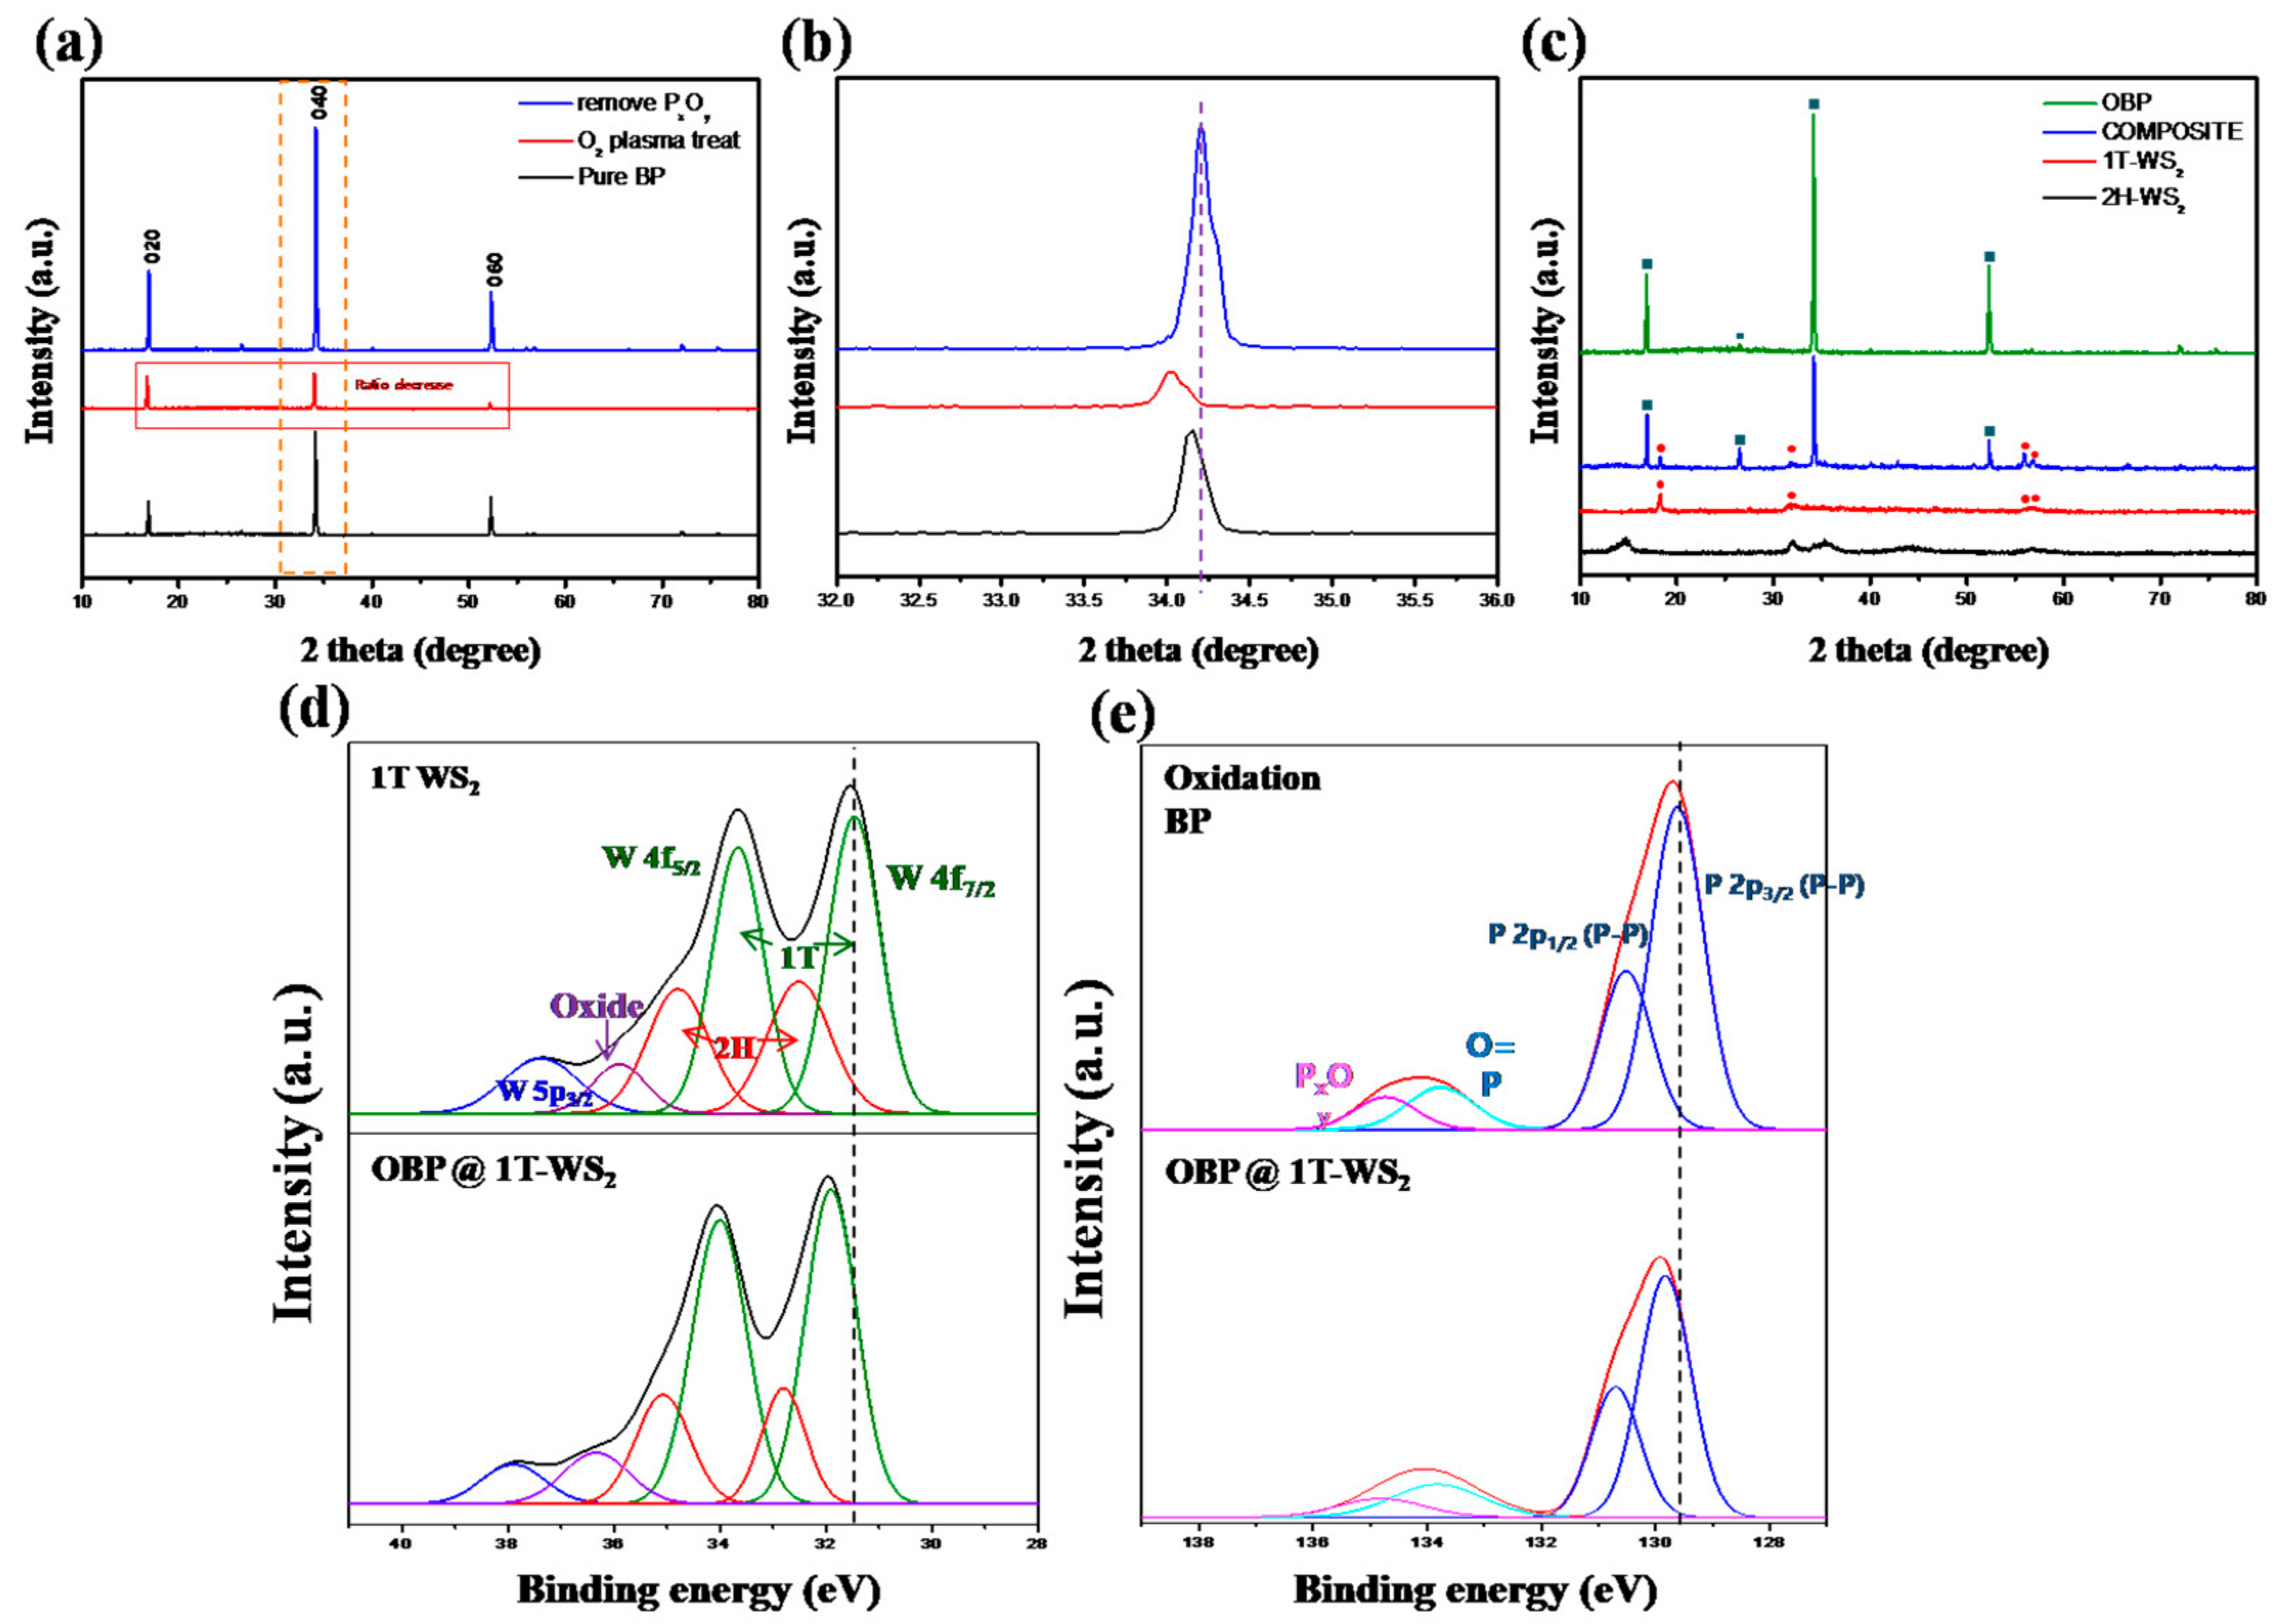
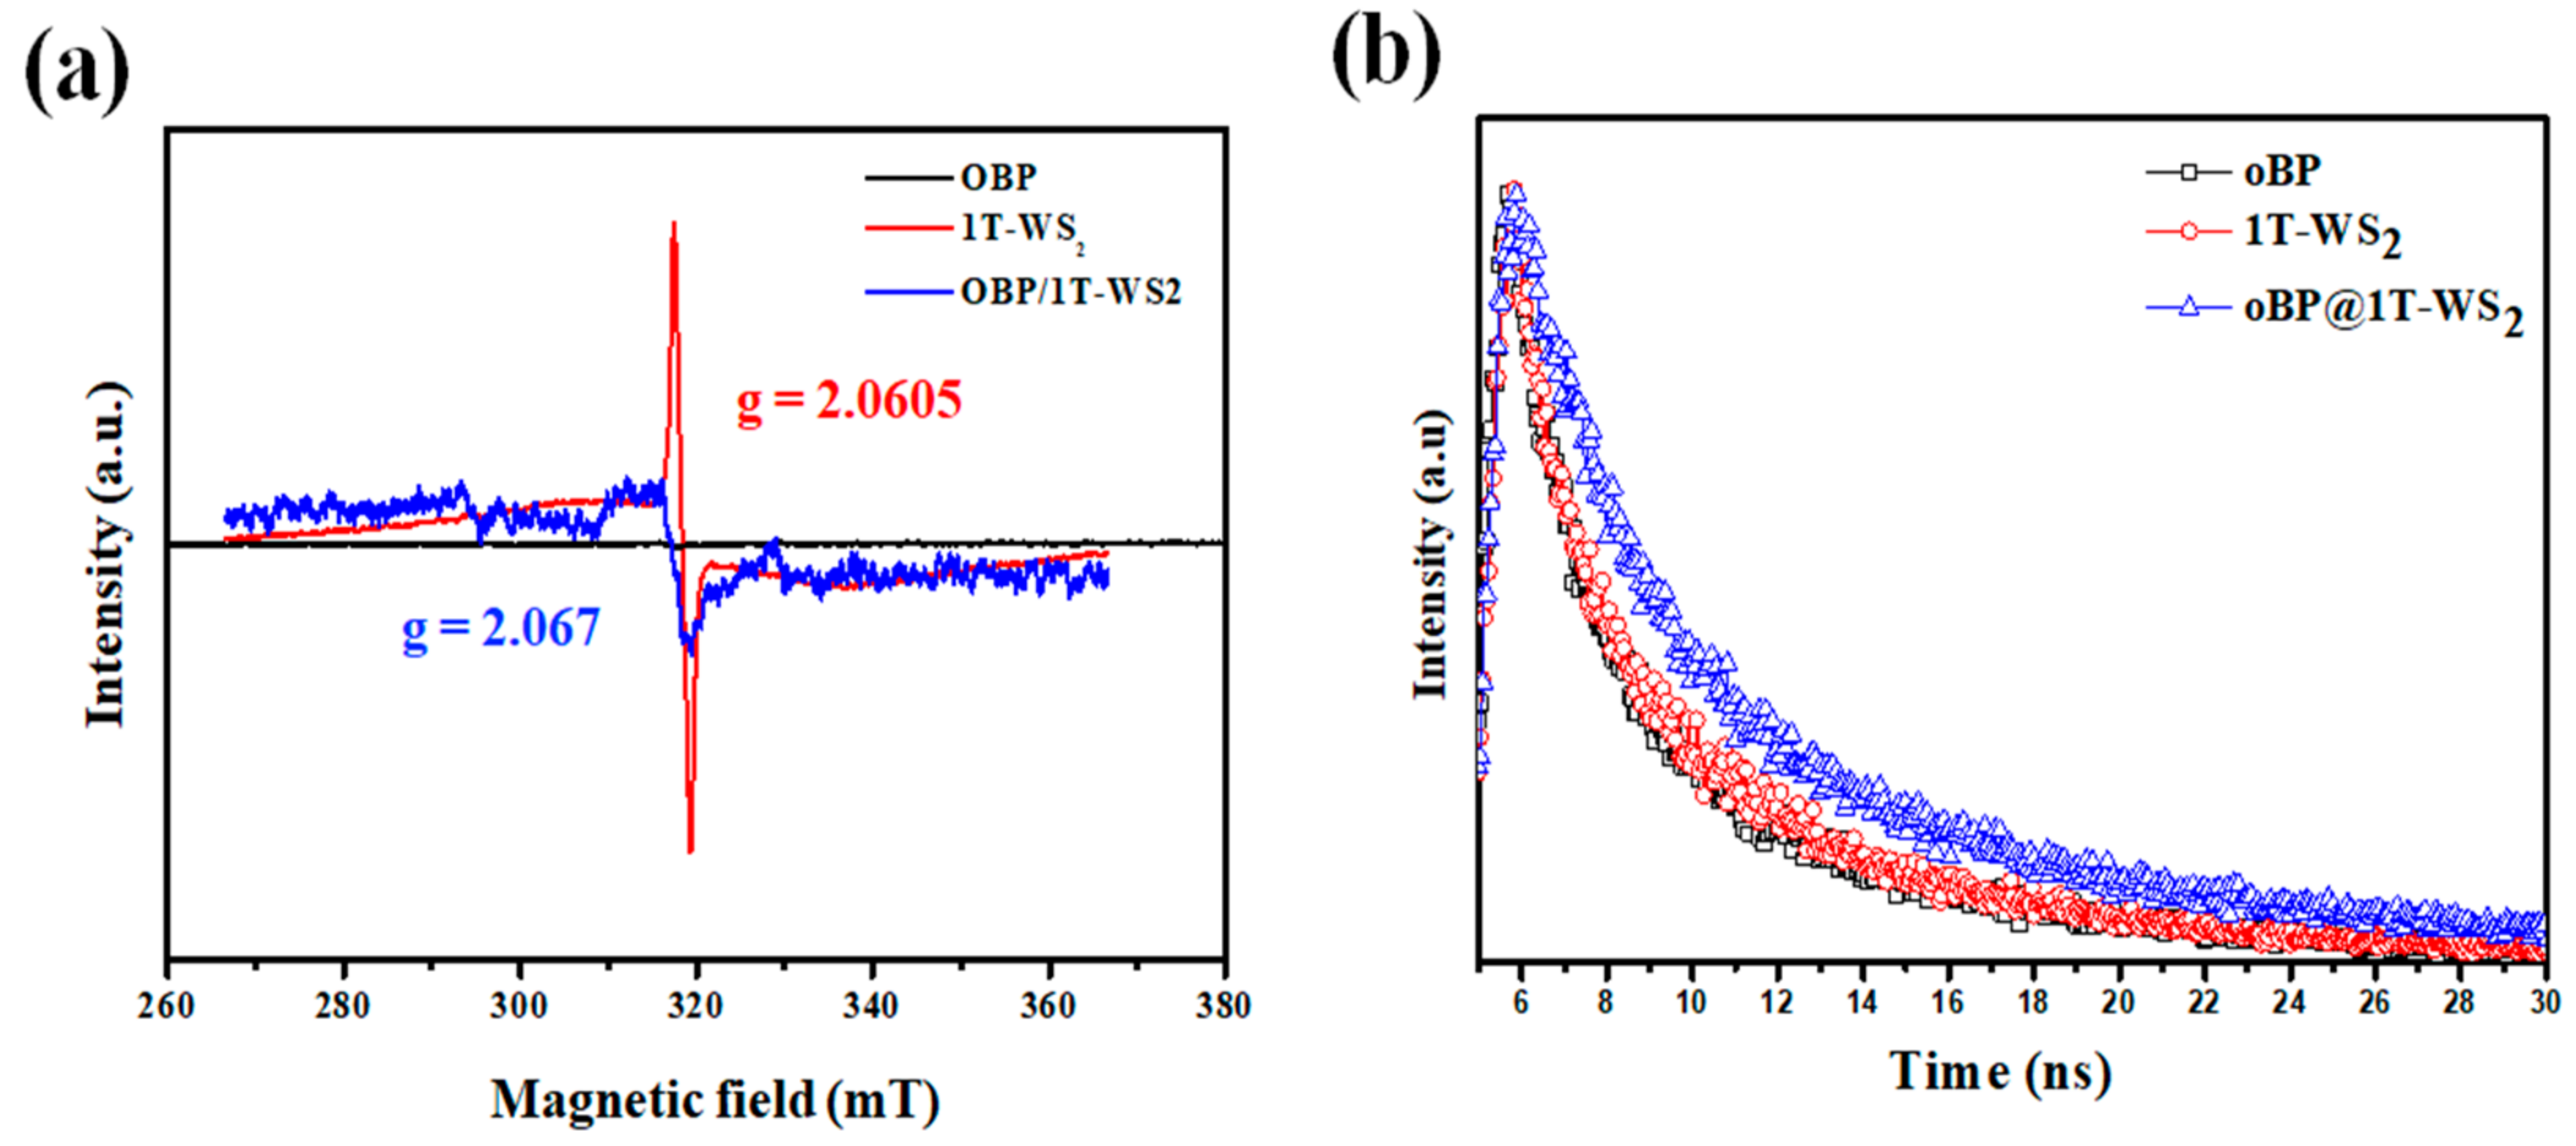
2.2. Material Characterization

In the FT-IR spectrum, it can intuitively observe the BP oxidation state. In Figure 4a, the FT-IR peaks are assigned to P–O bonds at 1027, 1132, and 1639 cm−1 and assigned to the symmetric stretching mode of P=O bonds [54,55]. In pure BP, the observed peak was very weak. Also, it shows that even after the composite of WS2 and BP, these bonds were the same (Figure 4b). No peaks due to P–O and P=O were found in the composite with pure BP. This result shows that OBP was successfully composited on 1T-WS2.
Figure 4c shows the Raman spectra of the 1T-WS2, OBP, and OBP/1T-WS2 nanocomposites. For BP, the peaks located at 363, 440, and 467 cm−1 were assigned to the out-of-plane phonon mode Ag1, planar phonon mode B2g, and planar phonon mode Ag2, respectively [56]. For the 1T-WS2 nanosheet, two notable peaks are observed at 352 and 418 cm−1, which are assigned to the E2g and A1g modes, respectively [57]. Also characteristically, the peaks located at 131, 188, 261, and 325cm−1 in the low-frequency region correspond to the J1, J2, Ag, and J3 peaks, respectively [57]. On the other hand, in the case of 2H-WS2, peaks such as J1, J2, and J3 do not appear, and the two main modes E2g and A1g also show a blue shift. The out-of-plane A1g mode of 1T-WS2 is caused by the opposite oscillations of the two S atoms to the W atom. The E2g mode is related to the in-plane oscillations of W and S atoms in opposite directions. For 1T-WS2, the J1 mode occurs at 131 cm−1, which is the out-of-plane motion of each stripe of the W atom inside the zigzag chain and the in-plane shear oscillation of one stripe of atoms relative to the other atoms in the chain. J2 is the movement of two zigzag chains relative to each other, and the J3 mode (325 cm−1) tends to break each zigzag chain in two stripes with some off-plane components [58]. This is one of the factors proving that the synthesized material is 1T-WS2 and not 2H-WS2. As a result, in the case of the OBP/1T-WS2 composite, the E2g and A1g peaks and all peaks show a red shift compared with the existing 1T-WS2, and the Ag1, B2g, and Ag2 peaks also show a red shift compared with a single OBP. It shows that electronic interaction is possible [59].
XRD patterns were used to identify the difference between BP and OBP of WS2 nanostructure and composite material with 1T-WS2 (Figure 5a–c). First, the XRD patterns of pure BP have peaks at 2θ = 17°, 34.3°, and 52.5° due to the (0 2 0), (0 4 0), and (0 6 0) planes (JCPDS 21-1272) [60]. After oxygen plasma treatment, the flake data showed that the intensity ratios of the three peaks became similar, and the overall peak intensity was greatly reduced. This is due to the distribution of amorphous PxOy material on the surface. In addition, the peak tended to shift more depending on the degree of oxidation (Figure 5b). The data (blue) measured after removing PxOy in the washing process show that the ratio between peaks is similar to that of pure BP, but the overall peak is shifted. The XRD pattern of the synthesized 1T-WS2 sample is shown in Figure 5c. The XRD peaks in the 15–19° and 56–59° regions of 1T and 2H can be used to identify 1T-WS2 or 2H-WS2 [61]. In addition, 2H-WS2 peaks around 15°, and 1T-WS2 appears around 18.3° [62]. The crystallinity of the composite material was observed with the peaks of both materials shifted by a 0.2° high angle. Shifting is due to the interaction between the two composite materials. However, it is an energy level that is difficult to observe clearly on the XRD.
The core-level peaks of W4f7/2 and W4f5/2 in the XPS spectrum are an intuitive and efficient way to differentiate between 1T and 2H phases [63]. As shown in Figure 5d, the double peaks located at 31.8 and 33.8 eV are due to the W4f7/2 and W4f5/2 core levels of 1T-WS2, respectively. On the other hand, at 32.7eV (W4f7/2) and 34.7eV (W4f5/2), the two strong peaks are characteristic of W for 2H-WS2, and it can be confirmed that the 1T phase is dominant [64]. In addition, peaks can be observed at 36.2 eV corresponding to W5p3/2 and W4f7/2 for both WS2 samples, which can appear in the amorphous WOx− on the surface [63]. In the case of the composite with OBP, the overall binding energy shifted to high energy, which is due to the change in electron density through the nanocomposite, proving that they are bound together. For OBP, peaks at 129.6, 130.5, and 134.8 eV were detected, corresponding to P 2p3/2, P 2p1/2, and phosphorus oxide (PxOy), respectively [65]. P=O bonding appears at 133.8 eV [66]. In this case for OBP/1T-WS2, these characteristic peaks have shifted to higher binding energies (129.9 and 130.8, respectively). The PxOy and P=O bonding did not show any peak shift, but were still present. This is because WS2 bonding only affected the P–P bonding, not the P=O bonding side of the surface. Generally, binding energy transfer in composites means a strong interaction between two components. In the OBP/1T-WS2 hybrid, the transfer of binding energy to BP and WS2 is due to the change in the electron density, which means that the two materials are bonding and interacting [67].
The UV-Vis absorption spectrum (Supplementary Materials Figure S1a) appeared similar to previously reported results. The characteristic peaks of the 1T phase for WS2 at ~450, 525, and 625 nm for the 2H-WS2 represent the 2H phase but were not found here [68]. Pure BP nanoflakes are known to exhibit very broad absorption from UV to NIR and are indicated by black lines [69]. In contrast, 1T-WS2 nanoflakes have a main absorption spectrum in the visible region. When 1T-WS2 is hybridized with OBP, the spectral shape looks similar to that of the sum of BP and WS2, but the spectral shape looks similar to that of 1T-WS2. This is because 1T-WS2 dominates light absorption in the visible area more than BP. The characteristics of the 2H-WS2 and 1T-WS2 phases are very different. The 2H-WS2 single layer is a semiconductor with a direct bandgap of approximately 2 eV. In contrast, it has been reported that 1T-WS2 has properties close to those of metals [70]. More precisely, the 1T-WS2 dispersion effectively absorbs light over the entire spectral range, with a monotonic decrease in absorbance as the wavelength increases. In addition, using the scattered reflectance of 1T-WS2 (Figure S1b) in a simple bandgap calculation (Figure S1c–e) through Kubelka–Munk’s theory [71,72,73], it confirmed that the narrow bandgap was close to zero.
k s = F R = 1 R 2 2 R
The bulk of the general 2H-WS2 has a 1.4 indirect bandgap, and it is known to have a direct bandgap of 2.0 eV as it becomes a single layer. However, the synthesized sample has a very narrow bandgap because it is a 1T metallic WS2 [74]. It is also known that BP has a bandgap of 0.2 eV in bulk state, and the bandgap increases with thickness. It was confirmed that the BP in the bulk state had a bandgap of 0.2 eV, and in the sample measured after exfoliation, it was measured to be about 1.7 eV.

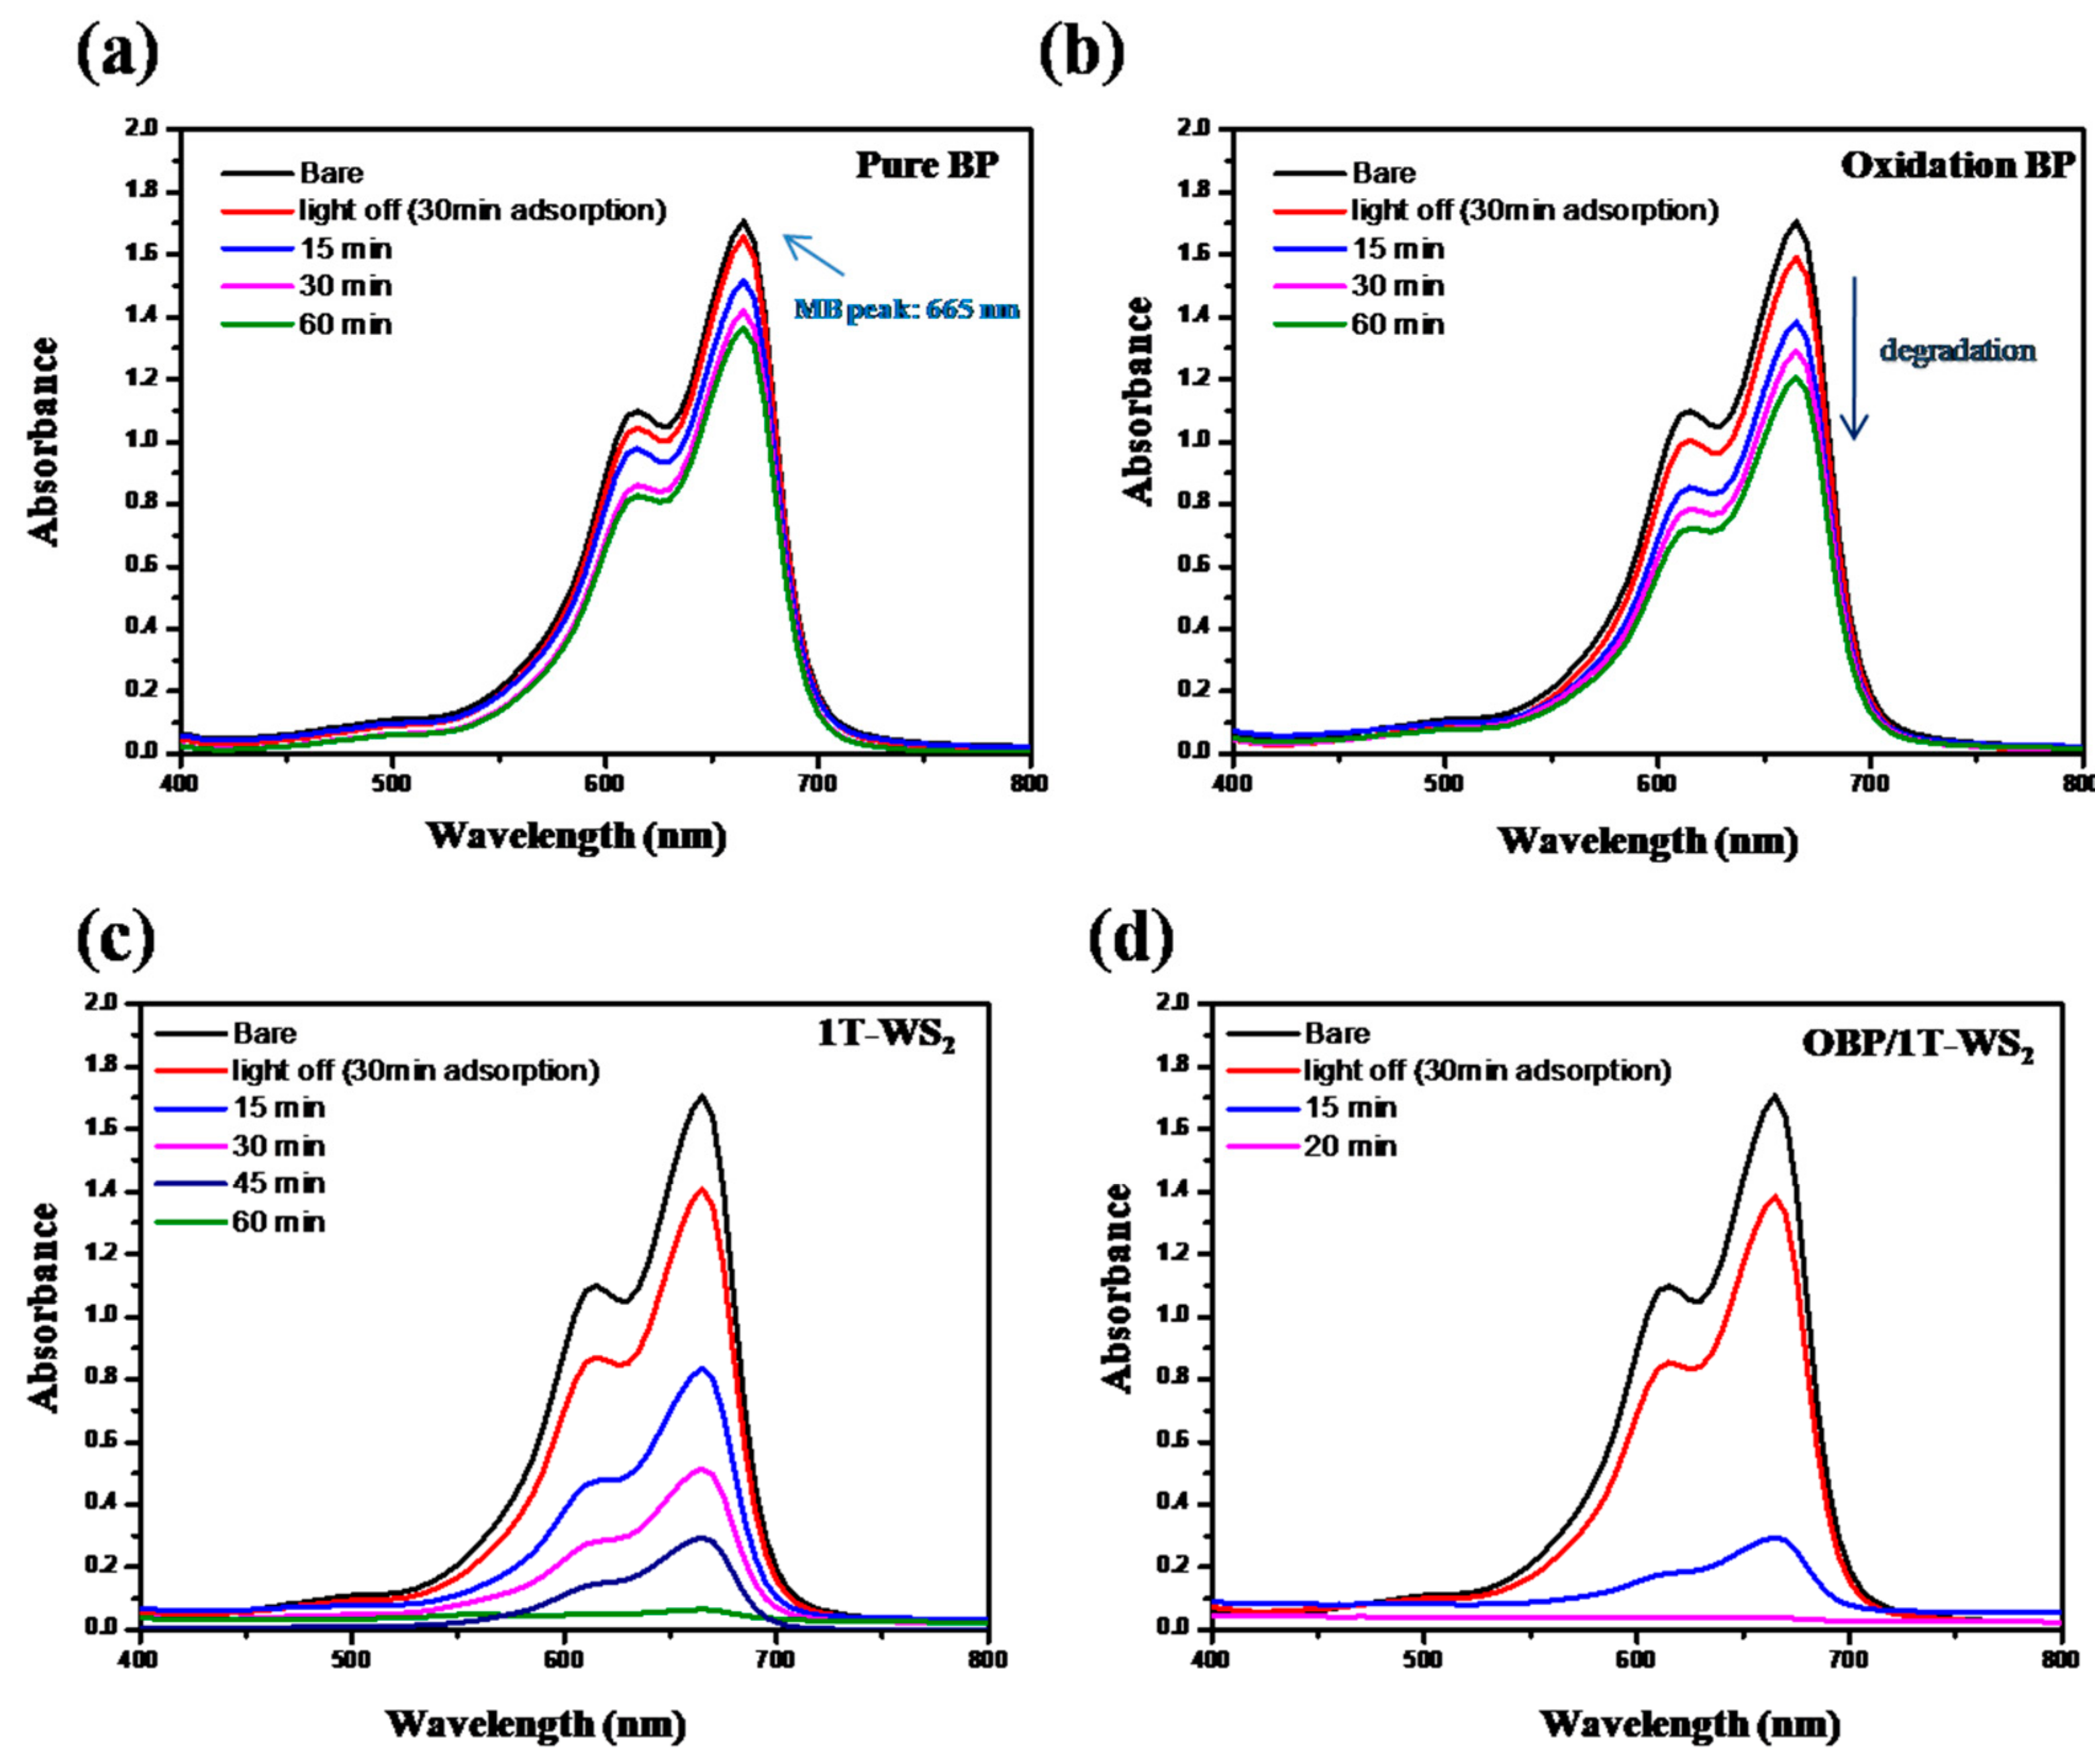
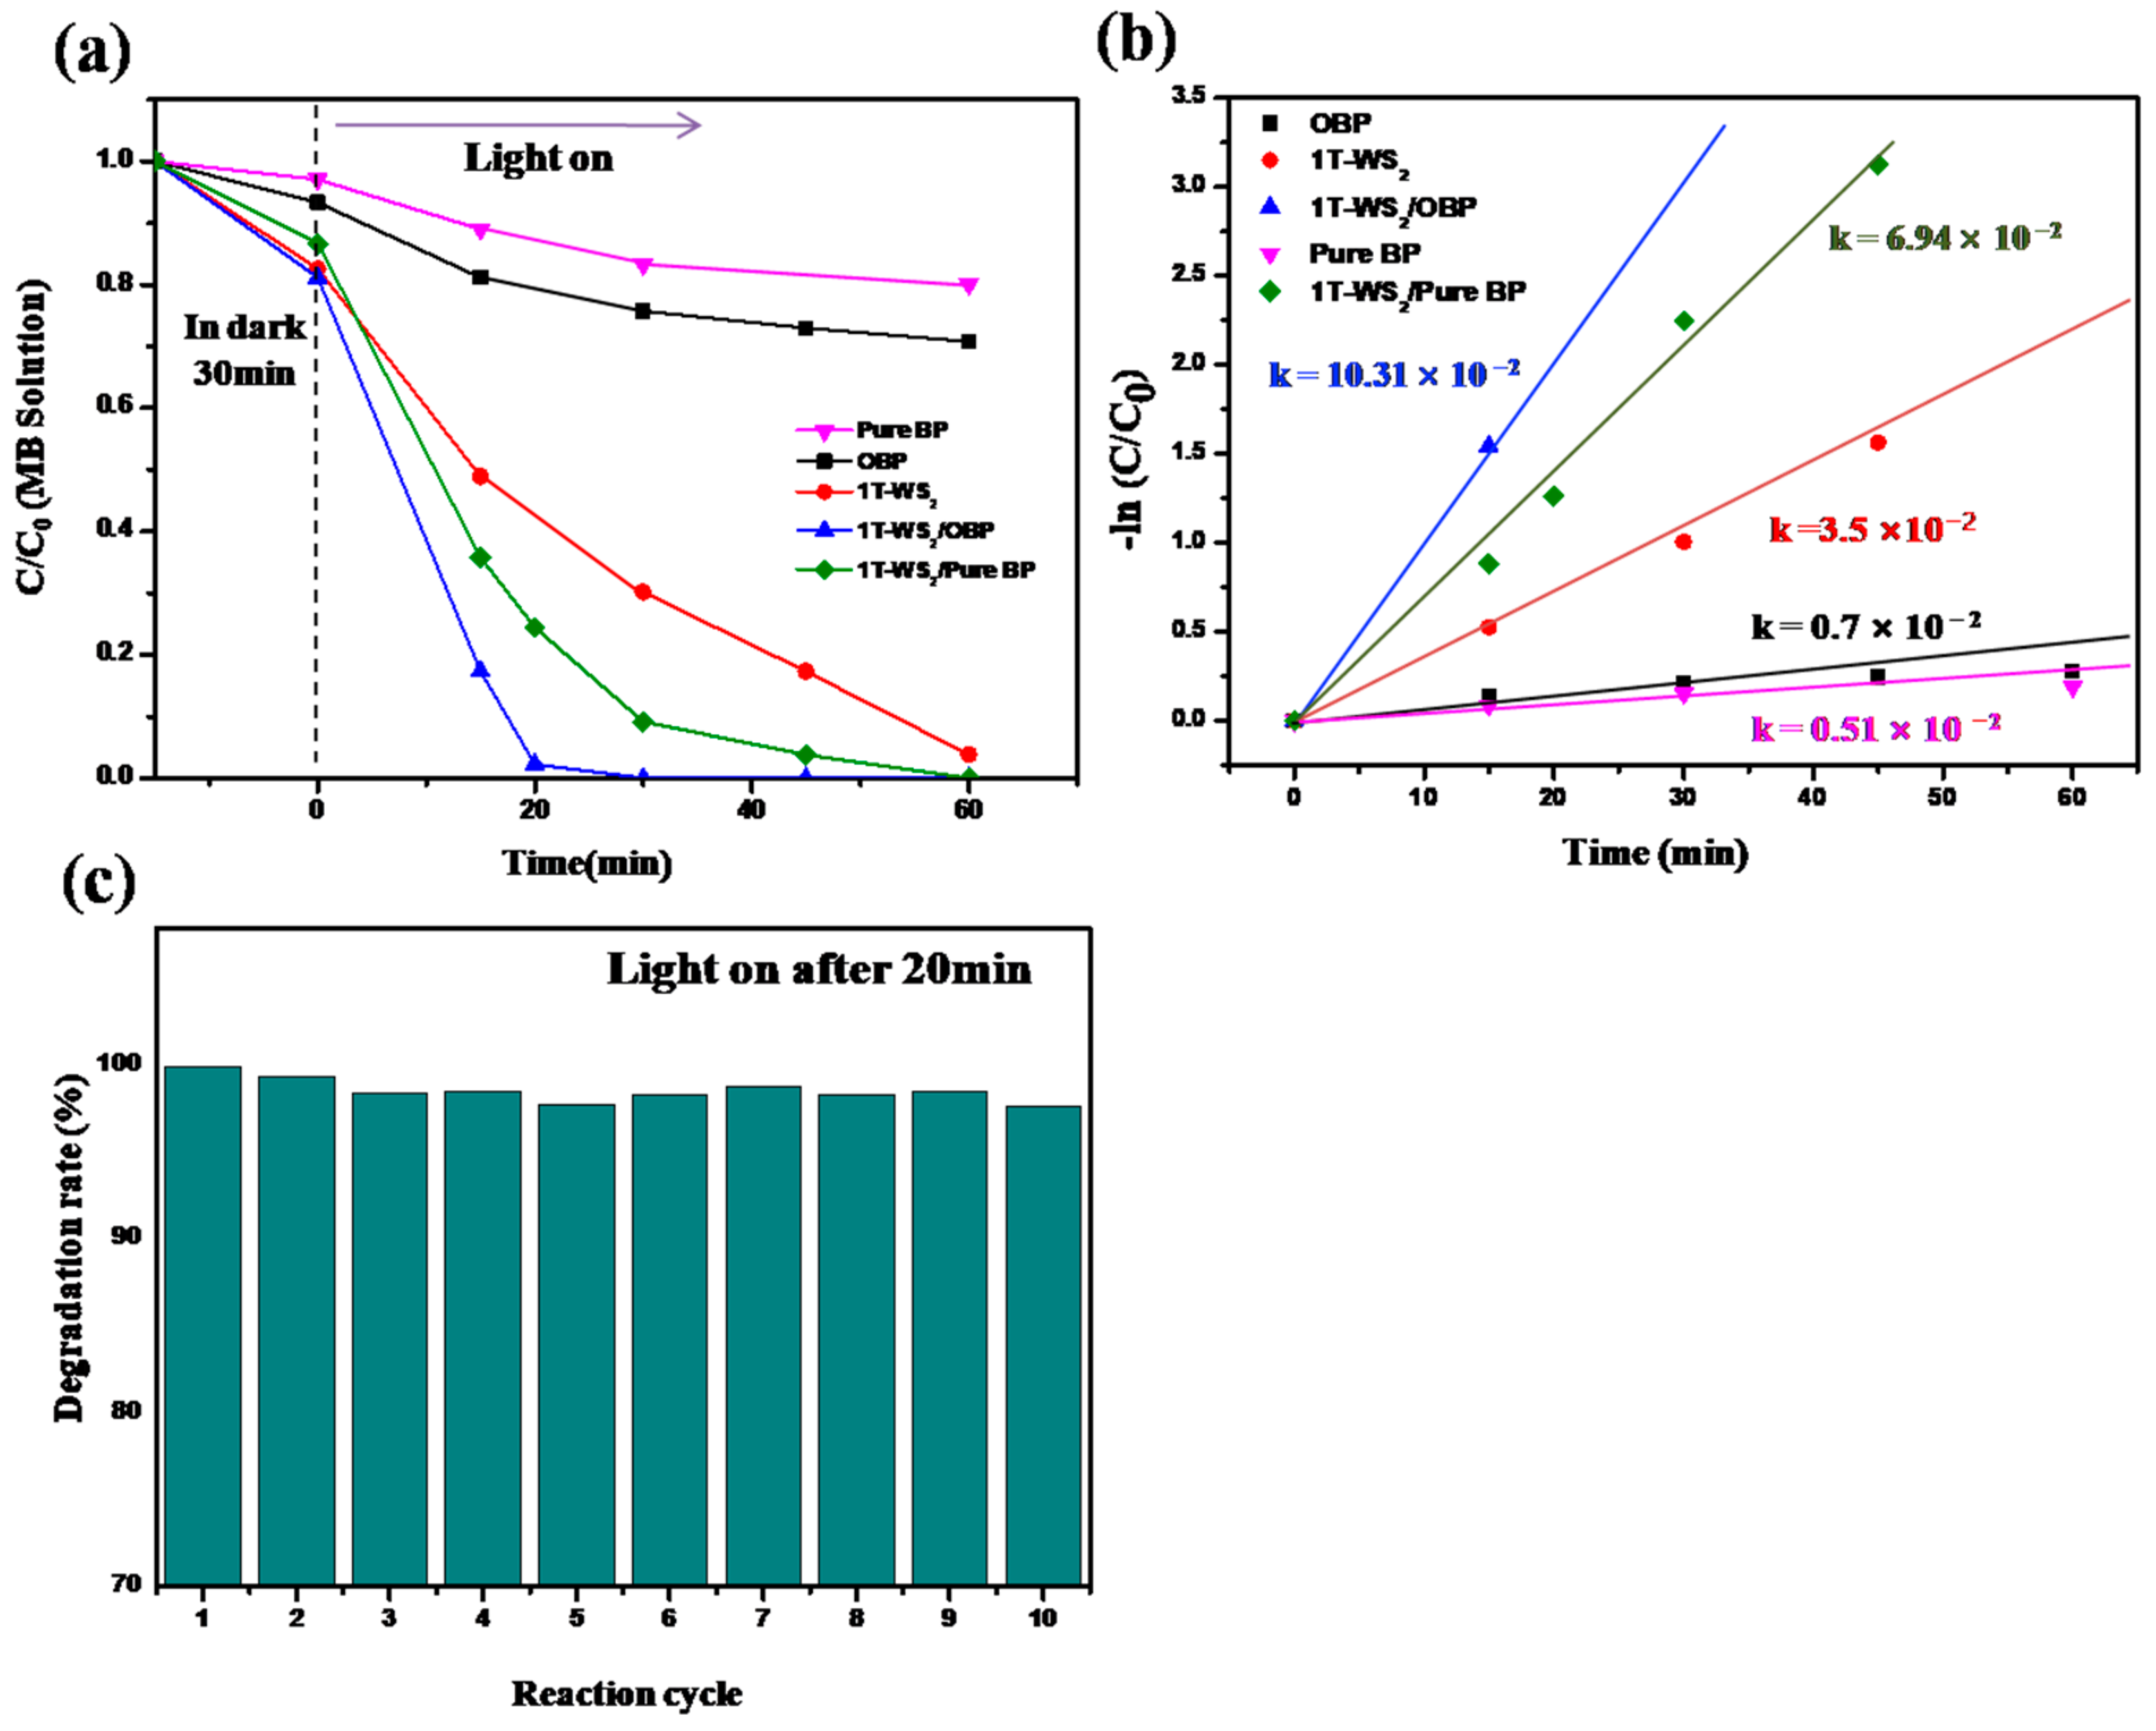
2.3. Water Pollutant Photocatalytic Degradation

The MB decomposition photocatalytic activity of the previously investigated materials was evaluated using a solar simulator light source (wavelength 400–1000 nm). The change in the UV-Vis spectrum of the MB solution with photocatalytic reaction time is shown in Figure 6. Pure BP and OBP and synthesized 1T-WS2 and OBP/1T-WS2 composite materials were measured. The concentration of MB can be quantitatively determined as an absorbance peak at 665 nm using UV-Vis spectroscopy [75]. It conducted irradiation using only light (i.e., without a photocatalytic material) and observed for 1 h to confirm the photodecomposition of MB, and as a result, little appeared (Figure S2a). In addition, it was stirred for 30 min in the dark to confirm the decrease in concentration due to the adsorption of the photocatalytic material. Usually, the initial adsorption of MB occurs relatively quickly, so the light source switch is turned on after checking the adsorption amount for 30 min. As a result, the amount of initial adsorption was negligible in pure BP, with an insignificant amount of less than 3%. OBP’s adsorption was also slightly but insignificantly increased. On the other hand, in the case of 1T-WS2, the amount of adsorption was relatively large because the specific surface area of the sample in vertical or wrinkled form even after exfoliation is high [76]. When looking at the concentration change after the start of the photocatalytic reaction, the photocatalytic efficiency of OBP increased slightly to more than that of pure BP, and 1T-WS2 showed satisfactory efficiency. However, there was an explosive increase in efficiency in the composite material. Also, the composite of pure BP and 1T-WS2 was investigated and showed better efficiency than when 1T-WS2 existed alone (Figure S2b).
To summarize, there is a graph of MB decomposition over time in Figure 7a. The amount was adsorbed in the dark until 0 min. When the BP substance was present alone, the decomposition capacity of 20% for 60 min was limited even after oxidation treatment. The 1T-WS2 material showed an efficiency of 50% reduction in about 30 min. The composite material with pure BP showed an efficiency of 90% reduction in 30 min. The efficiency of the OBP/1T-WS2 material showed an almost 100% decomposition in 20 min. This is shown in Figure 7b for kinetic data for MB degradation, and these data were arranged to follow the pseudo-first-order response, as shown in Equation (2) [77,78,79].
A t = A 0 e kt
In Equation (2), k is the kinetic rate constant (min−1), A0 is the initial MB concentration, and At is the MB concentration after a certain time (t). That is, the kinetic rate constant can be obtained from the slope of the fitting line for a specific sample value. As a result, the BP with a very low photocatalytic effect was calculated as 0.51 × 10⁻² min−1 and the OBP as 0.7 × 10⁻² min−1. The kinetic rate constant of 1T-WS2 was 3.5 × 10⁻² min−1. In comparison, the kinetic rate constant of BP/1T-WS2 nanocomposite was greatly improved to 6.94 × 10⁻² min−1, and a very high value of 10.31 × 10⁻² min−1 for OBP/1T-WS2 was calculated. These figures show much higher efficiencies than the reported types of MB decomposition photocatalysts [80,81,82] (Table S1) and are measured without additional reducing agents such as NaBH4. The most important point is excellent stability. The capacity of the catalyst is very large, and even if the photocatalytic reaction is repeated 10 times, almost 100% of the organic dye is decomposed within that time.
Figure S3a–f shows the TEM, XRD, FT-IR, and XPS data after 10-cycle photocatalytic reactions. As a result, it can see 1T-WS2 randomly placed on the BP sheet as before, and the lattice structure also exists. In the case of XRD, there was a slight decrease in intensity, but it was negligible. The same data were obtained after removing the MB adsorbed by van der Waals on the surface in FT-IR by several washings. Also, it was confirmed that there was no change in the material after the catalytic reaction, as XPS also showed no change in the peak location, except that the oxide area was slightly wider.

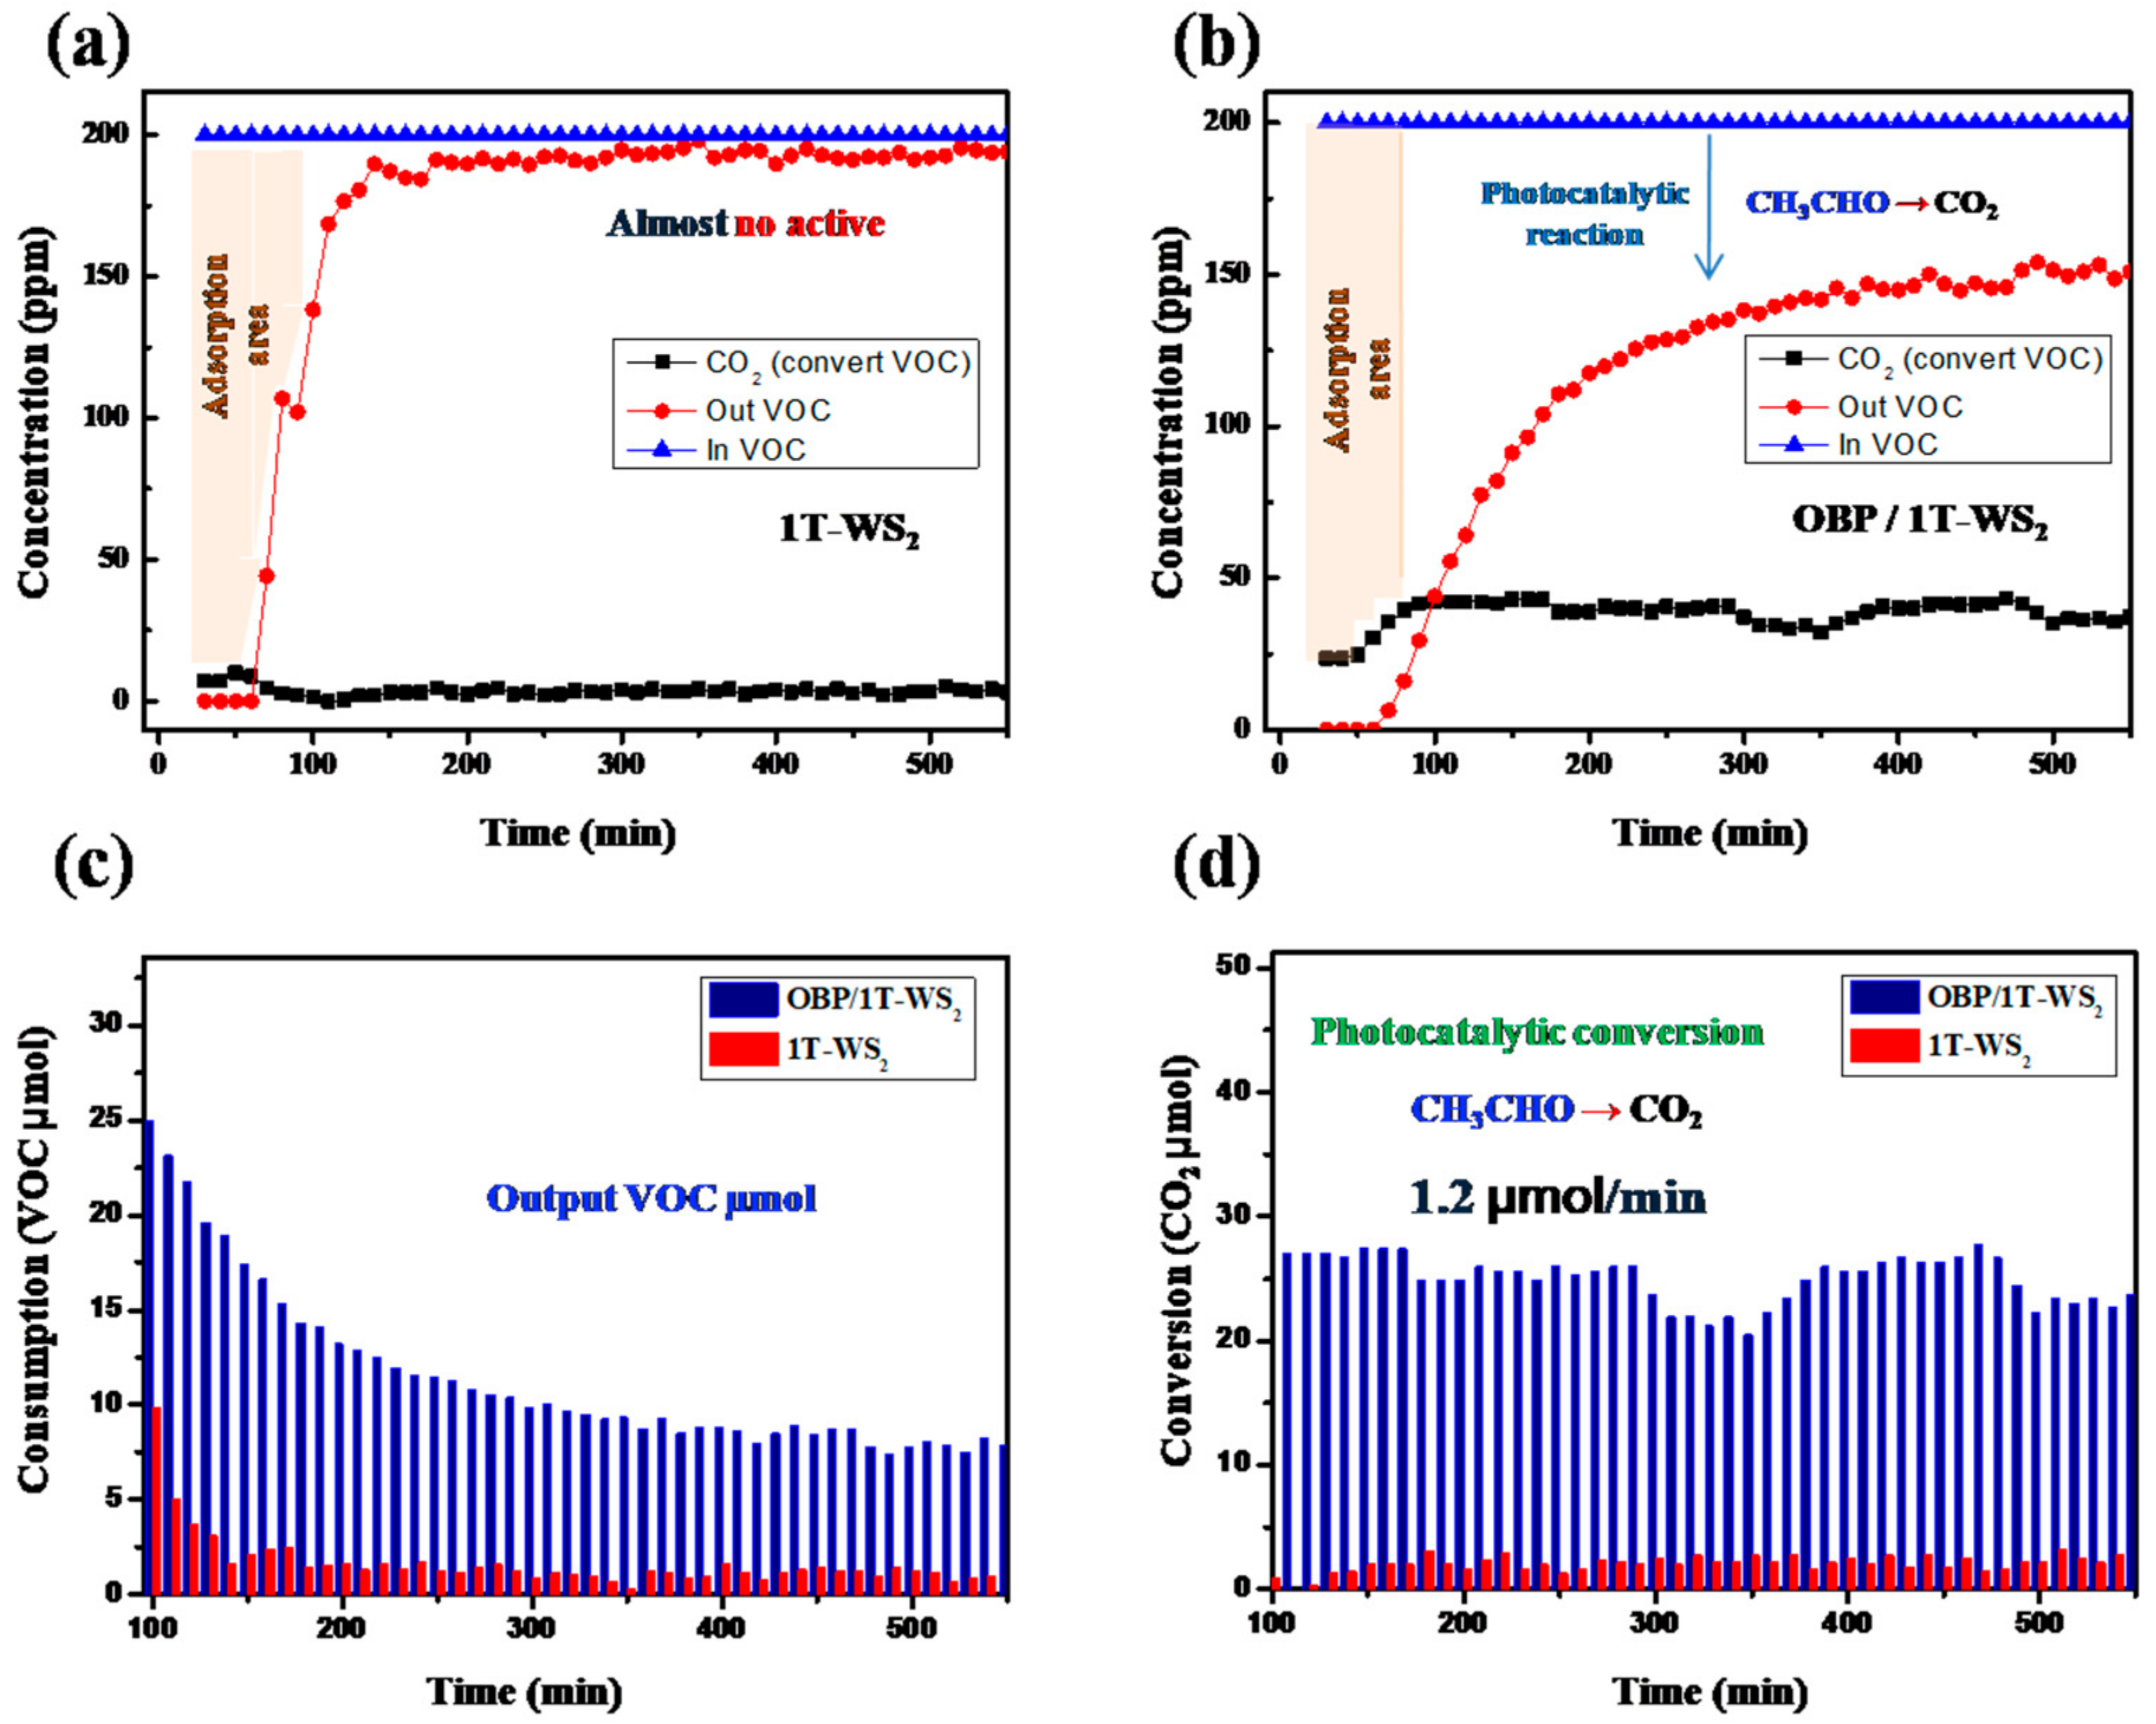
2.4. Air Pollutant Photocatalytic Degradation

The photocatalytic decomposition experiment of VOC, an air pollutant, was carried out with three substances. Experiments with BP, 1T-WS2 and OBP/1T-WS2 nanocomposites were each performed under sample conditions of 20 mg. In the case of blank, 200 ppm of acetaldehyde mixed gas was continuously injected and real-time check was performed by GC every 10 min. In the case of BP, both adsorption and decomposition amounts were insignificant. Meanwhile, 1T-WS2 adsorbed to some extent until the initial 100 min, but its decomposition into CO2 was poor. In Figure 8a, you can see that the amount of CO2 produced by decomposition is very insignificant. On the other hand, in the case of the OBP/1T-WS2 nanocomposite, after initial adsorption, VOC decomposition performance compared to the amount of sample was high, and even after 10 h, it showed steady efficiency. In theory, 1 mol of CH3CHO (acetaldehyde) can react with 5/2 mol of O2 to produce 2 mol of CO2.
2CH3CHO + 5O2 → 4CO2 + 4H2O
In Figure 8a,b, adding the amount of VOC output and CO2 conversion shows that it is similar to the initial amount of VOC input. Figure 8c shows the VOC consumption measured every 10 min. VOC consumption can be thought of as surface adsorption + CO2 conversion amount. Comparing the graph showing the amount of photocatalytic decomposition and converted into CO2 in Figure 8d, it can be seen that the initial consumption of VOC is large because the amount of adsorption is large. The decomposition rate of 1T-WS2 is almost insignificant, but the decomposition rate of OBP/1T-WS2 is 1.2 µmol/min. It is considering that the sample volume is 20 mg, the calculation is quite high with an efficiency of 60 µmol/g min. This calculated value can be said to be a very breakthrough value compared to the reported efficiency of other acetaldehyde photocatalysts (Table S2) [83,84,85].

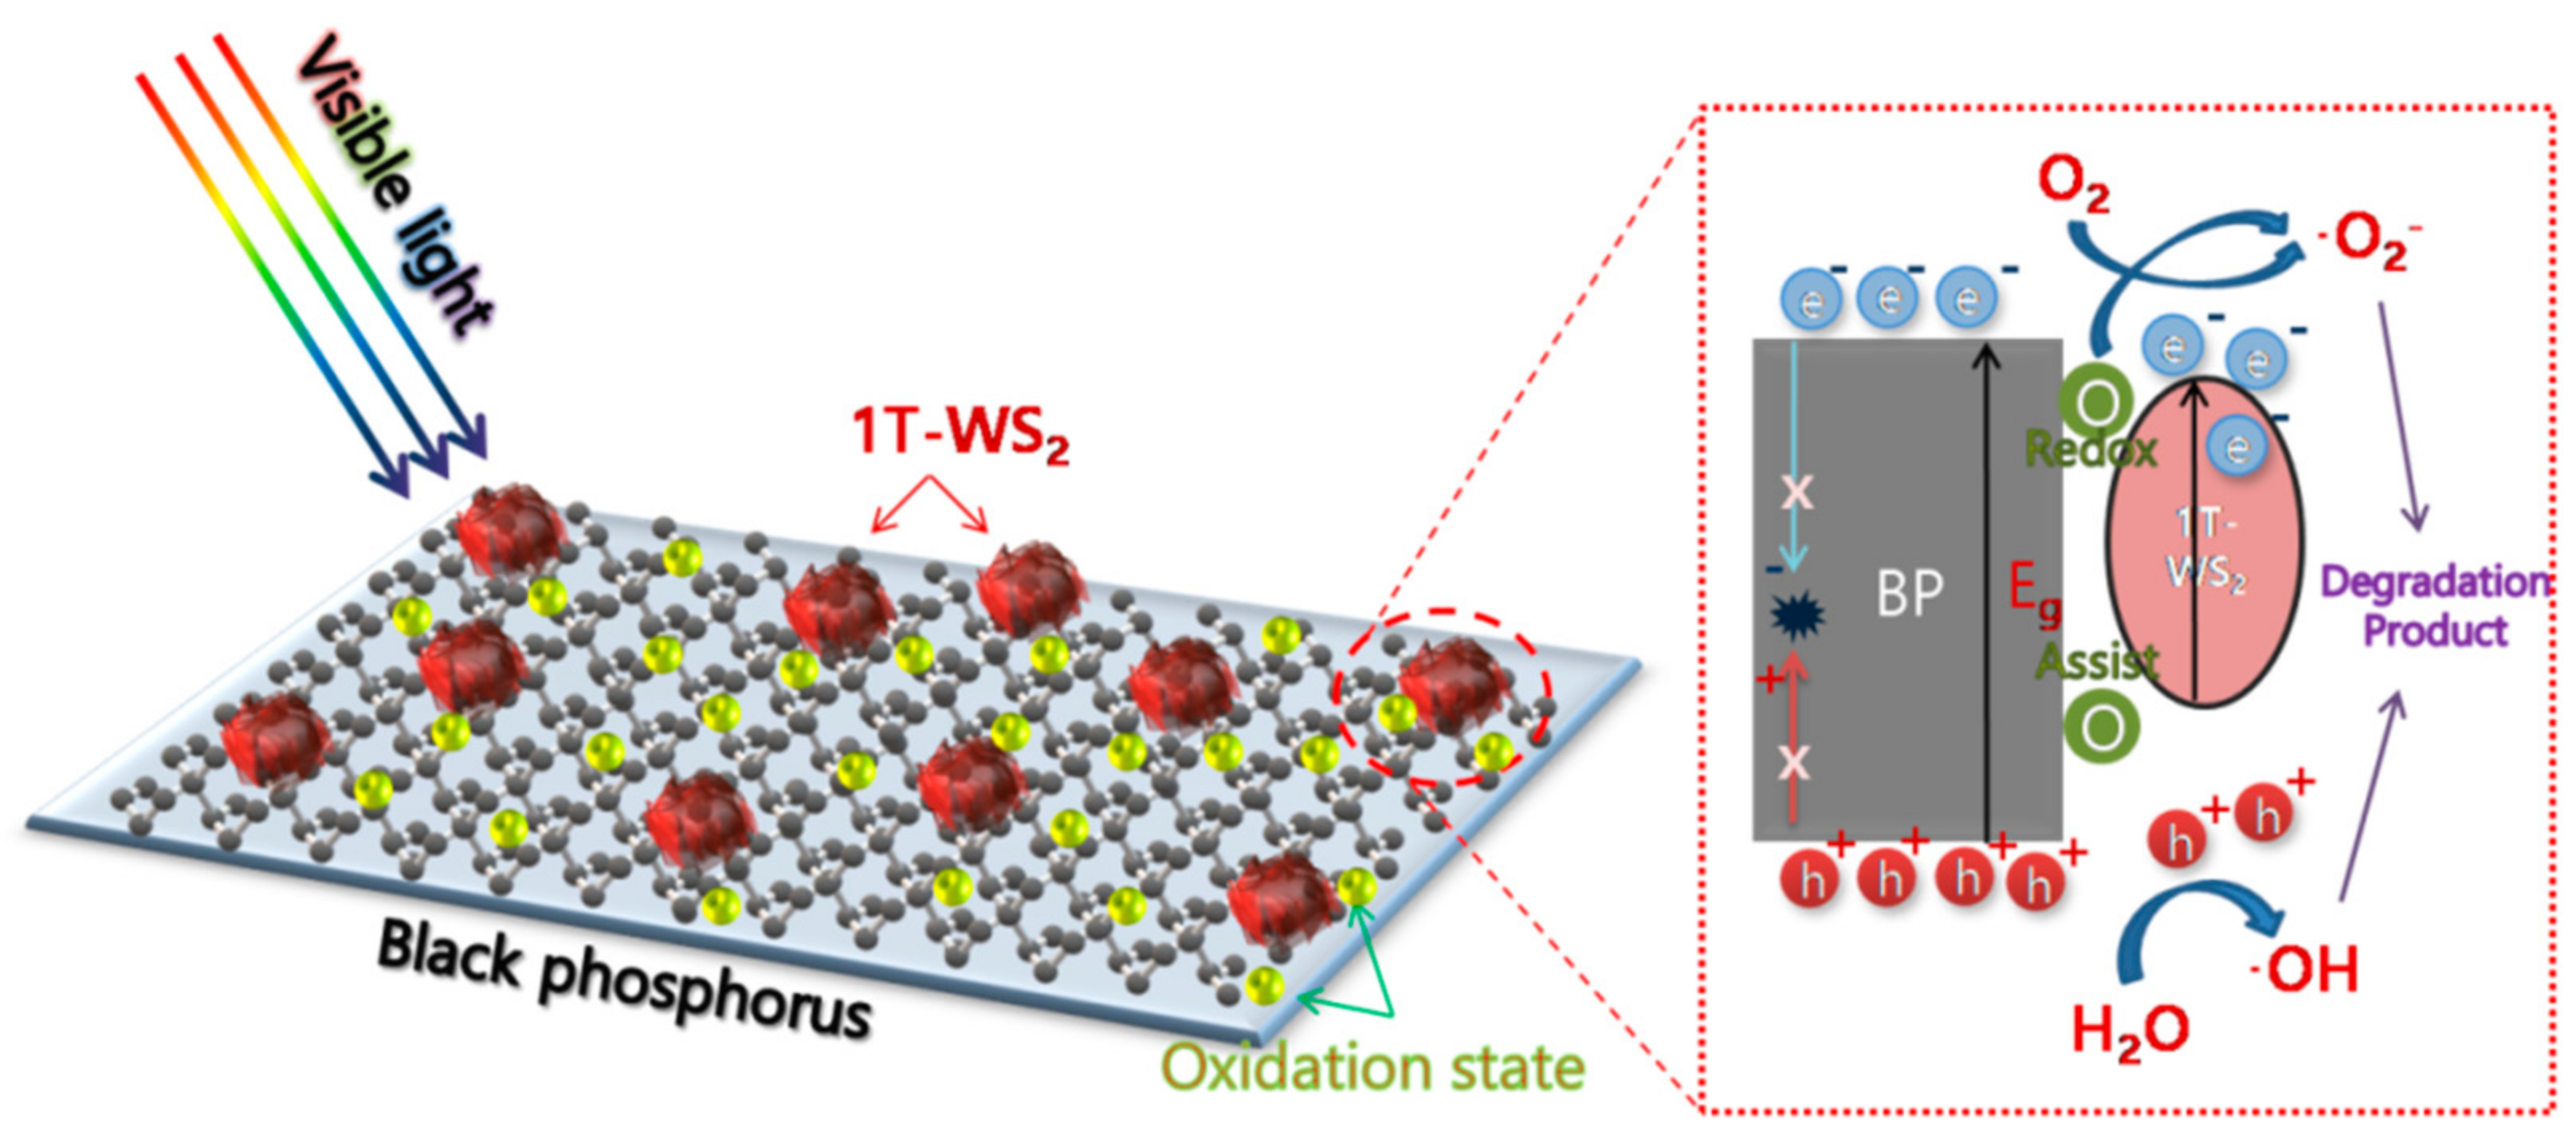
2.5. Efficiency Improvement Mechanism

In general, a typical semiconductor-based photocatalytic process proceeds as follows. Initially, light illumination induces an electron transition from valance band to conduction band, creating an electron–hole pair [86]. Then, the photo excited electrons and holes move to the surface and cause a reduction or oxidation reaction, respectively. However, electron–hole pairs recombine in the form of heat or emitted light. Therefore, separation and transport of electrons and holes are crucial factors in this reaction. The recombination of divided electrons and holes greatly influences the photocatalytic reaction and is directly related to the catalytic performance [87,88]. BP has excellent light absorption capability, but many studies have found that it is unfavorable for photocatalytic reactions because of the very rapid recombination [67]. Zhu et al. determined that it took several femto seconds for the separated electron–hole of pure BP to recombine using time-resolved diffuse reflection spectroscopy [89]. Thus, the BP band position is similar to that of 1T-WS2, and when a material with a narrower band is composited, the bands are aligned, and the donor receptor acts as a photocatalyst. Because the conduction band of 1T-WS2 is lower than that of BP, the electrons and holes excited in BP do not recombine and are transferred to 1T-WS2 to further form dye decomposition radicals. A schematic diagram of this process is shown in Scheme 1. The stability problem of exfoliated BP is a major issue, and it expect that the oxidized P=O bonding and the binding of WS2 would help in terms of stability [90]. WS2 flakes can also provide a passivation layer effect. Many studies have already been reported on the effect of introducing passivating substances to solve the stability problem of BP [27,28,29,91]. Here, in order to clearly present the increase of the OH radicals generated on the surface, a fluorescence technique using the OH selective reaction of terephthalic acid, which has been reported before, was utilized [92,93]. An initial amount of 5 × 10⁻⁴ M terephthalic acid was dissolved in 2 × 10⁻³ M NaOH, and the fluorescence was measured by exiting at 315 nm by PL spectroscopy every 10 min. In this experiment, 10 mg of sample was added to 50 mL of terephthalic acid solution. In Figure S4a–d, as a result of measuring the generation of OH radicals with each of the samples, there was no change in the peak at 425 nm in OBP, and there was a slight increase in the case of 1T-WS2. As shown in Figure S4, as a result of measuring the generation of OH radicals with each of the samples, as expected, there was no change in the peak at 425 nm in OBP, and there was a slight increase in the case of 1T-WS2. On the other hand, in the case of OBP/1T-WS2, it was confirmed that the peak caused by 2-hydroxyterephthalic acid was very high compared to the previous two samples. This is an indicator that the photocatalytic material can produce more OH in continuous time. It showed a tendency almost similar to that of the photocatalytic process using OH radicals, and it was dramatically improved in OBP/1T-WS2. In addition, H2O molecules adsorbed in the photocatalytic activity enhance the generation of OH radicals, but can suppress the photocatalytic decomposition activity by inhibiting the adsorption of decomposition substances [94]. However, in the case of OBP/1T-WS2, which already has O on its surface, rapid radical formation is possible without adsorption. This can be particularly beneficial for gaseous VOC decomposition processes.
EPR technology was used to further investigate the photogenic carriers and trapped electrons [95]. It is a technology that can be sensitively measured to investigate the unique electronic structure of photocatalytic materials and has been used to measure superoxide and hydroxyl radicals. The EPR spectrum is a device that observes the resonance absorption of microwave power by free radicals, and has obtained information about electron Zeeman interactions. Also, information about a sample with specific physical and chemical unfair electrons is a proportional constant called g-factor in the equation and varies with structure. Figure 9 shows the EPR spectrum for each sample. As expected, no distinct peaks were found in BP, which suggests that there are no unfair electrons or free radicals present [96]. In the case of 1T-WS2, it showed a strong and sharp EPR signal around g = 2.060, demonstrating the presence of radicals. In addition, in the case of OBP/1T-WS2, the g value slightly changed to 2.067, and the intensity of the peak was weakened, but sporadic peaks indicate the presence of various unfair electrons. Also, contrary to the symmetrical 1T-WS2 signal, it has an asymmetrical linear shape, which indicates that electrons in various states are irregularly present [97]. This is expected, as electrons trapped between the interface in the junction structure of two materials or electrons are generated by structural defects due to P=O [33]. These results suggest that it is an electronically advantageous environment for photocatalytic processes that are activated by radicals on the surface. Most of the previously studied data show a certain trend. Time-resolved photoluminescence spectra were measured to investigate the efficiency of the aforementioned charge separation. The TRPL measurements were performed in the linear domain, and the curve in the graph of Figure 9b shows that the TRPL attenuation of the composite material is much slower. Looking at the graph path, it was confirmed that the decay model for all samples was the same. As shown in Figure 9b and Table 1, it can be seen that the average electron lifetime of a single material is 5 ns, whereas the composite material is 7.3 ns, which is about a 50% improvement. Therefore, the photocatalytic reaction is more likely due to this longer electron lifetime. This can be said to correspond to the experimental results and mechanism shown above. Meanwhile, we utilized the P=O site because it offers molecular level control of the oxidized P active site. It is stabilized by covalent bonds at the interface and by contact with 1T-WS2, which has high electronic conductivity and metallic properties [98]. In addition, BP, which already has the presence of O2, a material for radical formation on the surface, has favorable conditions for radical formation efficiency [99]. P=O bonding, which can exist at the interface between BP and 1T-WS2, also affects the redox level, enabling smooth band alignment, resulting in high efficiency. In addition, the presence of P=O bonding increases the probability of trapping electrons at the interface, and since this functional group has a negative charge, it becomes easy to attract cationic dyes having a positive charge into the decomposition reaction. The basic photocatalytic mechanism applies equally to VOC reduction. In particular, catalyst efficiency in a gaseous state is the primary factor that affects the efficiency of effective adsorption. The vertical and corrugated structure of 1T-WS2 has a large specific surface area, so basic adsorption is very easy, and it has advantageous conditions [100,101]. Continuous accumulation of adsorbed molecules can also lead to deactivation of the adsorbents if it cannot be decomposed in a timely manner through the photocatalytic process [102]. However, according to previous VOC reduction experiments, the adsorbed VOC can be further decomposed into CO2, H2O or other intermediates after reaching adsorption equilibrium, which keeps the removal efficiency of the VOC remaining in the photocatalytic process at a stable high level. In addition to favorable adsorption conditions, the presence of P=O functional groups on the surface serves as a very favorable condition for VOC conversion requiring active O species. Most of the common VOC reduction photocatalysts were TiO-based materials, but it is meaningful that 2D-based VOC reduction materials were developed in this study.

3. Materials and Methods

3.1. Materials

Bulk BPcrystals were purchased from ACS Material (Pasadena, CA, USA). Tungsten chloride (WCl6), thioacetamide (C2H5NS), N-methyl-2-pyrrolidone (NMP),dimethylformamide (DMF), MB, and all other chemicals were acquired from Sigma-Aldrich without further purification.

3.2. Controlling the Oxidation of BP

BP powder was treated with 5W of oxygen plasma for 5–10 min with an oxygen flow of 100 sccm under 1.5 Torr in a plasma system (COVANCE, Femto Science Inc., Hwaseong, Korea).If BP’s oxidation treatmentis strong, the surface is etched, so the low wattage was fixed and adjusted only by time.

3.3. Preparation of 1T-WS2Nanosheet

1T-WS2 nanosheets were synthesized usingthe hydrothermal method. WCl6 (0.1 M) and thioacetmide (0.2 M) were added to 38 mL ofpurified water and stirred under vacuum for 1 h. The solution was put in a 50 mL Teflon autoclave and reacted at 210 °C for 8 h. The nanosheetswere then naturally cooled, washed with ethanol threetimes, centrifuged, and dried.

3.4. Synthesis of Oxidation Controlled BP/WS2Nanocomposites

The 20-mg 1:1 ratio BP/WS2 powder obtained after exfoliationwas added to a 50-mL NMP solution and sonicated for 36 h. Finally, the sample was obtained through high-speed centrifugation, washed thoroughly using ethanol, and redispersed in 10 mL of ethanol to obtain an oxidation-controlled BP (OBP)/1T-WS2 nanocomposite.The overall experimental process is shown in Scheme S1.

3.5. Photocatalytic MB Degradation

The MB solution concentration in the experiments performed was 20 mg L−1. The catalyst (1 mg) was added to 20 mL of the MB solution. First, the MB solution was subjected to light for an hour to confirm the light decomposition and absorbance of the solution. After the addition of a photocatalyst, the mixture was stirred in the dark for 30 min. The adsorption amount was measured through absorbance. Later, light irradiation was started, and samples were taken every 5 min and centrifuged. The separated solution was transferred to a cuvette to measure absorbance. The light source used was a solar simulator (Model-DXP300, DY-tech Co., Copthorne, UK) (output wavelength: 350–1000 nm) with a UV cut-off filter. All supernatantsweremeasured using anultraviolet-visible (UV-Vis) spectrophotometer. The recycling test of the catalyst was repeated after the MB was completely decomposed. The process for this is shown in Schemes S2 and S3.

3.6. Photocatalytic VOC (Acetaldehyde) Degradation

VOC photocatalytic activity tests (Scheme S4) were measured using a quartz tube furnace equipped with gas chromatography (GC, GC, Hewlett Packard, Palo Alto, CA, USA, HP 6890). A temperature control in quartz tube furnace and was conducted at room temperature has been precisely control the flow rate of the gas flowing into Massflow controller (MFC, Toronto, ON, Canada). During the experiment, humidity and impurities in the quartz tube were controlled respectively. An additional gas path through which the dry air passes through the water bottle is installed to control the humidity of the gas mixture entering the reactor, and 20 mg of each catalyst uniformly dispersed in quartz wool prior to the acetaldehyde (CH3CHO) decomposition experiment is added to dry air (30 mL/min) under 20W white LED light source was monitored to remove impurities for 24 h under a constant flow. After that, a mixed N2gas containing 200 ppm of Acetaldehyde was injected into the reactor. The amount of CO2 and VOC in the gas mixture passing through the reactor was measured every 10 min via a GC connected to the reactor outlet. The catalytic activity was evaluated in terms of VOC consumption (ppm) and CO2 converted emissions (ppm). In theory, 1 mol of CH3CHO (acetaldehyde) can react with 5/2 mol of O2 to produce 2 mol of CO2.

3.7. Characterization

BPand WS2 are characterized usingfield-emission scanning electron microscopy (Model JSM-7100 F), which evaluates their surface morphologies. OBP, 1T-WS2, and OBP/1T-WS2 nanocomposite lattice structures and exfoliation status were observed usingCs-corrected transmission electron microscopy (Cs-corrected TEM, Model JEOL-JEM ARM 200F, Tokyo, Japan) at an accelerating voltage of 80–200 kV. This unit is equipped with EM, HAADF, FLC, UltraScancharge-coupled detector (CCD) camera, and EDSunits.The material crystallinity was characterized byX-ray diffraction (XRD, D/Max Ultima III, Rigaku Corporation, Akishima, Japan). Fourier transform infrared (FT-IR) spectroscopy was performed with a Bruker Optics, VERTEX 70 (Billerica, MA, USA). The spectra were recorded with a diamond-attenuated total reflection unit in a spectral range from 4000 to 300 cm−1. The surface composition and chemical state of the samples was evaluated by X-ray photo-electron spectroscopy (XPS) (Vg Scienta, Tonbridge, UK, ESCA 2000). The absorption spectrum of the material was measured using a UV-Vis absorption spectrophotometer (UV-3600 Plus UV-Vis-NIR spectrophotometer, Shimadzu Corporation, Kyoto, Japan). The MB’s catalytic decolorization was monitored using UV-Vis absorption spectroscopy (UV-3600 Plus UV-VIS-NIR Spectrophotometer, Shimadzu Corporation, Kyoto, Japan). Additionally, the MB concentrations and the catalyst capacity were both measured using UV-Vis absorption techniques. In the confocal Raman spectroscope (NTEGRA Spectra, NT-MDT Co., Zelenograd, Russia) measurements, a 532-nm wavelength laser was linearly polarized. The objective lens applied in all experiments has a 0.7 NA and 100× magnification (Mitutoyo, Japan). The Raman scattering signals were obtained through a CCD (Andor, UK) cooled to −75 °C and a spectrometer with a grating of 1800 grooves/mm, blazed at 500 nm. Electron Paramagnetic Resonance spectrometry (JEOL-JES-FA200 EPR spectrometry, Tokyo, Japan) was used to study material organic radicals. The measurement temperature was −150 °C and the measurement method was the CW-EPR method.

4. Conclusions

In this study, O2 plasma used to control the oxidation of BP and synthesized BP with P=O bonding. In addition, WS2 with dominant 1T phase was synthesized using the hydrothermal method. Two materials nanocomposite were synthesized was performed by the sonication method. This nanocomposite catalyst showed excellent photocatalytic performance against high-concentration MB decomposition in a solar simulator equipped with a UV cut-off filter (wavelength 400–1000 nm). The reaction rate constant k increased to 10.31 × 10⁻² min−1, far superior to those of other reported photocatalysts. In addition, even though the photocatalytic reaction was carried out for up to 10 cycles, no decrease in efficiency or deterioration of material was observed. The improved photoactivity and stability were due to the wide absorption and recombination prevention, the fast conductivity of the two materials, and the effect of the redox functional group of P=O bonding. The stability problem of peeled BP was also solved by P=O bonding and bonding with 1T-WS2.In addition, it showed 4 ppm/min decomposition performance in reducing acetaldehyde, which is a gaseous pollutant VOCs. This was not photocatalytic activity in the BP and 1T-WS2 single material samples, but showed activity in the composite material. This study presented a method to solve the BP’s stability problem and the fast and dominant electron–hole recombination problem at the same time. We observed great potential and promisein applying 1T-WS2 in photocatalysis. In addition, the oxidation control of BP through plasma treatment can be expected to be applied to other materials. The problem of VOC-based fine dust is serious, so the need for an eco-friendly solution has increased greatly. The development of hybrid photocatalyst materials capable of decomposing both air and water pollutants can be a fundamental solution to the environmental pollution problem.

Supplementary Materials

The following supporting information can be downloaded at: https://www.mdpi.com/article/10.3390/ijms23020733/s1.

Author Contributions

Conceptualization, R.-H.J. and J.-H.B.; methodology, D.-I.K.; software, R.-H.J.; validation, R.-H.J., J.-W.Y. and S.P.; formal analysis, R.-H.J.; investigation, R.-H.J. and J.-W.L.; resources, R.-H.J.; data curation, D.-I.K., S.P.; writing—original draft preparation, R.-H.J.; writing—review and editing, All authors; visualization, J.-W.L.; supervision, J.-H.B.; project administration, J.-H.B.; funding acquisition, R.-H.J. and J.-H.B. All authors have read and agreed to the published version of the manuscript.

Funding

This research was supported by the National Research Foundation of Korea (NRF) grant funded by the Korea government(MSIT) (2020R1A2C1011764), (2020R1A6A3A13075585).

Institutional Review Board Statement

Not applicable.

Informed Consent Statement

Not applicable.

Conflicts of Interest

The authors declare no conflict of interest.

References

  1. Şolpan, D.; Güven, O.; Takacs, E.; Wojnárovits, L.; Dajka, K. High-energy irradiation treatment of aqueous solutions of azo dyes: Steady-state gamma radiolysis experiments. Radiat. Phys. Chem. 2003, 67, 531–534. [Google Scholar] [CrossRef]
  2. Fadillah, G.; Saleh, T.A.; Wahyuningsih, S.; Putri, E.N.K.; Febrianastuti, S. Electrochemical removal of methylene blue using alginate-modified graphene adsorbents. Chem. Eng. J. 2019, 378, 122140. [Google Scholar] [CrossRef]
  3. Zhang, P.; O’Connor, D.; Wang, Y.; Jiang, L.; Xia, T.; Wang, L.; Tsang, D.; Ok, Y.S.; Hou, D. A green biochar/iron oxide composite for methylene blue removal. J. Hazard. Mater. 2020, 384, 121286. [Google Scholar] [CrossRef] [PubMed]
  4. Mian, M.; Liu, G. Sewage sludge-derived TiO2/Fe/Fe3C-biochar composite as an efficient. Chemosphere 2019, 215, 101–114. [Google Scholar] [CrossRef] [PubMed]
  5. Wen, D.; Li, W.; Lv, J.; Qiang, Z.; Li, M. Methylene blue degradation by the VUV/UV/persulfate process: Effect of pH on the roles of photolysis and oxidation. J. Hazard. Mater. 2020, 391, 121855. [Google Scholar] [CrossRef]
  6. Zhu, Y.; Shen, J.; Zhou, K.; Chen, C.; Yang, X.; Li, C. Multifunctional Magnetic Composite Microspheres with in Situ Growth Au Nanoparticles: A Highly Efficient Catalyst System. J. Phys. Chem. C 2011, 115, 1614–1619. [Google Scholar] [CrossRef]
  7. Zhang, Y.; Zhu, P.; Chen, L.; Li, G.; Zhou, F.; Lu, D.; Sun, R.; Zhou, F.; Wong, C.-P. Hierarchical architectures of monodisperse porous Cu microspheres: Synthesis, growth mechanism, high-efficiency and recyclable catalytic performance. J. Mater. Chem. A 2014, 2, 11966–11973. [Google Scholar] [CrossRef]
  8. Yoo, S.H.; Jang, D.; Joh, H.-I.; Lee, S. Iron oxide/porous carbon as a heterogeneous Fenton catalyst for fast decomposition of hydrogen peroxide and efficient removal of methylene blue. J. Mater. Chem. A 2017, 5, 748–755. [Google Scholar] [CrossRef]
  9. Houas, A.; Lachheb, H.; Ksibi, M.; Elaloui, E.; Guillard, C.; Herrmann, J.M. Photocatalytic degradation pathway of methylene blue in water. Appl. Catal. B Environ. 2001, 31, 145–157. [Google Scholar] [CrossRef]
  10. Shanmugam, M.; Alsalme, A.; Alghamdi, A.; Jayavel, R. Enhanced Photocatalytic Performance of the Graphene-V2O5 Nanocomposite in the Degradation of Methylene Blue Dye under Direct Sunlight. ACS Appl. Mater. Interfaces 2015, 7, 14905–14911. [Google Scholar] [CrossRef]
  11. Jeong, R.H.; Lee, J.W.; Kim, D.I.; Yang, J.W.; Park, S.; Boo, J.-H. Black phosphorus @ molybdenum disulfide 2D nanocomposite with broad light absorption and high stability for methylene blue decomposition photocatalyst. Nanotechnology 2019, 31, 155704. [Google Scholar] [CrossRef] [PubMed]
  12. Du, J.-J.; Yuan, Y.-P.; Sun, J.-X.; Peng, F.-M.; Jiang, X.; Qiu, L.-G.; Xie, A.-J.; Shen, Y.-H.; Zhu, J.-F. New photocatalysts based on MIL-53 metal–organic frameworks for the decolorization of methylene blue dye. J. Hazard. Mater. 2011, 190, 945–951. [Google Scholar] [CrossRef] [PubMed]
  13. Tang, L.; Meng, X.; Deng, D.; Bao, X. Confinement Catalysis with 2D Materials for Energy Conversion. Adv. Mater. 2019, 31, e1901996. [Google Scholar] [CrossRef] [PubMed]
  14. Novoselov, K.S.; Mishchenko, A.; Carvalho, A.; Neto, A.H.C. 2D materials and van der Waals heterostructures. Science 2016, 353, aac9439. [Google Scholar] [CrossRef] [Green Version]
  15. Gibertini, M.; Koperski, M.; Morpurgo, A.F.; Novoselov, K.S. Magnetic 2D materials and heterostructures. Nat. Nanotechnol. 2019, 14, 408–419. [Google Scholar] [CrossRef] [Green Version]
  16. Zavabeti, A.; Jannat, A.; Zhong, L.; Haidry, A.A.; Yao, Z.; Ou, J.Z. Two-Dimensional Materials in Large-Areas: Synthesis, Properties and Applications. Nano-Micro Lett. 2020, 12, 66. [Google Scholar] [CrossRef] [Green Version]
  17. Batmunkh, M.; Bat-Erdene, M.; Shapter, J.G. Phosphorene and Phosphorene-Based Materials—Prospects for Future Applications. Adv. Mater. 2016, 28, 8586–8617. [Google Scholar] [CrossRef]
  18. Dhanabalan, S.C.; Ponraj, J.S.; Guo, Z.; Qiaoliang, B.; Bao, Q.; Zhang, H. Emerging Trends in Phosphorene Fabrication towards Next Generation Devices. Adv. Sci. 2017, 4, 1600305. [Google Scholar] [CrossRef]
  19. Pang, J.; Bachmatiuk, A.; Yin, Y.; Trzebicka, B.; Zhao, L.; Fu, L.; Mendes, R.G.; Gemming, T.; Liu, Z.; Rummeli, M.H. Applications of Phosphorene and Black Phosphorus in Energy Conversion and Storage Devices. Adv. Energy Mater. 2018, 8, 1702093. [Google Scholar] [CrossRef]
  20. Yang, A.; Wang, D.; Wang, X.; Zhang, D.; Koratkar, N.; Rong, M. Recent advances in phosphorene as a sensing material. Nano Today 2018, 20, 13–32. [Google Scholar] [CrossRef]
  21. Xia, F.; Wang, H.; Jia, Y. Rediscovering black phosphorus as an anisotropic layered material for optoelectronics and electronics. Nat. Commun. 2014, 5, 4458. [Google Scholar] [CrossRef] [Green Version]
  22. Yang, J.; Xu, R.; Pei, J.; Myint, Y.W.; Wang, F.; Wang, Z.; Zhang, S.; Yu, Z.; Lu, Y. Optical tuning of exciton and trion emissions in monolayer phosphorene. Light. Sci. Appl. 2015, 4, e312. [Google Scholar] [CrossRef] [Green Version]
  23. Deng, B.; Tran, V.; Xie, Y.; Jiang, H.; Li, C.; Guo, Q.; Wang, X.; Tian, H.; Koester, S.J.; Wang, H.; et al. Efficient electrical control of thin-film black phosphorus bandgap. Nat. Commun. 2017, 8, 14474. [Google Scholar] [CrossRef] [PubMed] [Green Version]
  24. Wang, X.; Jones, A.M.; Seyler, K.L.; Tran, V.; Jia, Y.; Zhao, H.; Wang, H.; Yang, L.; Xu, X.; Xia, F. Highly anisotropic and robust excitons in monolayer black phosphorus. Nat. Nanotechnol. 2015, 10, 517–521. [Google Scholar] [CrossRef] [PubMed] [Green Version]
  25. Zhao, J.; Zhu, J.; Cao, R.; Wang, H.; Guo, Z.; Sang, D.K.; Tang, J.; Fan, D.; Li, J.; Zhang, H. Liquefaction of water on the surface of anisotropic two-dimensional atomic layered black phosphorus. Nat. Commun. 2019, 10, 4062. [Google Scholar] [CrossRef] [PubMed] [Green Version]
  26. Jung, S.W.; Ryu, S.H.; Shin, W.J.; Sohn, Y.; Huh, M.; Koch, R.J.; Jozwiak, C.; Rotenberg, E.; Bostwick, A.; Kim, K.S. Black phosphorus as a bipolar pseudospin semiconductor. Nat. Mater. 2020, 19, 277–281. [Google Scholar] [CrossRef] [PubMed]
  27. Zhu, J.; Xiao, G.; Zuo, X. Two-Dimensional Black Phosphorus: An Emerging Anode Material for Lithium-Ion Batteries. Nano-Micro Lett. 2020, 12, 120. [Google Scholar] [CrossRef]
  28. Ryder, C.R.; Wood, J.D.; Wells, S.A.; Yang, Y.; Jariwala, D.; Marks, T.J.; Schatz, G.C.; Hersam, M.C. Covalent functionalization and passivation of exfoliated black phosphorus via aryl diazonium chemistry. Nat. Chem. 2016, 8, 597–602. [Google Scholar] [CrossRef] [PubMed]
  29. Abate, Y.; Akinwande, D.; Gamage, S.; Wang, H.; Snure, M.; Poudel, N.; Cronin, S.B. Recent Progress on Stability and Passivation of Black Phosphorus. Adv. Mater. 2018, 30, e1704749. [Google Scholar] [CrossRef] [PubMed]
  30. Alodan, S.A.; Gorham, J.M.; DelRio, F.W.; Alsaffar, F.; Aljalham, G.; Alolaiyan, O.; Zhou, C.; Amer, M.R. Room temperature wideband tunable photoluminescence of pulsed thermally annealed layered black phosphorus. Nanophotonics 2020, 9, 4253–4264. [Google Scholar] [CrossRef]
  31. Ziletti, A.; Carvalho, A.; Trevisanutto, P.E.; Campbell, D.K.; Coker, D.F.; Neto, A.H.C. Phosphorene oxides: Bandgap engineering of phosphorene by oxidation. Phys. Rev. B 2015, 91, 085407. [Google Scholar] [CrossRef] [Green Version]
  32. Nakhanivej, P.; Yu, X.; Park, S.K.; Kim, S.; Hong, J.-Y.; Kim, H.J.; Lee, W.; Hwang, J.Y.; Yang, J.E.; Wolverton, C.; et al. Revealing molecular-level surface redox sites of controllably oxidized black phosphorus nanosheets. Nat. Mater. 2018, 18, 156–162. [Google Scholar] [CrossRef] [PubMed]
  33. Jeong, R.H.; Kim, D.I.; Lee, J.W.; Yu, J.-H.; Jeong, B.G.; Oh, H.M.; Jeong, M.S.; Boo, J.-H. Ultra fast metal-free reduction catalyst of partial oxidized violet phosphorus synthesized via controlled mechanical energy. 2D Mater. 2019, 6, 045039. [Google Scholar] [CrossRef]
  34. Wu, X.; Gong, K.; Zhao, G.; Lou, W.; Wang, X.; Liu, W. MoS2/WS2 Quantum Dots as High-Performance Lubricant Additive in Polyalkylene Glycol for Steel/Steel Contact at Elevated Temperature. Adv. Mater. Interfaces 2018, 5, 1700859. [Google Scholar] [CrossRef]
  35. Tang, B.; Yu, Z.G.; Huang, L.; Chai, J.; Wong, S.L.; Deng, J.; Yang, W.; Gong, H.; Wang, S.; Ang, K.-W.; et al. Direct n- to p-Type Channel Conversion in Monolayer/Few-Layer WS2 Field-Effect Transistors by Atomic Nitrogen Treatment. ACS Nano 2018, 12, 2506–2513. [Google Scholar] [CrossRef] [PubMed]
  36. Han, W.; Liu, Z.; Pan, Y.; Guo, G.; Zou, J.; Xia, Y.; Peng, Z.; Li, W.; Dong, A. Designing Champion Nanostructures of Tungsten Dichalcogenides for Electrocatalytic Hydrogen Evolution. Adv. Mater. 2020, 32, 2002584. [Google Scholar] [CrossRef] [PubMed]
  37. Voiry, D.; Yamaguchi, H.; Li, J.; Silva, R.; Alves, D.; Fujita, T.; Chen, M.; Asefa, T.; Shenoy, V.B.; Eda, G.; et al. Enhanced catalytic activity in strained chemically exfoliated WS2 nanosheets for hydrogen evolution. Nat. Mater. 2013, 12, 850–855. [Google Scholar] [CrossRef]
  38. Xiang, Q.; Cheng, F.; Lang, D. Hierarchical Layered WS2 /Graphene-Modified CdS Nanorods for Efficient Photocatalytic Hydrogen Evolution. ChemSusChem 2016, 9, 996–1002. [Google Scholar] [CrossRef]
  39. Ding, W.; Hu, L.; Dai, J.; Tang, X.; Wei, R.; Sheng, Z.; Liang, C.; Shao, D.; Song, W.; Liu, Q.; et al. Highly Ambient-STable 1T-MoS2 and 1T-WS2 by Hydrothermal Synthesis under High Magnetic Fields. ACS Nano 2019, 13, 1694–1702. [Google Scholar] [CrossRef]
  40. Elías, A.L.; Perea-López, N.; Castro-Beltrán, A.; Berkdemir, A.; Lv, R.; Feng, S.; Long, A.D.; Hayashi, T.; Kim, Y.A.; Endo, M.; et al. Controlled Synthesis and Transfer of Large-Area WS2 Sheets: From Single Layer to Few Layers. ACS Nano 2013, 7, 5235–5242. [Google Scholar] [CrossRef]
  41. Li, Y.; Ding, L.; Yin, S.; Liang, Z.; Xue, Y.; Wang, X.; Cui, H.; Tian, J. Photocatalytic H2 Evolution on TiO2 Assembled with Ti3C2MXene and Metallic 1T-WS2 as Co-catalysts. Nano-Micro Lett. 2020, 12, 6. [Google Scholar] [CrossRef] [PubMed] [Green Version]
  42. Zhong, Y.; Shao, Y.; Ma, F.; Wu, Y.; Huang, B.; Hao, X. Band-gap-matched CdSe QD/WS2 nanosheet composite: Size-controlled photocatalyst for high-efficiency water splitting. Nano Energy 2017, 31, 84–89. [Google Scholar] [CrossRef]
  43. Lin, Y.-C.; Yeh, C.-H.; Lin, H.-C.; Siao, M.-D.; Liu, Z.; Nakajima, H.; Okazaki, T.; Chou, M.-Y.; Suenaga, K.; Chiu, P.-W. Table 1T Tungsten Disulfide Monolayer and Its Junctions: Growth and Atomic Structures. ACS Nano 2018, 12, 12080–12088. [Google Scholar] [CrossRef]
  44. van der Zande, A.; Kunstmann, J.; Chernikov, A.; Chenet, D.A.; You, Y.; Zhang, X.; Huang, P.; Berkelbach, T.C.; Wang, L.; Zhang, F.; et al. Tailoring the Electronic Structure in Bilayer Molybdenum Disulfide via Interlayer Twist. Nano Lett. 2014, 14, 3869–3875. [Google Scholar] [CrossRef] [PubMed]
  45. Eda, G.; Fujita, T.; Yamaguchi, H.; Voiry, D.; Chen, M.; Chhowalla, M. Coherent Atomic and Electronic Heterostructures of Single-Layer MoS2. ACS Nano 2012, 6, 7311. [Google Scholar] [CrossRef] [PubMed]
  46. Khalil, A.; Liu, Q.; He, Q.; Xiang, T.; Liu, D.; Wang, C.; Fang, Q.; Song, L. Metallic 1T-WS2 nanoribbons as highly conductive electrodes for supercapacitors. RSC Adv. 2016, 6, 48788–48791. [Google Scholar] [CrossRef]
  47. Gopannagari, M.; Kumar, D.P.; Reddy, D.A.; Hong, S.; Song, M.I.; Kim, T.K. In situ preparation of few-layered WS2 nanosheets and exfoliation into bilayers on CdS nanorods for ultrafast charge carrier migrations toward enhanced photocatalytic hydrogen production. J. Catal. 2017, 351, 153–160. [Google Scholar] [CrossRef]
  48. Guo, M.; Xing, Z.; Zhao, T.; Li, Z.; Yang, S.; Zhou, W. WS2 quantum dots/MoS2@WO3-x core-shell hierarchical dual Z-scheme tandem heterojunctions with wide-spectrum response and enhanced photocatalytic performance. Appl. Catal. B Environ. 2019, 257, 117913. [Google Scholar] [CrossRef]
  49. Hou, Y.; Zhu, Y.; Xu, Y.; Wang, X. Photocatalytic hydrogen production over carbon nitride loaded with WS2 as cocatalyst under visible light. Appl. Catal. B Environ. 2014, 156-157, 122–127. [Google Scholar] [CrossRef]
  50. Jia, J.; Jang, S.K.; Lai, S.; Xu, J.; Choi, Y.J.; Park, J.-H.; Lee, S. Plasma-Treated Thickness-Controlled Two-Dimensional Black Phosphorus and Its Electronic Transport Properties. ACS Nano 2015, 9, 8729–8736. [Google Scholar] [CrossRef] [PubMed]
  51. Gong, X.; Guan, L.; Li, Q.; Li, Y.; Zhang, T.; Pan, H.; Sun, Q.; Shen, Y.; Grätzel, C.; Zakeeruddin, S.M.; et al. Black phosphorus quantum dots in inorganic perovskite thin films for efficient photovoltaic application. Sci. Adv. 2020, 6, eaay5661. [Google Scholar] [CrossRef] [PubMed] [Green Version]
  52. Zhu, M.; Osakada, Y.; Kim, S.; Fujitsuka, M.; Majima, T. Black phosphorus: A promising two dimensional visible and near-infrared-activated photocatalyst for hydrogen evolution. Appl. Catal. B Environ. 2017, 217, 285–292. [Google Scholar] [CrossRef]
  53. Hu, Z.; Zhang, S.; Zhang, Y.-N.; Wang, D.; Zeng, H.; Liu, L.-M. Modulating the phase transition between metallic and semiconducting single-layer MoS2 and WS2 through size effects. Phys. Chem. Chem. Phys. 2015, 17, 1099–1105. [Google Scholar] [CrossRef] [PubMed]
  54. Pustinger, J.V., Jr.; Cave, W.T.; Nielsen, M.L. Infrared spectra of inorganic phosphorus compounds. Spectrochim. Acts 1959, 11, 900–925. [Google Scholar]
  55. Valappil, M.O.; Ahlawat, M.; Pillai, V.K.; Alwarappan, S. A single-step, electrochemical synthesis of nitrogen doped blue luminescent phosphorene quantum dots. Chem. Commun. 2018, 54, 11733–11736. [Google Scholar] [CrossRef]
  56. Favron, A.; Goudreault, F.A.; Gosselin, V.; Groulx, J.; Côté, M.; Leonelli, R.; Germain, J.-F.; Phaneuf-L’Heureux, A.-L.; Francoeur, S.; Martel, R. Second-Order Raman Scattering in Exfoliated Black Phosphorus. Nano Lett. 2018, 18, 1018–1027. [Google Scholar] [CrossRef]
  57. Srinivaas, M.; Wu, C.-Y.; Duh, J.-G.; Wu, J.M. Highly Rich 1T Metallic Phase of Few-Layered WS2 Nanoflowers for Enhanced Storage of Lithium-Ion Batteries. ACS Sustain. Chem. Eng. 2019, 7, 10363–10370. [Google Scholar] [CrossRef]
  58. Tan, S.J.R.; Abdelwahab, I.; Ding, Z.; Zhao, X.; Yang, T.; Loke, G.Z.J.; Lin, H.; Verzhbitskiy, I.; Poh, S.M.; Xu, H.; et al. Chemical Stabilization of 1T′ Phase Transition Metal Dichalcogenides with Giant Optical Kerr Nonlinearity. J. Am. Chem. Soc. 2017, 139, 2504–2511. [Google Scholar] [CrossRef]
  59. Nayak, A.P.; Pandey, T.; Voiry, D.; Liu, J.; Moran, S.T.; Sharma, A.; Tan, C.; Chen, C.-H.; Li, L.-J.; Chhowalla, M.U.; et al. Pressure-Dependent Optical and Vibrational Properties of Monolayer Molybdenum Disulfide. Nano Lett. 2015, 15, 346–353. [Google Scholar] [CrossRef]
  60. He, R.; Hua, J.; Zhang, A.; Wang, C.; Peng, J.; Chen, W.; Zeng, J. Molybdenum Disulfide–Black Phosphorus Hybrid Nanosheets as a Superior Catalyst for Electrochemical Hydrogen Evolution. Nano Lett. 2017, 17, 4311–4316. [Google Scholar] [CrossRef]
  61. Shen, Z.; Sun, S.; Wang, W.; Liu, J.; Liu, Z.; Yu, J.C. A black–red phosphorus heterostructure for efficient visible-light-driven photocatalysis. J. Mater. Chem. A 2015, 3, 3285–3288. [Google Scholar] [CrossRef]
  62. Liu, Q.; Li, X.; Xiao, Z.; Zhou, Y.; Chen, H.; Khalil, A.; Xiang, T.; Xu, J.; Chu, W.; Wu, X.; et al. Stable Metallic 1T-WS2Nanoribbons Intercalated with Ammonia Ions: The Correlation between Structure and Electrical/Optical Properties. Adv. Mater. 2015, 27, 4837–4844. [Google Scholar] [CrossRef] [PubMed]
  63. Jeffery, A.A.; Nethravathi, C.; Rajamathi, M. Two-Dimensional Nanosheets and Layered Hybrids of MoS2 and WS2 through Exfoliation of Ammoniated MS2 (M = Mo,W). J. Phys. Chem. C 2014, 118, 1386–1396. [Google Scholar] [CrossRef]
  64. Liu, Z.; Li, N.; Su, C.; Zhao, H.; Xu, L.; Yin, Z.; Li, J.; Du, Y. Colloidal synthesis of 1T’ phase dominated WS2 towards endurable electrocatalysis. Nano Energy 2018, 50, 176–181. [Google Scholar] [CrossRef]
  65. Mahler, B.; Hoepfner, V.; Liao, K.; Ozin, G.A. Colloidal Synthesis of 1T-WS2 and 2H-WS2 Nanosheets: Applications for Photocatalytic Hydrogen Evolution. J. Am. Chem. Soc. 2014, 136, 14121–14127. [Google Scholar] [CrossRef] [PubMed]
  66. Wang, Y.; He, M.; Ma, S.; Yang, C.; Yu, M.; Yin, G.; Zuo, P. Low-Temperature Solution Synthesis of Black Phosphorus from Red Phosphorus: Crystallization Mechanism and Lithium Ion Battery Applications. J. Phys. Chem. Lett. 2020, 11, 2708–2716. [Google Scholar] [CrossRef]
  67. Tian, B.; Tian, B.; Smith, B.; Scott, M.C.; Lei, Q.; Hua, R.; Tian, Y.; Liu, Y. Facile bottom-up synthesis of partially oxidized black phosphorus nanosheets as metal-free photocatalyst for hydrogen evolution. Proc. Natl. Acad. Sci. USA 2018, 115, 4345–4350. [Google Scholar] [CrossRef] [Green Version]
  68. Zhu, M.; Zhai, C.; Fujitsuka, M.; Majima, T. Noble metal-free near-infrared-driven photocatalyst for hydrogen production based on 2D hybrid of black Phosphorus/WS2. Appl. Catal. B Environ. 2018, 221, 645–651. [Google Scholar] [CrossRef]
  69. Sang, Y.; Zhao, Z.; Zhao, M.; Hao, P.; Leng, Y.; Liu, H. From UV to Near-Infrared, WS2Nanosheet: A Novel Photocatalyst for Full Solar Light Spectrum Photodegradation. Adv. Mater. 2015, 27, 363–369. [Google Scholar] [CrossRef] [PubMed]
  70. Hu, Z.; Li, Q.; Lei, B.; Wu, J.; Zhou, Q.; Gu, C.; Wen, X.; Wang, J.; Liu, Y.; Li, S.; et al. Abnormal Near-Infrared Absorption in 2D Black Phosphorus Induced by Ag Nanoclusters Surface Functionalization. Adv. Mater. 2018, 30, e1801931. [Google Scholar] [CrossRef] [PubMed]
  71. Pierucci, D.; Zribi, J.; Livache, C.; Gréboval, C.; Silly, M.G.; Chaste, J.; Patriarche, G.; Montarnal, D.; Lhuillier, E.; Ouerghi, A.; et al. Evidence for a narrow band gap phase in 1T′ WS2 nanosheet. Appl. Phys. Lett. 2019, 115, 032102. [Google Scholar] [CrossRef]
  72. Kubelka, P.; Munk, F. An Article on Optics of Paint Layers 2M. Gurevic Physik. Zeitschr. 1930, 31, 753. [Google Scholar]
  73. Morales, A.E.; Mora, E.S.; Pal, U. Use of diffuse reflectance spectroscopy for optical characterization of un-supported nanostructures. Revista Mexicana de Físicas 2007, 53, 18–22. [Google Scholar]
  74. Murphy, A. Band-gap determination from diffuse reflectance measurements of semiconductor films, and application to photoelectrochemical water-splitting. Sol. Energy Mater. Sol. Cells 2007, 91, 1326–1337. [Google Scholar] [CrossRef]
  75. Gusakova, J.; Wang, X.; Shiau, L.L.; Krivosheeva, A.; Shaposhnikov, V.; Borisenko, V.; Gusakov, V.; Tay, B.K. Electronic Properties of Bulk and Monolayer TMDs: Theoretical Study within DFT Framework (GVJ-2e Method). Phys. Status Solidi A 2017, 214, 1700218. [Google Scholar] [CrossRef]
  76. Rabinowitch, E.; Epstein, L.F. Polymerization of Dyestuffs in Solution. Thionine and Methylene BluePolymerization of Dyestuffs in Solution. J. Am. Chem. Soc. 1941, 63, 69–78. [Google Scholar] [CrossRef]
  77. He, Q.; Wang, L.; Yin, K.; Luo, S. Vertically Aligned Ultrathin 1T-WS2 Nanosheets Enhanced the Electrocatalytic Hydrogen Evolution. Nanoscale Res. Lett. 2018, 13, 167. [Google Scholar] [CrossRef] [PubMed]
  78. Wu, C.-H.; Chern, J.-M. Kinetics of Photocatalytic Decomposition of Methylene Blue. Ind. Eng. Chem. Res. 2006, 45, 6450–6457. [Google Scholar] [CrossRef]
  79. Mehrotra, K.; Yablonsky, G.S.; Ray, A.K. Macro kinetic studies for photocatalytic degradation of benzoic acid in immobilized systems. Chemosphere 2005, 60, 1427–1436. [Google Scholar] [CrossRef] [PubMed]
  80. Nguyen, C.H.; Fu, C.-C.; Juang, R.-S. Degradation of methylene blue and methyl orange by palladium-doped TiO2 photocatalysis for water reuse: Efficiency and degradation pathways. J. Clean. Prod. 2018, 202, 413–427. [Google Scholar] [CrossRef]
  81. Yang, Y.; Xu, L.; Wang, H.; Wang, W.; Zhang, L. TiO2/graphene porous composite and its photocatalytic degradation of methylene blue. Mater. Des. 2016, 108, 632–639. [Google Scholar] [CrossRef]
  82. Matos, J.; Ocares-Riquelme, J.; Poon, P.S.; Montaña, R.; García, X.; Campos, K.; Hernandez-Garrido, J.C.; Titirici, M.M. C-doped anatase TiO2: Adsorption kinetics and photocatalytic degradation of methylene blue and phenol, and correlations with DFT estimations. J. Colloid Interface Sci. 2019, 547, 14–29. [Google Scholar] [CrossRef] [PubMed]
  83. Lin, W.; Xie, X.; Wang, X.; Wang, Y.; Segets, D.; Sun, J. Efficient adsorption and sustainable degradation of gaseous acetaldehyde and o-xylene using rGO-TiO2 photocatalyst. Chem. Eng. J. 2018, 349, 708–718. [Google Scholar] [CrossRef]
  84. Boningari, T.; Inturi, S.N.R.; Suidan, M.; Smirniotis, P.G. Novel one-step synthesis of sulfur doped-TiO2 by flame spray pyrolysis for visible light photocatalytic degradation of acetaldehyde. Chem. Eng. J. 2018, 339, 249–258. [Google Scholar] [CrossRef]
  85. Fang, X.; Lu, G.; Mahmood, A.; Tang, Z.; Liu, Z.; Zhang, L.; Wang, Y.; Sun, J. A novel ternary Mica/TiO2/Fe2O3 composite pearlescent pigment for the photocatalytic degradation of acetaldehyde. J. Photochem. Photobiol. A Chem. 2020, 400, 112617. [Google Scholar] [CrossRef]
  86. Tuyen, L.T.T.; Quang, D.A.; Toan, T.T.T.; Tung, T.Q.; Hoa, T.T.; Mau, T.X.; Khieu, D.Q. Synthesis of CeO2/TiO2 nanotubes and heterogeneous photocatalytic degradation of methylene blue. J. Environ. Chem. Eng. 2018, 6, 5999–6011. [Google Scholar] [CrossRef]
  87. Kaneco, S.; Katsumata, H.; Suzuki, T.; Ohta, K. Titanium dioxide mediated photocatalytic degradation of dibutyl phthalate in aqueous solution—kinetics, mineralization and reaction mechanism. Chem. Eng. J. 2006, 125, 59–66. [Google Scholar] [CrossRef]
  88. Zhu, M.; Kim, S.; Mao, L.; Fujitsuka, M.; Zhang, J.; Wang, X.; Majima, T. Metal-Free Photocatalyst for H2 Evolution in Visible to Near-Infrared Region: Black Phosphorus/Graphitic Carbon Nitride. J. Am. Chem. Soc. 2017, 139, 13234–13242. [Google Scholar] [CrossRef]
  89. Li, X.; Bi, W.; Zhang, L.; Tao, S.; Chu, W.; Zhang, Q.; Luo, Y.; Wu, C.; Xie, Y. Single-Atom Pt as Co-Catalyst for Enhanced Photocatalytic H2 Evolution. Adv. Mater. 2016, 28, 2427–2431. [Google Scholar] [CrossRef] [PubMed]
  90. Shi, F.; Dong, X.; Huang, K.; Geng, Z.; Wang, X.; Yang, X.; Wang, C.; Zhang, W.; Feng, S. Stabilizing black phosphorus via inorganic small-molecular H3BO3. Chem. Commun. 2020, 56, 11418–11421. [Google Scholar] [CrossRef] [PubMed]
  91. Zhao, Y.; Zhou, Q.; Li, Q.; Yao, X.; Wang, J. Passivation of Black Phosphorus via Self-Assembled Organic Monolayers by van der Waals Epitaxy. Adv. Mater. 2016, 29, 1603990. [Google Scholar] [CrossRef]
  92. Kumar, A.; Khan, M.; He, J.; Lo, I.M. Visible–light–driven magnetically recyclable terephthalic acid functionalized g−C3N4/TiO2 heterojunction nanophotocatalyst for enhanced degradation of PPCPs. Appl. Catal. B Environ. 2020, 270, 118898. [Google Scholar] [CrossRef]
  93. Ishibashi, K.-I.; Fujishima, A.; Watanabe, T.; Hashimoto, K. Detection of active oxidative species in TiO2 photocatalysis using the fluorescence technique. Electrochem. Commun. 2000, 2, 207–210. [Google Scholar] [CrossRef]
  94. Weon, S.; Kim, J.; Choi, W. Dual-components modified TiO2 with Pt and fluoride as deactivation-resistant photocatalyst for the degradation of volatile organic compound. Appl. Catal. B Environ. 2018, 220, 1–8. [Google Scholar] [CrossRef]
  95. Xia, P.; Cheng, B.; Jiang, J.; Tang, H. Localized π-conjugated structure and EPR investigation of g-C3N4 photocatalyst. Appl. Surf. Sci. 2019, 487, 335–342. [Google Scholar] [CrossRef]
  96. Gianetti, T.L.; Nocton, G.; Minasian, S.G.; Kaltsoyannis, N.; Kilcoyne, A.L.D.; Kozimor, S.A.; Shuh, D.K.; Tyliszczak, T.; Bergman, R.G.; Arnold, J. Electron localization in a mixed-valence diniobium benzene complex. Chem. Sci. 2015, 6, 993–1003. [Google Scholar] [CrossRef] [Green Version]
  97. Shi, M.; Huang, S.; Dong, N.; Liu, Z.; Gan, F.; Wang, J.; Chen, Y. Donor–acceptor type blends composed of black phosphorus and C60 for solid-state optical limiters. Chem. Commun. 2018, 54, 366–369. [Google Scholar] [CrossRef] [PubMed]
  98. Lee, N.; Choi, I.Y.; Doh, K.-Y.; Kim, J.; Sim, H.; Lee, D.; Choi, S.-Y.; Kim, J.K. Enhanced catalytic activity of edge-exposed 1T phase WS2 grown directly on a WO3nanohelical array for water splitting. J. Mater. Chem. A 2019, 7, 26378. [Google Scholar] [CrossRef]
  99. Page, S.E.; Sander, M.; Arnold, W.; McNeill, K. Hydroxyl Radical Formation upon Oxidation of Reduced Humic Acids by Oxygen in the Dark. Environ. Sci. Technol. 2012, 46, 1590–1597. [Google Scholar] [CrossRef]
  100. Yoneyama, H.; Torimoto, T. Titanium dioxide/adsorbent hybrid photocatalysts for photodestruction of organic substances of dilute concentrations. Catal. Today 2000, 58, 133–140. [Google Scholar] [CrossRef]
  101. Yang, J.; Chen, D.; Zhu, Y.; Zhang, Y.; Zhu, Y. 3D-3D porous Bi2WO6/graphene hydrogel composite with excellent synergistic effect of adsorption-enrichment and photocatalytic degradation. Appl. Catal. B Environ. 2017, 205, 228–237. [Google Scholar] [CrossRef]
  102. Huang, Y.; Wang, Z.; Wang, L.; Chao, Y.; Akiyama, T.; Yokoyama, T.; Matsumoto, Y. Hemicellulose Composition in Different Cell Wall Fractions Obtained using a DMSO/LiCl Wood Solvent System and Enzyme Hydrolysis. J. Wood Chem. Technol. 2015, 36, 228–237. [Google Scholar] [CrossRef]
Figure 1. The FE-SEM images of (a,b) pure black phosphorus and (cf) after oxygen plasma treatment for (c,d) 5 min and (e,f) 10 min.
Ijms 23 00733 g001
Figure 2. Typical low- and high-magnification high-resolution TEM image of (ac) OBP (df) synthesized 1T-WS2 nanosheet.
Ijms 23 00733 g002
Figure 3. HR-TEM data of OBP/1T-WS2 nanocomposite at various magnifications (ac) HAADF-STEM image (d), and EDX elemental mapping of (e) P and (f) S.
Ijms 23 00733 g003
Figure 4. (a,b) FT-IR and (c) Raman spectra of 1T-WS2, OBP and OBP/1T-WS2 nanocomposite.
Ijms 23 00733 g004
Figure 5. (a) XRD data depending on the BP oxidation control. (b) XRD data of the dashed square in (a), highlighting the 32–36° peaks. (c) XRD data of OBP, 1T-WS2, 2H-WS2, and the nanocomposite. X-ray photoelectron spectra of (d) W 4f level and (e) P 2p level of 1T-WS2, OBP, and the nanocomposite.
Ijms 23 00733 g005
Figure 6. UV-Vis spectra of the methylene blue solution (20 ppm), which was degraded after adding various samples separately: (a) pure black phosphorus, (b) oxidized BP, (c) 1T-WS2, and (d) OBP/1T-WS2 nanocomposite.
Ijms 23 00733 g006
Figure 7. (a) Photocatalytic degradation of methylene blue solution and (b) pseudo-first-order kinetics over the various samples. (c) Recycling test for the photocatalytic degradation of methylene blue.
Ijms 23 00733 g007
Figure 8. Changes in the amounts of acetaldehyde and CO2 ppm under 33.6% humidity conditions over (a) 1T-WS2 and (b) OBP/1T-WS2 as a function of the 5 W white LED irradiation time. (c) Acetaldehyde molecule consumption amount for 1T-WS2 (red) and OBP/1T-WS2 (navy) according to photocatalytic reaction time. (d) Amount converted to CO2 molecule due to photocatalytic reaction.
Ijms 23 00733 g008
Scheme 1. The proposed schematic diagram for the visible light activated photocatalytic mechanism of OBP/1T-WS2 nanocomposites.
Ijms 23 00733 sch001
Figure 9. (a) CW-EPR spectra of samples recorded at 123.15 K. (b) time-resolved photoluminescence spectra (Exitation wave = 470 nm) of OBP, 1T-WS2 and OBP/1T-WS2.
Ijms 23 00733 g009
Table 1. Lifetime of Time-resolved PL decays of OBP,1T-WS2 and OBP/1T-WS2.
SampleExitation (nm)OrderCHITau(ns)
OBP4702nd1.642844.87164
1T-WS24702nd1.245535.08882
oBP @ 1T-WS24702nd1.220947.32683
Publisher’s Note: MDPI stays neutral with regard to jurisdictional claims in published maps and institutional affiliations.

