
The TGA Transcription Factors from Clade II Negatively Regulate the Salicylic Acid Accumulation in Arabidopsis
 , , , and
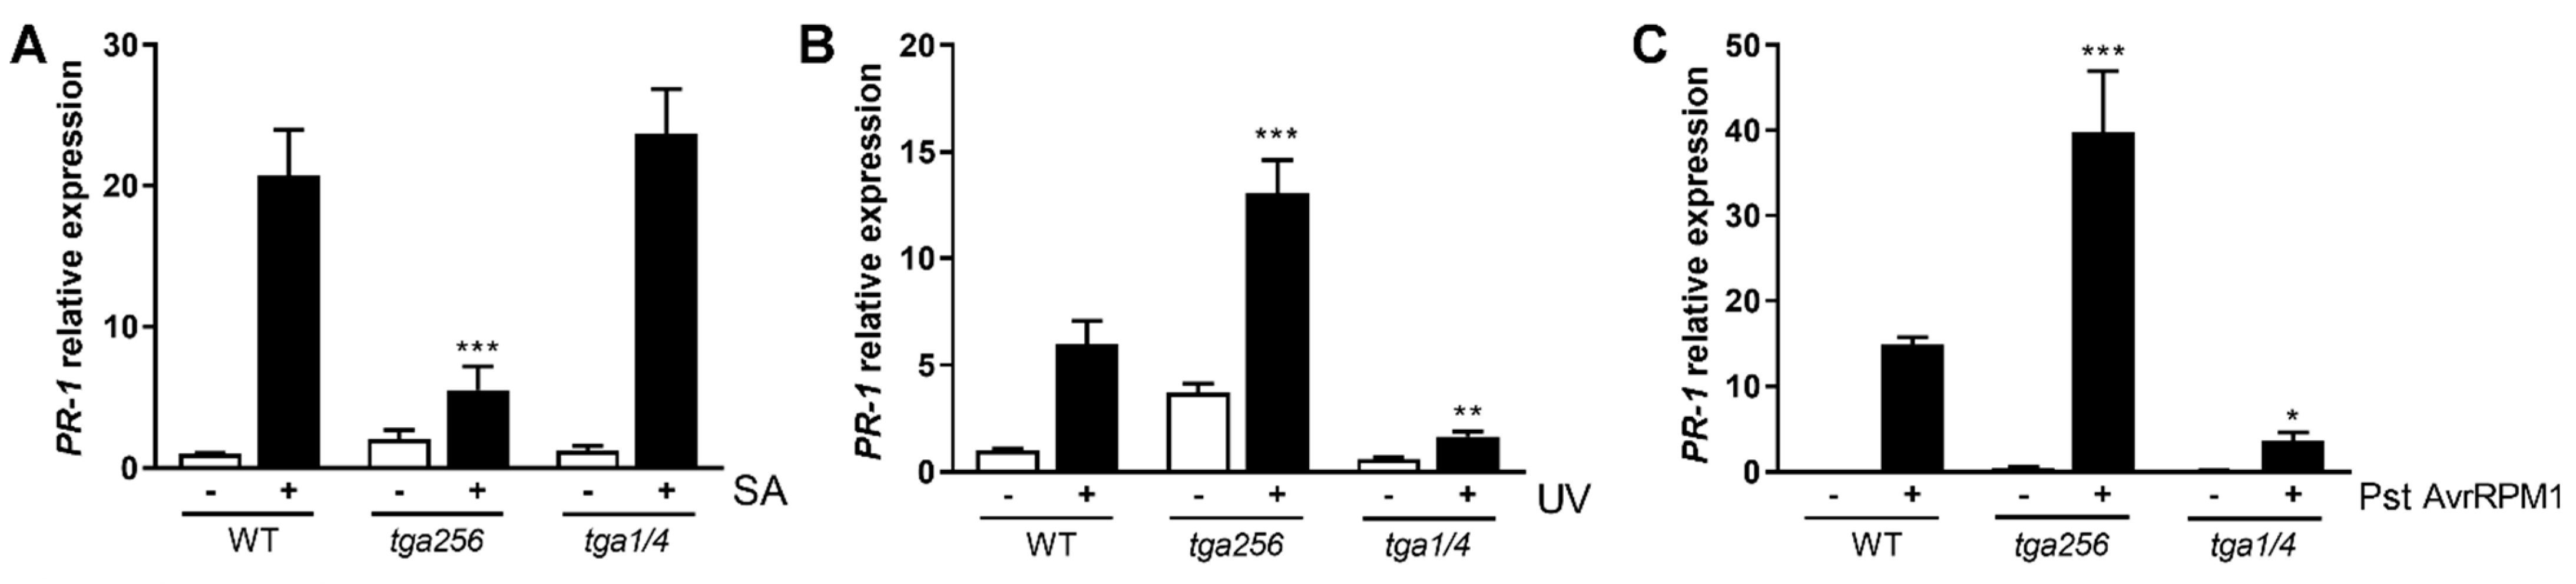
Abstract
:1. Introduction
2. Results
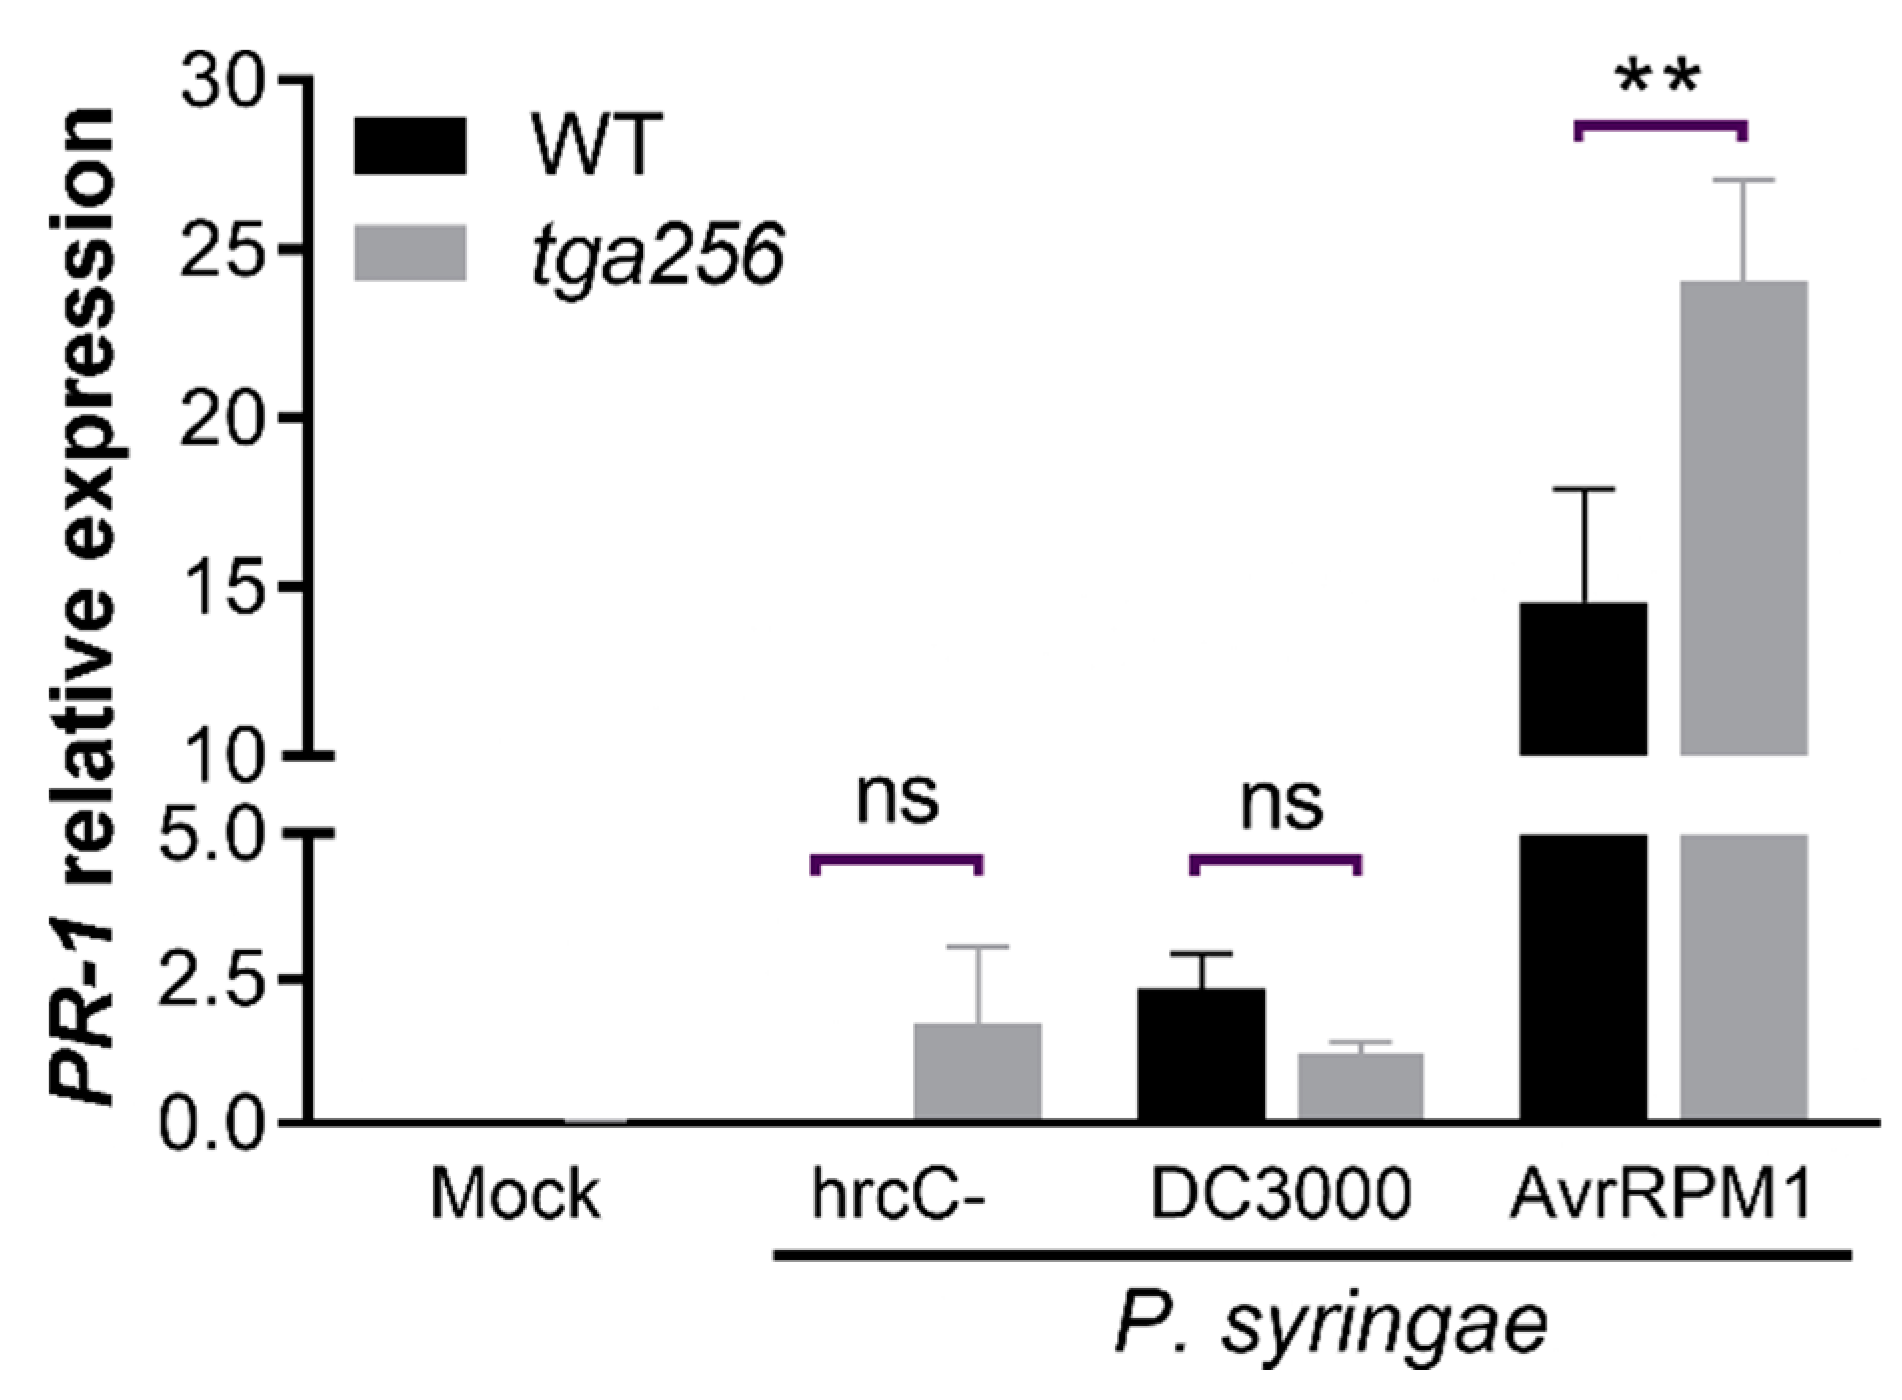
2.1. Treatments Known to Induce SA Accumulation in Wild-Type Upregulate PR-1 in tga256 Mutant Plants
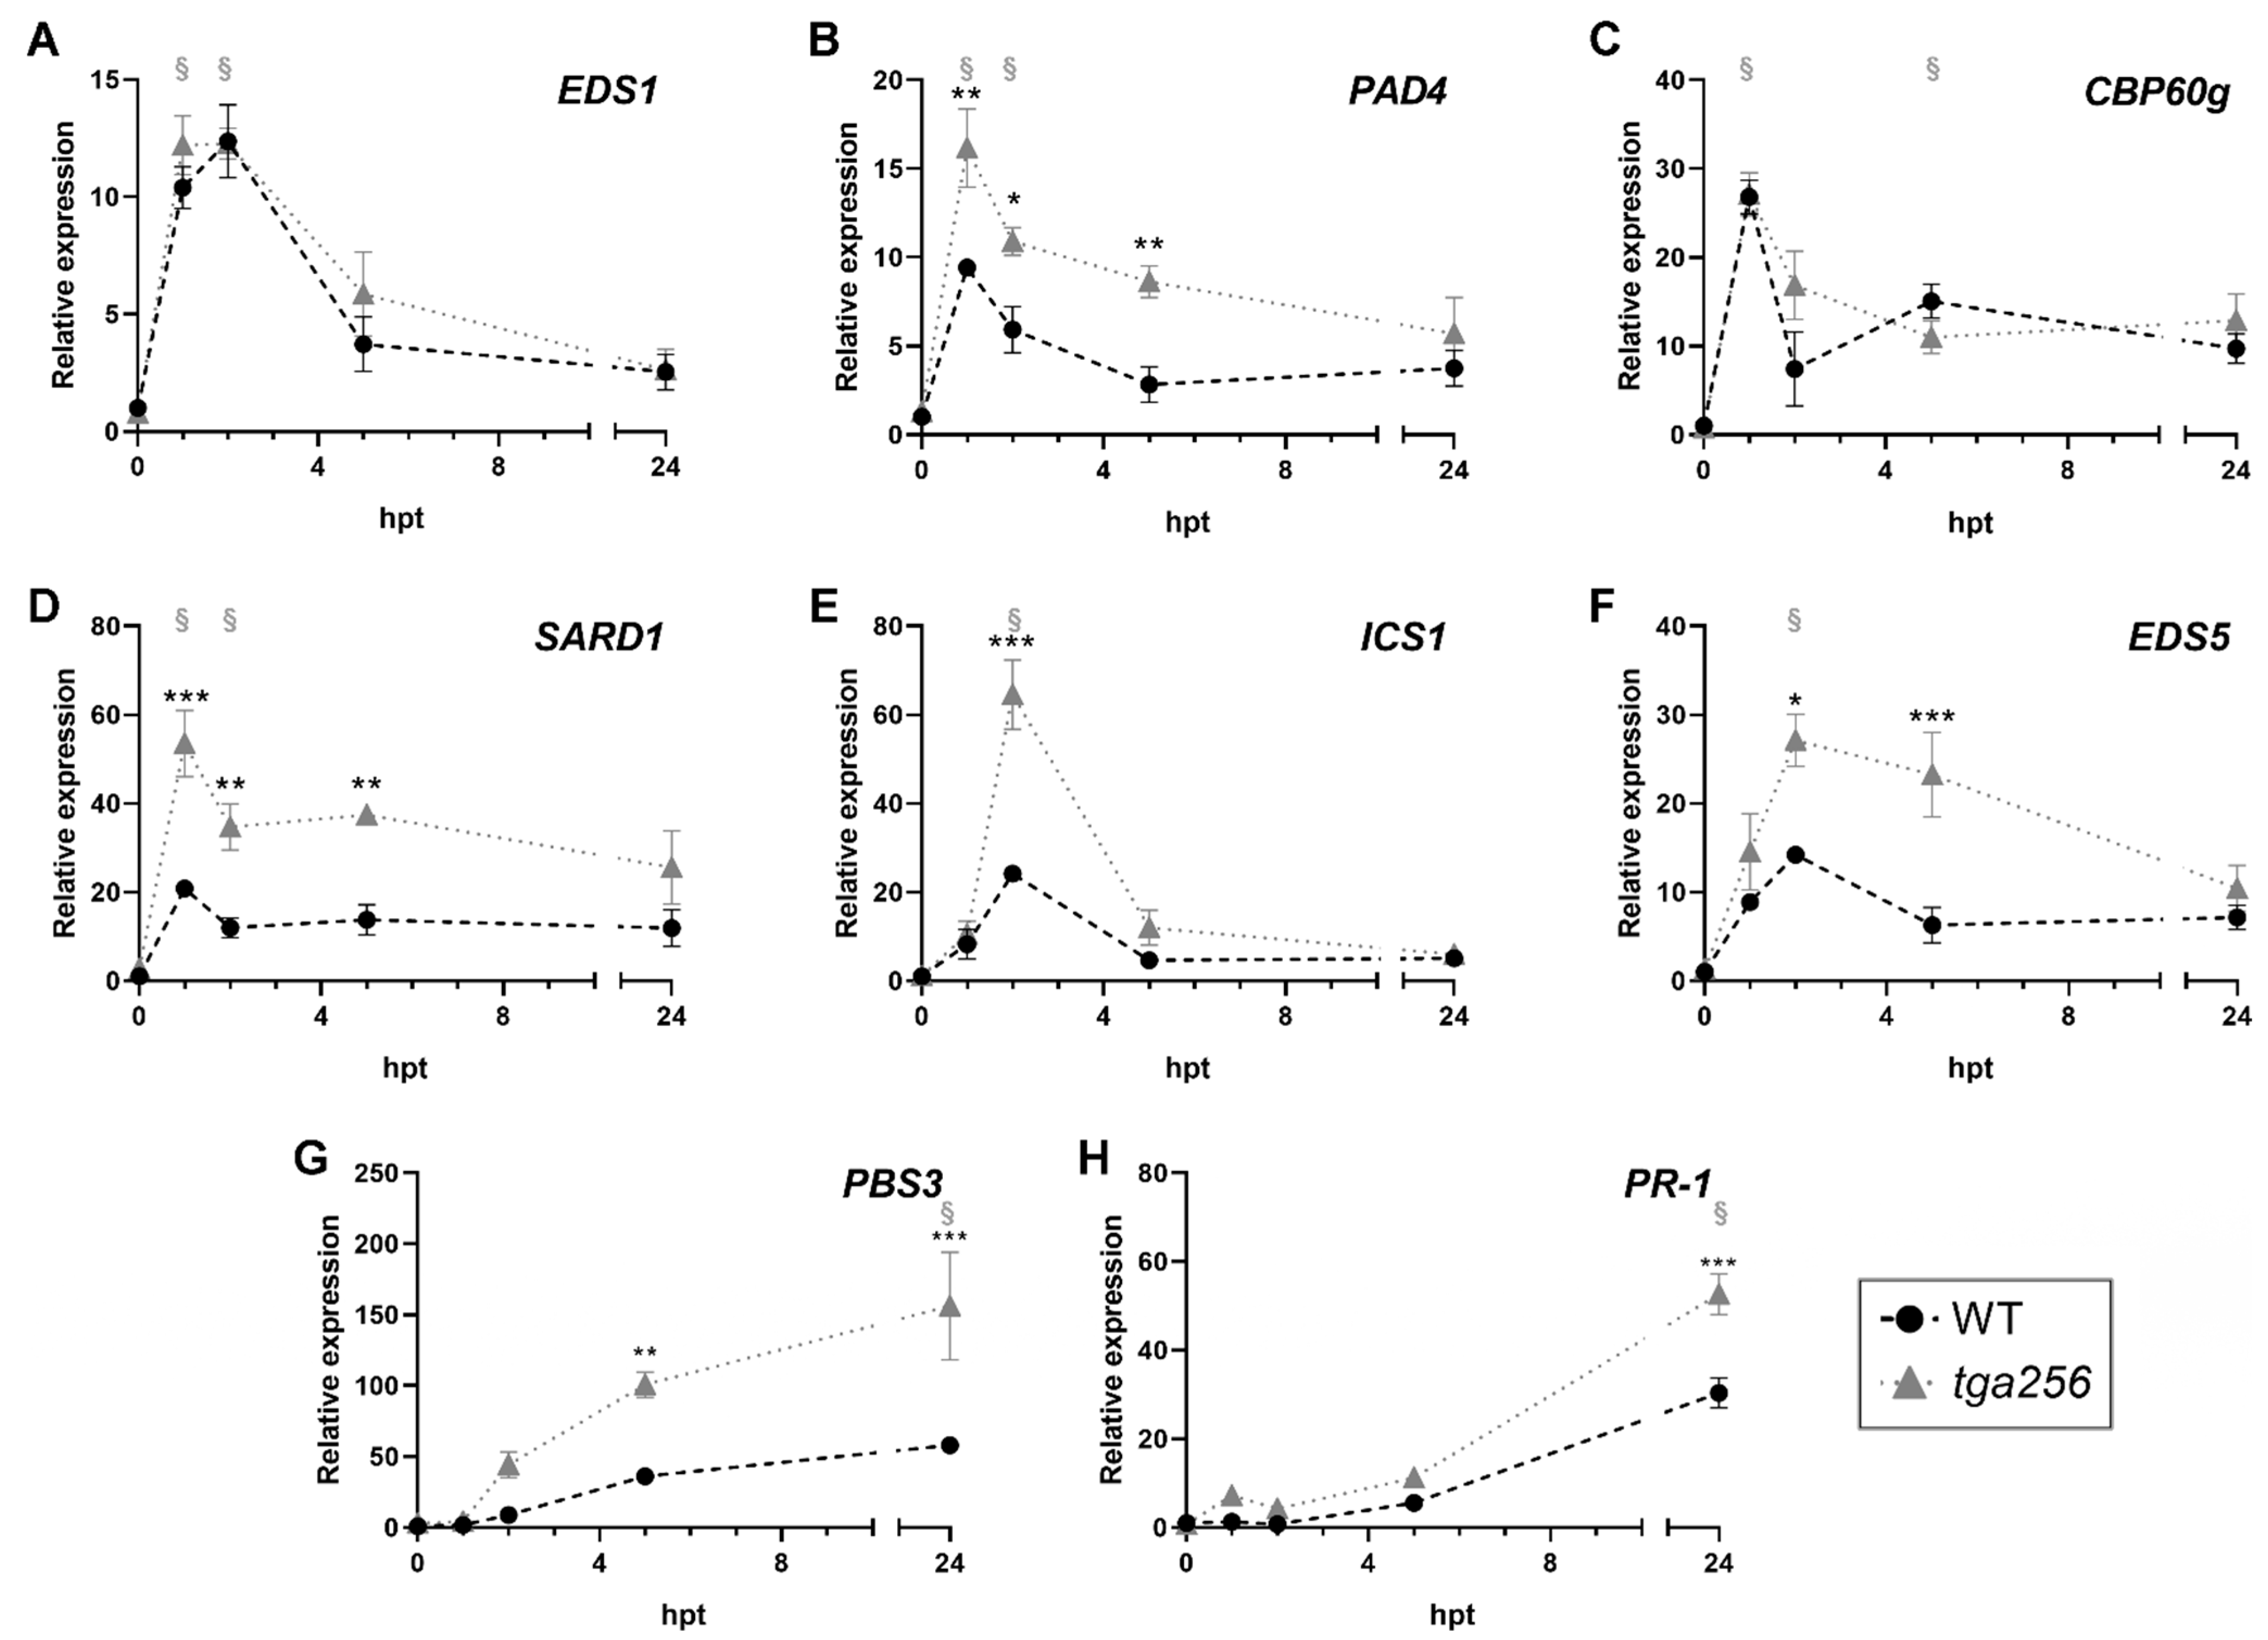
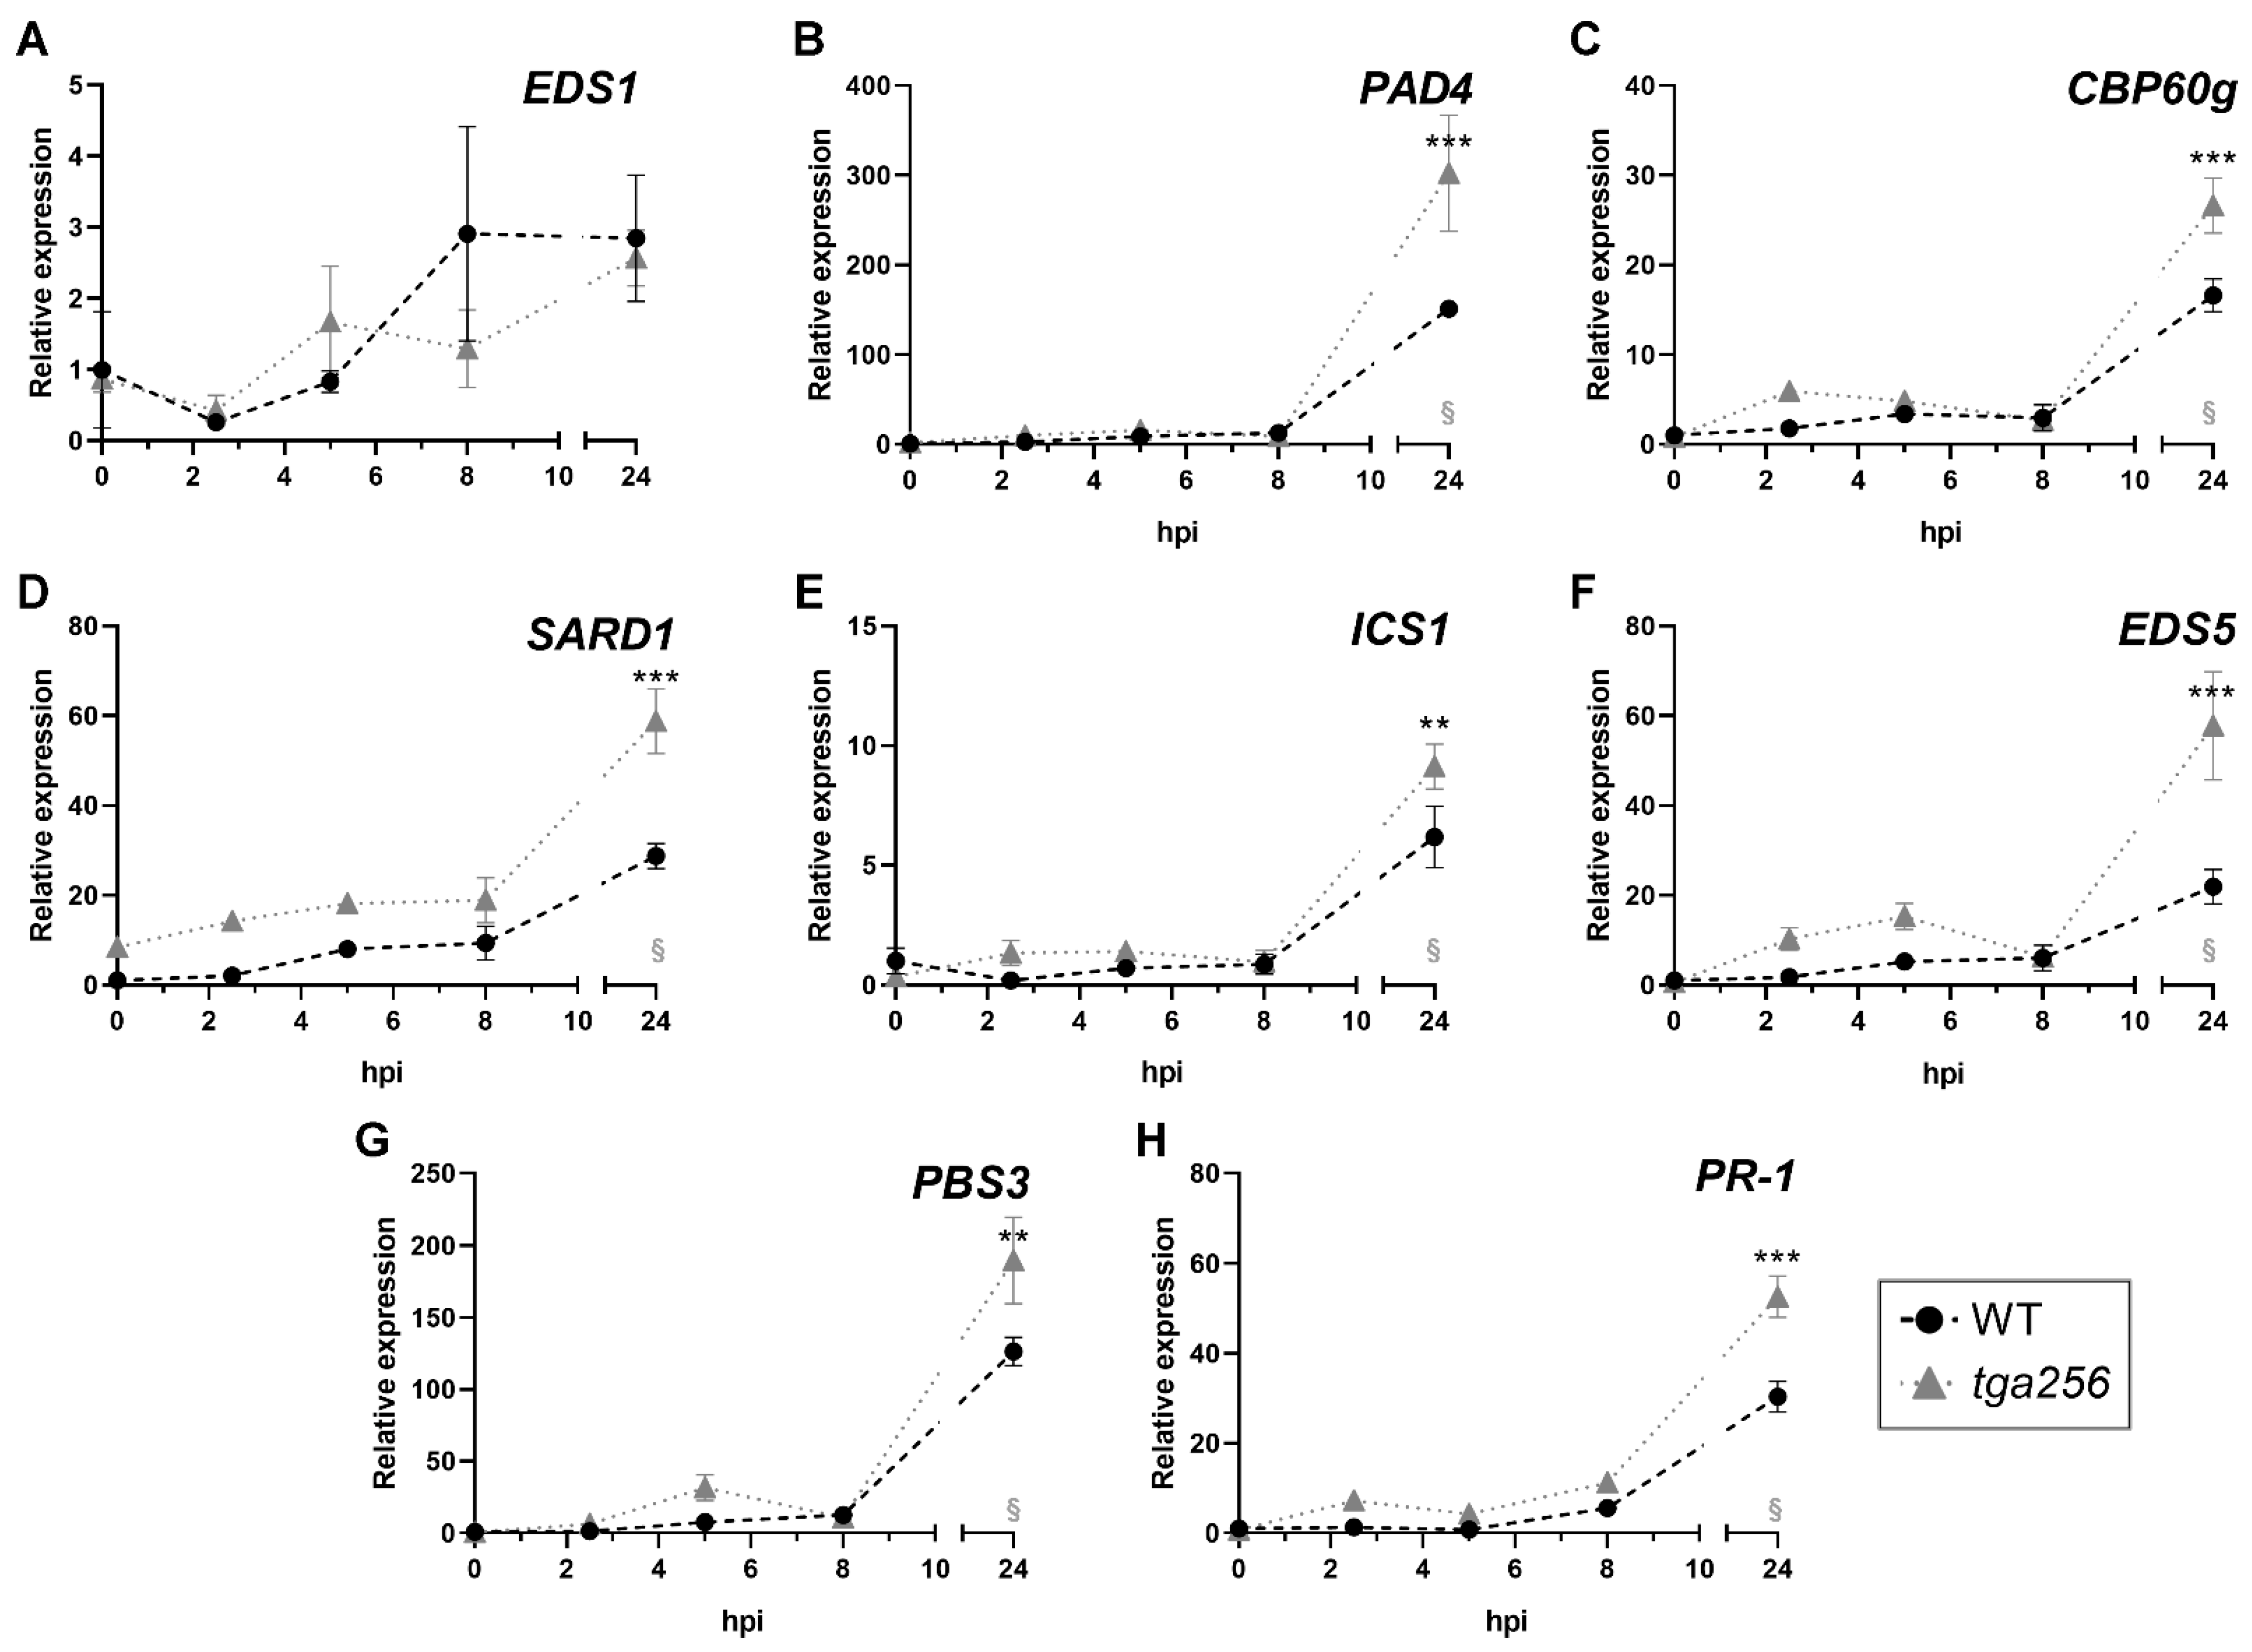
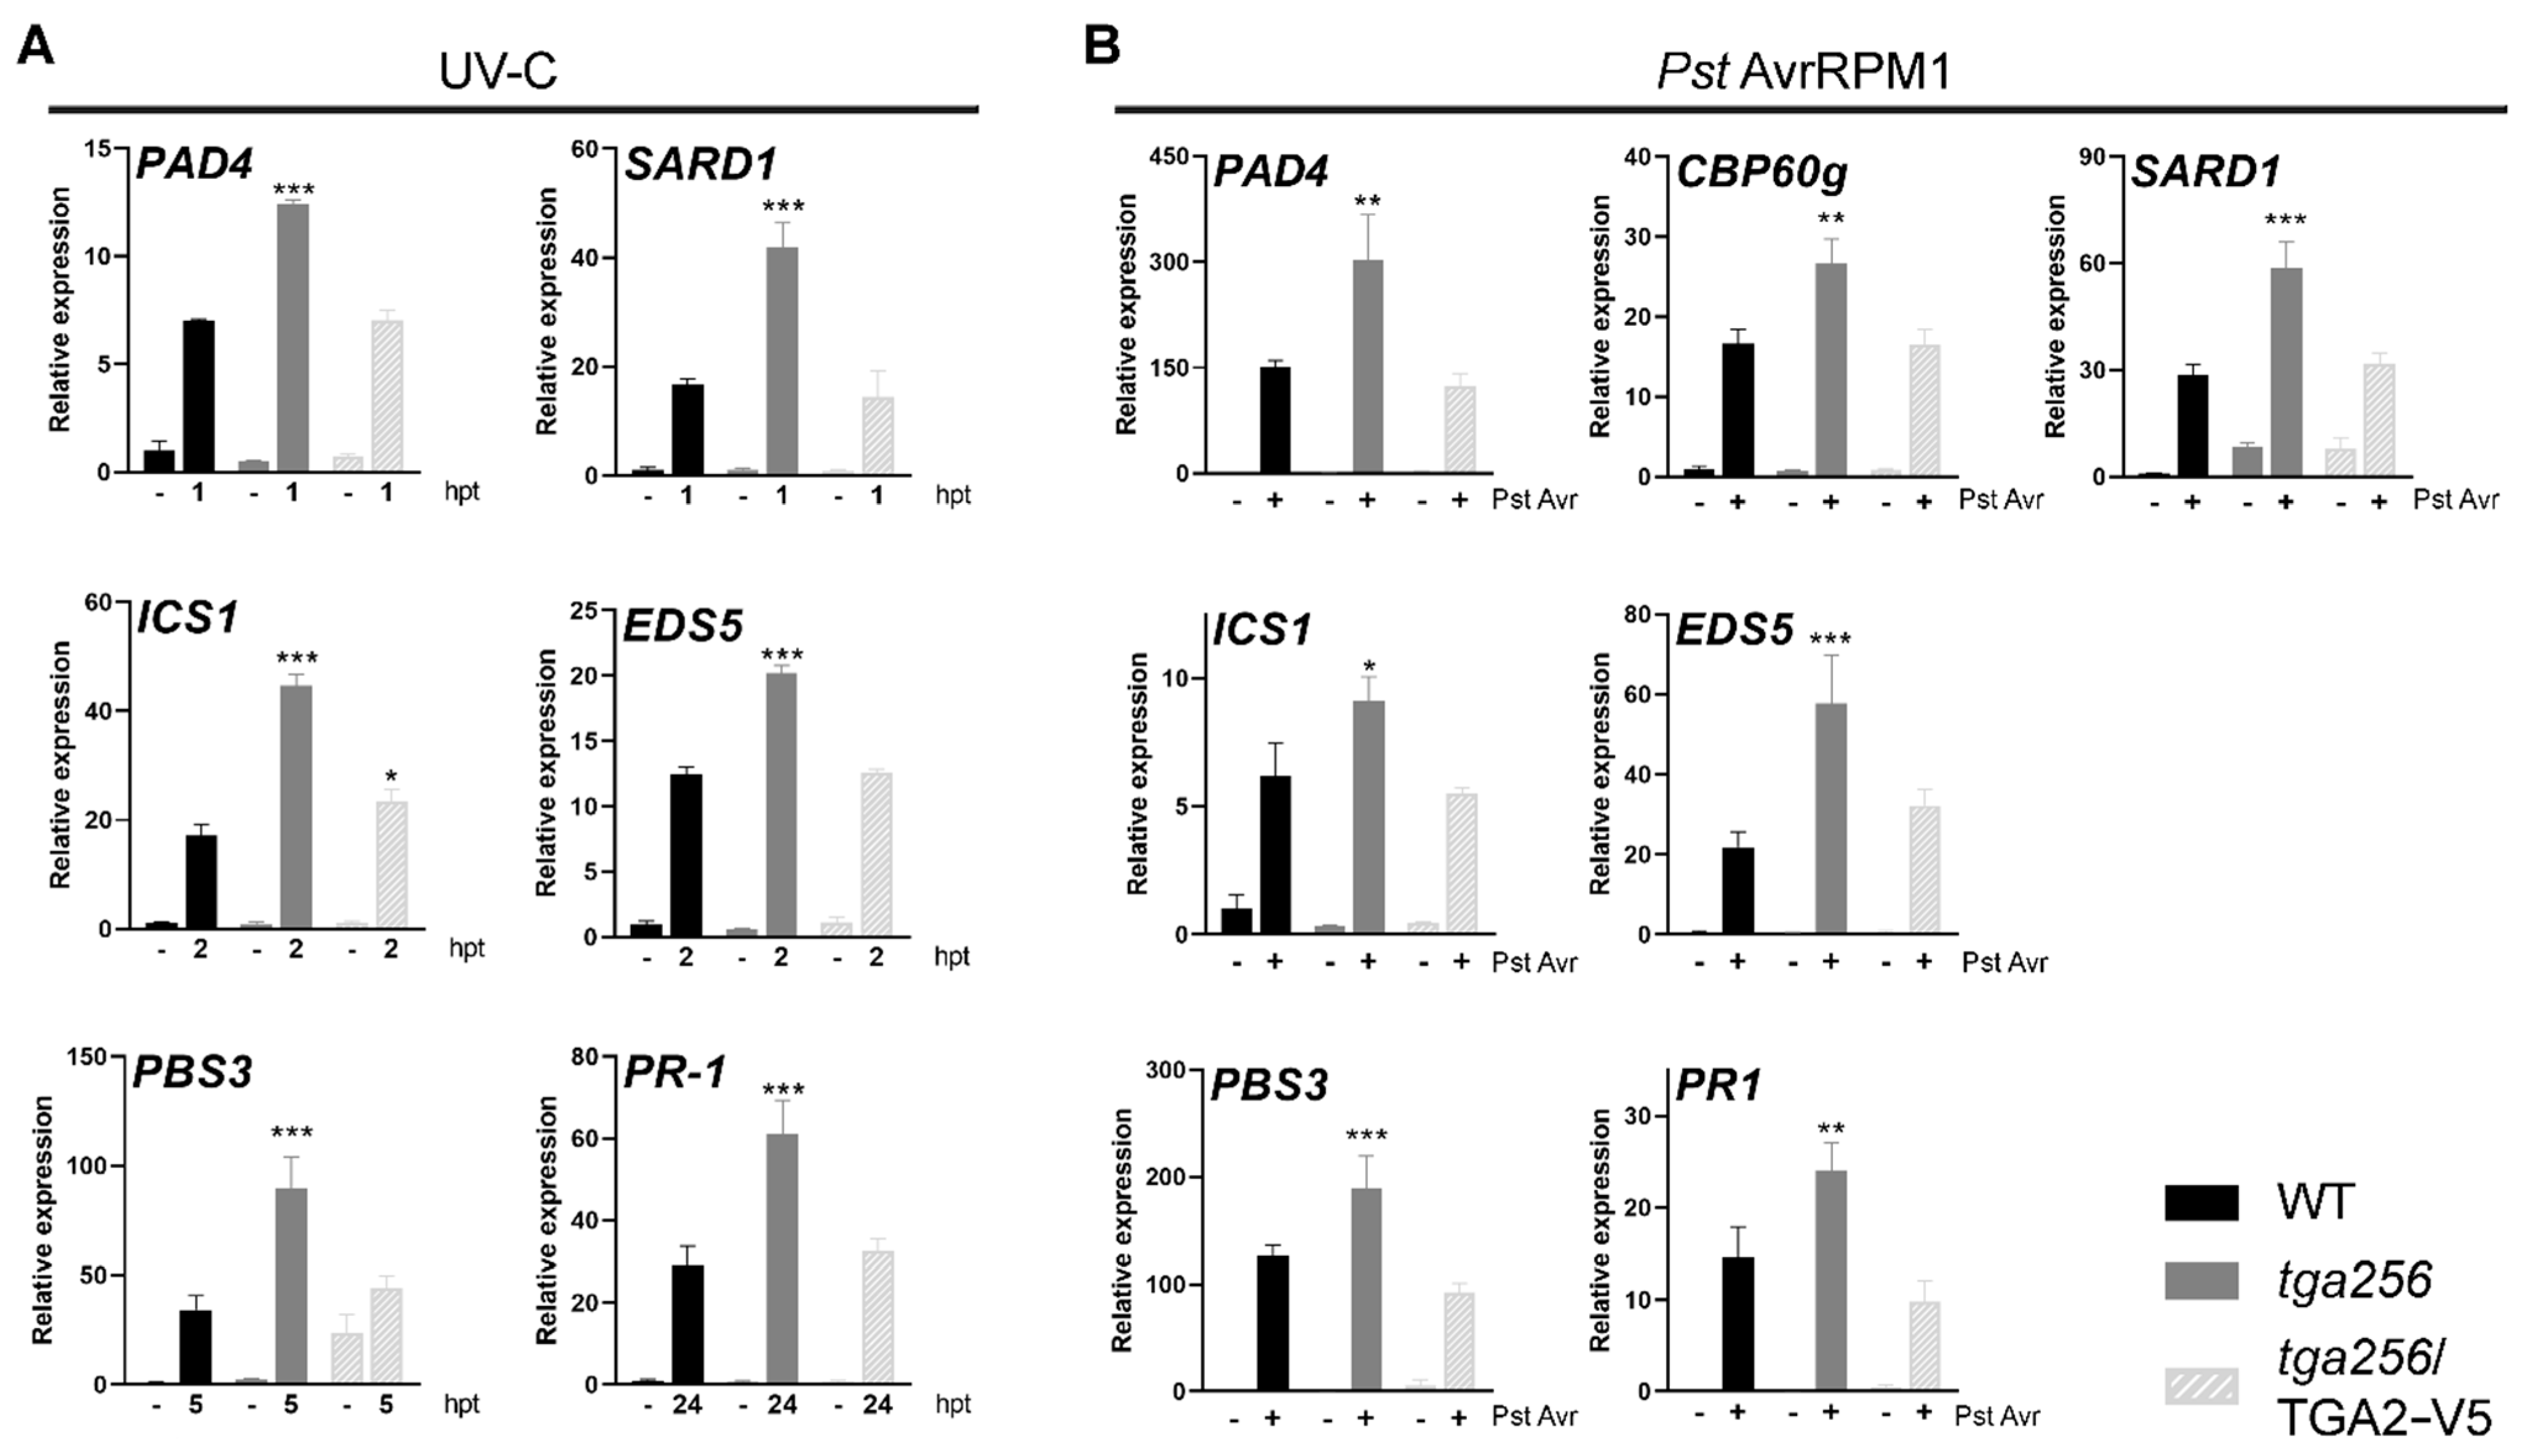
2.2. TGA2 Negatively Regulates the Expression of Isochorismate Pathway-Related Genes upon Stress
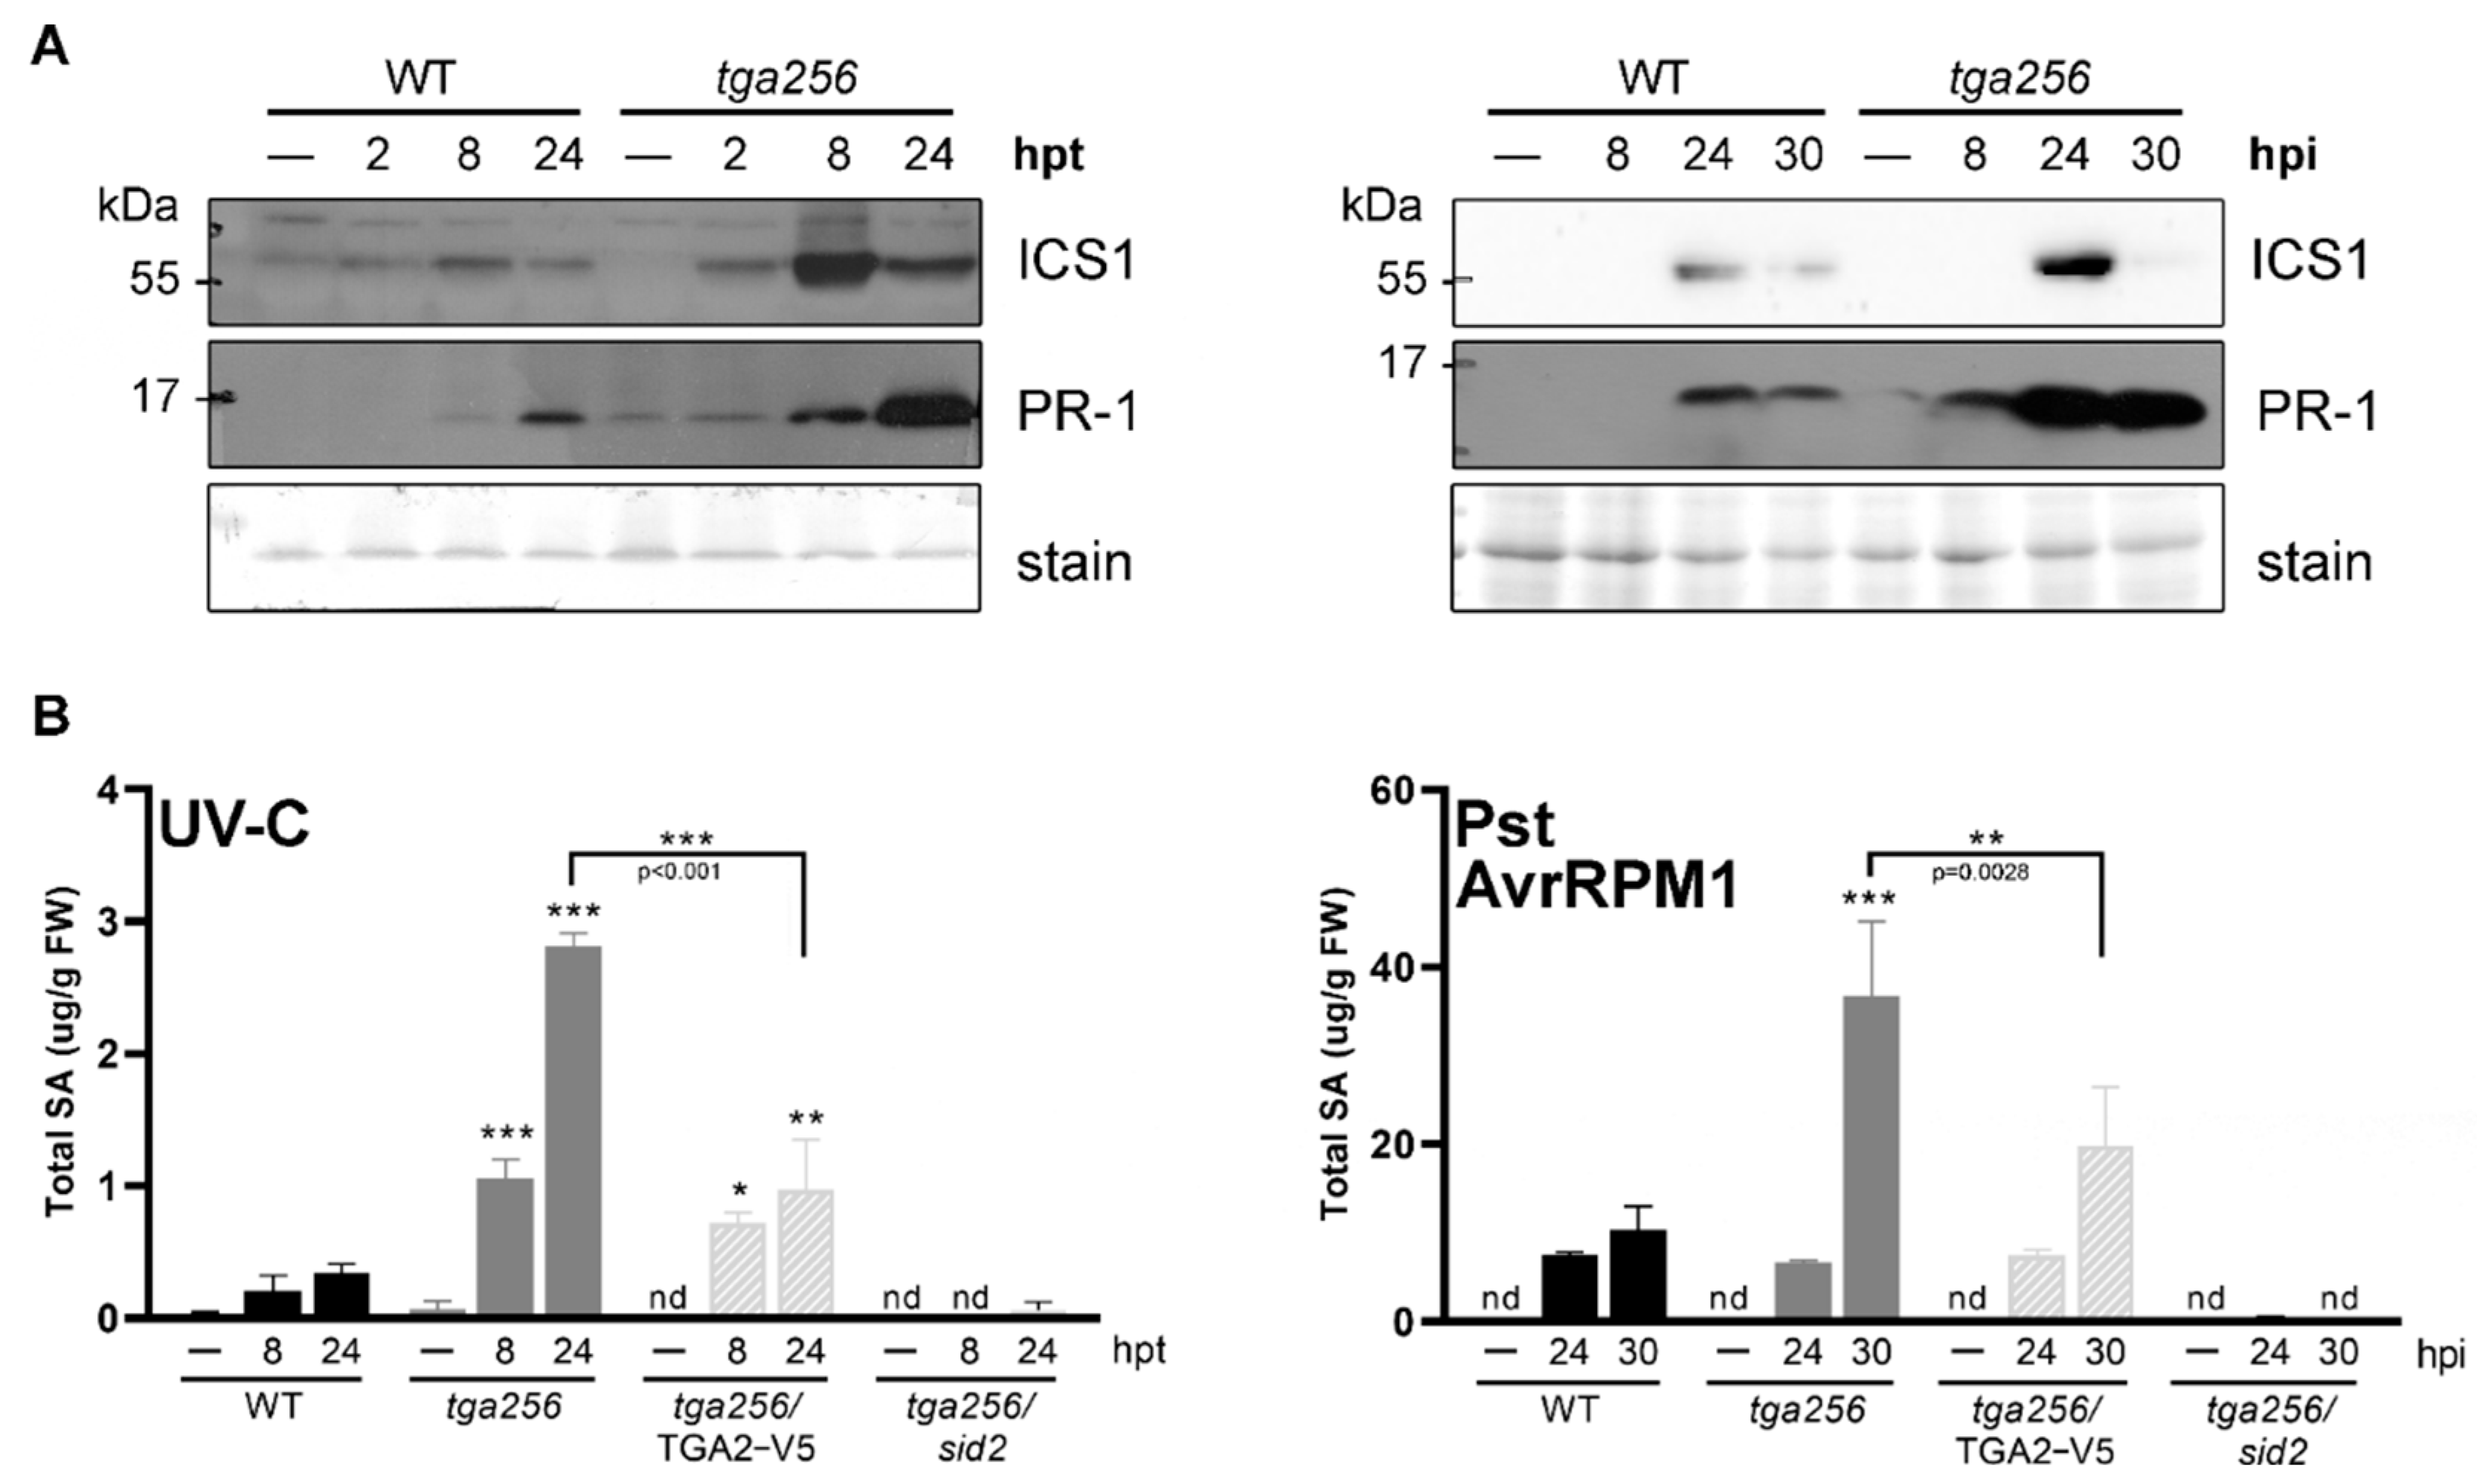
2.3. TGA2 Controls the Accumulation of ICS1 and SA under Stress
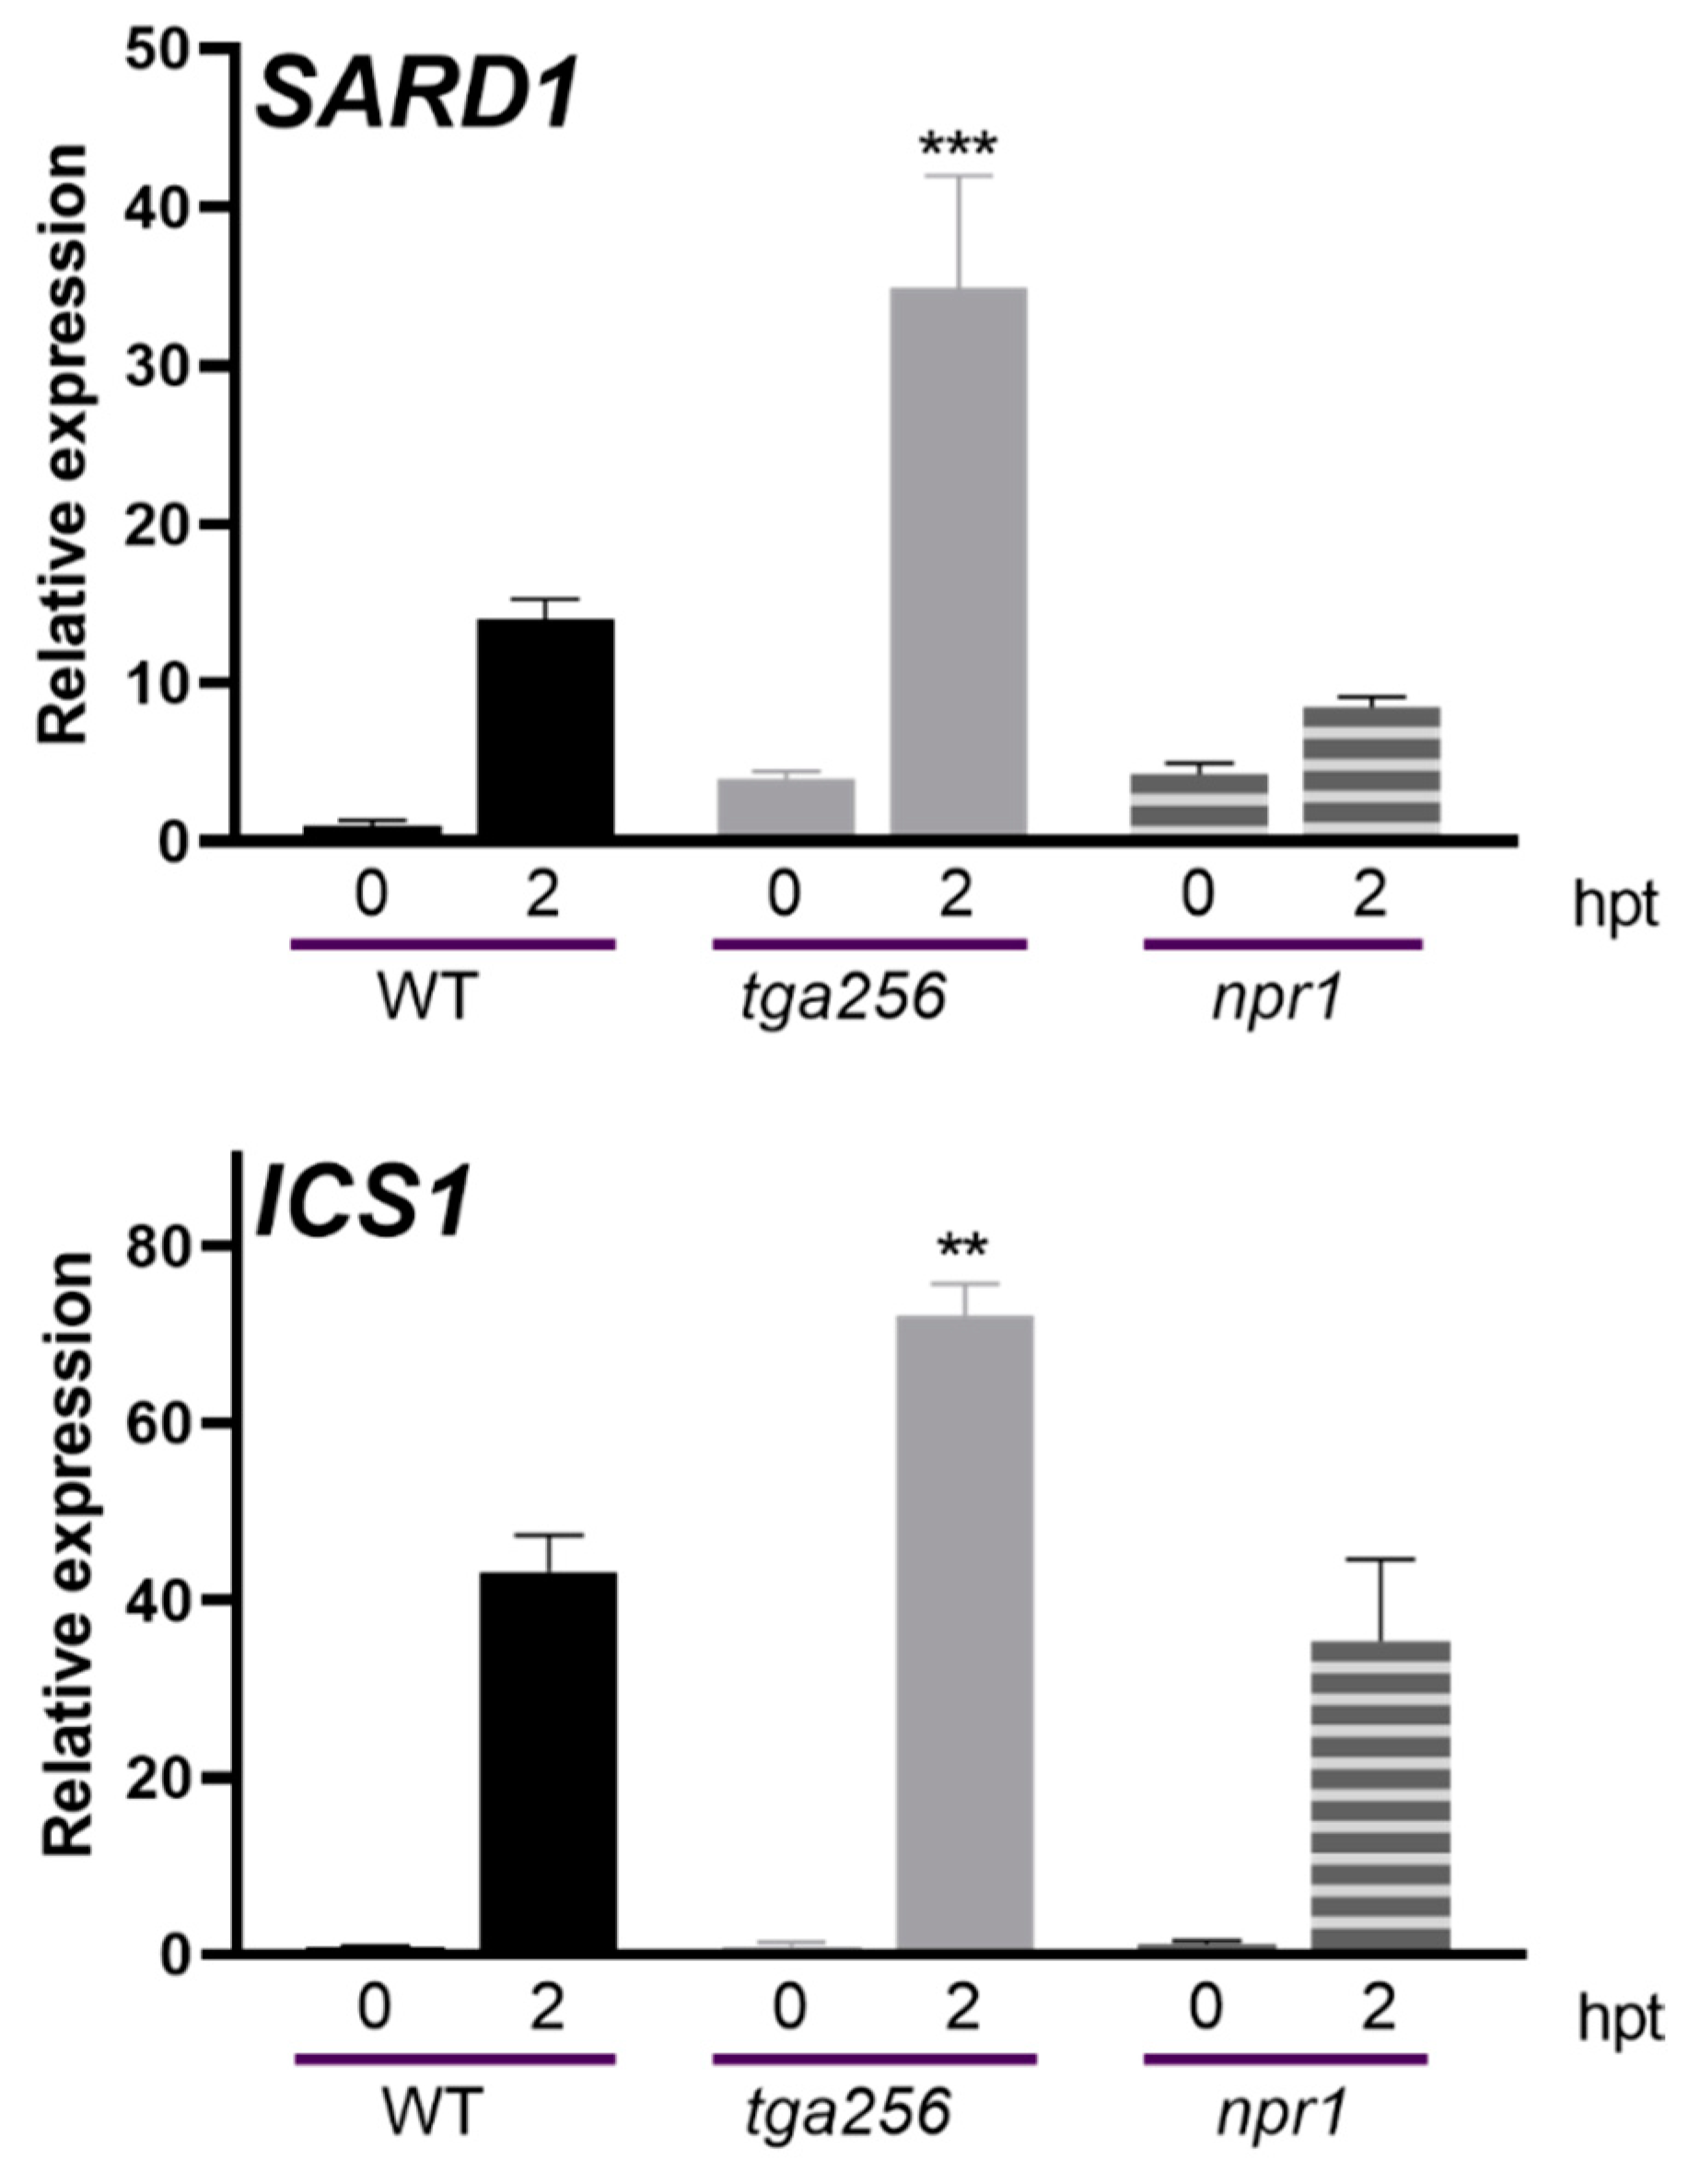
2.4. NPR1 Does Not Affect the Expression of IC Genes during Stress
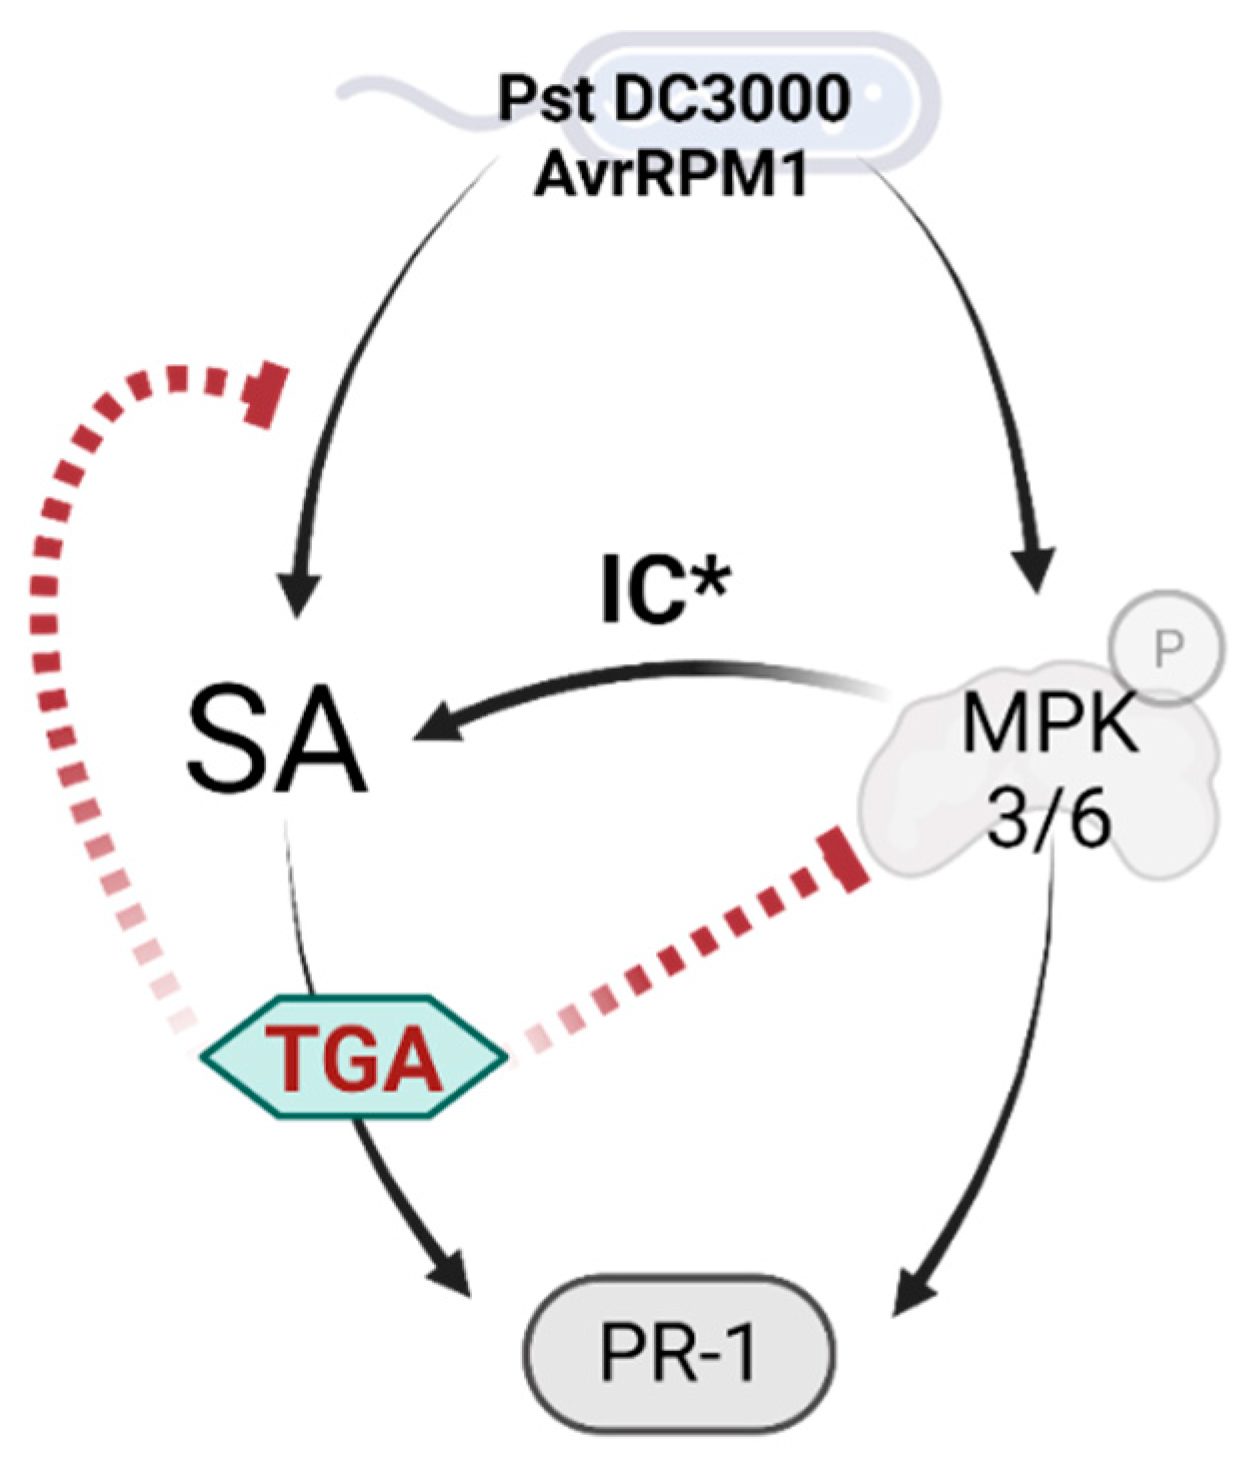
3. Discussion
4. Materials and Methods
4.1. Plant Growth Conditions and Treatments
4.2. Bacterial Strains and Plant Infections
4.3. Gene Expression Analysis
4.4. Protein Extracts and Immunoblot
4.5. Salicylic Acid Extraction and Quantitation
4.6. Genotyping
Supplementary Materials
Author Contributions
Funding
Institutional Review Board Statement
Informed Consent Statement
Data Availability Statement
Acknowledgments
Conflicts of Interest
References
- Yuan, M.; Ngou, B.P.M.; Ding, P.; Xin, X.F. PTI-ETI crosstalk: An integrative view of plant immunity. Curr. Opin. Plant Biol. 2021, 62, 102030. [Google Scholar] [CrossRef] [PubMed]
- Zhong, Q.; Hu, H.; Fan, B.; Zhu, C.; Chen, Z. Biosynthesis and roles of salicylic acid in balancing stress response and growth in plants. Int. J. Mol. Sci. 2021, 22, 11672. [Google Scholar] [CrossRef] [PubMed]
- Li, A.; Sun, X.; Liu, L. Action of Salicylic Acid on Plant Growth. Front. Plant Sci. 2022, 13, 878076. [Google Scholar] [CrossRef] [PubMed]
- Van Butselaar, T.; Van den Ackerveken, G. Salicylic acid steers the growth–immunity tradeoff. Trends Plant Sci. 2020, 25, 566–576. [Google Scholar] [CrossRef] [PubMed]
- Rate, D.N.; Cuenca, J.V.; Bowman, G.R.; Guttman, D.S.; Greenberg, J.T. The Gain-of-function arabidopsis acd6 mutant reveals novel regulation and function of the salicylic acid signaling pathway in controlling cell death, defenses, and cell growth. Plant Cell 1999, 11, 1695. [Google Scholar] [CrossRef] [PubMed] [Green Version]
- Bowling, S.A.; Clarke, J.D.; Liu, Y.; Klessig, D.F.; Dong, X. The cpr5 mutant of arabidopsis expresses both NPR1-dependent and NPR1-independent resistance. Plant Cell 1997, 9, 1573–1584. [Google Scholar] [CrossRef] [Green Version]
- Li, Y.; Yang, S.; Yang, H.; Hua, J. The TIR-NB-LRR gene SNC1 is regulated at the transcript level by multiple factors. Mol. Plant-Microbe Interact. 2007, 20, 1449–1456. [Google Scholar] [CrossRef] [Green Version]
- Scott, I.M.; Clarke, S.M.; Wood, J.E.; Mur, L.A.J. Salicylate accumulation inhibits growth at chilling temperature in Arabidopsis. Plant Physiol. 2004, 135, 1040–1049. [Google Scholar] [CrossRef] [Green Version]
- Pasternak, T.; Groot, E.P.; Kazantsev, F.V.; Teale, W.; Omelyanchuk, N.; Kovrizhnykh, V.; Palme, K.; Mironova, V.V. Salicylic acid affects root meristem patterning via auxin distribution in a concentration-dependent manner. Plant Physiol. 2019, 180, 1725–1739. [Google Scholar] [CrossRef]
- Bagautdinova, Z.Z.; Omelyanchuk, N.; Tyapkin, A.V.; Kovrizhnykh, V.V.; Lavrekha, V.V.; Zemlyanskaya, E.V. Salicylic acid in root growth and development. Int. J. Mol. Sci. 2022, 23, 2228. [Google Scholar] [CrossRef]
- Rong, D.; Luo, N.; Mollet, J.C.; Liu, X.; Yang, Z. Salicylic acid regulates pollen tip growth through an NPR3/NPR4-independent pathway. Mol. Plant 2016, 9, 1478–1491. [Google Scholar] [CrossRef] [PubMed] [Green Version]
- Peng, Y.; Yang, J.; Li, X.; Zhang, Y. Salicylic acid: Biosynthesis and signaling. Annu. Rev. Plant Biol. 2021, 72, 761–791. [Google Scholar] [CrossRef]
- Strawn, M.A.; Marr, S.K.; Inoue, K.; Inada, N.; Zubieta, C.; Wildermuth, M.C. Arabidopsis isochorismate synthase functional in pathogen-induced salicylate biosynthesis exhibits properties consistent with a role in diverse stress responses. J. Biol. Chem. 2007, 282, 5919–5933. [Google Scholar] [CrossRef] [Green Version]
- Wildermuth, M.C.; Dewdney, J.; Wu, G.; Ausubel, F.M. Erratum: Isochorismate synthase is required to synthesize salicylic acid for plant defence. Nature 2001, 417, 562–565. [Google Scholar] [CrossRef]
- Nawrath, C.; Heck, S.; Parinthawong, N.; Métraux, J.P. EDS5, an essential component of salicylic acid-dependent signaling for disease resistance in arabidopsis, is a member of the MATE transporter family. Plant Cell 2002, 14, 275–286. [Google Scholar] [CrossRef] [Green Version]
- Torrens-Spence, M.P.; Bobokalonova, A.; Carballo, V.; Glinkerman, C.M.; Pluskal, T.; Shen, A.; Weng, J.K. PBS3 and EPS1 Complete Salicylic Acid Biosynthesis from Isochorismate in Arabidopsis. Mol. Plant 2019, 12, 1577–1586. [Google Scholar] [CrossRef] [Green Version]
- Nawrath, C.; Métraux, J.P. Salicylic acid induction-deficient mutants of Arabidopsis express PR-2 and PR-5 and accumulate high levels of camalexin after pathogen inoculation. Plant Cell 1999, 11, 1393–1404. [Google Scholar] [CrossRef] [Green Version]
- Gatz, C. From pioneers to team players: TGA transcription factors provide a molecular link between different stress pathways. Mol. Plant-Microbe Interact. 2012, 26, 120926072258005. [Google Scholar] [CrossRef] [PubMed] [Green Version]
- Kesarwani, M.; Yoo, J.; Dong, X. Genetic interactions of TGA transcription factors in the regulation of pathogenesis-related genes and disease resistance in Arabidopsis. Plant Physiol. 2007, 144, 336–346. [Google Scholar] [CrossRef] [PubMed] [Green Version]
- Choi, J.; Huh, S.U.; Kojima, M.; Sakakibara, H.; Paek, K.H.; Hwang, I. The cytokinin-activated transcription factor ARR2 promotes plant immunity via TGA3/NPR1-dependent salicylic acid signaling in arabidopsis. Dev. Cell 2010, 19, 284–295. [Google Scholar] [CrossRef] [Green Version]
- Alvarez, J.M.; Riveras, E.; Vidal, E.A.; Gras, D.E.; Contreras-López, O.; Tamayo, K.P.; Aceituno, F.; Gómez, I.; Ruffel, S.; Lejay, L.; et al. Systems approach identifies TGA1 and TGA4 transcription factors as important regulatory components of the nitrate response of Arabidopsis thaliana roots. Plant J. 2014, 80, 1–13. [Google Scholar] [CrossRef] [PubMed]
- Shearer, H.L.; Cheng, Y.T.; Wang, L.; Liu, J.; Boyle, P.; Després, C.; Zhang, Y.; Li, X.; Fobert, P.R. Arabidopsis clade I TGA Transcription factors regulate plant defenses in an NPR1-independent fashion. Mol. Plant-Microbe Interact. 2012, 25, 1459–1468. [Google Scholar] [CrossRef] [PubMed] [Green Version]
- Sun, T.; Busta, L.; Zhang, Q.; Ding, P.; Jetter, R.; Zhang, Y. TGACG-BINDING FACTOR 1 (TGA1) and TGA4 regulate salicylic acid and pipecolic acid biosynthesis by modulating the expression of SYSTEMIC ACQUIRED RESISTANCE DEFICIENT 1 (SARD1) and CALMODULIN-BINDING PROTEIN 60g (CBP60g). New Phytol. 2018, 217, 344–354. [Google Scholar] [CrossRef] [Green Version]
- Wang, L.; Tsuda, K.; Truman, W.; Sato, M.; Nguyen, L.V.; Katagiri, F.; Glazebrook, J. CBP60g and SARD1 play partially redundant critical roles in salicylic acid signaling. Plant J. 2011, 67, 1029–1041. [Google Scholar] [CrossRef]
- Mueller, S.; Hilbert, B.; Dueckershoff, K.; Roitsch, T.; Krischke, M.; Mueller, M.J.; Berger, S. General detoxification and stress responses are mediated by oxidized lipids through TGA transcription factors in Arabidopsis. Plant Cell 2008, 20, 768–785. [Google Scholar] [CrossRef] [Green Version]
- Stotz, H.U.; Mueller, S.; Zoeller, M.; Mueller, M.J.; Berger, S. TGA transcription factors and jasmonate-independent COI1 signalling regulate specific plant responses to reactive oxylipins. J. Exp. Bot. 2013, 64, 963–975. [Google Scholar] [CrossRef]
- Huang, L.J.; Li, N.; Thurow, C.; Wirtz, M.; Hell, R.; Gatz, C. Ectopically expressed glutaredoxin ROXY19 negatively regulates the detoxification pathway in Arabidopsis thaliana. BMC Plant Biol. 2016, 16, 200. [Google Scholar] [CrossRef] [Green Version]
- Herrera-Vásquez, A.; Fonseca, A.; Ugalde, J.M.; Lamig, L.; Seguel, A.; Moyano, T.C.; Gutiérrez, R.A.; Salinas, P.; Vidal, E.A.; Holuigue, L. TGA class II transcription factors are essential to restrict oxidative stress in response to UV-B stress in Arabidopsis. J. Exp. Bot. 2021, 72, 1891–1905. [Google Scholar] [CrossRef] [PubMed]
- Zhang, Y.; Tessaro, M.J.; Lassner, M.; Li, X. Knockout analysis of Arabidopsis transcription factors TGA2, TGA5, and TGA6 reveals their redundant and essential roles in Systemic Acquired Resistance. Plant Cell 2003, 15, 2647–2653. [Google Scholar] [CrossRef] [Green Version]
- Durrant, W.E.; Dong, X. Systemic acquired resistance. Annu. Rev. Phytopathol. 2004, 42, 185–209. [Google Scholar] [CrossRef] [PubMed]
- Blanco, F.; Salinas, P.; Cecchini, N.M.; Jordana, X.; Van Hummelen, P.; Alvarez, M.E.; Holuigue, L. Early genomic responses to salicylic acid in Arabidopsis. Plant Mol. Biol. 2009, 70, 79–102. [Google Scholar] [CrossRef] [PubMed] [Green Version]
- Shapiro, A.D.; Zhang, C. The role of NDR1 in avirulence gene-directed signaling and control of programmed cell death in Arabidopsis. Plant Physiol. 2001, 127, 1089–1101. [Google Scholar] [CrossRef] [PubMed]
- Kiefer, I.W.; Slusarenko, A.J. The pattern of systemic acquired resistance induction within the Arabidopsis rosette in relation to the pattern of translocation. Plant Physiol. 2003, 132, 840–847. [Google Scholar] [CrossRef] [PubMed] [Green Version]
- Deng, W.L.; Preston, G.; Collmer, A.; Chang, C.J.; Huang, H.C. Characterization of the hrpC and hrpRS operons of Pseudomonas syringae pathovars syringae, tomato, and glycinea and analysis of the ability of hrpF, hrpG, hrcC, hrpT, and hrpV mutants to elicit the hypersen. J. Bacteriol. 1998, 180, 4523–4531. [Google Scholar] [CrossRef] [Green Version]
- Whalen, M.C.; Innes, R.W.; Bent, A.F.; Staskawicz, B.J. Identification of Pseudomonas syringae pathogens of Arabidopsis and a bacterial locus determining avirulence on both Arabidopsis and soybean. Plant Cell 1991, 3, 49–59. [Google Scholar] [CrossRef]
- Breen, S.; Williams, S.J.; Outram, M.; Kobe, B.; Solomon, P.S. Emerging Insights into the Functions of Pathogenesis-Related Protein 1. Trends Plant Sci. 2017, 22, 871–879. [Google Scholar] [CrossRef] [PubMed]
- Wiermer, M.; Feys, B.J.; Parker, J.E. Plant immunity: The EDS1 regulatory node. Curr. Opin. Plant Biol. 2005, 8, 383–389. [Google Scholar] [CrossRef] [PubMed] [Green Version]
- Garcion, C.; Lohmann, A.; Lamodière, E.; Catinot, J.; Buchala, A.; Doermann, P.; Métraux, J.P. Characterization and biological function of the Isochorismate Synthase2 gene of Arabidopsis. Plant Physiol. 2008, 147, 1279–1287. [Google Scholar] [CrossRef] [PubMed] [Green Version]
- Seguel, A.; Jelenska, J.; Herrera-Vásquez, A.; Marr, S.K.; Joyce, M.B.; Gagesch, K.R.; Shakoor, N.; Jiang, S.C.; Fonseca, A.; Wildermuth, M.C.; et al. PROHIBITIN3 forms complexes with ISOCHORISMATE SYNTHASE1 to regulate stress-induced salicylic acid biosynthesis in arabidopsis. Plant Physiol. 2018, 176, 2515–2531. [Google Scholar] [CrossRef] [Green Version]
- Dong, X. NPR1, all things considered. Curr. Opin. Plant Biol. 2004, 7, 547–552. [Google Scholar] [CrossRef]
- Backer, R.; Naidoo, S.; van den Berg, N. The Nonexpressor of Pathogenesis-Related Genes 1 (NPR1) and related family: Mechanistic insights in plant disease resistance. Front. Plant Sci. 2019, 10, 1–21. [Google Scholar] [CrossRef] [PubMed] [Green Version]
- Wu, Y.; Zhang, D.; Chu, J.Y.; Boyle, P.; Wang, Y.; Brindle, I.D.; De Luca, V.; Despre, C. Report The Arabidopsis NPR1 Protein Is a Receptor for the Plant Defense Hormone Salicylic Acid. Cell Rep. 2012, 1, 639–647. [Google Scholar] [CrossRef] [Green Version]
- Johnson, C.; Boden, E.; Arias, J. Salicylic acid and NPR1 induce the recruitment of trans-activating TGA factors to a defense gene promoter in Arabidopsis. Plant Cell 2003, 15, 1846–1858. [Google Scholar] [CrossRef] [PubMed] [Green Version]
- Tsuda, K.; Mine, A.; Bethke, G.; Igarashi, D.; Botanga, C.J.; Tsuda, Y.; Glazebrook, J.; Sato, M.; Katagiri, F. Dual Regulation of Gene Expression Mediated by Extended MAPK Activation and Salicylic Acid Contributes to Robust Innate Immunity in Arabidopsis thaliana. PLoS Genet. 2013, 9, e1004015. [Google Scholar] [CrossRef]
- Lang, J.; Genot, B.; Bigeard, J.; Colcombet, J. MPK3 and MPK6 control salicylic acid signaling by up-regulating NLR receptors during pattern- and effector-triggered immunity. J. Exp. Bot. 2022, 73, 2190–2205. [Google Scholar] [CrossRef] [PubMed]
- Hussain, R.M.F.; Sheikh, A.H.; Haider, I.; Quareshy, M.; Linthorst, H.J.M. Arabidopsis WRKY50 and TGA transcription factors synergistically activate expression of PR1. Front. Plant Sci. 2018, 9, 930. [Google Scholar] [CrossRef] [Green Version]
- Lang, J.; Genot, B.; Hirt, H.; Colcombet, J. Constitutive activity of the Arabidopsis MAP Kinase 3 confers resistance to Pseudomonas syringae and drives robust immune responses. Plant Signal. Behav. 2017, 12, e1356533. [Google Scholar] [CrossRef] [PubMed] [Green Version]
- Fan, W.; Dong, X. In vivo interaction between NPR1 and transcription factor TGA2 leads to salicylic acid-mediated gene activation in Arabidopsis. Plant Cell 2002, 14, 1377–1389. [Google Scholar] [CrossRef] [PubMed] [Green Version]
- Rochon, A.; Boyle, P.; Wignes, T.; Fobert, P.R.; Després, C. The coactivator function of Arabidopsis NPR1 requires the core of its BTB/POZ domain and the oxidation of C-terminal cysteines. Plant Cell 2006, 18, 3670–3685. [Google Scholar] [CrossRef] [Green Version]
- Fode, B.; Siemsen, T.; Thurow, C.; Weigel, R.; Gatz, C. The arabidopsis GRAS protein SCL14 interacts with class II TGA transcription factors and is essential for the activation of stress-inducible promoters. Plant Cell 2008, 20, 3122–3135. [Google Scholar] [CrossRef] [Green Version]
- Chen, H.; Xue, L.; Chintamanani, S.; Germain, H.; Lin, H.; Cui, H.; Cai, R.; Zuo, J.; Tang, X.; Li, X.; et al. ETHYLENE INSENSITIVE3 and ETHYLENE INSENSITIVE3-LIKE1 repress SALICYLIC ACID INDUCTION DEFICIENT2 expression to negatively regulate plant innate immunity in Arabidopsis. Plant Cell 2009, 21, 2527–2540. [Google Scholar] [CrossRef] [PubMed] [Green Version]
- Dempsey, D.A.; Vlot, A.C.; Wildermuth, M.C.; Klessig, D.F. Salicylic Acid Biosynthesis and Metabolism. Arab. Book 2011, 9, e0156. [Google Scholar] [CrossRef] [Green Version]
- Rajjou, L.; Belghazi, M.; Huguet, R.; Robin, C.; Moreau, A.; Job, C.; Job, D. Proteomic investigation of the effect of salicylic acid on arabidopsis seed germination and establishment of early defense mechanisms. Plant Physiol. 2006, 141, 910–923. [Google Scholar] [CrossRef] [PubMed] [Green Version]
- Zhang, Y.J.; Zhao, L.; Zhao, J.Z.; Li, Y.J.; Wang, J.; Guo, R.; Gan, S.S.; Liu, C.J.; Zhanga, K.W. S5H/DMR6 encodes a salicylic acid 5-hydroxylase that fine-tunes salicylic acid homeostasis. Plant Physiol. 2017, 175, 1082–1093. [Google Scholar] [CrossRef] [PubMed] [Green Version]
- Van Wersch, R.; Li, X.; Zhang, Y. Mighty dwarfs: Arabidopsis autoimmune mutants and their usages in genetic dissection of plant immunity. Front. Plant Sci. 2016, 7, 1717. [Google Scholar] [CrossRef] [Green Version]
- Cao, H.; Bowling, S.A.; Gordon, A.S.; Dong, X. Characterization of an Arabidopsis mutant that is nonresponsive to inducers of systemic acquired resistance. Plant Cell 1994, 6, 1583–1592. [Google Scholar] [CrossRef] [PubMed]
- Kim, M.G.; Geng, X.; Lee, S.Y.; Mackey, D. The Pseudomonas syringae type III effector AvrRpm1 induces significant defenses by activating the Arabidopsis nucleotide-binding leucine-rich repeat protein RPS2. Plant J. 2009, 57, 645–653. [Google Scholar] [CrossRef]
- Yuan, J.; He, S.Y. The Pseudomonas syringae Hrp regulation and secretion system controls the production and secretion of multiple extracellular proteins. J. Bacteriol. 1996, 178, 6399–6402. [Google Scholar] [CrossRef] [Green Version]
- Verberne, M.C.; Brouwer, N.; Delbianco, F.; Linthorst, H.J.M.; Bol, J.F.; Verpoorte, R. Method for the extraction of the volatile compound salicylic acid from tobacco leaf material. Phytochem. Anal. 2002, 13, 45–50. [Google Scholar] [CrossRef]


Publisher’s Note: MDPI stays neutral with regard to jurisdictional claims in published maps and institutional affiliations. |
© 2022 by the authors. Licensee MDPI, Basel, Switzerland. This article is an open access article distributed under the terms and conditions of the Creative Commons Attribution (CC BY) license (https://creativecommons.org/licenses/by/4.0/).
Share and Cite
Fonseca, A.; Urzúa, T.; Jelenska, J.; Sbarbaro, C.; Seguel, A.; Duarte, Y.; Greenberg, J.T.; Holuigue, L.; Blanco-Herrera, F.; Herrera-Vásquez, A. The TGA Transcription Factors from Clade II Negatively Regulate the Salicylic Acid Accumulation in Arabidopsis. Int. J. Mol. Sci. 2022, 23, 11631. https://doi.org/10.3390/ijms231911631
Fonseca A, Urzúa T, Jelenska J, Sbarbaro C, Seguel A, Duarte Y, Greenberg JT, Holuigue L, Blanco-Herrera F, Herrera-Vásquez A. The TGA Transcription Factors from Clade II Negatively Regulate the Salicylic Acid Accumulation in Arabidopsis. International Journal of Molecular Sciences. 2022; 23(19):11631. https://doi.org/10.3390/ijms231911631
Chicago/Turabian StyleFonseca, Alejandro, Tomás Urzúa, Joanna Jelenska, Christopher Sbarbaro, Aldo Seguel, Yorley Duarte, Jean T. Greenberg, Loreto Holuigue, Francisca Blanco-Herrera, and Ariel Herrera-Vásquez. 2022. "The TGA Transcription Factors from Clade II Negatively Regulate the Salicylic Acid Accumulation in Arabidopsis" International Journal of Molecular Sciences 23, no. 19: 11631. https://doi.org/10.3390/ijms231911631