Article

Prognostic and Immunological Role of STK38 across Cancers: Friend or Foe?

1
Department of Urology, Xiang’an Hospital of Xiamen University, School of Medicine, Xiamen University, Xiamen 361101, China
2
Central Laboratory, Xiang’an Hospital of Xiamen University, School of Medicine, Xiamen University, Xiamen 361101, China
*
Authors to whom correspondence should be addressed.
These authors contribute equally to this work.
Int. J. Mol. Sci. 2022, 23(19), 11590; https://doi.org/10.3390/ijms231911590
Submission received: 22 August 2022 / Revised: 25 September 2022 / Accepted: 26 September 2022 / Published: 30 September 2022
(This article belongs to the Special Issue Cancer Biomarkers and Bioinformatics)

Abstract

:
Although STK38 (serine-threonine kinase 38) has been proven to play an important role in cancer initiation and progression based on a series of cell and animal experiments, no systemic assessment of STK38 across human cancers is available. We firstly performed a pan-cancer analysis of STK38 in this study. The expression level of STK38 was significantly different between tumor and normal tissues in 15 types of cancers. Meanwhile, a prognosis analysis showed that a distinct relationship existed between STK38 expression and the clinical prognosis of cancer patients. Furthermore, the expression of STK38 was related to the infiltration of immune cells, such as NK cells, memory CD4+ T cells, mast cells and cancer-associated fibroblasts in a few cancers. There were three immune-associated signaling pathways involved in KEGG analysis of STK38. In general, STK38 shows a significant prognostic value in different cancers and is closely associated with cancer immunity.

1. Introduction

Cancer is a leading cause of death and contributes to the poor quality of life of patients in many countries worldwide, and the incidence and mortality of it are significantly elevated globally [1]. Although we have made great efforts in the early diagnosis and the treatment of multiple cancers to decrease the incidence rate, the mortality of malignant tumors still has a high value [2]. Phenotypic and genetic alterations in cancer cells contribute to tumor heterogeneity and therapy resistance. Moreover, the same gene may play disparate roles across different cancers [3]. Therefore, an integrative pan-cancer analysis of cancer-related genes is essential for understanding their roles in cancer progression. The tumor microenvironment (TME) is an essential part of cancer. Novel targets of the TME have been demonstrated that can strengthen the effect of a variety of cancer therapies, particularly immunotherapies which work by promoting the host’s antitumor immune responses [4]. The TME is a sophisticated and multilevel network of interactions between cancer cells and the surrounding components, including immune cells, endothelial cells, fibroblasts and stromal cells. Immune cells play a pivotal role when they are compared with other cellular components. The dynamic tumor-immune cell interactions can secrete cytokines and growth factors, thereby contributing to tumor cell proliferation, metastasis and the inhibition of an antitumor immunity response [5,6]. Hence, exploring the relationship between gene expression and immune cell infiltration can help us to find potential immunotherapy targets.
As members of a subgroup of the AGC (protein kinase A/G/C, PKA/PKG/PKC-like) group of protein kinases, the NDR (nuclear Dbf2-related)/LATS (large tumor suppressor) family of kinases have drawn much attention in the past few years. As four members of the NDR/LATS protein kinase family, NDR1 (STK38), NDR2 (STK38L), LATS1 and LATS2 are encoded by the mammalian genome. Like most AGC protein kinases, the NDR/LATS family sequences are highly conserved from yeast to humans. In yeast and invertebrates, the NDR/LATS family play an independent role in the regulation of an extensive cellular processes, including apoptosis and cell proliferation [7,8]. Emerging studies have demonstrated that yeast NDR/LATS kinases are involved in controlling the mitotic exit network and septation initiation network in budding and fission yeast, respectively. In Drosophila melanogaster, the fly NDR/LATS kinases are involved in the regulation of neurite outgrowth and morphology [9]. In mammals, four NDR/LATS kinases can manifest overlapping or completely different functions.
STK38 (serine-threonine kinase 38) was originally found in the nuclei, while past studies demonstrated that it was also a cytoplasmic kinase [10]. Three significant structures were found in the STK38 protein, including a central kinase catalytic domain, a conserved N-terminal regulatory domain (NTR) and a C-terminal hydrophobic motif. As a protein kinase, STK38 has been proved to regulate various biological processes, including DNA damage responses, centrosome duplication, cell cycle progression and apoptosis [11]. Furthermore, previous studies have also demonstrated that STK38 participants in neurodevelopment [12], embryonic development [13], and cancer biology [14]. STK38 plays inconsistent roles in different cancers. Some studies have demonstrated the oncogenic potential of the STK38 gene in progressive ductal carcinoma in situ in the breast tissue [15], lung adenocarcinoma [16,17] and ovarian cancer [18]. On the contrary, STK38 could reduce the proliferation and colony formation of glioblastomas [19]. STK38 was also discovered to inhibit the metastasis of prostate cancer both in vitro and in vivo [20].

2. Results

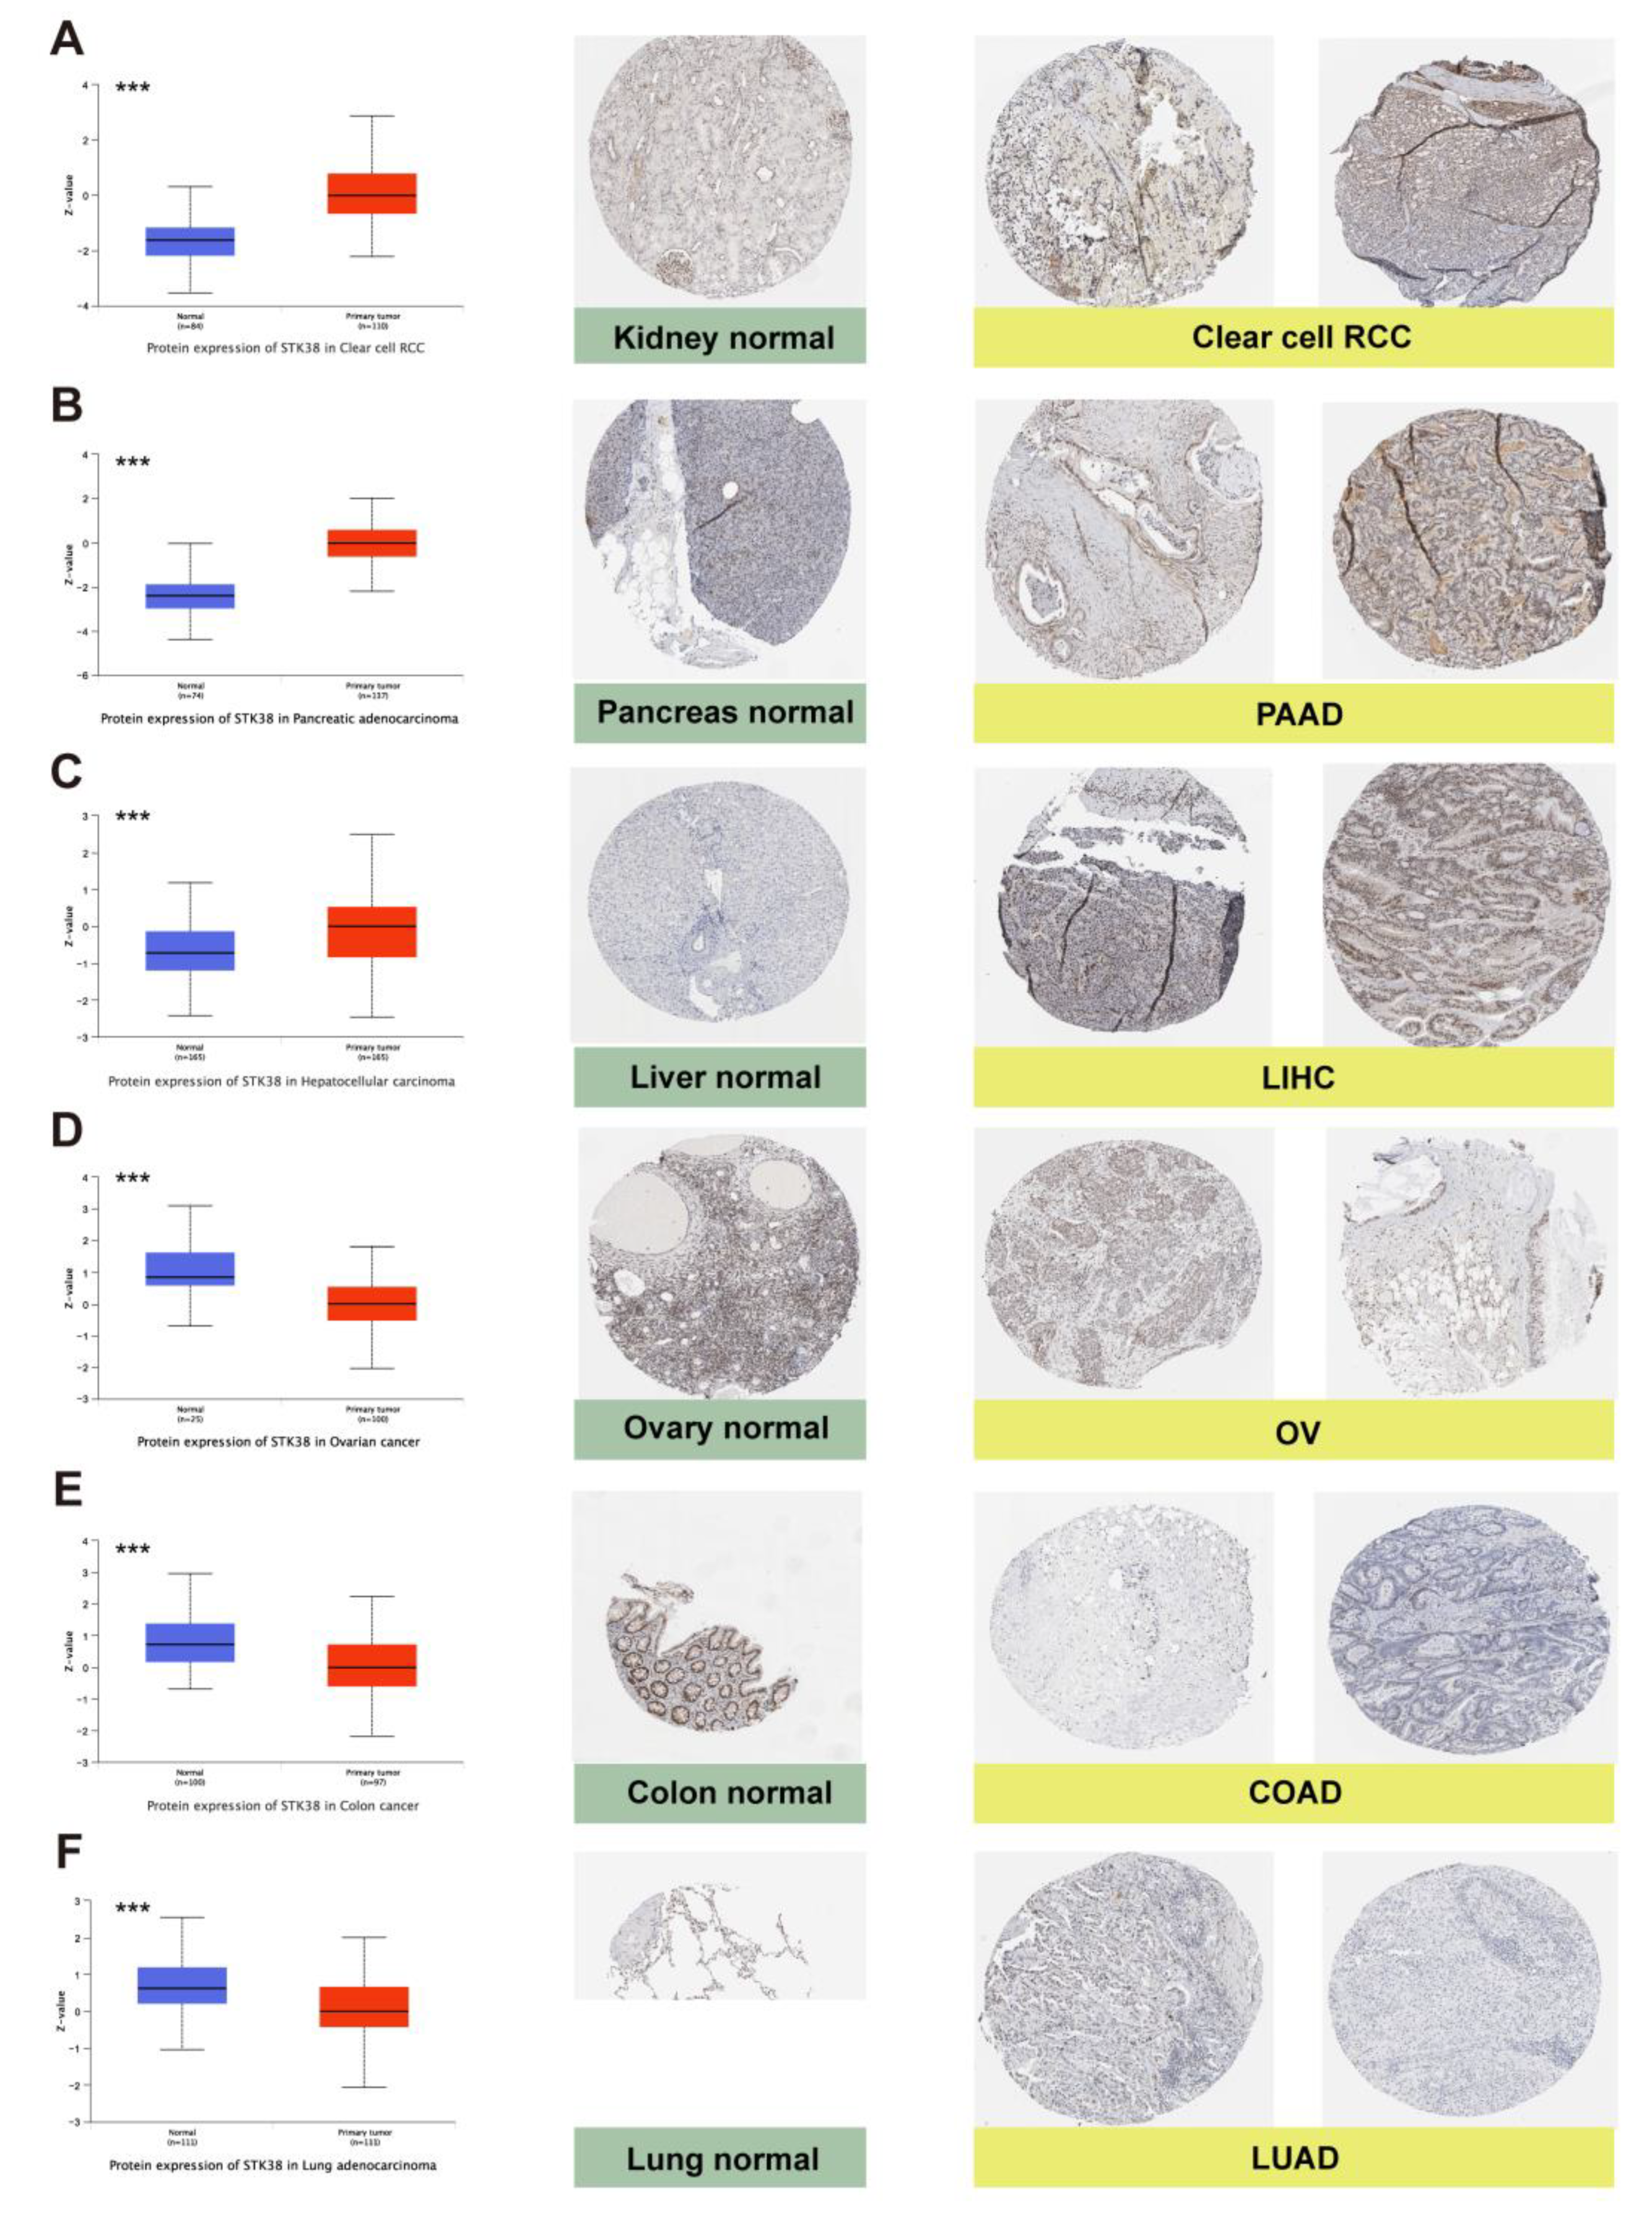
2.1. STK38 Expression Analysis in Human Normal Tissues and Cancers

In our study, we intended to perform a comprehensive analysis of STK38 in various cancers. In our initial analysis, the phylogenetic tree was made to explore evolutionary relationship of the STK38 protein across the studied species (Figure S1). To explore the expression difference of STK38 between cancer tissues and normal tissues, we used the TIMER2.0 web tool. As displayed in Figure 1A, the STK38 expression was upregulated in cholangiocarcinoma (CHOL), esophageal carcinoma (ESCA), glioblastoma multiforme (GBM), kidney renal papillary cell carcinoma (KIRP), liver hepatocellular carcinoma (LIHC), lung adenocarcinoma (LUAD), lung squamous cell carcinoma (LUSC), stomach adenocarcinoma (STAD) and uterine corpus endometrial carcinoma (UCEC). On the contrary, a low expression of STK38 was discovered in four cancers: breast invasive carcinoma (BRCA), kidney chromophobe (KICH), colon adenocarcinoma (COAD) and prostate adenocarcinoma (PRAD). Notably, the STK38 expression in skin cutaneous melanoma (SKCM) primary tissue was lower than it was in the respective metastatic tumor tissue.
The “Pathological Stage Plot” module from GEPIA2 was used to analyze the relationship between STK38 expression and the pathological staging in different tumors, which demonstrated that there were significant stage-specific expressional changes in some cancers including adrenocortical carcinoma (ACC), LIHC, ovarian serous cystadenocarcinoma (OV), pancreatic adenocarcinoma (PAAD), thyroid carcinoma (THCA), UCEC, SKCM (Figure 1B, all p < 0.05), while in other cancers, we found no clear relationship.
In addition to the transcription, we also used the UALCAN portal to assess the STK38 protein expression in different cancers based on the CPTAC dataset. The expression of the STK38 total proteins was upregulated in PAAD, ccRCC, and LIHC when they were compared to that of the normal samples. A lower STK38 expression in the tumors was discovered in ovarian cancer, COAD and LUAD. Moreover, we further evaluated the IHC results from the HPA and combined the results with the STK38 protein expression profile from the CPTAC. As displayed in Figure 2, the results from the HPA analysis were consistent with those from the CPTAC analysis.

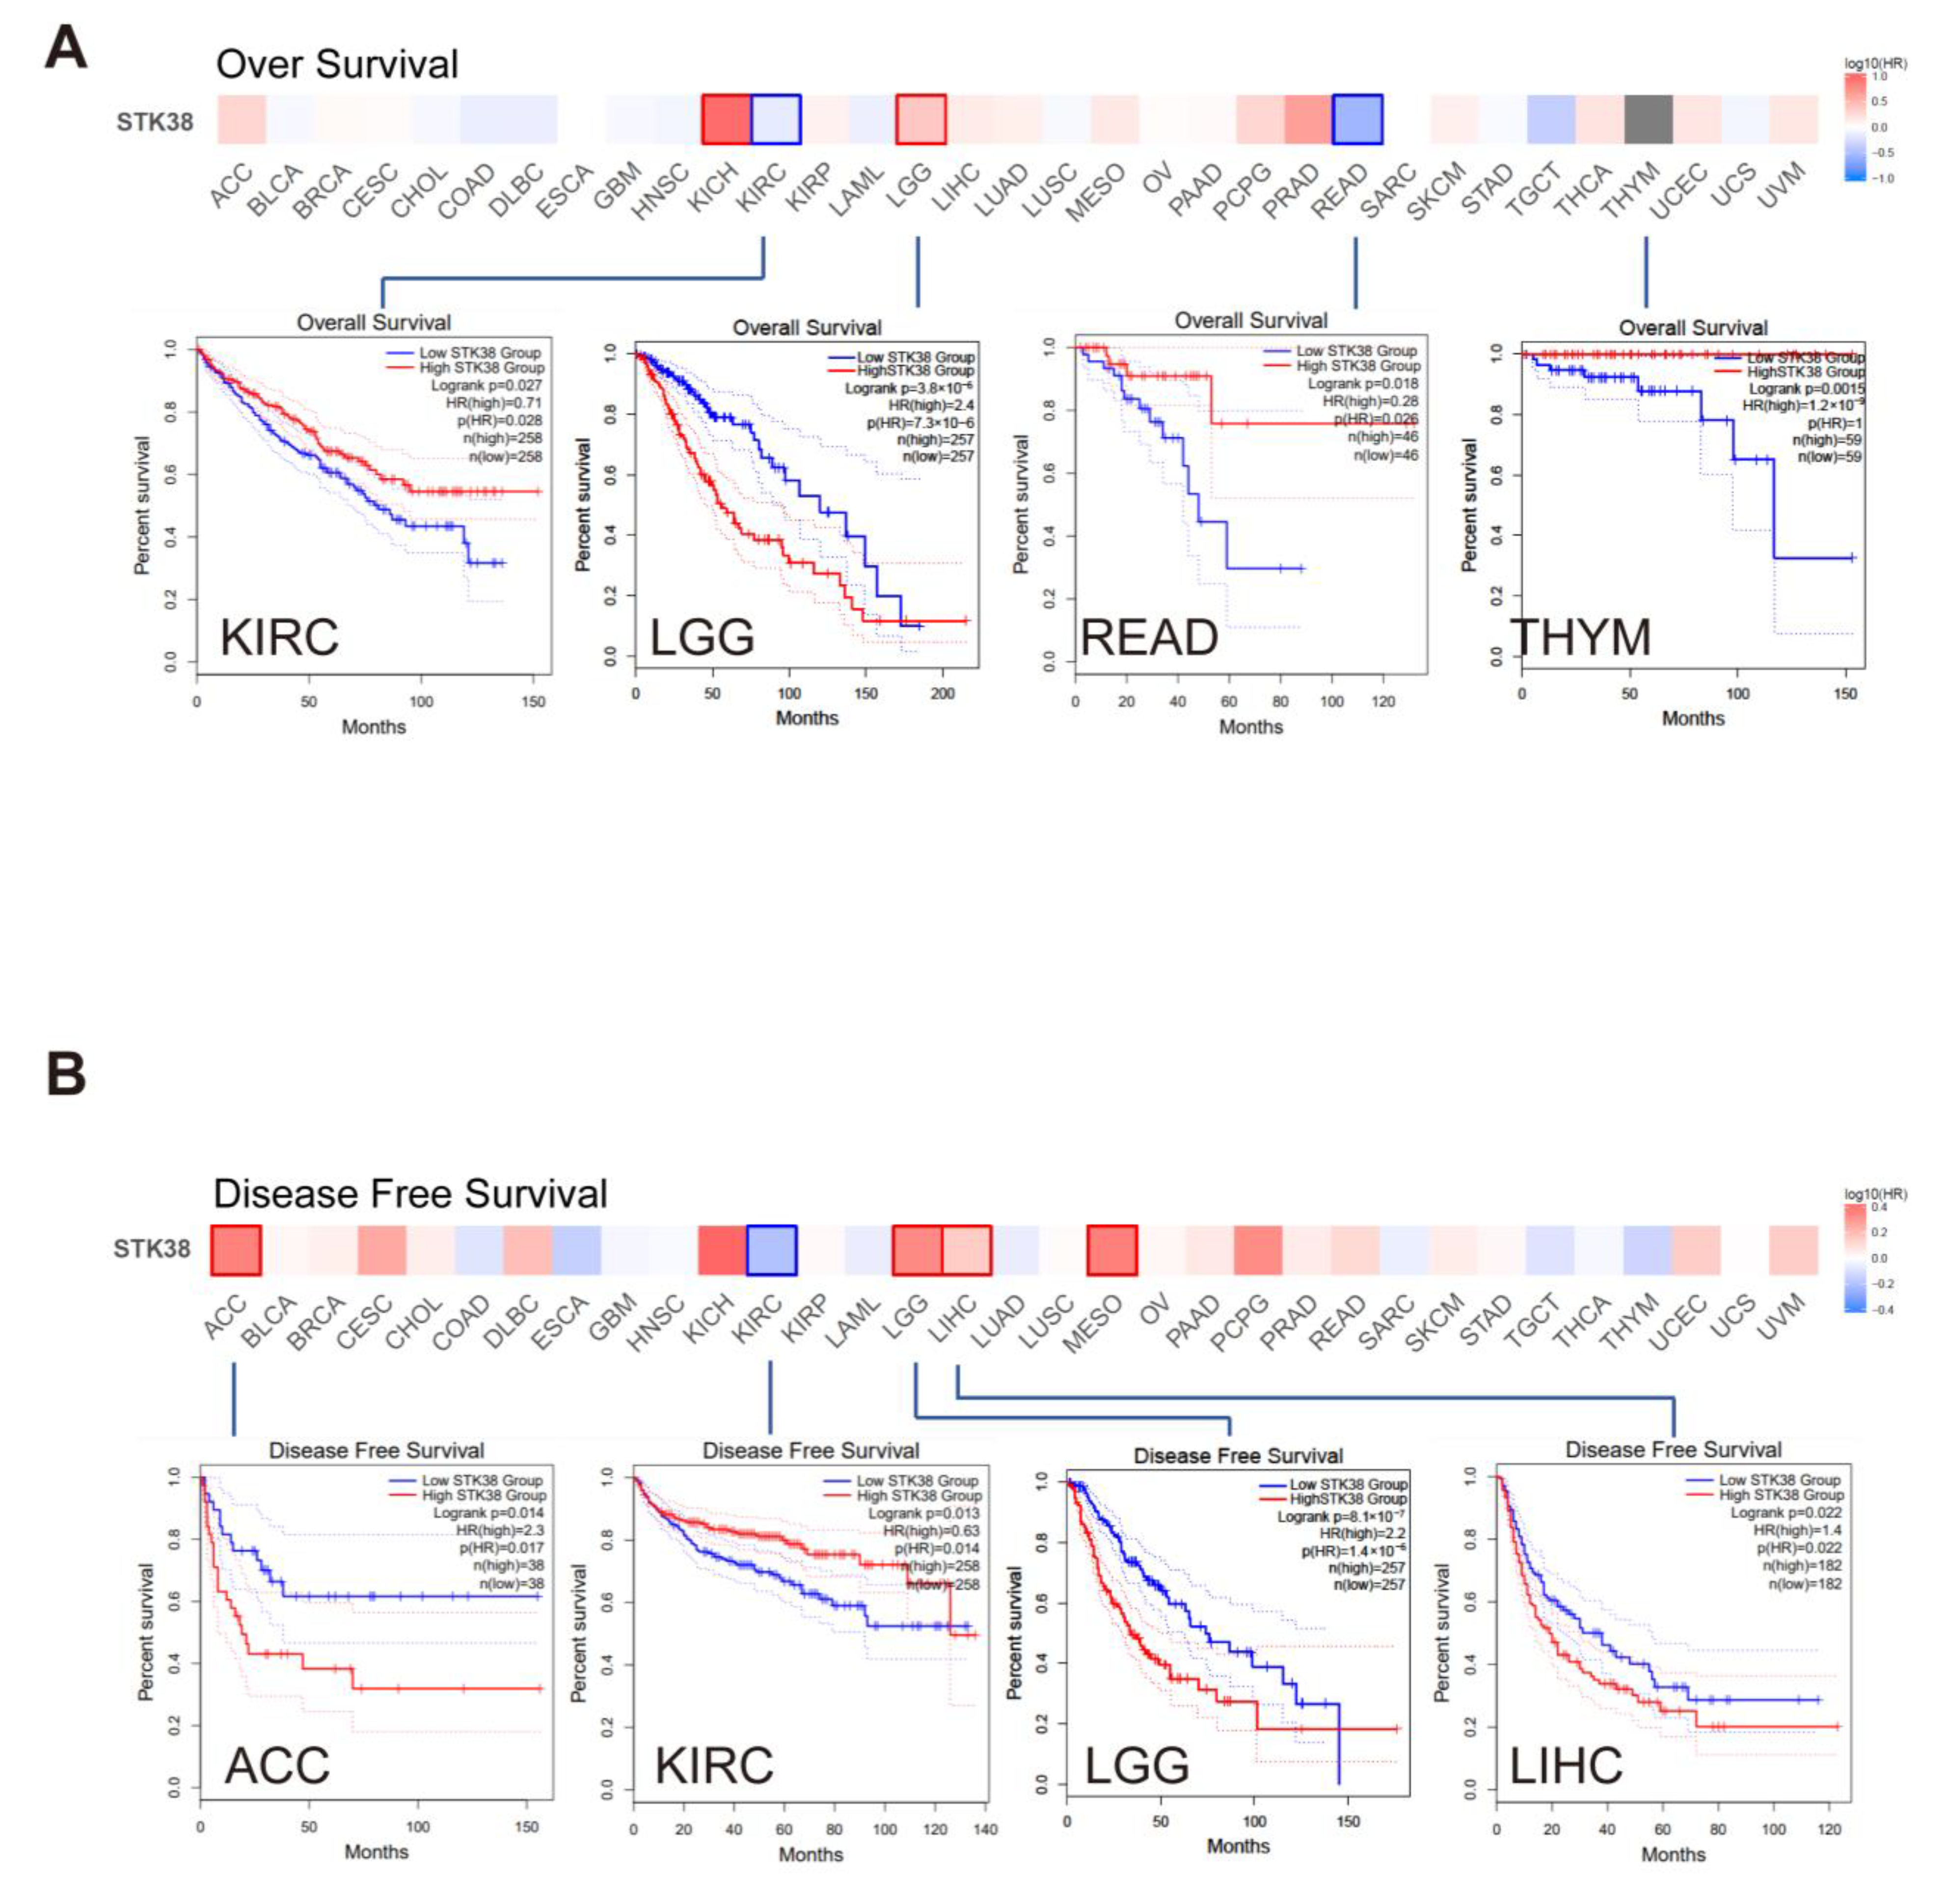
2.2. Survival Prognosis Analysis of STK38 in Cancers

Cancer patients were divided into high- and low-expression groups, and then we analyzed the correlation between the STK38 expression levels and the clinical outcome of patients with different cancers. As shown in Figure 3, a low expression of STK38 was related to a poorer overall survival (OS), including in kidney renal clear cell carcinoma (KIRC), rectum adenocarcinoma (READ) and thymoma (THYM). Moreover, a low STK38 expression was also found to be associated with a poor disease-free survival (DFS) in KIRC. Moreover, highly expressed STK38 was also correlated with a poorer OS for brain lower grade glioma (LGG) and DFS for ACC, LGG and LIHC (all log rank p values < 0.05).
Furthermore, we utilized the Kaplan–Meier plotter to conduct a survival prognosis analysis in the breast, gastric, liver, lung and ovarian cancer tissues. As shown in Figure S2, a high expression of STK38 was correlated with the poor OS, PPS, FP and PFS in gastric cancer. Moreover, a high level of STK38 expression was related to a poor OS, RFS and PFS for liver cancer. On the contrary, a low STK38 expression was associated with a poor OS and PFS prognosis for ovarian cancer. Nevertheless, there were a complicated situations in breast cancer and lung cancer. A highly expressed level of STK38 was related to a poor PPS and DMFS for breast cancer and poor OS and FP for lung cancer, however, a lowly expressed STK38 was linked to a poor OS and RFS for breast cancer and a poor PPS for lung cancer. The above data indicated that the expression of STK38 is differentially associated with the clinical outcome of the patients that are bearing different cancers.

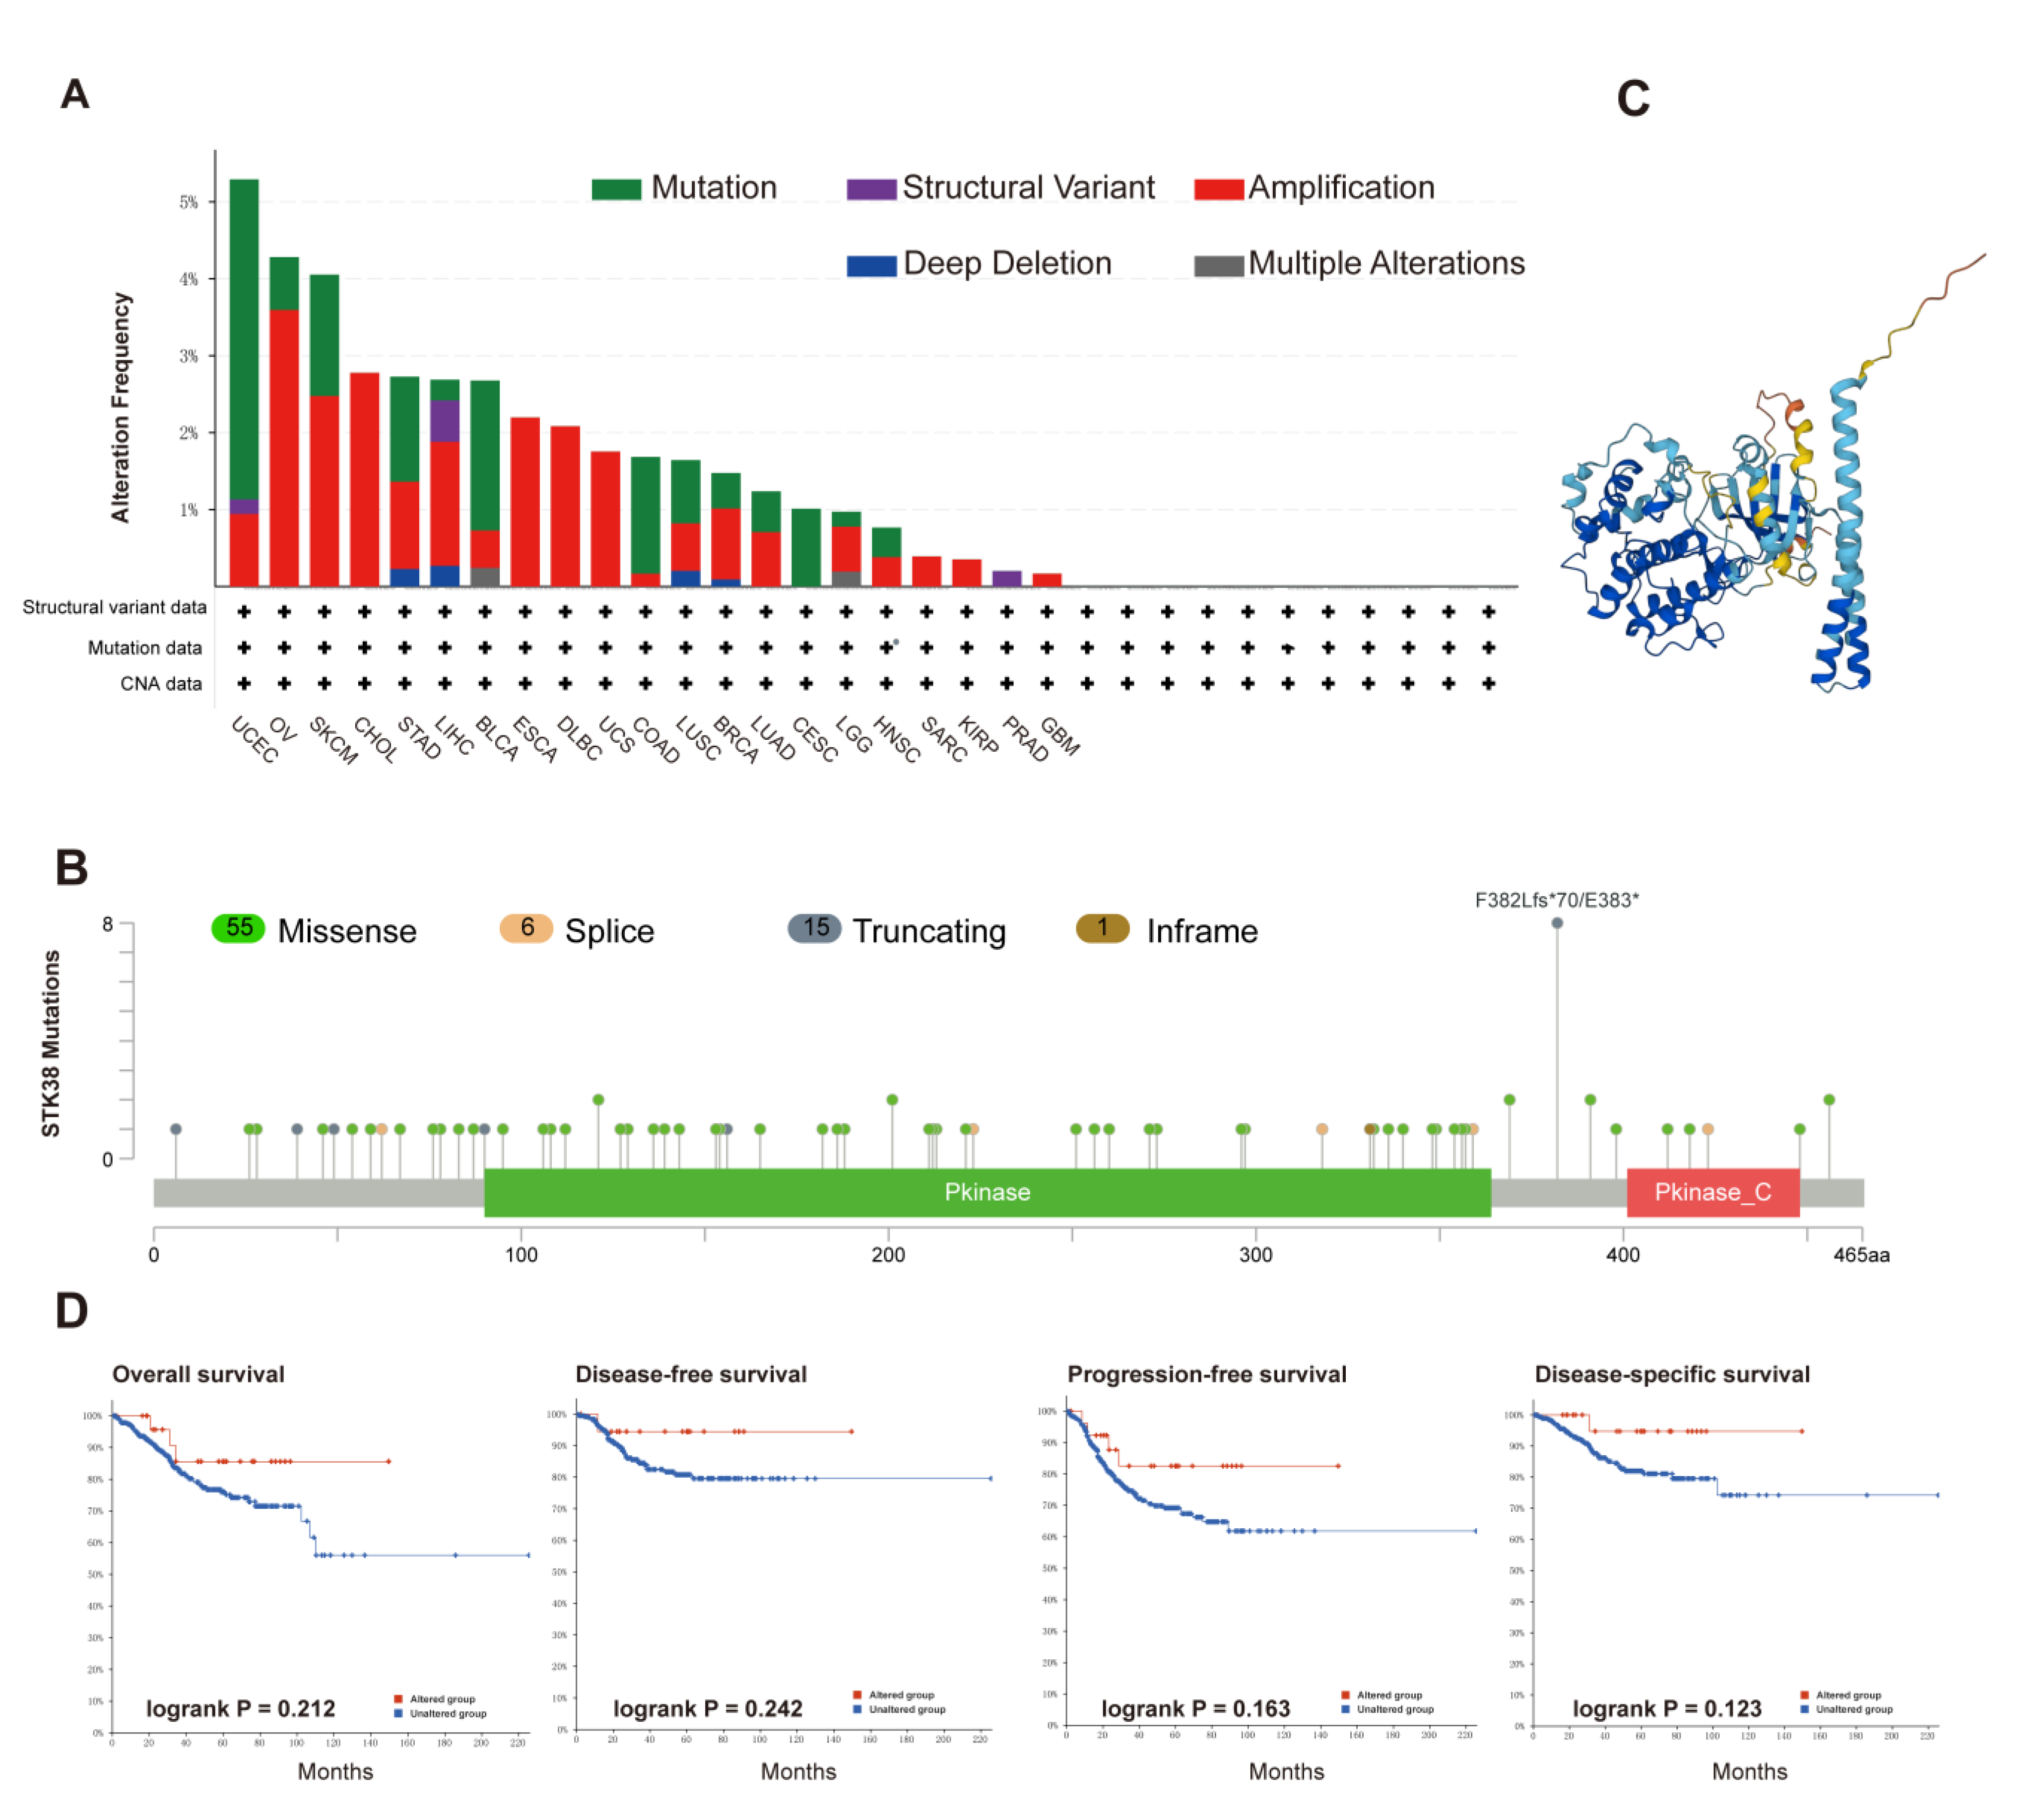
2.3. Genetic Alteration and DNA Methylation Analysis of STK38

DNA methylation and genetic mutations are widely involved in tumor initiation, development and metastasis. We firstly analyzed the genetic mutation status of STK38 in the cancer patients in the TCGA database. The highest mutation frequency of STK38 happened in the uterine cancer patients, and the “mutation” accounted for the majority of all the alterations. The “amplification” was the majority alteration type in the OV, CHOL, esophageal adenocarcinoma, lymphoid neoplasm diffuse large B-cell lymphoma (DLBC), sarcoma (SARC), uterine carcinosarcoma (UCS), KIRP and GBM tissues (Figure 4A). The distribution of the STK38 genetic alteration is presented in Figure 4B. We found that majority of the mutation sites are located in the central kinase catalytic domain. Figure 4C shows the protein structure of STK38. Moreover, we analyzed the possible relationship between the STK38 alteration and the clinical outcome. The result demonstrated that the UCEC patients carrying a mutated version of STK38 revealed that there was no relationship with this and their overall survival (p = 0.212), disease-free survival (p = 0.242), progression-free survival (p = 0.163) and disease-specific survival (p = 0.123), in comparison with patients without the STK38 mutation (Figure 4D). As one of significant epigenetic modifications, DNA methylation can promote the silencing of tumor suppressor genes and thus, this results in tumorigenesis and the progression of the cancer [21,22]. We found that STK38 expression was significantly correlated with the DNA methylation level in 24 kinds of tumors (Table 1). STK38 expression was negatively associated with promoter methylation levels in 15 cancers. We show the six strongest negative correlations (cervical squamous cell carcinoma and endocervical adenocarcinoma (CESC), COAD, ESCA, READ, THCA and UCS) in Figure S3A. STK38 expression was positively associated with the promoter methylation levels in eight cancers. We present the three strongest positive correlations (pheochromocytoma and paraganglioma (PCPG), THYM and testicular germ cell tumors (TGCT)) in Figure S3B.

2.4. STK38 Is Correlated with the TMB and MSI

In BRCA, LGG, ACC, LUAD and SARC, STK38 expression was positively associated with the TMB, whereas in COAD, THYM and UCEC, it was adversely connected with the TMB (Figure S4). STK38 expression was inversely correlated with the MSI in COAD, DLBC and KIRP, but it was positively connected to it in LUSC and LUAD (Figure S5).

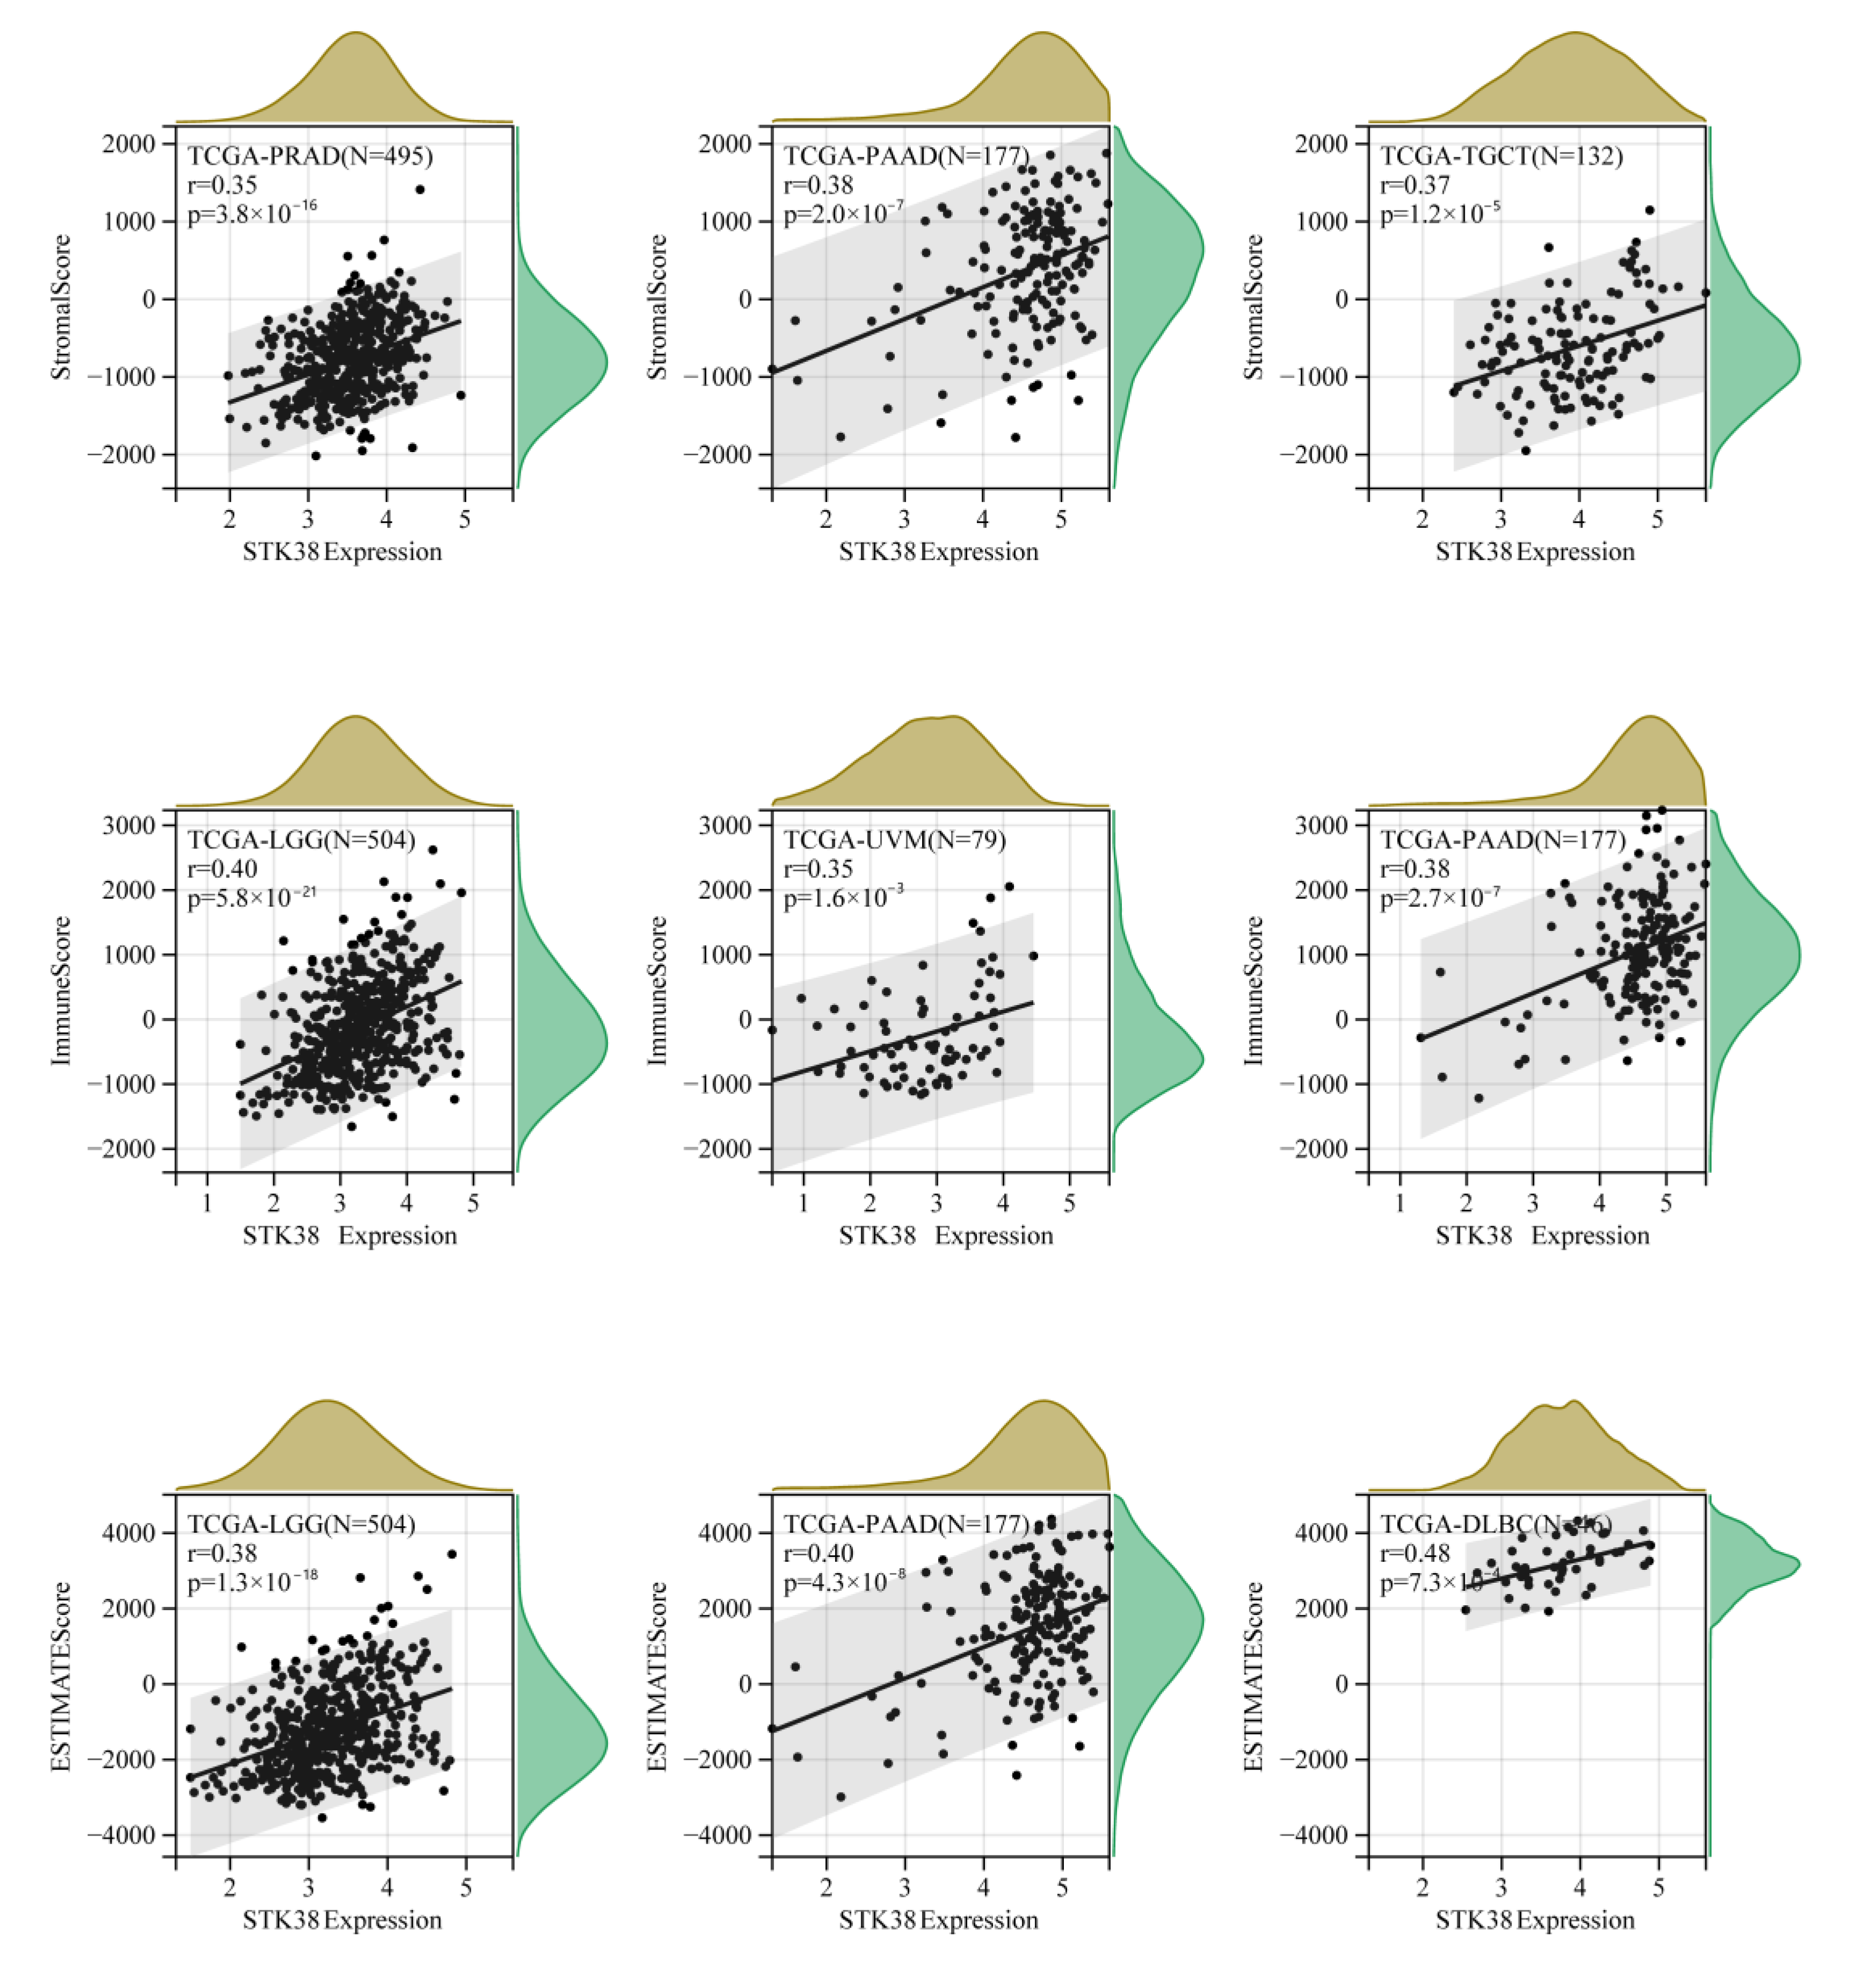
2.5. STK38 Expression Correlates with Tumor Immune Infiltration

Tumor-infiltrating immune cells which were significant components of the TME have been demonstrated to be closely related to the initiation, progression and metastasis of malignant cancers [23,24]. To explore the association between immune cell infiltration and the STK38 expression level in different cancers, the RNA-sequencing expression profiles and corresponding clinical information that is related to STK38 were downloaded from the TCGA dataset. According to existing data, we utilized the “CIBERSORT” algorithm to evaluate the 22 immune cells. We found that the expression level of STK38 was positively correlated with infiltrating levels of the NK cells and mast cells, however, it was negatively correlated with the CD4+ T cells. (Figure 5A).
Cancer-associated fibroblasts in the TME were proven to take part in the modulating of the function of various tumor-infiltrating immune cells [23,24]. We used a variety of algorithms to analyze the potential relationship between the infiltration level of cancer-associated fibroblasts and STK38 gene expression in different cancer types of TCGA. We found that there is a positive correlation between the infiltration level of the tumor-associated fibroblasts and expression of STK38 for head and neck squamous cell carcinoma-HPV-(HNSC-HPV-), LGG, PAAD, PRAD, SARC, TGCT and UCS as based on all or most of the algorithms (Figure 5B). Moreover, we observed a negative correlation between the infiltration level of the tumor-associated fibroblasts and expression of BRCA-Her2, ESCA, HNSC-HPV+ and STAD. The scatter plots of the abovementioned tumors which were generated using one algorithm are shown in Figure 5C. For instance, the STK38 expression level of LGG is positively correlated with the status of the cancer-associated fibroblasts infiltration (Figure 5C, cor = 0.309, p = 4.93 × 10⁻¹²).
Immune cells and stromal cells are two major types of non-tumor components in the TME, and they have been proposed to be a prognostic biomarker of cancer patients. The higher score that was calculated using ImmuneScore or StromalScore indicated the larger proportion of the immune or stromal components in the TME. The ESTIMATEScore was the sum of ImmuneScore and StromalScore, thereby representing the comprehensive proportion of both of the components in the TME. The top three tumors that were most obviously associated with the expression of STK38 were PRAD, PAAD and TGCT (StromalScore), LGG, UVM and PAAD (ImmuneScore), and LGG, PAAD and DLBC (ESTIMATEScore) respectively (Figure 6), which indicates that high STK38 expression is correlated with high stromal components or immune components in these cancers. The results demonstrated the strong relationship between STK38 expression and immune infiltration level in several cancers.

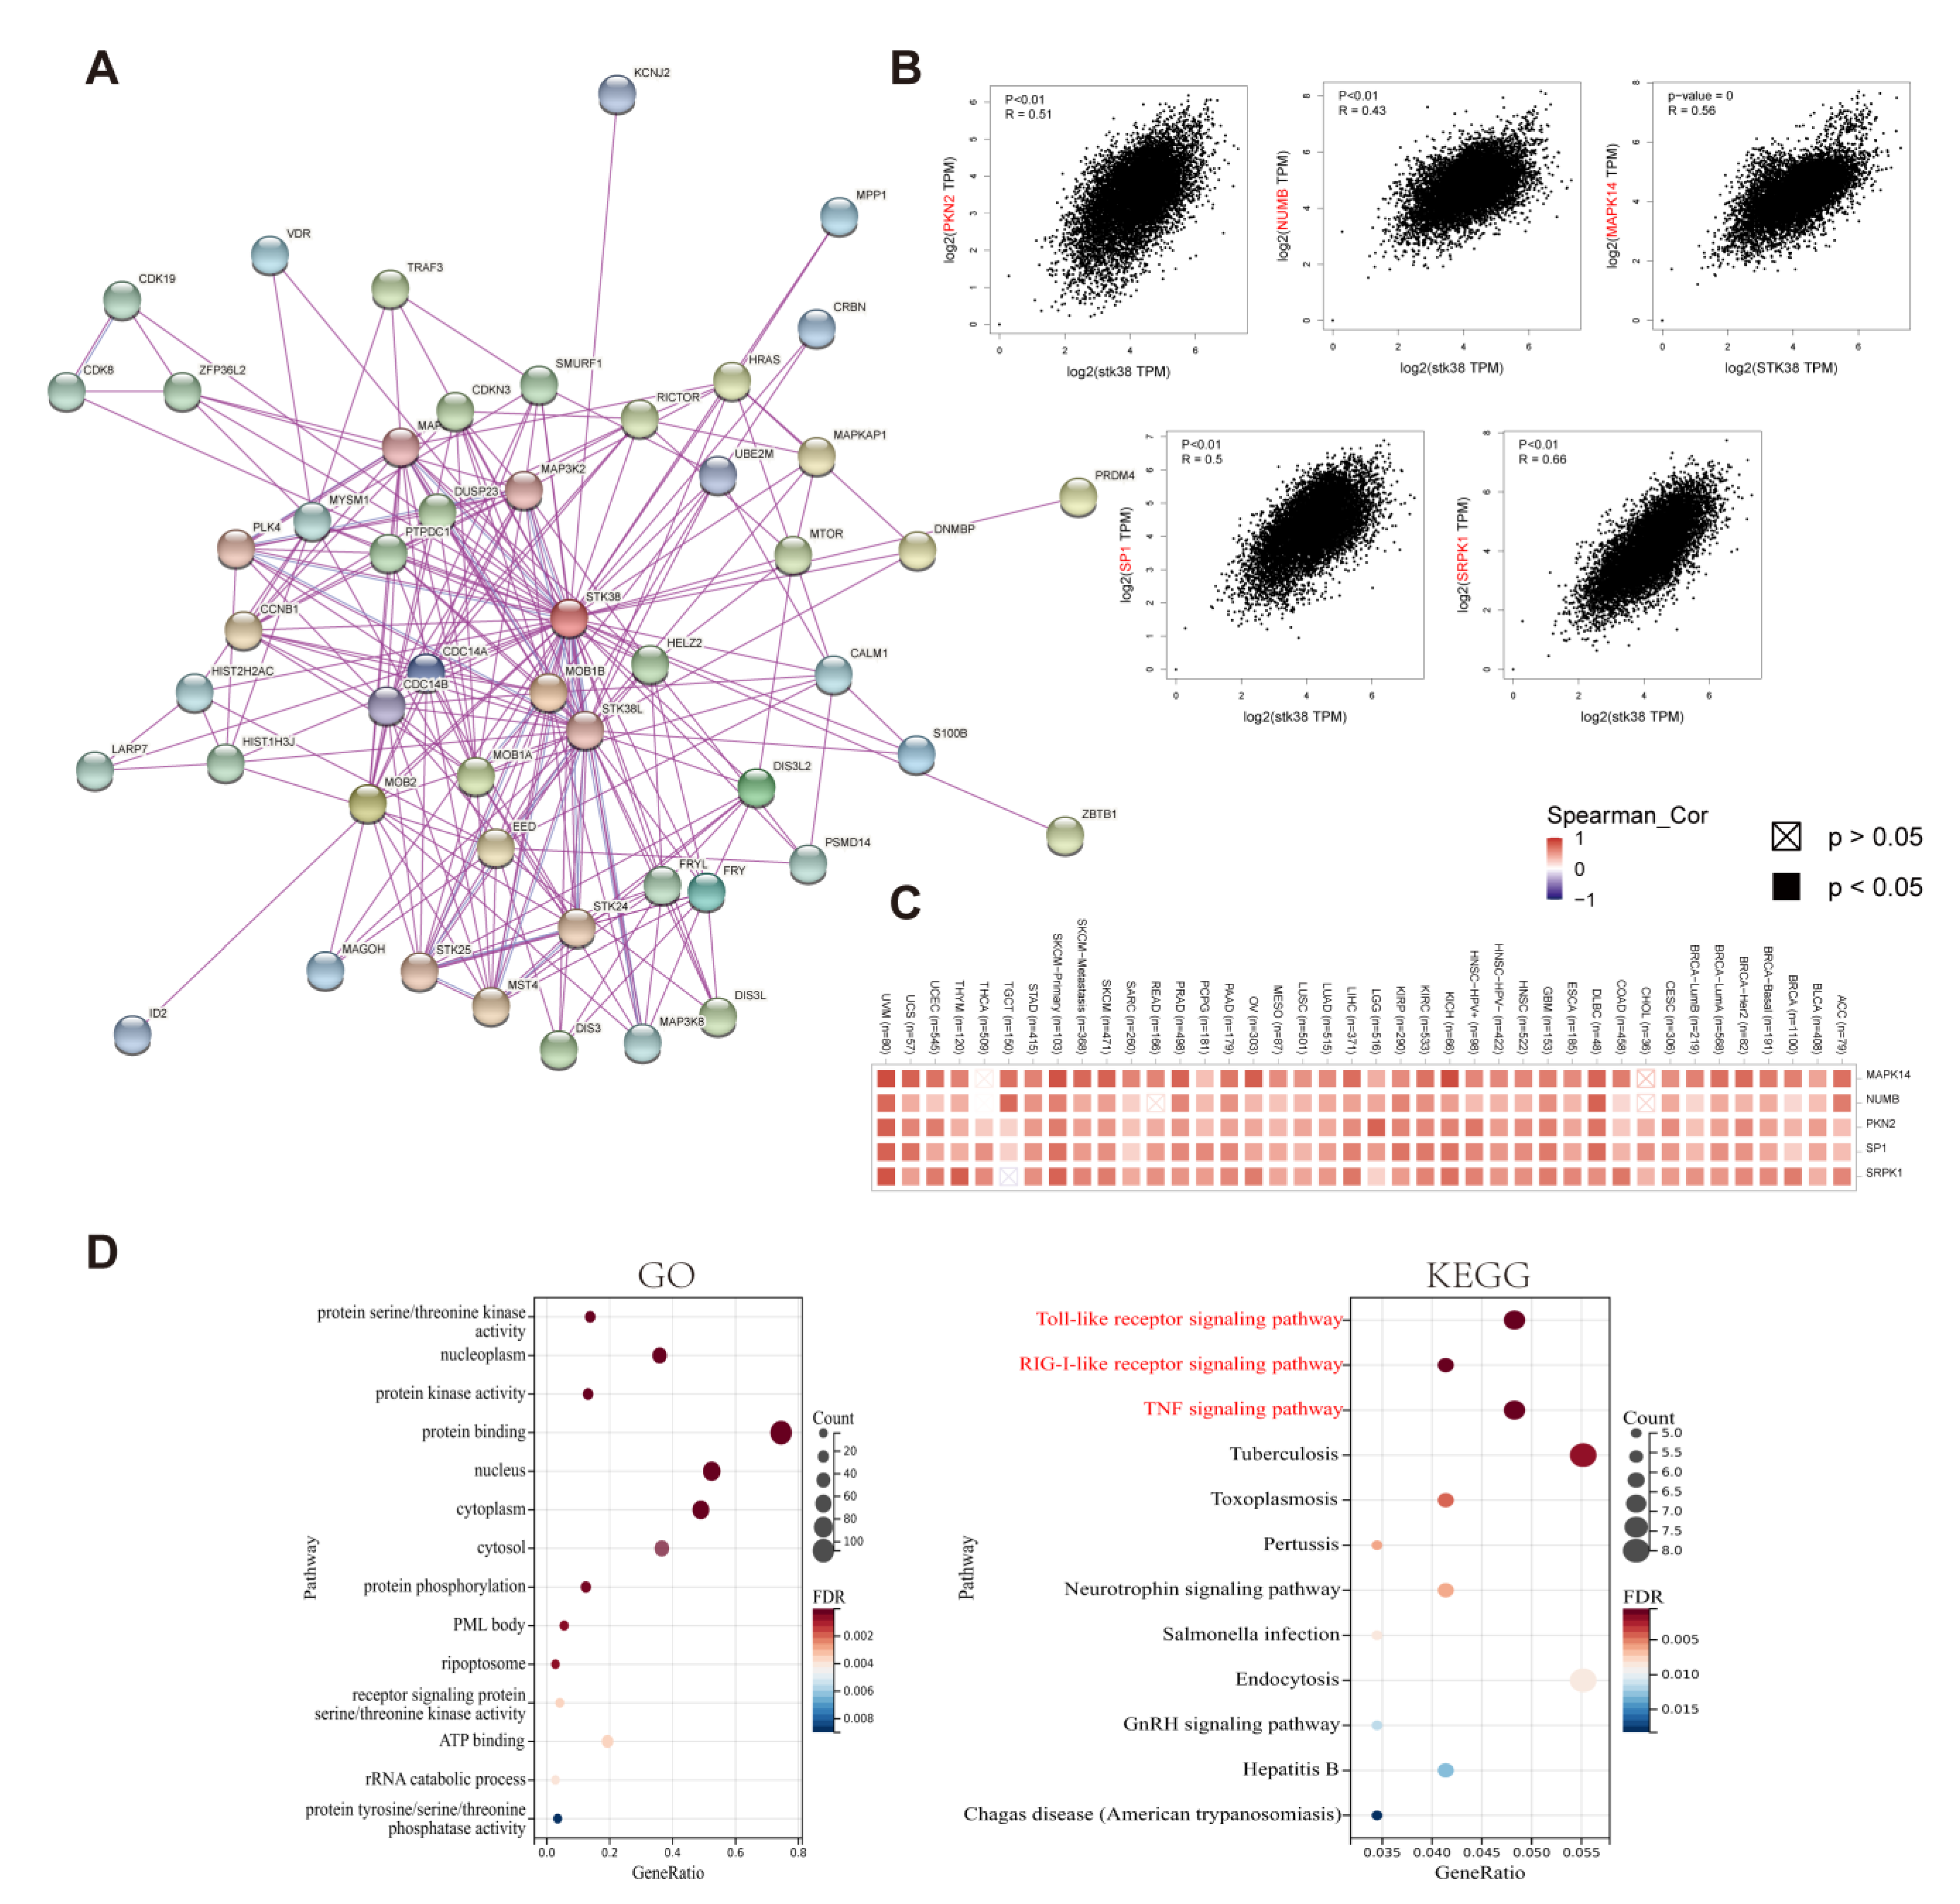
2.6. Enrichment Analysis of STK38-Related Partners

To deeply explore the molecular biological mechanism of STK38 in cancer initiation and progression, we obtained the STK38-interacting proteins and the STK38 expression correlated genes to perform pathway enrichment analyses. Using the STRING website, we observed 50 experimentally detected STK38-binding proteins. Figure 7A demonstrates the interaction network of these proteins. After that, we combined all of the tumor expression data of TCGA using the GEPIA2 tool and obtained the top 100 genes which were associated with STK38. The expression of STK38 was found to be positively correlated with that of the MAPK14 (Mitogen-Activated Protein Kinase 14) (R = 0.56), SRPK1 (SRSF Protein Kinase 1) (R = 0.66), SP1 (Sp1 Transcription Factor) (R = 0.5), NUMB (NUMB Endocytic Adaptor Protein) (R = 0.43) and PKN2 (Protein Kinase N2) (R = 0.51) genes (all p < 0.001) (Figure 7B). The heatmap showed that STK38 had a significantly positive relationship with five genes in most of the cancers (Figure 7C). Then we combined these two datasets to conduct the GO and KEGG enrichment analyses. As shown in Figure 7D, three pathways including the “Toll-like receptor signaling pathway”, “RIG-I-like receptor signaling pathway”, “TNF signaling pathway” were identified as the most importantly enriched KEGG pathways, thereby suggesting that STK38 was closely related to immunity in the tumors.

3. Discussion

STK38 is a member of the NDR/LATS kinase family, and it is mainly located in the cell nuclei. In addition to it having a central kinase catalytic domain, STK38 has a N-terminal regulatory domain (NTR) and a C-terminal hydrophobic motif. STK38 kinase can play opposing roles in tumors by serving as a tumor suppressor or an oncogenic factor in different conditions. On the one hand, by positively regulating the cell proliferation and centrosome duplication, STK38 displayed oncogenic characteristics at the cellular level. Previous studies have reported that high STK38 expression was associated with centrosome overduplication [25], thus contributing to chromosomal instability. Moreover, STK38 knockdown significantly decreased the MYC levels and promoted apoptosis, leading to the growth inhibition of MYC-addicted human B-cell lymphoma tumors [26]. On the other hand, STK38 provided a tumor suppressive capacity by phosphorylating YAP, thereby promoting its cytoplasmic retention and subsequent degradation [27]. Despite emerging biological experiments that are providing the correlation between STK38 and a few tumors, no pan-cancer analysis about STK38 in different cancers is available to date.
We firstly analyzed the expression of STK38 in various of cancers using the TCGA and CPTAC datasets. The results displayed that when they were compared to normal tissue samples, a low STK38 expression level was found in BRCA, COAD, KICH and PRAD, whereas a high expression was observed in nine types of cancers, including UCEC, CHOL, GBM, KIRP, LIHC, LUSC, LUAD, STAD and ESCA. The result from the CPTAC analysis showed that a higher STK38 protein expression in cancer was discovered in PAAD, ccRCC and LIHC, and the expression of STK38 total proteins was lower in ovarian cancer, COAD and LUAD when they were compared to the normal tissues. Additionally, the CPTAC result was consistent with that of the IHC analysis data. A high STK38 expression was correlated with better OS and DFS prognosis in KIRC, which demonstrates that STK38 may serve as a protective factor in this cancer. However, a high STK38 expression was correlated with a poor clinical outcome, particularly in patients with LGG, gastric cancer and liver cancer, based on the Kaplan–Meier analysis. Past studies have reported that the STK38 expression was higher in primary prostate cancer than it was in metastasis cancer, and that it could be a potential tissue biomarker during tumor progression [20]. These results indicate that STK38 is a promising biomarker to estimate the clinical outcome of cancer patients.
Furthermore, we found that STK38 plays a significant role in cancer immunity. The cancer immune status is discovered to be closely related to the infiltrating concentration and composition of the immune-related cells in the TME [28,29,30]. Past studies have demonstrated that STK38 is correlated with innate and adaptive immune responses. As it is downstream of MST1, STK38 was found to regulate the egress of mature thymocytes from the thymus and the interstitial migration of naive T cells [31]. STK38 increases the virus-induced production level of type I interferon and proinflammatory cytokines in a kinase-independent manner [32]. However, the correlation between STK38 expression and cancer immunity remains unclear.
The ESTIMATE algorithm was shown to be effective and convenient to evaluate the tumor purity and serve as a clinical prognostic factor in human cancers [33]. We screened out the top three cancers with the strongest correlation between the STK38 expression and the ImmuneScore or StromalScore based on the TCGA cohort. The result showed that STK38 was significantly positively associated with the stromal component of the TME in PRAD, PAAD and TGCT and the immune component in LGG, UVM and PAAD. Furthermore, the KEGG pathway analysis demonstrated that STK38 was strongly correlated with the immune-related pathways, including Toll-like receptor signaling pathways (TLRs). TLRs are a significant fraction of the pattern recognition receptors (PRRs) which play an essential role in the innate immune response. TLRs were reported to active the downstream pathways and are related to the initiation of immune diseases and cancers [34,35]. Meanwhile, previous study has demonstrated that STK38 may downregulate TLR9 signaling to decrease the inflammatory cytokine production and protect the host from an inflammatory injury during infection [36]. Furthermore, the result in our study indicates that STK38 is negatively associated with infiltrating levels of CD4+ T cells, and it is positively correlated with NK cells and Mast cells in most cancer types. These findings suggest that STK38 plays a complicated role in regulating immunity.
Cancer-associated fibroblasts (CAF) express more biomarkers than normal fibroblasts do, including FAP and αSMA, which have been used as biomarkers to isolate CAF populations from the tumor tissue [37]. A previous study has demonstrated that CAFs have a pro-tumorigenic function and participate in regulating tumor metastasis by secreting growth factors and remodeling the extracellular matrix [37]. In our study, the result showed that STK38 expression was significantly positively associated with the infiltration level of CAFs in HNSC-HPV-, LGG, PAAD, PRAD, SARC, TGCT and UCS (appeared in four algorithms), suggesting that STK38 may promote the transformation and activation of CAFs in these cancers. The TMB is closely associated with the efficacy of immunotherapy in cancer. Previous studies have displayed that a high TMB is related to a better prognosis of patients that are treated with immune checkpoint inhibitors in melanoma [38], urothelial carcinoma [39] and head and neck cancer [40]. The MSI is also an important predictor of the ICI response. In our study, we found that STK38 expression is associated with the TMB in eight kinds of cancers and with STK38 expression being associated with the MSI in five kinds of cancer. Therefore, STK38 may be a potential biological marker for the treatment effect of immunotherapy in the above-mentioned cancers.
However, there are several limitations in our study. First, although the pan-cancer analysis has provided us with some important insights on STK38 in tumors, it is essential to conduct related experiments to verify our results. Next, we will perform biological experiments to explore the mechanism of STK38 in different cancers. Second, the result showed that expression of STK38 was associated with immune cell infiltration and the clinical prognosis in cancers, we cannot verify whether STK38 may affect patient clinical endpoint by the immune pathways.
In summary, based on our comprehensive pan-cancer analysis of STK38, we found a statistical correlation between the STK38 expression and patient survival, immune cell infiltration, cancer-associated fibroblasts, tumor mutation burden and microsatellite instability in several human cancers, thereby contributing to further our understanding of the roles of STK38 in cancer.

4. Materials and Methods

4.1. Gene Expression Analysis

We used TIMER2 (tumor immune estimation resource, version 2, http://timer.cistrome.org/, accessed on 20 February 2022) to analyze the expression profile of STK38 between tumor types and the adjacent normal tissues. Additionally, the STK38 expression in various of pathological stages of all TCGA tumors was obtained by using the “Pathological Stage Plot” module in GEPIA2 (http://gepia2.cancer-pku.cn/, accessed on 21 March 2022). The log2 [TPM (Transcripts per million) +1] transformed expression data were applied for the box or violin plots. The UALCAN tool (http://ualcan.path.uab.edu/analysisprot.html, accessed on 8 April 2022) was used to explore the cancer omics data. We obtained protein expression data of STK38 by using the CPTAC dataset [41]. The STK38 total protein expression levels were found in tumor and normal tissues.

4.2. Immunohistochemistry (IHC) Staining

To assess the differences in STK38 expression at the protein level, we downloaded and analyzed IHC images of STK38 protein expression in six tumors tissues and normal tissues, including KIRC (kidney renal clear cell carcinoma), PAAD (pancreatic adenocarcinoma), LIHC (liver hepatocellular carcinoma), ovarian cancer, COAD (colon adenocarcinoma) and LUAD (lung adenocarcinoma) from the HPA (Human Protein Atlas) (http://www.proteinatlas.org/, accessed on 17 March 2022).

4.3. Survival Prognosis Analysis

The OS (Overall Survival) and DFS (Disease-Free Survival) significance map data and survival plots of STK38 across all TCGA tumors were obtained using GEPIA2. We used cutoff-high (50%) and cutoff-low (50%) values to divide the high expression and low expression cohorts [42]. The log-rank test was used in the hypothesis testing.
We used the Kaplan–Meier plotter (http://kmplot.com/analysis/, accessed on 24 March 2022) to analyze the STK38 expression that was associated OS, post-progression survival (PPS), first progression (FP), progression-free survival (PFS), relapse-free survival (RFS) and the distant metastasis-free survival (DMFS) outcomes of patients [41]. Cancer patients were divided into two groups through choosing the “auto select best cutoff” setting. Then we obtained Kaplan–Meier survival curves, and the log-rank p-values and the HRs were analyzed.

4.4. Genetic Alteration Analysis

We used the cBioportal tool (http://www.cbioportal.org/, accessed on 17 March 2022) to calculate the STK38 alteration frequency and gene mutation profile in cancer patients [43]. Microsatellite instability (MSI) is associated with the nucleotide insertions and deletions in the microsatellite loci [44]. We collected the TMB (Tumor mutational burden) and MSI scores in different cancers from TCGA.

4.5. Immune Infiltration Analysis

We used the CIBERSORT algorithm to evaluate the association between immune infiltration and STK38 expression level in different cancers. Cancer-associated fibroblasts were used for evaluating the immune infiltration level by using TIDE, TIMER, CIBERSORT, EPIC, QUANTISEQ, MCPCOUNTER and XCELL algorithms. The data are shown as a heatmap and scatter plots. ESTIMATE is an algorithm that is used to evaluate the degree of infiltration of the immune and stromal cells in tumors [45]. We used the ESTIMATE algorithm to calculate the immune, stromal and ESTIMATE scores for different tumors. Additionally, the association between STK38 expression and these scores was evaluated using the R software package (version 2.2.10) “estimate”.

4.6. STK38-Related Gene Enrichment Analysis

The STRING website (https://string-db.org/, accessed on 11 January 2022) was used for the query of a single protein name (“STK38”) and organism (“Homo sapiens”). The main parameters were: the minimum required interaction score [“Low confidence (0.150)”], the meaning of the network edges (“evidence”), the max number of the interactors to show (“no more than 50 interactors” in 1st shell) and the active interaction sources (“experiments”). Then we obtained the available experimentally determined STK38-binding proteins. GEPIA2 was used to pick up the top 100 STK38-correlated targeting genes from the datasets of all TCGA cancer and normal tissues. We used the “correlation analysis” module of GEPIA2 for a pairwise Pearson correlation analysis of STK38 and the related genes. We applied the log2 TPM to produce the dot plot. In addition, we used the “Gene_Corr” module of TIMER2 to image the heatmap data of the selected genes. In the end, we uploaded these gene lists onto DAVID website (https://david.ncifcrf.gov/, accessed on 11 January 2022) to conduct the (gene ontology) enrichment and Kyoto Encyclopedia of Genes and Genomes (KEGG) pathway analysis. We applied the results with p < 0.05 for the data analysis.

Supplementary Materials

The supporting information can be downloaded at: https://www.mdpi.com/article/10.3390/ijms231911590/s1.

Author Contributions

Conceptualization, Y.L.; methodology, Z.S.; software, Z.Z.; validation, J.L. and K.Y.; resources, C.X.; data curation, Q.L.; writing—original draft preparation, Y.L.; writing—review and editing, Z.G. and Y.Y.; visualization, Y.Z. and Z.X.; supervision, H.S. and C.S. All authors have read and agreed to the published version of the manuscript.

Funding

This work was supported by the National Natural Science Foundation of China (No. 81972373), the Natural Science Foundation of Fujian Province of China (No.2019J01016), the funding of Science and Technology Planned Project of Medical and Health of Xiamen City (No. 3502Z20194038), the Scientific Research Foundation for Advanced Talents of Xiang’an Hospital of Xiamen University (No. PM201809170001), and the Medical Leading Talents of Xiamen City.

Institutional Review Board Statement

Not applicable.

Informed Consent Statement

Not applicable.

Data Availability Statement

The data which support the findings of our study are openly available from the UALCAN (http://ualcan.path.uab.edu/analysisprot.html), Timer (http://timer.cistrome.org/) and STRING (https://string-db.org/) database.

Conflicts of Interest

The authors declare no conflict of interest.

References

  1. Bray, F.; Ferlay, J.; Soerjomataram, I.; Siegel, R.L.; Torre, L.A.; Jemal, A. Global cancer statistics 2018: GLOBOCAN estimates of incidence and mortality worldwide for 36 cancers in 185 countries. CA Cancer J. Clin. 2018, 68, 394–424. [Google Scholar] [CrossRef]
  2. Ferlay, J.; Soerjomataram, I.; Dikshit, R.; Eser, S.; Mathers, C.; Rebelo, M.; Parkin, D.M.; Forman, D.; Bray, F. Cancer incidence and mortality worldwide: Sources, methods and major patterns in GLOBOCAN 2012. Int. J. Cancer 2015, 136, E359–E386. [Google Scholar] [CrossRef] [PubMed]
  3. Yuan, S.; Norgard, R.J.; Stanger, B.Z. Cellular Plasticity in Cancer. Cancer Discov. 2019, 9, 837–851. [Google Scholar] [CrossRef] [PubMed]
  4. Pitt, J.M.; Marabelle, A.; Eggermont, A.; Soria, J.C.; Kroemer, G.; Zitvogel, L. Targeting the tumor microenvironment: Removing obstruction to anticancer immune responses and immunotherapy. Ann. Oncol. 2016, 27, 1482–1492. [Google Scholar] [CrossRef]
  5. Gun, S.Y.; Lee, S.W.L.; Sieow, J.L.; Wong, S.C. Targeting immune cells for cancer therapy. Redox Biol. 2019, 25, 101174. [Google Scholar] [CrossRef] [PubMed]
  6. Binnewies, M.; Roberts, E.W.; Kersten, K.; Chan, V.; Fearon, D.F.; Merad, M.; Coussens, L.M.; Gabrilovich, D.I.; Ostrand-Rosenberg, S.; Hedrick, C.C.; et al. Understanding the tumor immune microenvironment (TIME) for effective therapy. Nat. Med. 2018, 24, 541–550. [Google Scholar] [CrossRef] [PubMed]
  7. Hergovich, A. Hippo Signaling in Mitosis: An Updated View in Light of the MEN Pathway. Methods Mol. Biol. 2017, 1505, 265–277. [Google Scholar] [PubMed]
  8. Hergovich, A.; Hemmings, B.A. Hippo signalling in the G2/M cell cycle phase: Lessons learned from the yeast MEN and SIN pathways. Semin. Cell. Dev. Biol. 2012, 23, 794–802. [Google Scholar] [CrossRef]
  9. Sharif, A.A.D.; Hergovich, A. The NDR/LATS protein kinases in immunology and cancer biology. Semin. Cancer Biol. 2018, 48, 104–114. [Google Scholar] [CrossRef] [PubMed]
  10. Hergovich, A.; Bichsel, S.J.; Hemmings, B.A. Human NDR kinases are rapidly activated by MOB proteins through recruitment to the plasma membrane and phosphorylation. Mol. Cell. Biol. 2005, 25, 8259–8272. [Google Scholar] [CrossRef] [Green Version]
  11. Cornils, H.; Kohler, R.S.; Hergovich, A.; Hemmings, B.A. Human NDR kinases control G(1)/S cell cycle transition by directly regulating p21 stability. Mol. Cell. Biol. 2011, 31, 1382–1395. [Google Scholar] [CrossRef]
  12. Du, Y.; Ge, M.-M.; Xue, W.; Yang, Q.-Q.; Wang, S.; Xu, Y.; Wang, H.-L. Chronic Lead Exposure and Mixed Factors of Gender×Age×Brain Regions Interactions on Dendrite Growth, Spine Maturity and NDR Kinase. PLoS ONE 2015, 10, e0138112. [Google Scholar]
  13. Schmitz-Rohmer, D.; Probst, S.; Yang, Z.-Z.; Laurent, F.; Stadler, M.B.; Zuniga, A.; Zeller, R.; Hynx, D.; Hemmings, B.A.; Hergovich, A. NDR Kinases Are Essential for Somitogenesis and Cardiac Looping during Mouse Embryonic Development. PLoS ONE 2015, 10, e0136566. [Google Scholar] [CrossRef] [PubMed]
  14. Martin, A.P.; Aushev, V.N.; Zalcman, G.; Camonis, J.H. The STK38-XPO1 axis, a new actor in physiology and cancer. Cell. Mol. Life Sci. 2021, 78, 1943–1955. [Google Scholar] [CrossRef] [PubMed]
  15. Adeyinka, A.; Emberley, E.; Niu, Y.; Snell, L.; Murphy, L.C.; Sowter, H.; Wykoff, C.C.; Harris, A.L.; Watson, P.H. Analysis of gene expression in ductal carcinoma in situ of the breast. Clin. Cancer Res. 2002, 8, 3788–3795. [Google Scholar]
  16. Bhattacharjee, A.; Richards, W.G.; Staunton, J.; Li, C.; Monti, S.; Vasa, P.; Ladd, C.; Beheshti, J.; Bueno, R.; Gillette, M.; et al. Classification of human lung carcinomas by mRNA expression profiling reveals distinct adenocarcinoma subclasses. Proc. Natl. Acad. Sci. USA 2001, 98, 13790–13795. [Google Scholar] [CrossRef]
  17. Garber, M.E.; Troyanskaya, O.G.; Schluens, K.; Petersen, S.; Thaesler, Z.; Pacyna-Gengelbach, M.; van de Rijn, M.; Rosen, G.D.; Perou, C.M.; Whyte, R.I.; et al. Diversity of gene expression in adenocarcinoma of the lung. Proc. Natl. Acad. Sci. USA 2001, 98, 13784–13789. [Google Scholar] [CrossRef] [PubMed]
  18. Welsh, J.B.; Zarrinkar, P.P.; Sapinoso, L.M.; Kern, S.G.; Behling, C.A.; Monk, B.J.; Lockhart, D.J.; Burger, R.A.; Hampton, G.M. Analysis of gene expression profiles in normal and neoplastic ovarian tissue samples identifies candidate molecular markers of epithelial ovarian cancer. Proc. Natl. Acad. Sci. USA 2001, 98, 1176–1181. [Google Scholar] [CrossRef]
  19. Chen, B.; Liu, B.; Yu, T.; Han, Y.-F.; Wu, C.; Wang, Z.-Y. Nuclear Dbf2-related Kinase 1 functions as tumor suppressor in glioblastoma by phosphorylation of Yes-associated protein. Chin. Med. J. (Engl.) 2021, 134, 2054–2065. [Google Scholar] [CrossRef]
  20. Yue, J.; Sun, H.; Liu, S.; Yu, F.; Wang, S.; Wang, F.; Shen, R.; Zhu, F.; Zhang, L.; Shao, C. Downregulation of NDR1 contributes to metastasis of prostate cancer cells via activating epithelial-mesenchymal transition. Cancer Med. 2018, 7, 3200–3212. [Google Scholar] [CrossRef] [PubMed]
  21. Rodríguez-Paredes, M.; Esteller, M. Cancer epigenetics reaches mainstream oncology. Nat. Med. 2011, 17, 330–339. [Google Scholar] [CrossRef] [PubMed]
  22. Koch, A.; Joosten, S.C.; Feng, Z.; de Ruijter, T.C.; Draht, M.X.; Melotte, V.; Smits, K.M.; Veeck, J.; Herman, J.G.; Van Neste, L.; et al. Analysis of DNA methylation in cancer: Location revisited. Nat. Rev. Clin. Oncol. 2018, 15, 459–466. [Google Scholar] [CrossRef] [PubMed]
  23. Kwa, M.Q.; Herum, K.M.; Brakebusch, C. Cancer-associated fibroblasts: How do they contribute to metastasis? Clin. Exp. Metastasis 2019, 36, 71–86. [Google Scholar] [CrossRef]
  24. Chen, X.; Song, E. Turning foes to friends: Targeting cancer-associated fibroblasts. Nat. Rev. Drug Discov. 2019, 18, 99–115. [Google Scholar] [CrossRef]
  25. Hergovich, A.; Cornils, H.; Hemmings, B.A. Mammalian NDR protein kinases: From regulation to a role in centrosome duplication. Biochim. Biophys. Acta 2008, 1784, 3–15. [Google Scholar] [CrossRef]
  26. Bisikirska, B.C.; Adam, S.J.; Alvarez, M.J.; Rajbhandari, P.; Cox, R.; Lefebvre, C.; Wang, K.; Rieckhof, G.E.; Felsher, D.W.; Califano, A. STK38 is a critical upstream regulator of MYC’s oncogenic activity in human B-cell lymphoma. Oncogene 2013, 32, 5283–5291. [Google Scholar] [CrossRef]
  27. Zhang, L.; Tang, F.; Terracciano, L.; Hynx, D.; Kohler, R.; Bichet, S.; Hess, D.; Cron, P.; Hemmings, B.A.; Hergovich, A.; et al. NDR functions as a physiological YAP1 kinase in the intestinal epithelium. Curr. Biol. 2015, 25, 296–305. [Google Scholar] [CrossRef] [PubMed]
  28. Gong, Z.; Zhang, J.; Guo, W. Tumor purity as a prognosis and immunotherapy relevant feature in gastric cancer. Cancer Med. 2020, 9, 9052–9063. [Google Scholar] [CrossRef] [PubMed]
  29. Chen, M.; Ren, R.; Lin, W.; Xiang, L.; Zhao, Z.; Shao, B. Exploring the oncostatin M (OSM) feed-forward signaling of glioblastoma via STAT3 in pan-cancer analysis. Cancer Cell Int. 2021, 21, 565. [Google Scholar] [CrossRef] [PubMed]
  30. Shiao, S.L.; Chu, G.C.-Y.; Chung, L.W.K. Regulation of prostate cancer progression by the tumor microenvironment. Cancer Lett. 2016, 380, 340–348. [Google Scholar] [CrossRef] [PubMed]
  31. Tang, F.; Gill, J.; Ficht, X.; Barthlott, T.; Cornils, H.; Schmitz-Rohmer, D.; Hynx, D.; Zhou, D.; Zhang, L.; Xue, G.; et al. The kinases NDR1/2 act downstream of the Hippo homolog MST1 to mediate both egress of thymocytes from the thymus and lymphocyte motility. Sci. Signal. 2015, 8, ra100. [Google Scholar] [CrossRef] [PubMed]
  32. Liu, Z.; Qin, Q.; Wu, C.; Li, H.; Shou, J.n.; Yang, Y.; Gu, M.; Ma, C.; Lin, W.; Zou, Y.; et al. Downregulated NDR1 protein kinase inhibits innate immune response by initiating an miR146a-STAT1 feedback loop. Nat. Commun. 2018, 9, 2789. [Google Scholar] [CrossRef] [Green Version]
  33. Galon, J.; Bruni, D. Approaches to treat immune hot, altered and cold tumours with combination immunotherapies. Nat. Rev. Drug Discov. 2019, 18, 197–218. [Google Scholar] [CrossRef] [PubMed]
  34. Tsan, M.-F. Toll-like receptors, inflammation and cancer. Semin. Cancer Biol. 2006, 16, 32–37. [Google Scholar] [CrossRef] [PubMed]
  35. Rakoff-Nahoum, S.; Medzhitov, R. Toll-like receptors and cancer. Nat. Rev. Cancer 2009, 9, 57–63. [Google Scholar] [CrossRef]
  36. Wen, M.; Ma, X.; Cheng, H.; Jiang, W.; Xu, X.; Zhang, Y.; Zhang, Y.; Guo, Z.; Yu, Y.; Xu, H.; et al. Stk38 protein kinase preferentially inhibits TLR9-activated inflammatory responses by promoting MEKK2 ubiquitination in macrophages. Nat. Commun. 2015, 6, 7167. [Google Scholar] [CrossRef] [PubMed]
  37. Nurmik, M.; Ullmann, P.; Rodriguez, F.; Haan, S.; Letellier, E. In search of definitions: Cancer-associated fibroblasts and their markers. Int. J. Cancer 2020, 146, 895–905. [Google Scholar] [CrossRef]
  38. Snyder, A.; Makarov, V.; Merghoub, T.; Yuan, J.; Zaretsky, J.M.; Desrichard, A.; Walsh, L.A.; Postow, M.A.; Wong, P.; Ho, T.S.; et al. Genetic basis for clinical response to CTLA-4 blockade in melanoma. N. Engl. J. Med. 2014, 371, 2189–2199. [Google Scholar] [CrossRef] [PubMed]
  39. Balar, A.V.; Galsky, M.D.; Rosenberg, J.E.; Powles, T.; Petrylak, D.P.; Bellmunt, J.; Loriot, Y.; Necchi, A.; Hoffman-Censits, J.; Perez-Gracia, J.L.; et al. Atezolizumab as first-line treatment in cisplatin-ineligible patients with locally advanced and metastatic urothelial carcinoma: A single-arm, multicentre, phase 2 trial. Lancet 2017, 389, 67–76. [Google Scholar] [CrossRef]
  40. Gavrielatou, N.; Doumas, S.; Economopoulou, P.; Foukas, P.G.; Psyrri, A. Biomarkers for immunotherapy response in head and neck cancer. Cancer Treat Rev. 2020, 84, 101977. [Google Scholar] [CrossRef]
  41. Chen, F.; Chandrashekar, D.S.; Varambally, S.; Creighton, C.J. Pan-cancer molecular subtypes revealed by mass-spectrometry-based proteomic characterization of more than 500 human cancers. Nat. Commun. 2019, 10, 5679. [Google Scholar] [CrossRef] [PubMed]
  42. Tang, Z.; Kang, B.; Li, C.; Chen, T.; Zhang, Z. GEPIA2: An enhanced web server for large-scale expression profiling and interactive analysis. Nucleic Acids Res. 2019, 47, W556–W560. [Google Scholar] [CrossRef] [PubMed] [Green Version]
  43. Gao, J.; Aksoy, B.A.; Dogrusoz, U.; Dresdner, G.; Gross, B.; Sumer, S.O.; Sun, Y.; Jacobsen, A.; Sinha, R.; Larsson, E.; et al. Integrative analysis of complex cancer genomics and clinical profiles using the cBioPortal. Sci. Signal. 2013, 6, pl1. [Google Scholar] [CrossRef] [PubMed]
  44. Knijnenburg, T.A.; Wang, L.; Zimmermann, M.T.; Chambwe, N.; Gao, G.F.; Cherniack, A.D.; Fan, H.; Shen, H.; Way, G.P.; Greene, C.S.; et al. Genomic and Molecular Landscape of DNA Damage Repair Deficiency across The Cancer Genome Atlas. Cell Rep. 2018, 23, 239–254. [Google Scholar] [CrossRef] [PubMed]
  45. Siemers, N.O.; Holloway, J.L.; Chang, H.; Chasalow, S.D.; Ross-MacDonald, P.B.; Voliva, C.F.; Szustakowski, J.D. Genome-wide association analysis identifies genetic correlates of immune infiltrates in solid tumors. PLoS ONE 2017, 12, e0179726. [Google Scholar] [CrossRef] [PubMed] [Green Version]
Figure 1. STK38 expression profiles in normal tissues and cancers. (A) STK38 expression level in TCGA tumors were analyzed using TIMER2.0 database (* p < 0.05; ** p < 0.01; *** p < 0.001). The red color represents tumor tissue samples, and the blue color represents normal samples. (B) Expression level of STK38 in main pathological stages (stage I, stage II, stage III, and stage IV) of ACC, LIHC, OV, PAAD, THCA and UCEC were analyzed using TCGA. Expression levels are shown as Log2 (TPM + 1).
Ijms 23 11590 g001
Figure 2. Protein expression levels of STK38 between normal tissues and tumor tissues (left), and representative immunohistochemical staining (IHC) in normal (middle) tissue and tumor (right) tissue samples in the HPA database. STK38 protein expression was significantly higher in clear cell RCC, PAAD and LIHC, and it was lower in OV, COAD and LUAD (A) Kidney. (B) Pancreas. (C) Liver. (D) Ovary. (E) Colon. (F) Lung. (*** p < 0.001). Protein expression data are originated from CPTAC database. Two immunohistochemistry images for each cancer were from different patients. Antibody CAB004673 was used for IHC. Scale bars: 200 μm.
Ijms 23 11590 g002
Figure 3. Correlation analysis between STK38 gene expression and prognosis of different tumors in TCGA. GEPIA2 tool was used to perform overall survival (A) and disease-free survival (B) analyses of TCGA tumors by STK38 gene expression. The survival map and Kaplan–Meier curves with positive results are listed. The red lines of Kaplan–Meier curves indicate the high STK38 expression groups, and the blue lines indicate the low STK38 expression groups.
Ijms 23 11590 g003
Figure 4. Alteration characterizes of STK38 in TCGA tumors. The mutation features of STK38 were analyzed using the cBioPortal tool. The alteration frequency with mutation type (A) and mutation site (B) are shown. (C) Protein structure of STK38. (D) Correlation analysis of STK38 between mutation status and overall, disease-specific, disease-free and progression-free survival using the cBioPortal tool. The red lines represent the altered groups, and the blue lines represent the unaltered groups.
Ijms 23 11590 g004
Figure 5. Relationship between STK38 expression and immune infiltration (A) The expression of STK38 is significantly correlated with a variety of immune cells infiltration levels based on CIBERSORT. * p < 0.05, ** p < 0.01, and *** p < 0.001. (B) The potential correlation analysis of STK38 expression and immune infiltration of cancer-associated fibroblasts. The red color represents a positive relationship (0–1), while the blue color indicates a negative relationship (−1–0). The relationship with p-value < 0.05 is statistically significant. Statistically non-significant relationship are labeled with a cross. (C) The scatter plots of related cancers including HNSC-HPV-, LGG, TGCT, PRAD, SARC and PAAD.
Ijms 23 11590 g005
Figure 6. Top three scatter plots of correlation between STK38 expression and ImmuneScore, StromalScore and ESTIMATEScore in multiple cancers.
Ijms 23 11590 g006
Figure 7. Enrichment and pathway analysis of STK38-related partners. (A) The experimentally verified STK38-binding proteins were obtained from the STRING website. (B) The correlation analysis between STK38 and selected binding genes including PKN2, NUMB, MAPK14, SP1 and SRPK1 using the GEPIA2 tool. (C) The corresponding heatmap data of different cancer types are displayed in detail. (D) GO and KEGG pathway analysis were performed based on the STK38-binding and interacted genes.
Ijms 23 11590 g007
Table 1. Association of STK38 expression with DNA methylation.
CancerMethylation
p-ValueCorrelation
ACC0.0820.197
BLCA0.054−0.095
BRCA<0.001−0.25
CESC<0.001−0.317
CHOL0.438−0.133
COAD<0.001−0.479
READ<0.001−0.378
DLBC0.6270.072
ESCA0.02−0.291
GBM0.10.231
HNSC<0.001−0.176
KICH0.401−0.106
KIRC0.011−0.142
KIRP0.0190.142
LAML0.0470.188
LGG0.008−0.117
LIHC<0.001−0.272
LUAD0.042−0.096
LUSC<0.001−0.222
MESO0.437−0.085
OV0.396−0.393
PAAD0.0010.294
PCPG<0.0010.363
PRAD<0.0010.216
SARC0.0050.175
SKCM<0.001−0.218
STAD0.033−0.116
TGCT<0.0010.349
THCA<0.001−0.419
THYM<0.0010.548
UCEC0.571−0.027
UCS0.001−0.423
UVM0.032−0.241
KIRC0.006−0.156
The p-values in bold are statistically significant (less than 0.05).
Publisher’s Note: MDPI stays neutral with regard to jurisdictional claims in published maps and institutional affiliations.

