Communication

Silica Shell Thickness-Dependent Fluorescence Properties of SiO2@Ag@SiO2@QDs Nanocomposites

1
Department of Bioscience and Biotechnology, Konkuk University, Seoul 05029, Korea
2
Department of Chemical and Biological Engineering, Hanbat National University, Deajeon 34158, Korea
3
Gordon Center for Medical Imaging, Department of Radiology, Massachusetts General Hospital, Harvard Medical School, Boston, MA 02114, USA
*
Author to whom correspondence should be addressed.
Int. J. Mol. Sci. 2022, 23(17), 10041; https://doi.org/10.3390/ijms231710041
Submission received: 12 August 2022 / Revised: 27 August 2022 / Accepted: 31 August 2022 / Published: 2 September 2022
(This article belongs to the Special Issue Functional Optical Nano/Micromaterials)

Abstract

:
Silica shell coatings, which constitute important technology for nanoparticle (NP) developments, are utilized in many applications. The silica shell’s thickness greatly affects distance-dependent optical properties, such as metal-enhanced fluorescence (MEF) and fluorescence quenching in plasmonic nanocomposites. However, the precise control of silica-shell thicknesses has been mainly conducted on single metal NPs, and rarely on complex nanocomposites. In this study, silica shell-coated Ag nanoparticle-assembled silica nanoparticles (SiO2@Ag@SiO2), with finely controlled silica shell thicknesses (4 nm to 38 nm), were prepared, and quantum dots (QDs) were introduced onto SiO2@Ag@SiO2. The dominant effect between plasmonic quenching and MEF was defined depending on the thickness of the silica shell between Ag and QDs. When the distance between Ag NPs to QDs was less than ~10 nm, SiO2@Ag@SiO2@QDs showed weaker fluorescence intensities than SiO2@QD (without metal) due to the quenching effect. On the other hand, when the distance between Ag NPs to QDs was from 10 nm to 14 nm, the fluorescence intensity of SiO2@Ag@SiO2@QD was stronger than SiO2@QDs due to MEF. The results provide background knowledge for controlling the thickness of silica shells in metal-containing nanocomposites and facilitate the development of potential applications utilizing the optimal plasmonic phenomenon.

1. Introduction

Multifunctional nanomaterials, nanomaterials possessing multiple different properties in a single nanostructure platform, recently attracted great attention because of their potential applications in biology [1]. However, the structure and components of multifunctional nanomaterial must be carefully designed to maximize their intrinsic functions [2]. Among different functional nanomaterials, the integration of plasmonic metal nanoparticles (NPs) and fluorescent NPs in multifunctional nanomaterial is a promising combinatorial approach as they complement each other and overcome their intrinsic weaknesses [3]. For example, fluorescence bleaching can be overcome when plasmonic and fluorescence properties combine in multifunctional nanomaterials. The presence of plasmonic metal nanostructures such as gold and silver NPs can enhance fluorescent intensities via metal-enhanced fluorescence (MEF) or surface-enhanced fluorescence (SEF) phenomena [4]. As a result, many studies recently reported plasmonic-enhanced fluorescence properties for bioapplications [5,6,7,8,9,10,11,12,13,14,15,16,17,18,19,20,21].
According to the literature, fluorescent intensities increase dramatically between a metal surface and a fluorophore at a distance of 20 to 50 nm [22,23,24]. On the contrary, the quenching effect appears when the metal–fluorophore distance is below 20 nm because of the electron transfer from the excited fluorophore to the metal surface [22,23,24]. Therefore, it is necessary to develop appropriate synthesis methods, maintaining an optimum distance between the plasmonic and fluorescent components to maximize the fluorescent property of hybrid plasmonic-enhanced nanomaterials and avoid metal-induced quenching. In addition, the methods should be simple and cost-effective with options for various functionalizations. Various methods have been developed via tuning the separation distance between the fluorophore and the metallic surface in controlling plasmonic-enhancement effects [25,26,27]. For example, Liang et al. used charged polyelectrolytes to control the distance between the polymeric fluorophore and Ag nanocubes [25]. In addition, various silica (SiO2) shells (up to 30 nm) were coated on Ag NPs to investigate the interparticle distance-dependent fluorescence of Au nanoclusters [26]. Ke et al. reported the MEF and metal-enhanced singlet oxygen generation of SiO2-coated Au nanorod core–shell structures with aluminum phthalocyanine [28]. Among them, the core–shell structure provides spatial separations between plasmonic NPs and fluorophore for the MEF and also chemically stabilized metal NPs [26,29].
SiO2 is the most widely used material for shell coatings [30,31,32,33] due to its cost-effectiveness, chemical inertness, easy surface modification, biocompatibility, and optical transparency [34]. As a result, many studies on SiO2 coatings of metal NP structures have been reported. For example, Tian et al. prepared Au@SiO2 core–shells and etched its surface to create a pinhole structure [35,36]. Moreover, the presence of thin SiO2 shells prevents the adsorption of molecules on the Au core and simultaneously improves thermal stability [37,38,39].
However, the precise control for SiO2 shelling of nanocomposites remains a major challenge. In particular, the SiO2 shell’s thickness in nanocomposites, which include metallic components and fluorophores or Raman-labeling compounds, greatly affects their physicochemical properties such as plasmonic quenching, MEF, and SERS, which depend strongly on the distance between the metallic surfaces and the molecules with specific properties [24,40,41,42]. Nevertheless, studies on SiO2 shell’s thickness control and optical properties of NPs have been mainly conducted on single metal NPs [35,43,44,45]. Furthermore, only a few reports have been published on the fine-tunable control of the SiO2 shell thicknesses of metallic nanocomposite and their effects from the metal surface to fluorophores on fluorescence characteristics.
Ag NP-assembled SiO2 (SiO2@Ag) has been developed by our group as a basic platform for fluorescence, SERS, and magnetism [2,46,47]. The desired absorption wavelength of SiO2@Ag nanocomposite can be tuned efficiently by the presence of assembled Ag NPs on the SiO2 surface [48,49].
In this study, the number of NPs and the amount of SiO2 precursor were investigated to finely modulate the thickness of SiO2 shell on the surface of SiO2@Ag without structural destruction. In addition, quantum dots were introduced into a SiO2 shell-coated SiO2@Ag nanocomposite, and their optical properties according to the thickness of the shell are reported. This study presents a valuable approach that can provide optimal conditions for fluorescence enhancement through the fine control of the SiO2 shell thickness of nanocomposites. Our results show that single metal nanoparticles as well as nanocomposites exhibit the presence of MEF phenomena according to the SiO2‘s shell thickness.

2. Results and Discussion

SiO2@Ag as nanocomposites were synthesized as pre-reported [50,51]. Briefly, SiO2 NPs (153 ± 2.4 nm) were prepared by the modified Stöber method and were incubated with 3-mercaptopropyl trimethoxysilane (MPTS) to convert hydroxyl groups to thiol groups. Ag NPs were assembled on the SiO2-SH surface by reducing silver nitrate (AgNO3) in ethylene glycol (EG) with octylamine (OA). The transmission electron microscope (TEM) images of the SiO2 and SiO2@Ag NPs, shown in Figure S1, confirmed their uniform size and shape and excellent dispersion in ethanol without aggregation. The SiO2@Ag NPs exhibit their rough surfaces due to the assembly of Ag NPs. The average diameter of SiO2@Ag NPs, as measured by ImageJ software, is 188 ± 7.3 nm. The optical properties of the NPs were investigated by using UV-Vis spectrophotometry. Figure S1C shows the UV-Vis absorbance spectra of the SiO2 and SiO2@Ag NPs. The UV-Vis absorbance of SiO2 NPs decreased rapidly from 300 nm to 1100 nm, corresponding to the absorbance of typical SiO2 NPs [52]. The UV-Vis absorbance of SiO2@Ag exhibits a broad localized surface plasma resonance (LSPR) band from 325 nm to 1100 nm and a maximum UV-Vis absorbance in the wavelength range from 400 to 500 nm, which corresponds to the absorption region of Ag NPs [53]. This result confirmed that Ag NPs were assembled on the SiO2 surface, and the nanocomposite SiO2@Ag could absorb light from the visible to near-infrared region. According to the literature, LSPR from visible light to ultraviolet regions represents highly sensitive wavelengths depending on NP’s component, shape, and ambient mediums [54]. Therefore, the optical property of SiO2@Ag can be controlled by experimental conditions in our research. The thickness of the SiO2 shell is highly sensitive to experimental conditions. Therefore, it is difficult to evenly form a perfect silica shell with sub-nanometer thickness on the NPs because excessive reactions for the formation of non-core silica nanostructure such as silica NPs must be excluded. Therefore the SiO2 coating on the SiO2@Ag surface was controlled and applied by two experimental parameters, the amount of SiO2@Ag NPs itself or the amount of SiO2@Ag NPs combined with the amount of SiO2 precursor, according to a previously reported method [55]. Sodium silicate (Na2SiO3) and tetraethyl orthosilicate (TEOS) were used as SiO2 precursors. The morphology and structure of SiO2@Au@SiO2 with different silica shell thicknesses are observed by TEM images (Scheme 1A, Figure 1 and Figure S2). The observed silica shell layer on SiO2@Ag surface is quite homogeneous and ranges from 4 nm to 38 nm.
First, the formation of a silica shell from Na2SiO3 through solvent exchanges is a result of a sharp decrease in the solubility of Na2SiO3 in a mixture of water and ethanol, and controlling this process is difficult. Therefore, a small change of Na2SiO3 can also lead to a significant change in the formation of the silica-shell layer. Therefore, we fixed the amount of Na2SiO3 and changed the amount of SiO2@Ag to prevent the formation of non-core silica nanostructure, such as silica NPs. The amount of SiO2@Ag NPs was adjusted by changing the quantity of SiO2 from 5 mg (Figure 1A and Figure S1), 10 mg (Figure 1A and Figure S2), and 20 mg (Figure 1A and Figure S3), while 14.4 µL Na2SiO3 was fixed. By controlling the amount of SiO2@Ag NPs, thin silica shells were obtained in the range of 4 to 13 nm (Figure 1A and Figure S1: 4 ± 0.3 nm, Figure 1A and Figure S2: 9 ± 1.1 nm, Figure 1A and Figure S3: 13 ± 1.2 nm) without a leakage of Ag NPs from their surfaces. When the amount of SiO2@Ag decreases, the silica shell becomes is thicker. However, a decrease in SiO2@Ag NPs amounts leads to a low yield of SiO2@Ag@SiO2 products.
To generate a thicker silica shell on the SiO2@Ag surface with an expected product yield, TEOS was added into the S2 suspension to generate the samples Figure 1A, S4, S5, and S6. The formation of silica shell from TEOS occurs slowly and controllably through sol–gel processes. Therefore, we fixed the amount of SiO2@Ag and changed the amount of TEOS. Smooth and thicker silica shells with variable thickness were grown on SiO2@Ag NPs by the addition of different concentrations of TEOS at 1.2 mM (Figure 1A S4), 2.3 mM (Figure 1A S5), and 4.7 mM (Figure 1A S6). The thicknesses of silica shells on the SiO2@Ag@SiO2 are 16 ± 1.0 nm (Figure 1A S4), 24 ± 1.3 nm (Figure 1A S5), and 38 nm ± 2.0 nm (Figure 1A S6). These results demonstrated that the increase in TEOS concentrations leads thicker silica shells on the SiO2@Ag surface (Figure 1B). Moreover, the typical UV-Vis absorbance spectrum of SiO2@Ag@SiO2 was observed in Figure S1C. Similarly to SiO2@Ag, the UV-Vis spectra of SiO2@Ag@SiO2 also broaden from 325 to 1100 nm but its absorbance intensity slightly decreased.
The study on the effect of silica shell thickness on fluorescence properties was performed by introducing 7 mg of quantum dots (CdSe@ZnS, QDs, QY 96.2%) on the surface of SiO2@Ag@SiO2 possessing different silica-shell thicknesses to generate various quantum-dot-assembled SiO2@Ag@SiO2 (SiO2@Ag@SiO2@QDs) (Scheme 1B). For the introduction of QDs, the surface of SiO2@Ag@SiO2 was modified to a thiol group by MPTS. The morphology and size of SiO2@Ag@SiO2@QDs was confirmed by TEM images (Figure 2). As the silica shell became thinner, the introduced QDs were agglomerated and had a rough shape. In contrast, the aggregation decreased and distributed evenly as the silica shell was thicker. Moreover, the size of SiO2@Ag@SiO2@QDs increased with the introduction of QDs (QS1: ca.240.3, QS2: ca.252.2, QS3: ca.265.4, QS4: ca.270.1, QS5: ca.288.5, QS6: ca.306.8). These results show that QDs can be introduced into SiO2@Ag@SiO2 surfaces to generate SiO2@Ag@SiO2@QDs. When QDs were assembled on the surface of SiO2@Ag@SiO2, the maximum emission wavelength of QDs was blue shifted from 620 to 617 nm.
Figure 3 shows the change of fluorescence intensity by metals according to shell thicknesses. The emission spectra in Figure 3 showed that the fluorescent intensities at 620 nm of QDs significantly increased with silica-shell thicknesses and reached a maximum value at the 14 nm silica shell. Fluorescence intensities tended to decrease as shell thicknesses exceeded 14 nm. To compare the effect of metals on the fluorescence of QDs, SiO2 NPs with similar sizes were introduced by QDs (Figure S3). When the distance between the QDs to Ag NPs was less than ~9 nm, the fluorescence intensities of SiO2@Ag@SiO2@QDs were weaker than those of SiO2@QDs. However, it was observed that the fluorescence intensities of SiO2@Ag@SiO2@QDs were stronger when the distance between QDs and Ag NPs was between about 9 nm and 14 nm, and then it weakened again as this distance increased. The increase in fluorescence intensity with the silica shell thickness can be explained by two effects that affect the emission spectrum, which varies with distance [56]: the emission quenching [57] of metal NPs for the photoexcited QDs due to resonant energy transfers and the fluorescence enhancement of NPs promoted by the excitation of their localized surface plasmon resonances [58]. These phenomena, quenching and MEF, occur when the distance between the metal NPs to the fluorophores is within 20 nm [59], but details about the distance have not been revealed. It is important to note that small changes between metal NPs and fluorophores particularly affect metal emission properties. The only variable influencing is the plasmonic electromagnetic field decay exponential with the distance to the metal surface. Quenching is a phenomenon in which Förster resonance energy transfer (FRET) occurs when the distance between the metal NPs and the fluorophore is less than 10 nm. Therefore, it is considered that the fluorescence intensity of SiO2@Ag@SiO2@QD is weaker than that of SiO2@QD due to the quenching process caused by a distance between Ag NPs and QDs that is less than 10 nm [60]. Moreover, it is believed that the resonance excitation of LSPR on Ag NPs on the SiO2 surface generates an enhanced local field when the distance between Ag NPs and QDs is 9–14 nm, which greatly increases the fluorescence intensity of QDs. Therefore, when the distance between the QDs and the Ag NPs increases within 14 nm, it is estimated that the fluorescence signal is strengthened due to the increase in the MEF and a decrease in the quenching effect.

3. Materials and Methods

3.1. Materials

Ethyl alcohol (EtOH, 99.5% and 95%), tetraethyl orthosilicate (TEOS), ethylene glycol (EG), 3-mercaptopropyl trimethoxysilane (MPTS), silver nitrate (AgNO3), polyvinylpyrrolidone (PVP, average molecular weight ≈ 40,000), and octylamine (OA) were used without further purification. Ammonium hydroxide (NH4OH, 25~28%) was purchased from Daejung Chemicals & Metals Co., Ltd. (Siheung, Korea). CdSe@ZnSs (QDs) were obtained from Zeus (Osan, South Korea), and 18.2 Ω water was obtained using a Direct-Q Millipore purification system (SAM WOO S&T Co., Ltd., Seoul, Korea).

3.2. Methods

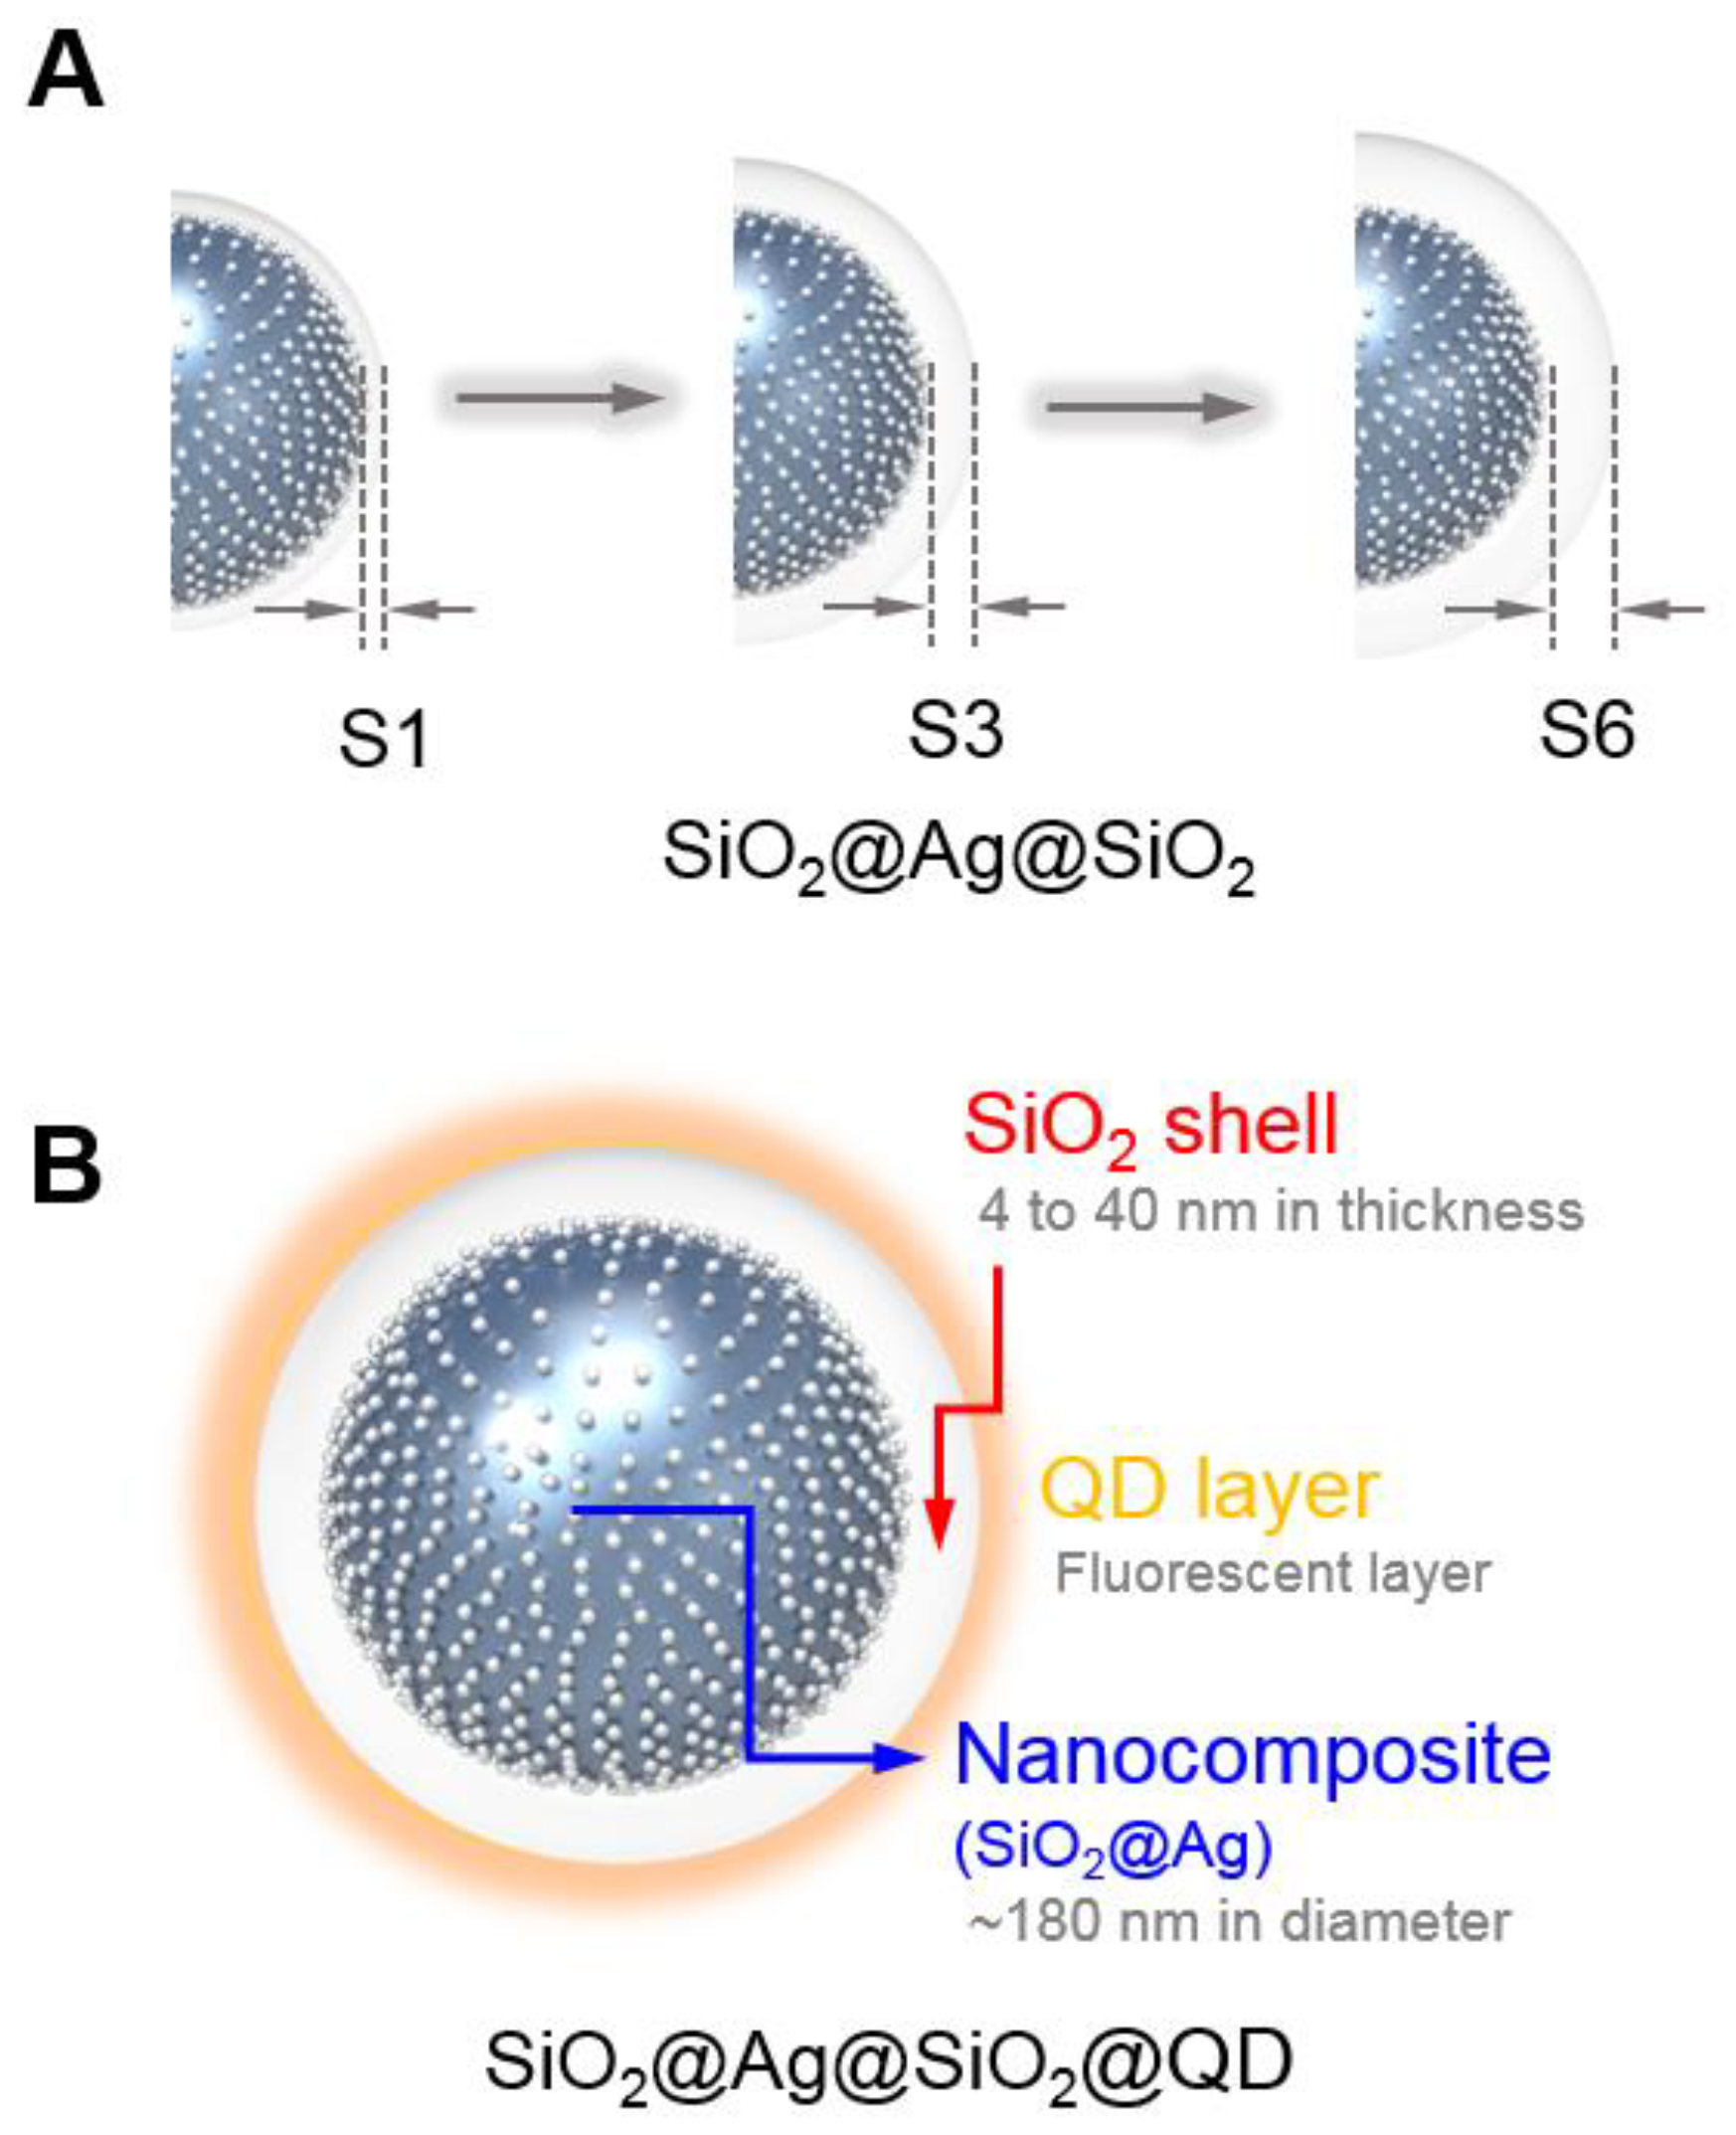
3.2.1. Preparation of Ag-Assembled Silica NPs (SiO2@Ag)

SiO2 NPs (150 nm) were prepared using the modified Stöber method [61]. The surface of SiO2 NPs was converted to thiol groups by incubating SiO2 NPs (4 mL, 50 mg·mL−1 suspension in EtOH), MPTS (200 μL) and NH4OH solutions (27%, 40 µL). The suspension was stirred at 700 rpm at 25 °C for 12 h. Next, the suspension was centrifuged at 8500 rpm and washed several times with EtOH. The thiolated SiO2 NPs (SiO2-SH) was dispersed in EtOH and the final concentration was adjusted to 50 mg·mL−1. Ag NPs were added on the surface of the thiolated SiO2 NPs by a reduction of AgNO3 in the presence of PVP. The SiO2-SH NPs (0.6 mL, 50 mg·mL−1 in EtOH) were added in an EG solution containing PVP (5 mg), AgNO3 (26 mg), and octylamine (41.4 µL). The suspension was stirred at 700 rpm at 25 °C for 1 h. Then, the suspension was centrifuged at 8500 rpm and washed several times with EtOH. SiO2@Ag was dispersed in EtOH.

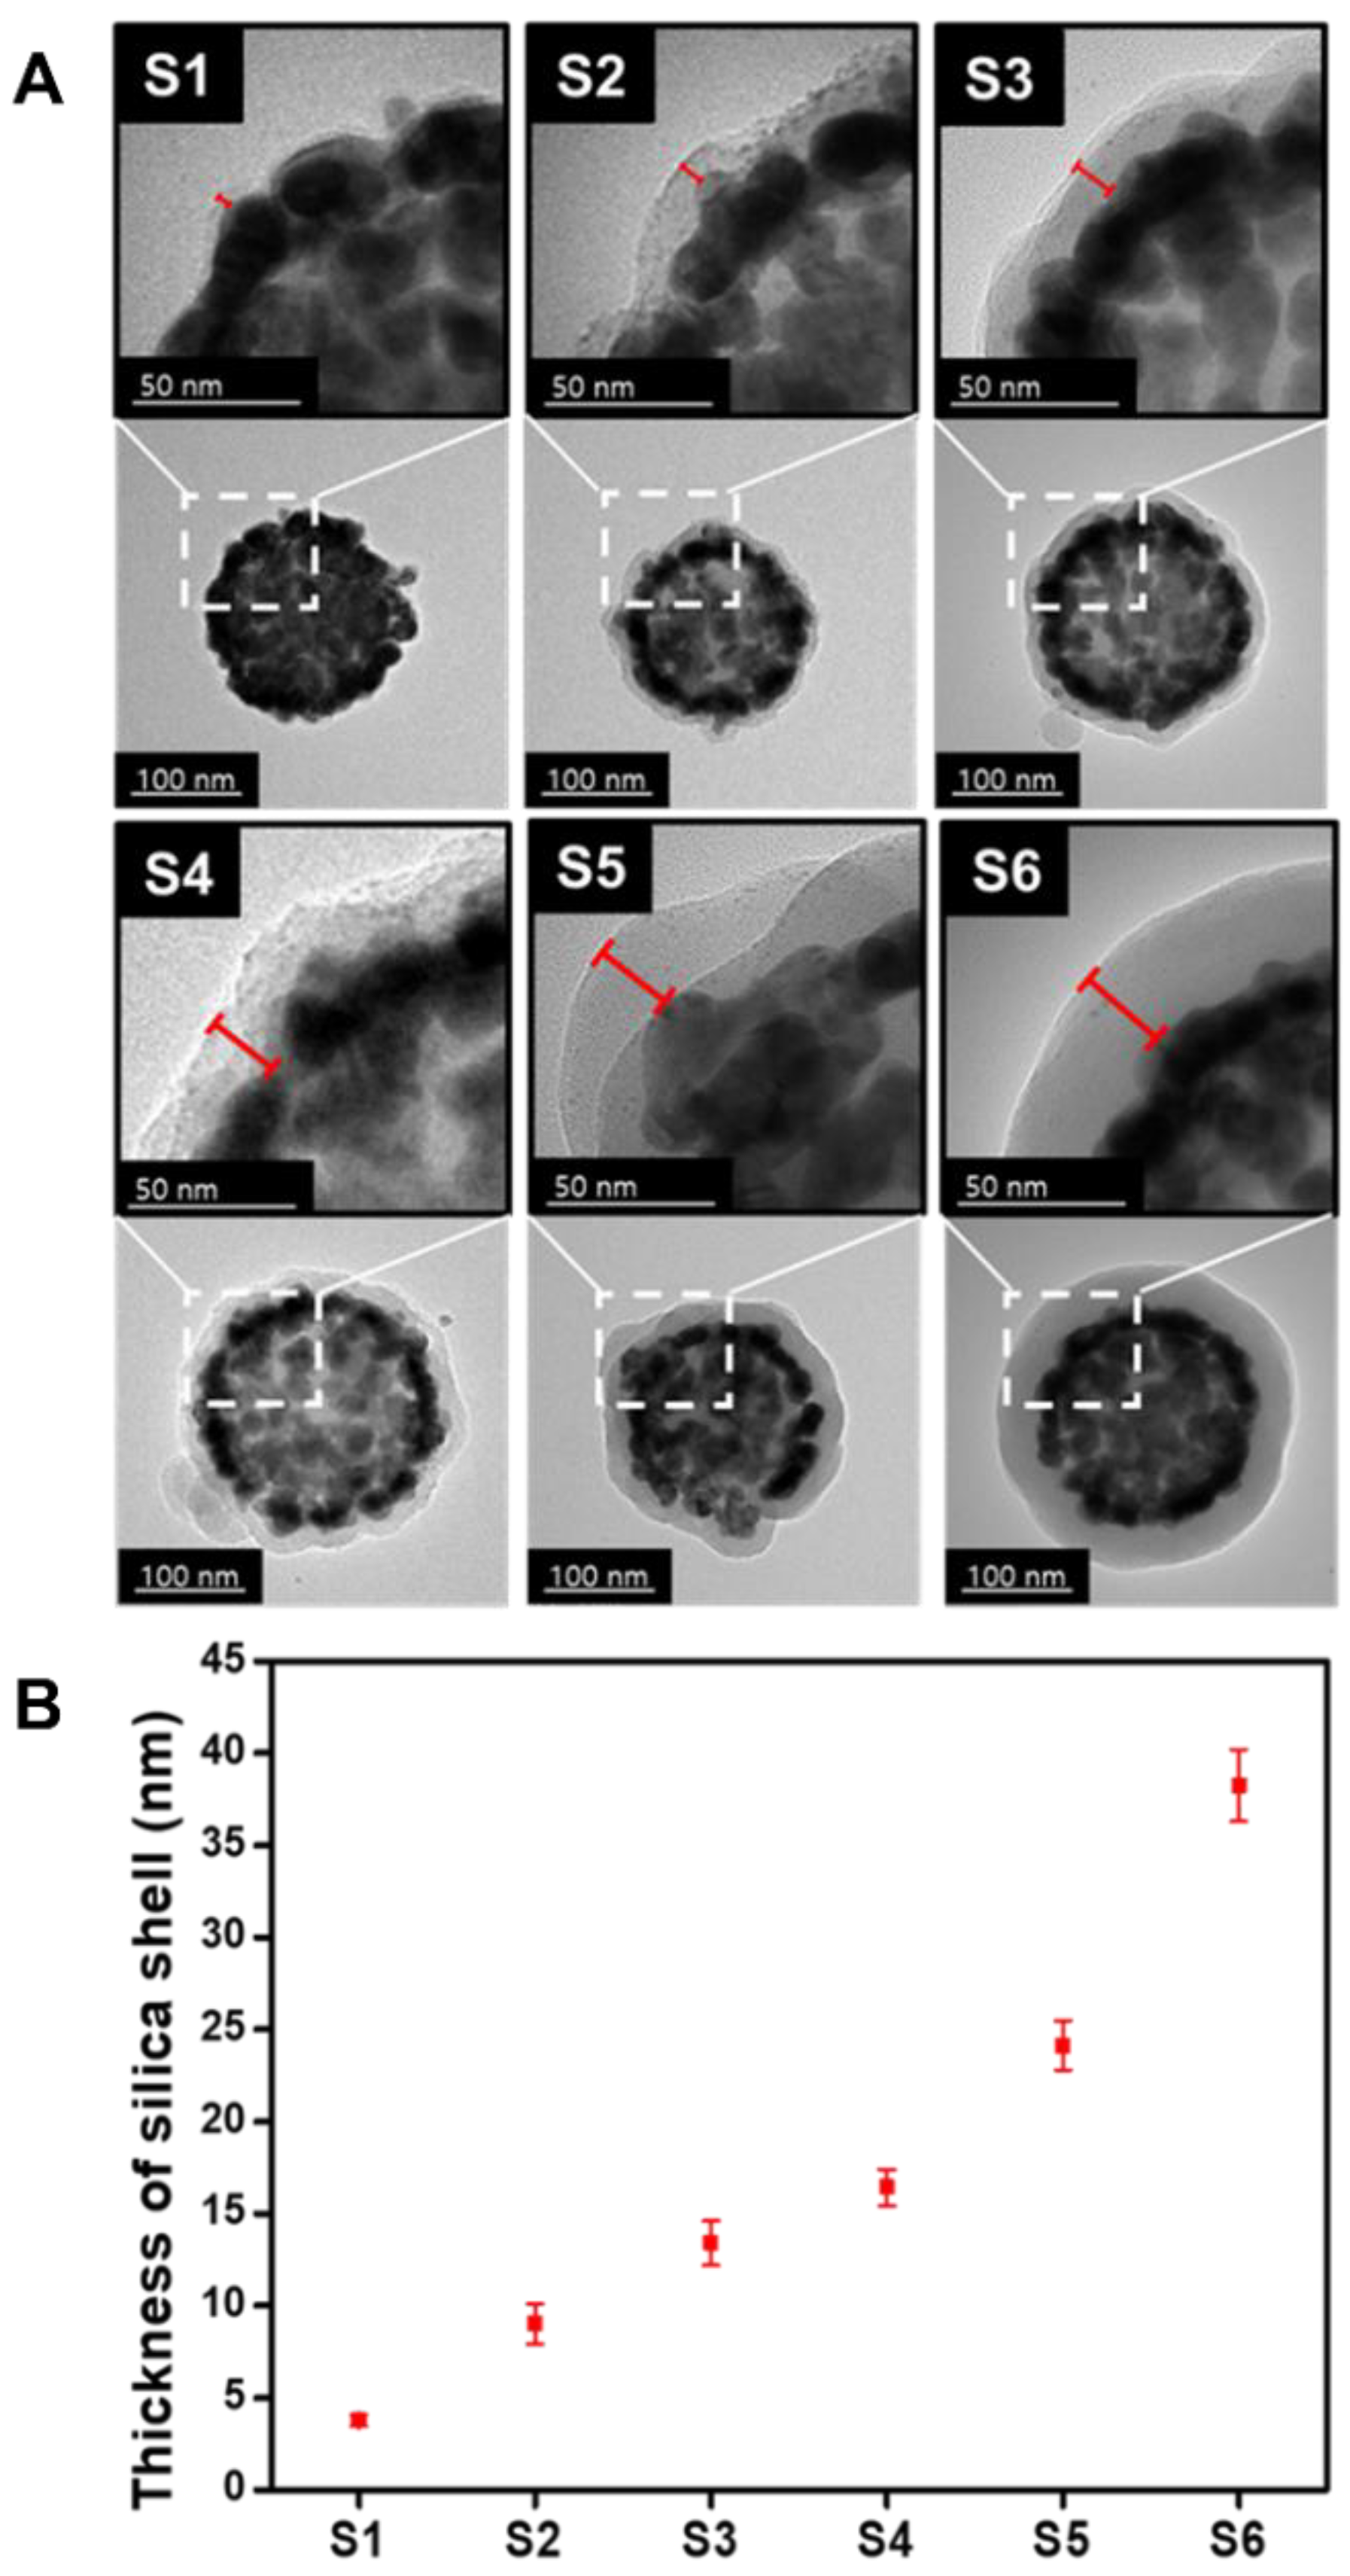
3.2.2. Preparation of Silica-Shell-Coated SiO2@Ag with Various Thicknesses (SiO2@Ag@SiO2)

Various amounts of the SiO2@Ag (5, 10, and 20 mg) were separately dispersed in EtOH (1 mL) to prepare samples S1, S2, and S3. Distilled water (15 mL) containing 14.4 μL Na2SiO3 was mixed with the above SiO2@Ag suspension. The prepared suspension was stirred at 700 rpm for 1 h. A 60 mL aliquot of EtOH was then added to the resulting suspensions for solvent exchange. After 3h, parts of sample S2 containing 10 mg of SiO2@Ag were mixed with different concentrations of TEOS (1.2 mM, 2.3 mM, and 4.7 mM) under stirring at RT for 24 h to prepare samples S4, S5, and S6. After stirring, the above suspension was centrifuged at 8500 rpm and washed with EtOH to remove excess reagents.

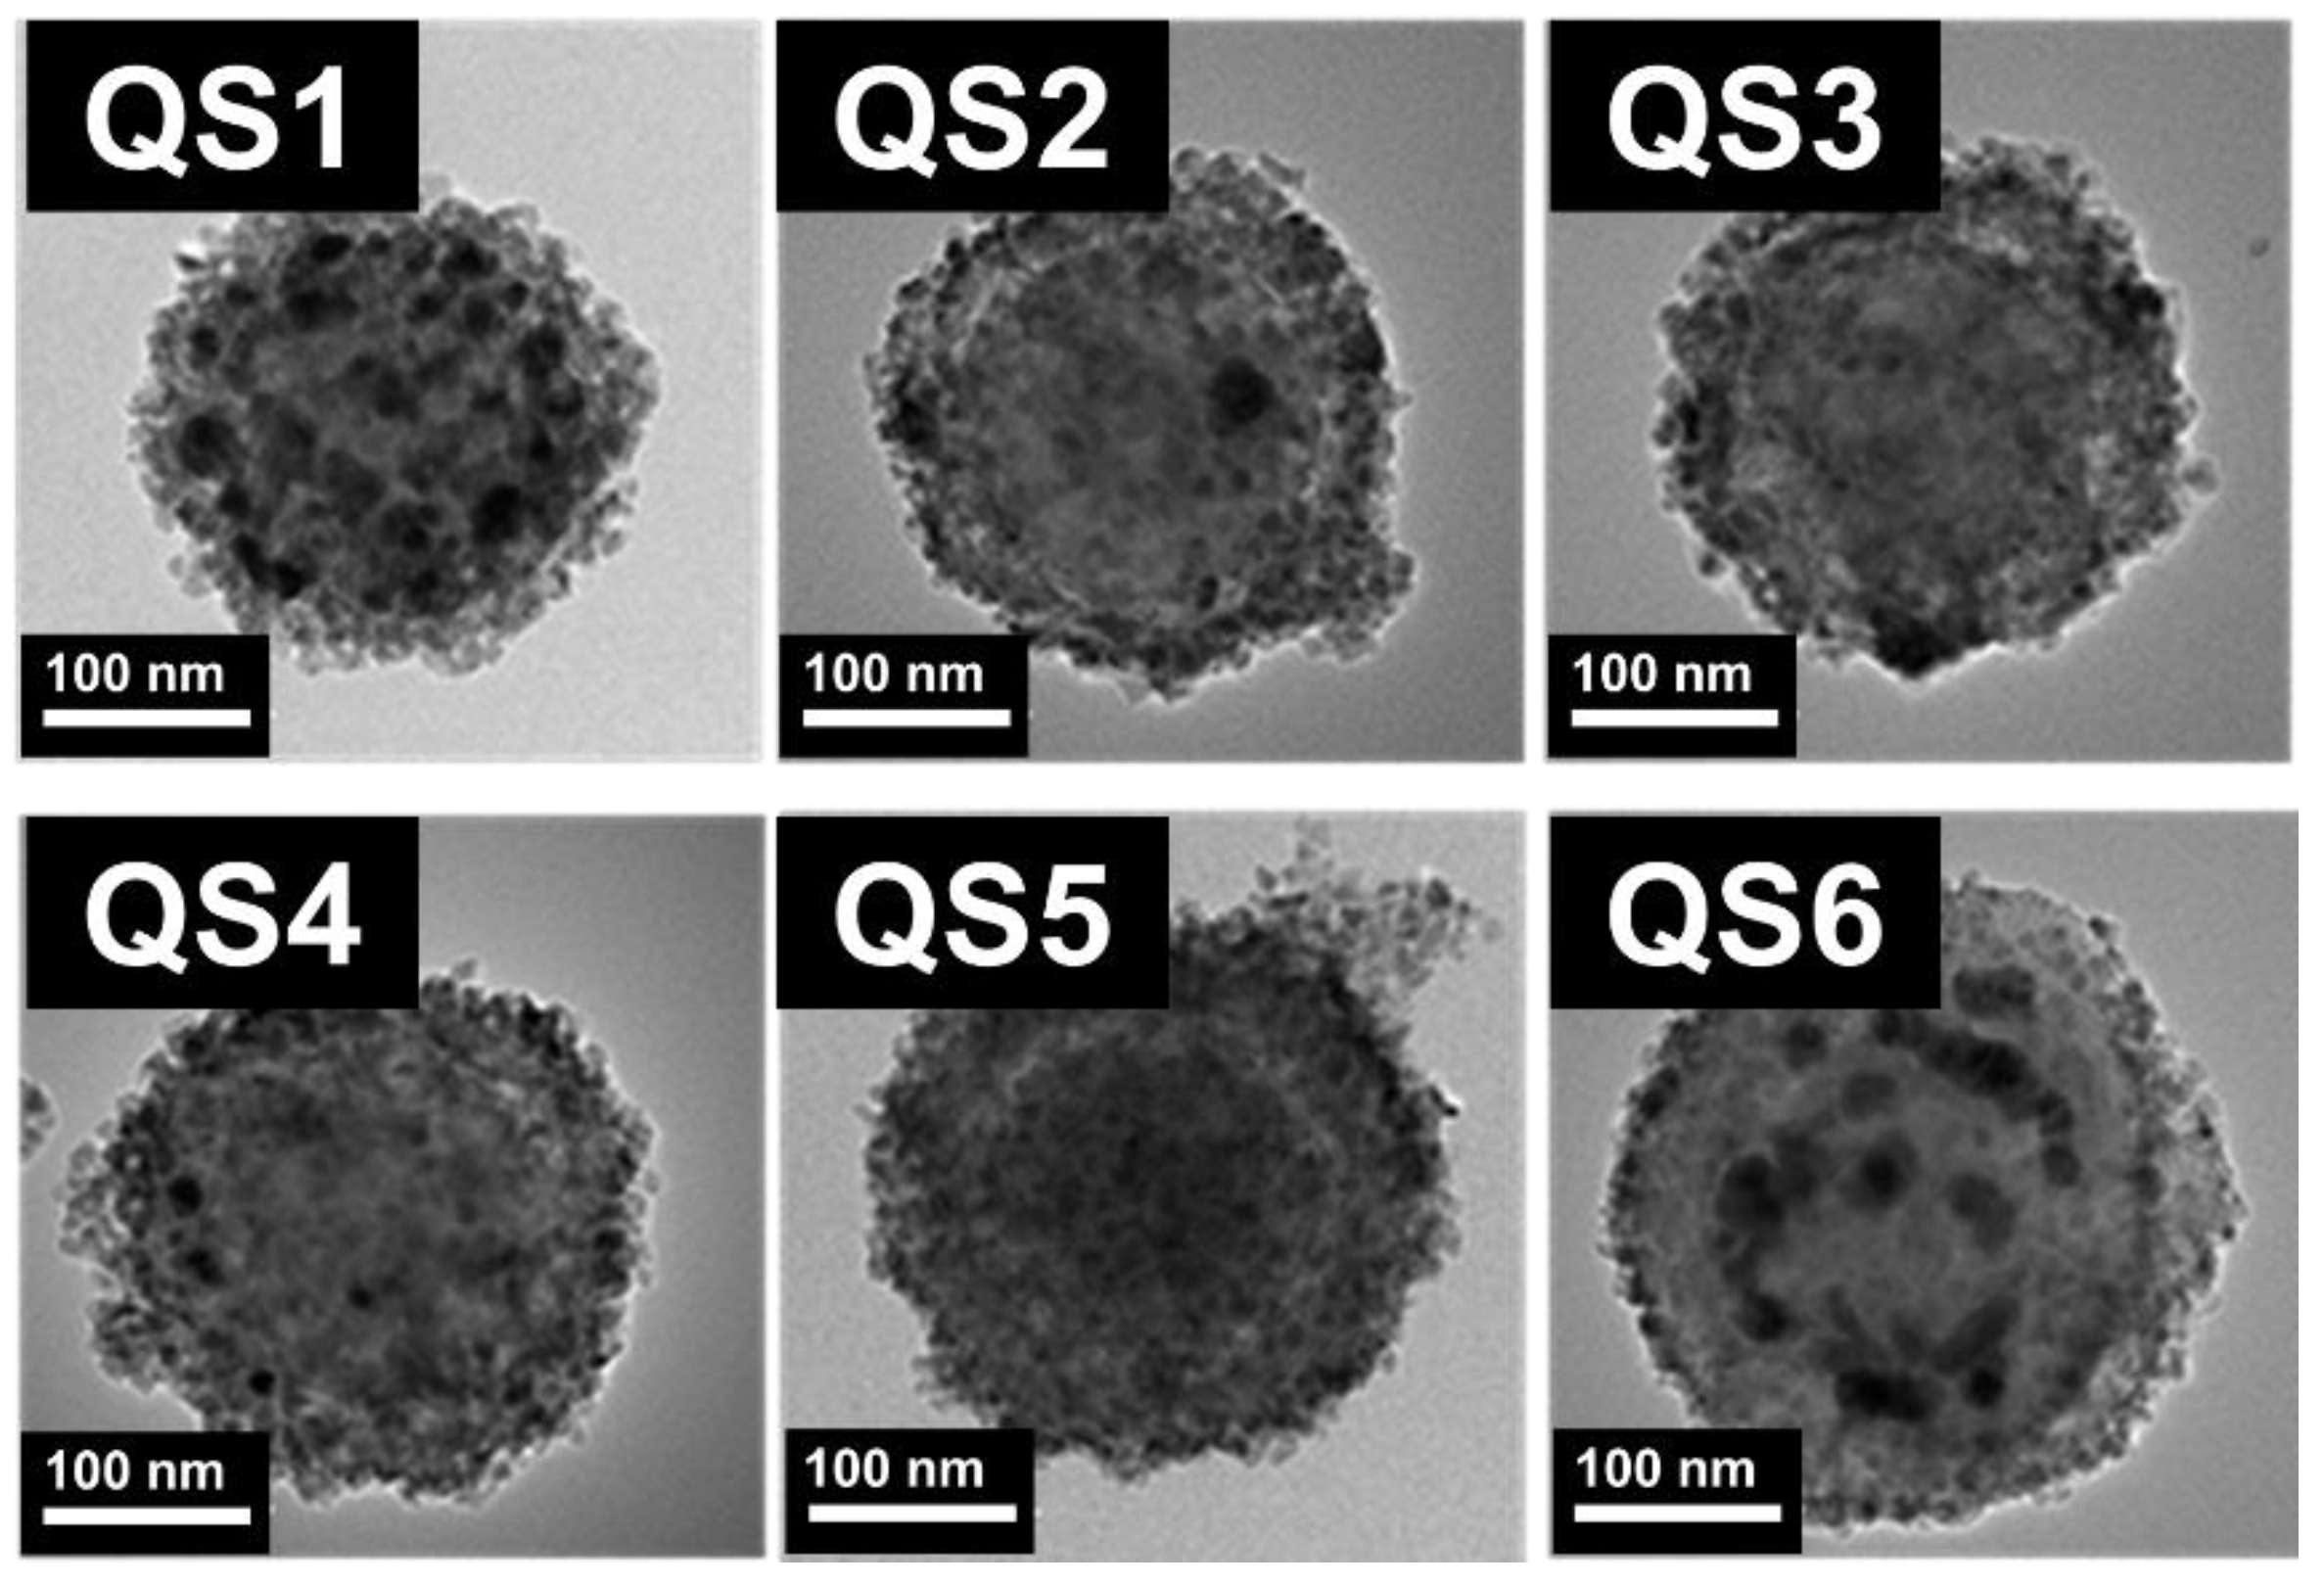
3.2.3. Introduction of QDs onto the Surface of SiO2@Ag@SiO2 (SiO2@Ag@SiO2@QD)

The surfaces of SiO2@Ag@SiO2 with various shell thickness (1 mL, 10 mg·mL−1) in EtOH were converted to thiol groups by vortexing MPTS (50 μL) and NH4OH (1%, 50 μL) for 1 h at 50°C to prepare thiol-modified SiO2@Ag@SiO2. The QDs (7mg), thiol-modified SiO2@Ag@SiO2 (10 mg), and a DCM (4 mL) were injected to a vial in series, and the mixture was vigorously vortexed for few seconds and shaken for 3 h. The resulting mixture was washed several times with EtOH and re-dispersed in EtOH (2 mg·mL−1) to obtain SiO2@Ag@SiO2@QDs.

3.2.4. Physical Property Analysis of NPs

The size and morphology of prepared NPs were measured by transmission electron microscope (Libra 120, Carl Zeiss, Jena, Germany). The prepared NPs were well dispersed in EtOH (1 mg·mL−1). Then, 10 μL of the sample was dropped and dried at 25 °C on a 400-mesh copper grid (Pelco, Presno, CA, USA). The thicknesses of the SiO2 shell were analyzed by digitalized measurements using Image J software (v.1.53k, Bethesda, MD, USA). The average size of the NPs and the thickness of the SiO2 shell were calculated after analyzing at least 50 NPs.

3.2.5. Measurement of UV-Vis Absorption Spectra

The particles were well dispersed in EtOH to obtain a suspension of 2 mg·mL−1 nanoparticle and transferred to a cuvette. UV-Vis absorption of the sample was performed in the wavelength from 300 to 1100 nm at the scanning speed of 1 or 5 nm/s by using a UV-Vis spectrophotometer (Mecasys OPTIZEN POP, Daejeon, Korea)

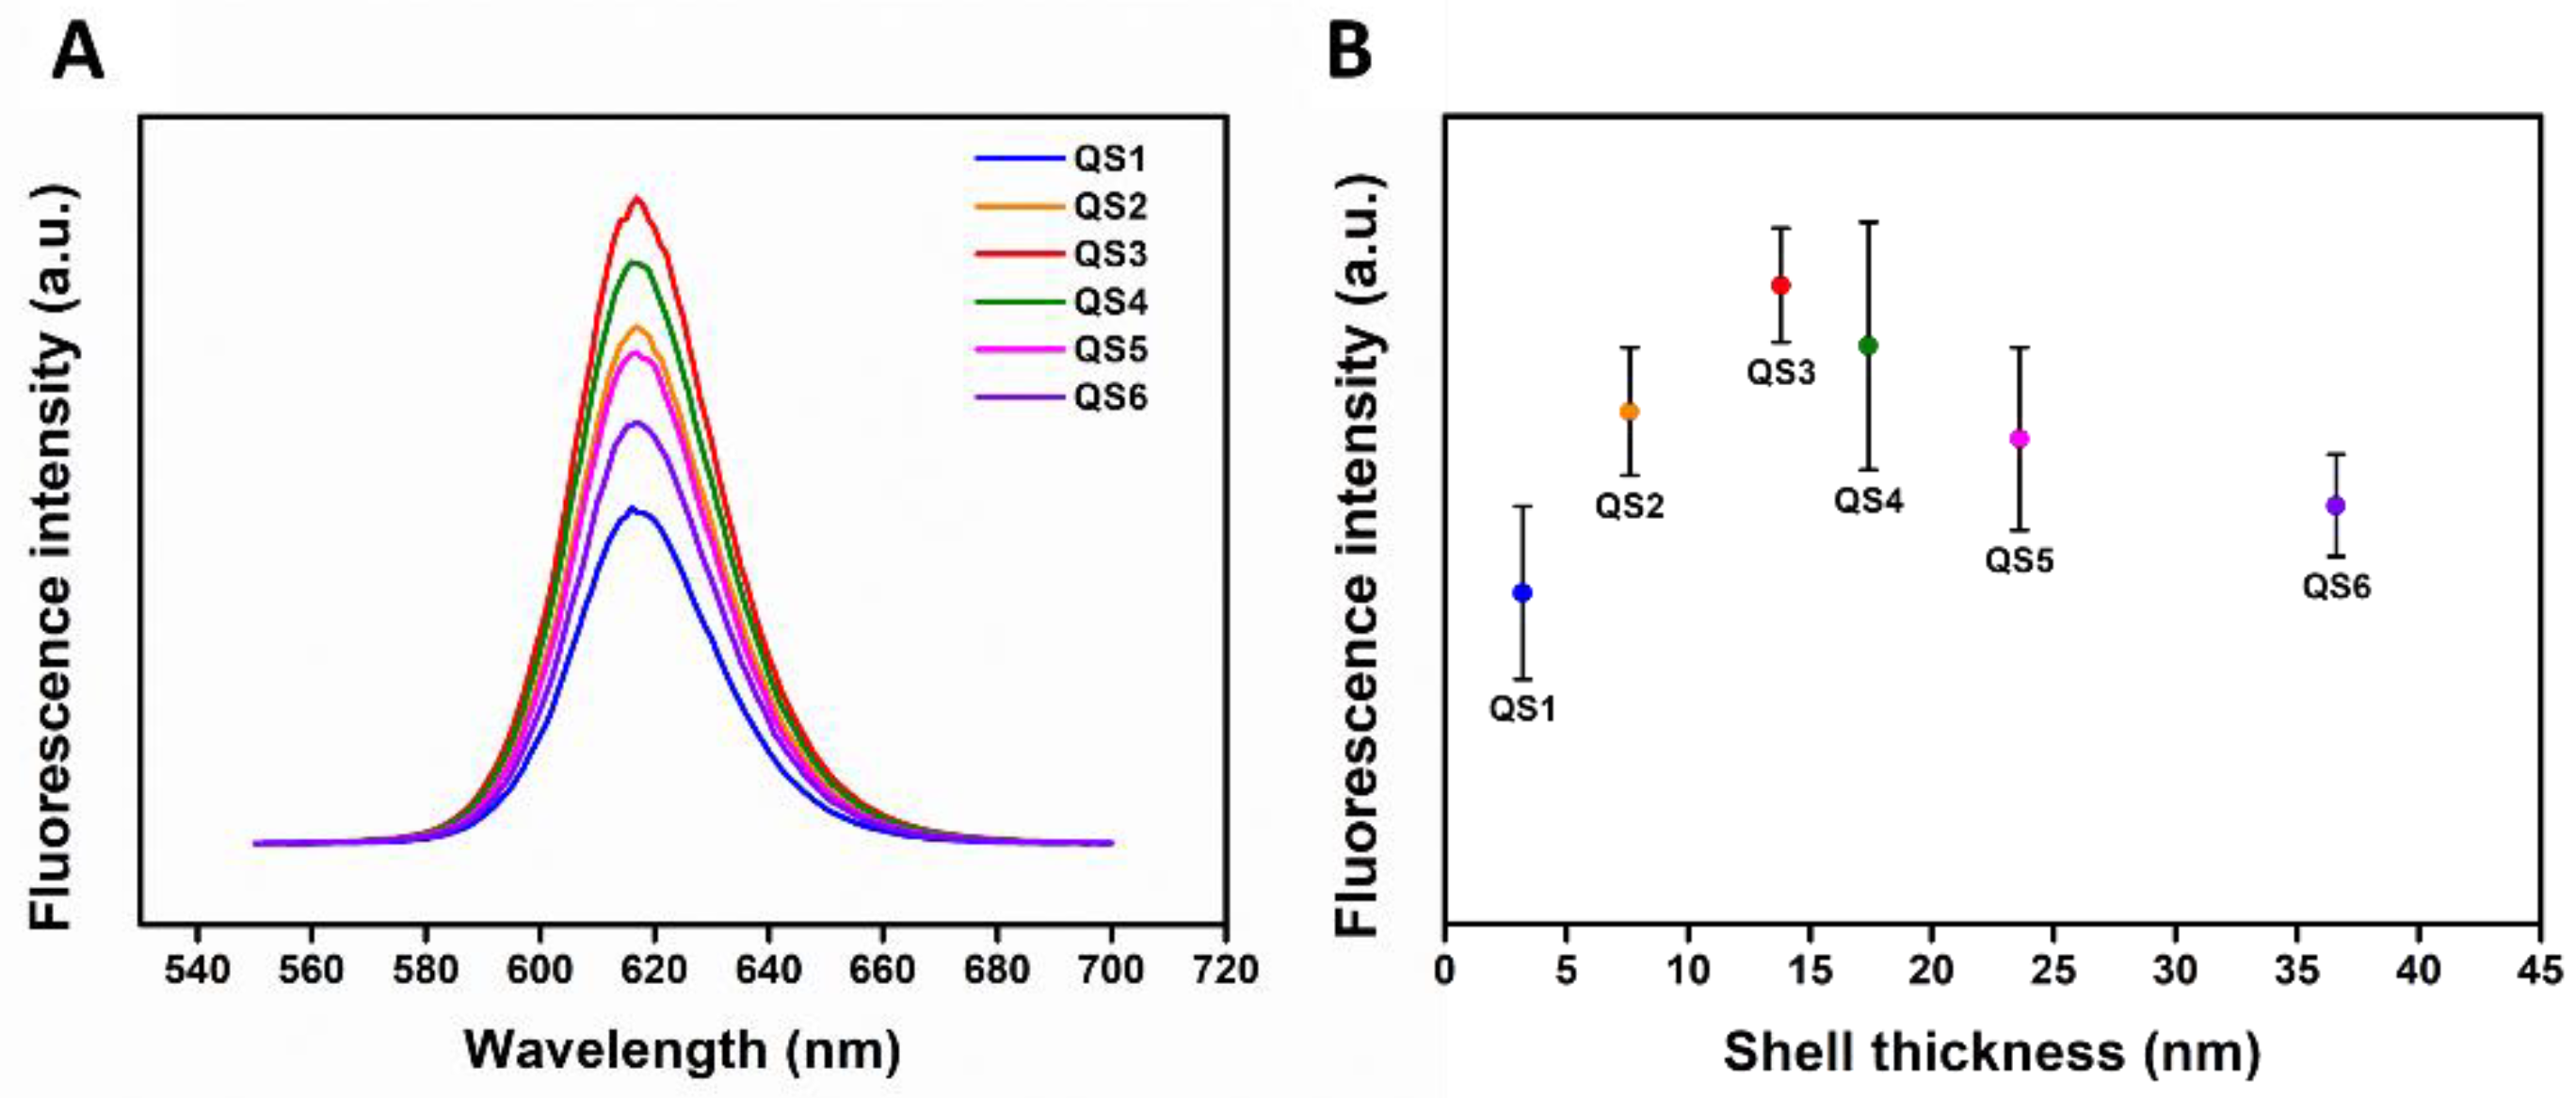
3.2.6. Fluorescence Analysis of SiO2@Ag@SiO2@QDs

The fluorescence emission spectrum was analyzed by using a Cary Eclipse Fluorescence Spectrophotometer (Agilent Technologies, Santa Clara, CA, USA). An NP suspension (1 mg·mL−1) measuring 300 μL was added in a 96-well plate. The excitation wavelength was set at 385 nm. The sample was excited for 10 s and the fluorescence of the sample was collected in the range from 550 to 700 nm for 10 s.

4. Conclusions

A fascinating approach to silica-shell coatings on SiO2@Ag, one of the nanocomposites for multilayer synthesis, allowed us to control silica-shell thicknesses in a wide range from 4 nm to 38 nm. The thickness of the silica shell was finely controlled with two methods: controlling the amount of SiO2@Ag itself or combining the amount of SiO2@Ag and the silica precursor. Silica-shell thicknesses on the SiO2@Ag surface were measured to be 4 ± 0.3, 9 ± 1.1, 13 ± 1.2, 16 ± 1.0, 24 ± 1.3, and 38 ± 2.0 nm. As a result of testing, the effects of metal on the fluorescence according to the distance using the difference in the silica-shell thickness, the quenching effect, and MEF were observed with at a distance between Ag NPs to QDs within about 14 nm. When the distance between Ag NPs to QDs was less than ~10 nm, SiO2@Ag@SiO2@QDs showed weaker fluorescence intensities than SiO2@QD (without metal) due to the quenching effect. On the other hand, when the distance between Ag NPs to QDs was from 10 nm to 14 nm, the fluorescence intensity of SiO2@Ag@SiO2@QD was stronger than SiO2@QDs due to MEF. These results are expected to be useful for synthesizing multilayer nanocomposites with optimized SERS and MEF effects by the fine control technology of silica shells.

Supplementary Materials

The following supporting information can be downloaded at: https://www.mdpi.com/article/10.3390/ijms231710041/s1.

Author Contributions

E.H. and B.-H.J. conceived and designed the experiments. E.H. and A.J. performed the experiments. E.H., A.J., H.K., S.H.L. and X.-H.P. analyzed the data. E.H. and X.-H.P. wrote the manuscript. B.-H.J. edited manuscript and supervised the overall work. All authors have read and agreed to the published version of the manuscript.

Funding

This research was funded by Konkuk University (2020-A019-0117).

Institutional Review Board Statement

Not applicable.

Informed Consent Statement

Not applicable.

Data Availability Statement

Not applicable.

Acknowledgments

The authors are grateful for the financial support from Konkuk University.

Conflicts of Interest

The authors declare no conflict of interest.

References

  1. Sangtani, A.; Nag, O.K.; Field, L.D.; Breger, J.C.; Delehanty, J.B. Multifunctional nanoparticle composites: Progress in the use of soft and hard nanoparticles for drug delivery and imaging. WIREs Nanomed. Nanobiotechnol. 2017, 9, e1466. [Google Scholar] [CrossRef] [PubMed]
  2. Kim, H.-M.; Kim, D.-M.; Jeong, C.; Park, S.Y.; Cha, M.G.; Ha, Y.; Jang, D.; Kyeong, S.; Pham, X.-H.; Hahm, E.; et al. Assembly of Plasmonic and Magnetic Nanoparticles with Fluorescent Silica Shell Layer for Tri-functional SERS-Magnetic-Fluorescence Probes and Its Bioapplications. Sci. Rep. 2018, 8, 13938. [Google Scholar] [CrossRef] [PubMed]
  3. Jeong, Y.; Kook, Y.-M.; Lee, K.; Koh, W.-G. Metal enhanced fluorescence (MEF) for biosensors: General approaches and a review of recent developments. Biosens. Bioelectron. 2018, 111, 102–116. [Google Scholar] [CrossRef] [PubMed]
  4. Badshah, M.A.; Koh, N.Y.; Zia, A.W.; Abbas, N.; Zahra, Z.; Saleem, M.W. Recent Developments in Plasmonic Nanostructures for Metal Enhanced Fluorescence-Based Biosensing. Nanomaterials 2020, 10, 1749. [Google Scholar] [CrossRef]
  5. Zong, S.; Wang, Z.; Zhang, R.; Wang, C.; Xu, S.; Cui, Y. A multiplex and straightforward aqueous phase immunoassay protocol through the combination of SERS-fluorescence dual mode nanoprobes and magnetic nanobeads. Biosens. Bioelectron. 2013, 41, 745–751. [Google Scholar] [CrossRef]
  6. Zong, S.; Tang, H.; Yang, K.; Wang, H.; Wang, Z.; Cui, Y. SERS-fluorescence-superresolution triple-mode nanoprobe based on surface enhanced Raman scattering and surface enhanced fluorescence. J. Mater. Chem. B 2020, 8, 8459–8466. [Google Scholar] [CrossRef]
  7. Wang, Z.; Zong, S.; Chen, H.; Wang, C.; Xu, S.; Cui, Y. SERS-Fluorescence Joint Spectral Encoded Magnetic Nanoprobes for Multiplex Cancer Cell Separation. Adv. Healthc. Mater. 2014, 3, 1889–1897. [Google Scholar] [CrossRef] [PubMed]
  8. Li, C.; Chen, P.; Wang, Z.; Ma, X. A DNAzyme-gold nanostar probe for SERS-fluorescence dual-mode detection and imaging of calcium ions in living cells. Sens. Actuator B-Chem. 2021, 347, 130596. [Google Scholar] [CrossRef]
  9. Köker, T.; Tang, N.; Tian, C.; Zhang, W.; Wang, X.; Martel, R.; Pinaud, F. Cellular imaging by targeted assembly of hot-spot SERS and photoacoustic nanoprobes using split-fluorescent protein scaffolds. Nat. Commun. 2018, 9, 607. [Google Scholar] [CrossRef]
  10. Xu, H.V.; Zhao, Y.; Tan, Y.N. Nanodot-Directed Formation of Plasmonic-Fluorescent Nanohybrids toward Dual Optical Detection of Glucose and Cholesterol via Hydrogen Peroxide Sensing. ACS Appl. Mater. Interfaces 2019, 11, 27233–27242. [Google Scholar] [CrossRef]
  11. Fu, Y.; Zhang, J.; Lakowicz, J.R. Plasmon-Enhanced Fluorescence from Single Fluorophores End-Linked to Gold Nanorods. J. Am. Chem. Soc. 2010, 132, 5540–5541. [Google Scholar] [CrossRef] [PubMed]
  12. Zhu, Z.; Yuan, P.; Li, S.; Garai, M.; Hong, M.; Xu, Q.-H. Plasmon-Enhanced Fluorescence in Coupled Nanostructures and Applications in DNA Detection. ACS Appl. Bio Mater. 2018, 1, 118–124. [Google Scholar] [CrossRef]
  13. Theodorou, I.G.; Jawad, Z.A.R.; Jiang, Q.; Aboagye, E.O.; Porter, A.E.; Ryan, M.P.; Xie, F. Gold Nanostar Substrates for Metal-Enhanced Fluorescence through the First and Second Near-Infrared Windows. Chem. Mater. 2017, 29, 6916–6926. [Google Scholar] [CrossRef]
  14. Della Ventura, B.; Gelzo, M.; Battista, E.; Alabastri, A.; Schirato, A.; Castaldo, G.; Corso, G.; Gentile, F.; Velotta, R. Biosensor for Point-of-Care Analysis of Immunoglobulins in Urine by Metal Enhanced Fluorescence from Gold Nanoparticles. ACS Appl. Mater. Interfaces 2019, 11, 3753–3762. [Google Scholar] [CrossRef]
  15. Tobias, A.K.; Jones, M. Metal-Enhanced Fluorescence from Quantum Dot-Coupled Gold Nanoparticles. J. Phys. Chem. C 2019, 123, 1389–1397. [Google Scholar] [CrossRef]
  16. Pawar, S.; Bhattacharya, A.; Nag, A. Metal-Enhanced Fluorescence Study in Aqueous Medium by Coupling Gold Nanoparticles and Fluorophores Using a Bilayer Vesicle Platform. ACS Omega 2019, 4, 5983–5990. [Google Scholar] [CrossRef]
  17. Fothergill, S.M.; Joyce, C.; Xie, F. Metal enhanced fluorescence biosensing: From ultra-violet towards second near-infrared window. Nanoscale 2018, 10, 20914–20929. [Google Scholar] [CrossRef]
  18. Knoblauch, R.; Geddes, C.D. Silvered conical-bottom 96-well plates: Enhanced low volume detection and the metal-enhanced fluorescence volume/ratio effect. Nanoscale 2019, 11, 4337–4344. [Google Scholar] [CrossRef]
  19. Qu, Z.; Duan, P.; Zhou, J.; Wang, Y.; Liu, M. Photon upconversion in organic nanoparticles and subsequent amplification by plasmonic silver nanowires. Nanoscale 2018, 10, 985–991. [Google Scholar] [CrossRef]
  20. Theodorou, I.G.; Jawad, Z.A.R.; Qin, H.; Aboagye, E.O.; Porter, A.E.; Ryan, M.P.; Xie, F. Significant metal enhanced fluorescence of Ag2S quantum dots in the second near-infrared window. Nanoscale 2016, 8, 12869–12873. [Google Scholar] [CrossRef] [Green Version]
  21. Theodorou, I.G.; Jiang, Q.; Malms, L.; Xie, X.; Coombes, R.C.; Aboagye, E.O.; Porter, A.E.; Ryan, M.P.; Xie, F. Fluorescence enhancement from single gold nanostars: Towards ultra-bright emission in the first and second near-infrared biological windows. Nanoscale 2018, 10, 15854–15864. [Google Scholar] [CrossRef] [PubMed]
  22. Geddes, C.D.; Lakowicz, J.R. Editorial: Metal-Enhanced Fluorescence. J. Fluoresc. 2002, 12, 121–129. [Google Scholar] [CrossRef]
  23. Malicka, J.; Gryczynski, I.; Gryczynski, Z.; Lakowicz, J.R. Effects of fluorophore-to-silver distance on the emission of cyanine–dye-labeled oligonucleotides. Anal. Biochem. 2003, 315, 57–66. [Google Scholar] [CrossRef]
  24. Dragan, A.I.; Bishop, E.S.; Casas-Finet, J.R.; Strouse, R.J.; McGivney, J.; Schenerman, M.A.; Geddes, C.D. Distance Dependence of Metal-Enhanced Fluorescence. Plasmonics 2012, 7, 739–744. [Google Scholar] [CrossRef]
  25. Liang, J.; Li, K.; Gurzadyan, G.G.; Lu, X.; Liu, B. Silver Nanocube-Enhanced Far-Red/Near-Infrared Fluorescence of Conjugated Polyelectrolyte for Cellular Imaging. Langmuir 2012, 28, 11302–11309. [Google Scholar] [CrossRef]
  26. Kim, J.K.; Jang, D.-J. Metal-enhanced fluorescence of gold nanoclusters adsorbed onto Ag@SiO2 core–shell nanoparticles. J. Mater. Chem. C 2017, 5, 6037–6046. [Google Scholar] [CrossRef]
  27. Pompa, P.P.; Martiradonna, L.; Torre, A.D.; Sala, F.D.; Manna, L.; De Vittorio, M.; Calabi, F.; Cingolani, R.; Rinaldi, R. Metal-enhanced fluorescence of colloidal nanocrystals with nanoscale control. Nat. Nanotechnol. 2006, 1, 126–130. [Google Scholar] [CrossRef]
  28. Ke, X.; Wang, D.; Chen, C.; Yang, A.; Han, Y.; Ren, L.; Li, D.; Wang, H. Co-enhancement of fluorescence and singlet oxygen generation by silica-coated gold nanorods core-shell nanoparticle. Nanoscale Res. Lett. 2014, 9, 666. [Google Scholar] [CrossRef]
  29. Liao, C.; Tang, L.; Gao, X.; Xu, R.; Zhang, H.; Yu, Y.; Lu, C.; Cui, Y.; Zhang, J. Bright white-light emission from Ag/SiO2/CdS–ZnS core/shell/shell plasmon couplers. Nanoscale 2015, 7, 20607–20613. [Google Scholar] [CrossRef]
  30. Pham, X.-H.; Hahm, E.; Kim, H.-M.; Son, B.S.; Jo, A.; An, J.; Tran Thi, T.A.; Nguyen, D.Q.; Jun, B.-H. Silica-coated magnetic iron oxide nanoparticles grafted onto graphene oxide for protein isolation. Nanomaterials 2020, 10, 117. [Google Scholar] [CrossRef] [Green Version]
  31. Poovarodom, S.; Bass, J.D.; Hwang, S.-J.; Katz, A. Investigation of the Core− Shell Interface in Gold@ Silica Nanoparticles: A Silica Imprinting Approach. Langmuir 2005, 21, 12348–12356. [Google Scholar] [CrossRef] [PubMed]
  32. Li, J.F.; Huang, Y.F.; Ding, Y.; Yang, Z.L.; Li, S.B.; Zhou, X.S.; Fan, F.R.; Zhang, W.; Zhou, Z.Y.; Wu, D.Y. Shell-isolated nanoparticle-enhanced Raman spectroscopy. Nature 2010, 464, 392–395. [Google Scholar] [CrossRef] [PubMed]
  33. Guerrero-Martínez, A.; Pérez-Juste, J.; Liz-Marzán, L.M. Recent progress on silica coating of nanoparticles and related nanomaterials. Adv. Mater. 2010, 22, 1182–1195. [Google Scholar] [CrossRef]
  34. Ge, J.; Zhang, Q.; Zhang, T.; Yin, Y. Core–satellite nanocomposite catalysts protected by a porous silica shell: Controllable reactivity, high stability, and magnetic recyclability. Angew. Chem. 2008, 120, 9056–9060. [Google Scholar] [CrossRef]
  35. Tian, X.D.; Liu, B.J.; Li, J.F.; Yang, Z.L.; Ren, B.; Tian, Z.Q. SHINERS and plasmonic properties of Au Core SiO2 shell nanoparticles with optimal core size and shell thickness. J. Raman Spectrosc. 2013, 44, 994–998. [Google Scholar] [CrossRef]
  36. Lee, M.; Kang, Y.-L.; Rho, W.-Y.; Kyeong, S.; Jeong, S.; Jeong, C.; Chung, W.-J.; Kim, H.-M.; Kang, H.; Lee, Y.-S. Preparation of plasmonic magnetic nanoparticles and their light scattering properties. RSC Adv. 2015, 5, 21050–21053. [Google Scholar] [CrossRef]
  37. Ding, S.-Y.; You, E.-M.; Yi, J.; Li, J.-F.; Tian, Z.-Q. Further expanding versatility of surface-enhanced Raman spectroscopy: From non-traditional SERS-active to SERS-inactive substrates and single shell-isolated nanoparticle. Faraday Discuss. 2017, 205, 457–468. [Google Scholar] [CrossRef] [PubMed]
  38. Zhang, H.; Duan, S.; Radjenovic, P.M.; Tian, Z.-Q.; Li, J.-F. Core–shell nanostructure-enhanced Raman spectroscopy for surface catalysis. Acc. Chem. Res. 2020, 53, 729–739. [Google Scholar] [CrossRef]
  39. Hartman, T.; Weckhuysen, B.M. Thermally Stable TiO2-and SiO2-Shell-Isolated Au Nanoparticles for In Situ Plasmon-Enhanced Raman Spectroscopy of Hydrogenation Catalysts. Chem. A Eur. J. 2018, 24, 3733–3741. [Google Scholar] [CrossRef]
  40. Choi, Y.; Park, Y.; Kang, T.; Lee, L.P. Selective and sensitive detection of metal ions by plasmonic resonance energy transfer-based nanospectroscopy. Nat. Nanotechnol. 2009, 4, 742–746. [Google Scholar] [CrossRef]
  41. Kovacs, G.; Loutfy, R.; Vincett, P.; Jennings, C.; Aroca, R. Distance dependence of SERS enhancement factor from Langmuir-Blodgett monolayers on metal island films: Evidence for the electromagnetic mechanism. Langmuir 1986, 2, 689–694. [Google Scholar] [CrossRef]
  42. Masango, S.S.; Hackler, R.A.; Large, N.; Henry, A.-I.; McAnally, M.O.; Schatz, G.C.; Stair, P.C.; Van Duyne, R.P. High-resolution distance dependence study of surface-enhanced Raman scattering enabled by atomic layer deposition. Nano Lett. 2016, 16, 4251–4259. [Google Scholar] [CrossRef] [PubMed]
  43. Nallathamby, P.D.; Hopf, J.; Irimata, L.E.; McGinnity, T.L.; Roeder, R.K. Preparation of fluorescent Au–SiO 2 core–shell nanoparticles and nanorods with tunable silica shell thickness and surface modification for immunotargeting. J. Mater. Chem. B 2016, 4, 5418–5428. [Google Scholar] [CrossRef] [PubMed]
  44. Narita, A.; Naka, K.; Chujo, Y. Facile control of silica shell layer thickness on hydrophilic iron oxide nanoparticles via reverse micelle method. Colloids Surf. A Physicochem. Eng. Asp. 2009, 336, 46–56. [Google Scholar] [CrossRef]
  45. Vanderkooy, A.; Chen, Y.; Gonzaga, F.; Brook, M.A. Silica shell/gold core nanoparticles: Correlating shell thickness with the plasmonic red shift upon aggregation. ACS Appl. Mater. Interfaces 2011, 3, 3942–3947. [Google Scholar] [CrossRef]
  46. Hahm, E.; Jeong, D.; Cha, M.G.; Choi, J.M.; Pham, X.-H.; Kim, H.-M.; Kim, H.; Lee, Y.-S.; Jeong, D.H.; Jung, S. β-CD dimer-immobilized Ag assembly embedded silica nanoparticles for sensitive detection of polycyclic aromatic hydrocarbons. Sci. Rep. 2016, 6, 1–7. [Google Scholar]
  47. Hahm, E.; Kim, Y.-H.; Pham, X.-H.; Jun, B.-H. Highly reproducible surface-enhanced Raman scattering detection of alternariol using silver-embedded silica nanoparticles. Sensors 2020, 20, 3523. [Google Scholar] [CrossRef]
  48. Cha, M.G.; Kang, H.; Choi, Y.-S.; Cho, Y.; Lee, M.; Lee, H.-Y.; Lee, Y.-S.; Jeong, D.H. Effect of alkylamines on morphology control of silver nanoshells for highly enhanced Raman scattering. ACS Appl. Mater. Interfaces 2019, 11, 8374–8381. [Google Scholar] [CrossRef]
  49. Kang, H.; Jeong, S.; Yang, J.-K.; Jo, A.; Lee, H.; Heo, E.H.; Jeong, D.H.; Jun, B.-H.; Chang, H.; Lee, Y.-S. Template-assisted plasmonic nanogap shells for highly enhanced detection of cancer biomarkers. Int. J. Mol. Sci. 2021, 22, 1752. [Google Scholar] [CrossRef]
  50. Hahm, E.; Kang, E.J.; Pham, X.-H.; Jeong, D.; Jeong, D.H.; Jung, S.; Jun, B.-H. Mono-6-deoxy-6-aminopropylamino-β-cyclodextrin on Ag-embedded SiO2 nanoparticle as a selectively capturing ligand to flavonoids. Nanomaterials 2019, 9, 1349. [Google Scholar] [CrossRef]
  51. Hahm, E.; Cha, M.G.; Kang, E.J.; Pham, X.-H.; Lee, S.H.; Kim, H.-M.; Kim, D.-E.; Lee, Y.-S.; Jeong, D.-H.; Jun, B.-H. Multilayer Ag-embedded silica nanostructure as a surface-enhanced raman scattering-based chemical sensor with dual-function internal standards. ACS Appl. Mater. Interfaces 2018, 10, 40748–40755. [Google Scholar] [CrossRef] [PubMed]
  52. Milichko, V.A.; Dzyuba, V.P.; Kulchin, Y.N. Unusual nonlinear optical properties of SiO2 nanocomposite in weak optical fields. Appl. Phys. A 2013, 111, 319–322. [Google Scholar] [CrossRef]
  53. Yang, J.-K.; Kang, H.; Lee, H.; Jo, A.; Jeong, S.; Jeon, S.-J.; Kim, H.-I.; Lee, H.-Y.; Jeong, D.H.; Kim, J.-H.; et al. Single-Step and Rapid Growth of Silver Nanoshells as SERS-Active Nanostructures for Label-Free Detection of Pesticides. ACS Appl. Mater. Interfaces 2014, 6, 12541–12549. [Google Scholar] [CrossRef] [PubMed]
  54. Mayer, K.M.; Hafner, J.H. Localized surface plasmon resonance sensors. Chem. Rev. 2011, 111, 3828–3857. [Google Scholar] [CrossRef] [PubMed]
  55. Hahm, E.; Jo, A.; Kang, E.J.; Bock, S.; Pham, X.-H.; Chang, H.; Jun, B.-H. Ultra-Fine Control of Silica Shell Thickness on Silver Nanoparticle-Assembled Structures. Int. J. Mol. Sci. 2021, 22, 11983. [Google Scholar] [CrossRef] [PubMed]
  56. Pustovit, V.N.; Shahbazyan, T.V. Resonance energy transfer near metal nanostructures mediated by surface plasmons. Phys. Rev. B 2011, 83, 085427. [Google Scholar] [CrossRef]
  57. Lakowicz, J.R. Quenching of fluorescence. In Principles of Fluorescence Spectroscopy; Springer: Berlin, Germany, 1983; pp. 257–301. [Google Scholar]
  58. Geddes, C.D. Metal-enhanced fluorescence. Phys. Chem. Chem. Phys. 2013, 15, 19537. [Google Scholar] [CrossRef]
  59. Kulakovich, O.; Strekal, N.; Yaroshevich, A.; Maskevich, S.; Gaponenko, S.; Nabiev, I.; Woggon, U.; Artemyev, M. Enhanced luminescence of CdSe quantum dots on gold colloids. Nano Lett. 2002, 2, 1449–1452. [Google Scholar] [CrossRef]
  60. Poland, S.; Coelho, S.; Krstajić, N.; Tyndall, D.; Walker, R.; Monypenny, J.; Li, D.; Henderson, R.; Ameer-Beg, S. Development of a Fast TCSPC FLIM-FRET Imaging System; SPIE: Bellingham, DC, USA, 2013; Volume 8588. [Google Scholar]
  61. Stöber, W.; Fink, A.; Bohn, E. Controlled growth of monodisperse silica spheres in the micron size range. J. Colloid Interface Sci. 1968, 26, 62–69. [Google Scholar] [CrossRef]
Scheme 1. Schematic illustration of (A) silica shell controlled SiO2@Ag@SiO2 and (B) SiO2@Ag@SiO2@QD. S1 and S3 are SiO2@Ag@SiO2 synthesized using 5 mg and 20 mg SiO2@Ag combine with 14.4 μL of Na2SiO3, respectively. S6 includes SiO2@Ag@SiO2 synthesized using 10 mg SiO2@Ag, 14.4 μL of Na2SiO3, and 4.7 mM TEOS.
Ijms 23 10041 sch001
Figure 1. (A) Low- and high-magnification TEM images of SiO2@Ag@SiO2 with various thicknesses of silica shell on the SiO2@Ag surface. (B) Thickness of the silica shell layer on the surface of the SiO2@Ag NPs synthesized under various conditions. S1, S2, and S3 were synthesized using SiO2@Ag (5 mg, 10 mg, and 20 mg, respectively) and Na2SiO3 (14.4 μL). S4, S5, and S6 were synthesized using 10 mg of SiO2@Ag (10 mg), Na2SiO3 (14.4 μL), and TEOS (1.2 mM, 2.3 mM, and 4.7 mM, respectively).
Ijms 23 10041 g001
Figure 2. TEM images of SiO2@Ag@SiO2@QDs using SiO2@Ag@SiO2 with various silica shells thicknesses (S1 to S6) to introduce 7 mg QDs on their surfaces to generate the SiO2@Ag@SiO2@QDs corresponding to (QS1QS6).
Ijms 23 10041 g002
Figure 3. (A) Fluorescence spectra of SiO2@Ag@SiO2@QD with different silica shell thickness and (B) its intensity at 620 nm.
Ijms 23 10041 g003
Publisher’s Note: MDPI stays neutral with regard to jurisdictional claims in published maps and institutional affiliations.

