Article

Comparative Transcriptome Analysis Reveals Coordinated Transcriptional Regulation of Central and Secondary Metabolism in the Trichomes of Cannabis Cultivars

1
Temasek Life Sciences Laboratory, 1 Research Link, National University of Singapore, Singapore 117604, Singapore
2
Department of Biological Sciences, National University of Singapore, Singapore 117543, Singapore
*
Authors to whom correspondence should be addressed.
These authors contributed equally to this work.
Current address: Bioinformatics Institute, 30 Biopolis Street, Singapore 138671, Singapore.
Int. J. Mol. Sci. 2022, 23(15), 8310; https://doi.org/10.3390/ijms23158310
Submission received: 22 May 2022 / Revised: 24 June 2022 / Accepted: 20 July 2022 / Published: 27 July 2022
(This article belongs to the Special Issue The Comparative Genomics and Functional Genomics Analyses in Plants)

Abstract

:
Cannabis is one of the few plant genera capable of producing cannabinoids, the effects of which are synergized by terpene interactions. As the biosynthesis of both metabolite classes requires the same intracellular feedstocks, this work describes the coordinated regulation of global metabolic pathways that allows for their joint copious production in vivo. To this end, a transcriptomics-based approach to characterize the glandular trichomes of five Cannabis cultivars was pursued. Besides revealing metabolic traits that enhanced and proportionated the supply of critical carbon precursors, in-depth analysis showed significantly increased gene expression of two particular enzymes to meet the huge nicotinamide adenine dinucleotide phosphate (NADPH) demand of secondary metabolite production. Furthermore, it led to a hypothesis that the methyl-d-erythritol 4-phosphate pathway might be utilized more than the mevalonic acid pathway in Cannabis trichomes. While both pathways were found to be activated in a modular and calibrated way that reflected their broad participation in physiological processes, the genes for hexanoate, cannabinoid, and terpene biosynthesis were, in contrast, up-regulated in an en bloc and multi-loci manner due to their specific roles in secondary metabolite production. In addition, three new terpene synthases were characterized based on both in silico and experimental assays. Altogether, the study enhances the current understanding of secondary metabolite production in Cannabis cultivars, which may assist in their characterization and development.

1. Introduction

Cannabis is a member of the plant family Cannabaceae. It encompasses three species, Cannabis sativa, Cannabis indica, and Cannabis ruderalis, which are of high medicinal and commercial value due to their production of therapeutic and psychoactive secondary metabolites. Although Cannabis was mainly consumed as an illegal drug in early years, due to its high (−)-trans9-tetrahydrocannabinol (THC) content, it is now recognized as a source of other non-psychoactive, therapeutic cannabinoids, such as cannabidiol (CBD) [1]. For example, Cannabis-based drugs have been shown to be effective for treating several disorders, such as Parkinson’s disease, epilepsy, schizophrenia, inflammatory bowel disease, oxidative stress, inflammation, and brain injury. A recent review listed various Cannabis-based or -inspired medicines and their pharmaceutical status [2].
Over the years, several natural Cannabis varieties and developed cultivars (pure or hybrid) have been used [3]. The legalization of Cannabis in many countries has led to increased demand, which provides further impetus for developing crops with desired cannabinoid profiles. Cannabinoid biosynthesis mainly occurs in the glandular trichome of female Cannabis inflorescences. Subcellularly, the pathway starts in the cytosol, where the precursor, hexanoic acid, is derived from the oxidative cleavage of fatty acids, such as palmitic acid, by an acylactivating enzyme (AAE) to form hexanoyl coenzyme A. The latter is then biochemically combined with three malonyl coenzyme A molecules by olivetol synthase and olivetolic acid cyclase (OAC) to form olivetolic acid (OA) [4]. Following this, the acid is prenylated to form cannabigerolic acid (CBGA) as the starting cannabinoid, using geranyl diphosphate (GPP) made via the chloroplastic MEP pathway [5]. Subsequent oxidative cyclization of CBGA in the resin cavity results in the production of various other cannabinoids [6]. Notably, the cannabinoids, tetrahydrocannabinolic acid (THCA) and cannabidiolic acid (CBDA), can also be decarboxylated by heating to produce THC and CBD, respectively [7]. In all, close to 120 cannabinoids have been identified [8,9], in 10 categories: (−)-Δ8-trans-tetrahydrocannabinols (Δ8-THC), (−)-Δ9-trans-tetrahydrocannabinols (Δ9-THC), CBD, cannabitriols (CBT), cannabigerols (CBG), cannabinols (CBN), cannabicyclols (CBL), cannabinodiols (CBND), cannabichromenes (CBC), and cannabielsoins (CBE) [10]. Although several cannabinoid biosynthetic enzymes have been identified [11,12,13], the genetics underlying their diversity in the plant remains poorly understood [14].
Similarly, terpenes are also biosynthesized and stored in large amounts in the glandular trichome of female Cannabis inflorescences. Some common terpenes produced by Cannabis include the monoterpenes, (R)-linalool, α-pinene, and limonene, as well as the sesquiterpenes, bisabolol, (E)-β-farnesene, β-caryophyllene, and α-humulene [15]. Some are thought to interact with cannabinoids and regulate or change their physiological effects [16]. As a result, such ‘entourage effect’ also modulates the medicinal uses of Cannabis plants [17]. For example, β-caryophyllene can be used as a dietary supplement due to its ability to enhance binding to the CB2 cannabinoid receptor, thus reducing gastrointestinal inflammation [18]. The metabolic precursors of terpenes, isopentenyl diphosphate (IPP) and its isomer, dimethylallyl diphosphate (DMAPP), are both produced by either the plastid-localized MEP pathway or the cytosolic MVA pathway. The pathways utilize glyceraldehyde-3-phosphate (G3P) and pyruvate as carbon feedstocks that are generated via plastid-localized glycolytic steps [19,20]. Following this, the condensation of single molecules of five-carbon IPP and DMAPP leads to the formation of a 10-carbon GPP molecule (which is also used for cannabinoid production). A similar process between GPP and IPP then results in a 15-carbon farnesyl diphosphate (FPP) moiety, which further condenses with IPP to form a 20-carbon geranylgeranyl diphosphate (GGPP) molecule. GPP, FPP, and GGPP are then acted upon by various terpene synthases (TPSs) to form monoterpenes, sesquiterpenes, and diterpenes, respectively. In this regard, monoterpenes and diterpenes are synthesized via the MEP pathway, whereas sesquiterpenes are made via the MVA pathway. Depending on the isoforms, GPP synthase (GPPS) and GGPP synthase (GGPPS) can be found in the chloroplasts, mitochondria, and endoplasmic reticulum [21,22], while FPP synthases (FPPS) are mostly cytosolic, although some are found in the peroxisome or endoplasmic reticulum [20]. As the MEP and MVA pathways are also used to provide precursors for primary metabolism and hormone biosynthesis [23], depending on developmental, environmental, and genetic factors, it is imperative to characterize them alongside cannabinoid and terpene biosynthetic pathways in Cannabis plants for the selection and development of cultivars.
Although it is generally accepted that genetic regulatory adaptations exist in the trichomes to facilitate secondary metabolite production across diverse plant species, most studies in Cannabis to date have focused on secondary metabolism. However, we hypothesized a more holistic and coordinated adjustment of the metabolism, including the primary pathways, that are also reflected at the transcriptome level. To test the hypothesis, the transcriptome of female inflorescence trichomes from five different Cannabis cultivars were profiled and then compared to a non-trichome tissue, namely, stem tissue (stripped of any existing trichomes), to identify differentially expressed genes (DEGs) or those genes specific to trichomes that are broadly conserved among the different cultivars. The expression of biosynthetic enzymes in the central and secondary metabolic pathways in the trichomes was then examined and interpreted in terms of functional coordination to enhance cannabinoid and terpene production. Furthermore, their levels were compared among the cultivars to provide the molecular basis for characterizing their yield variations. Additionally, three TPSs were functionally characterized using in vitro and in vivo assays. Altogether, these findings offer opportunities for the selection and improvement of yield profiles in Cannabis cultivars.

2. Results

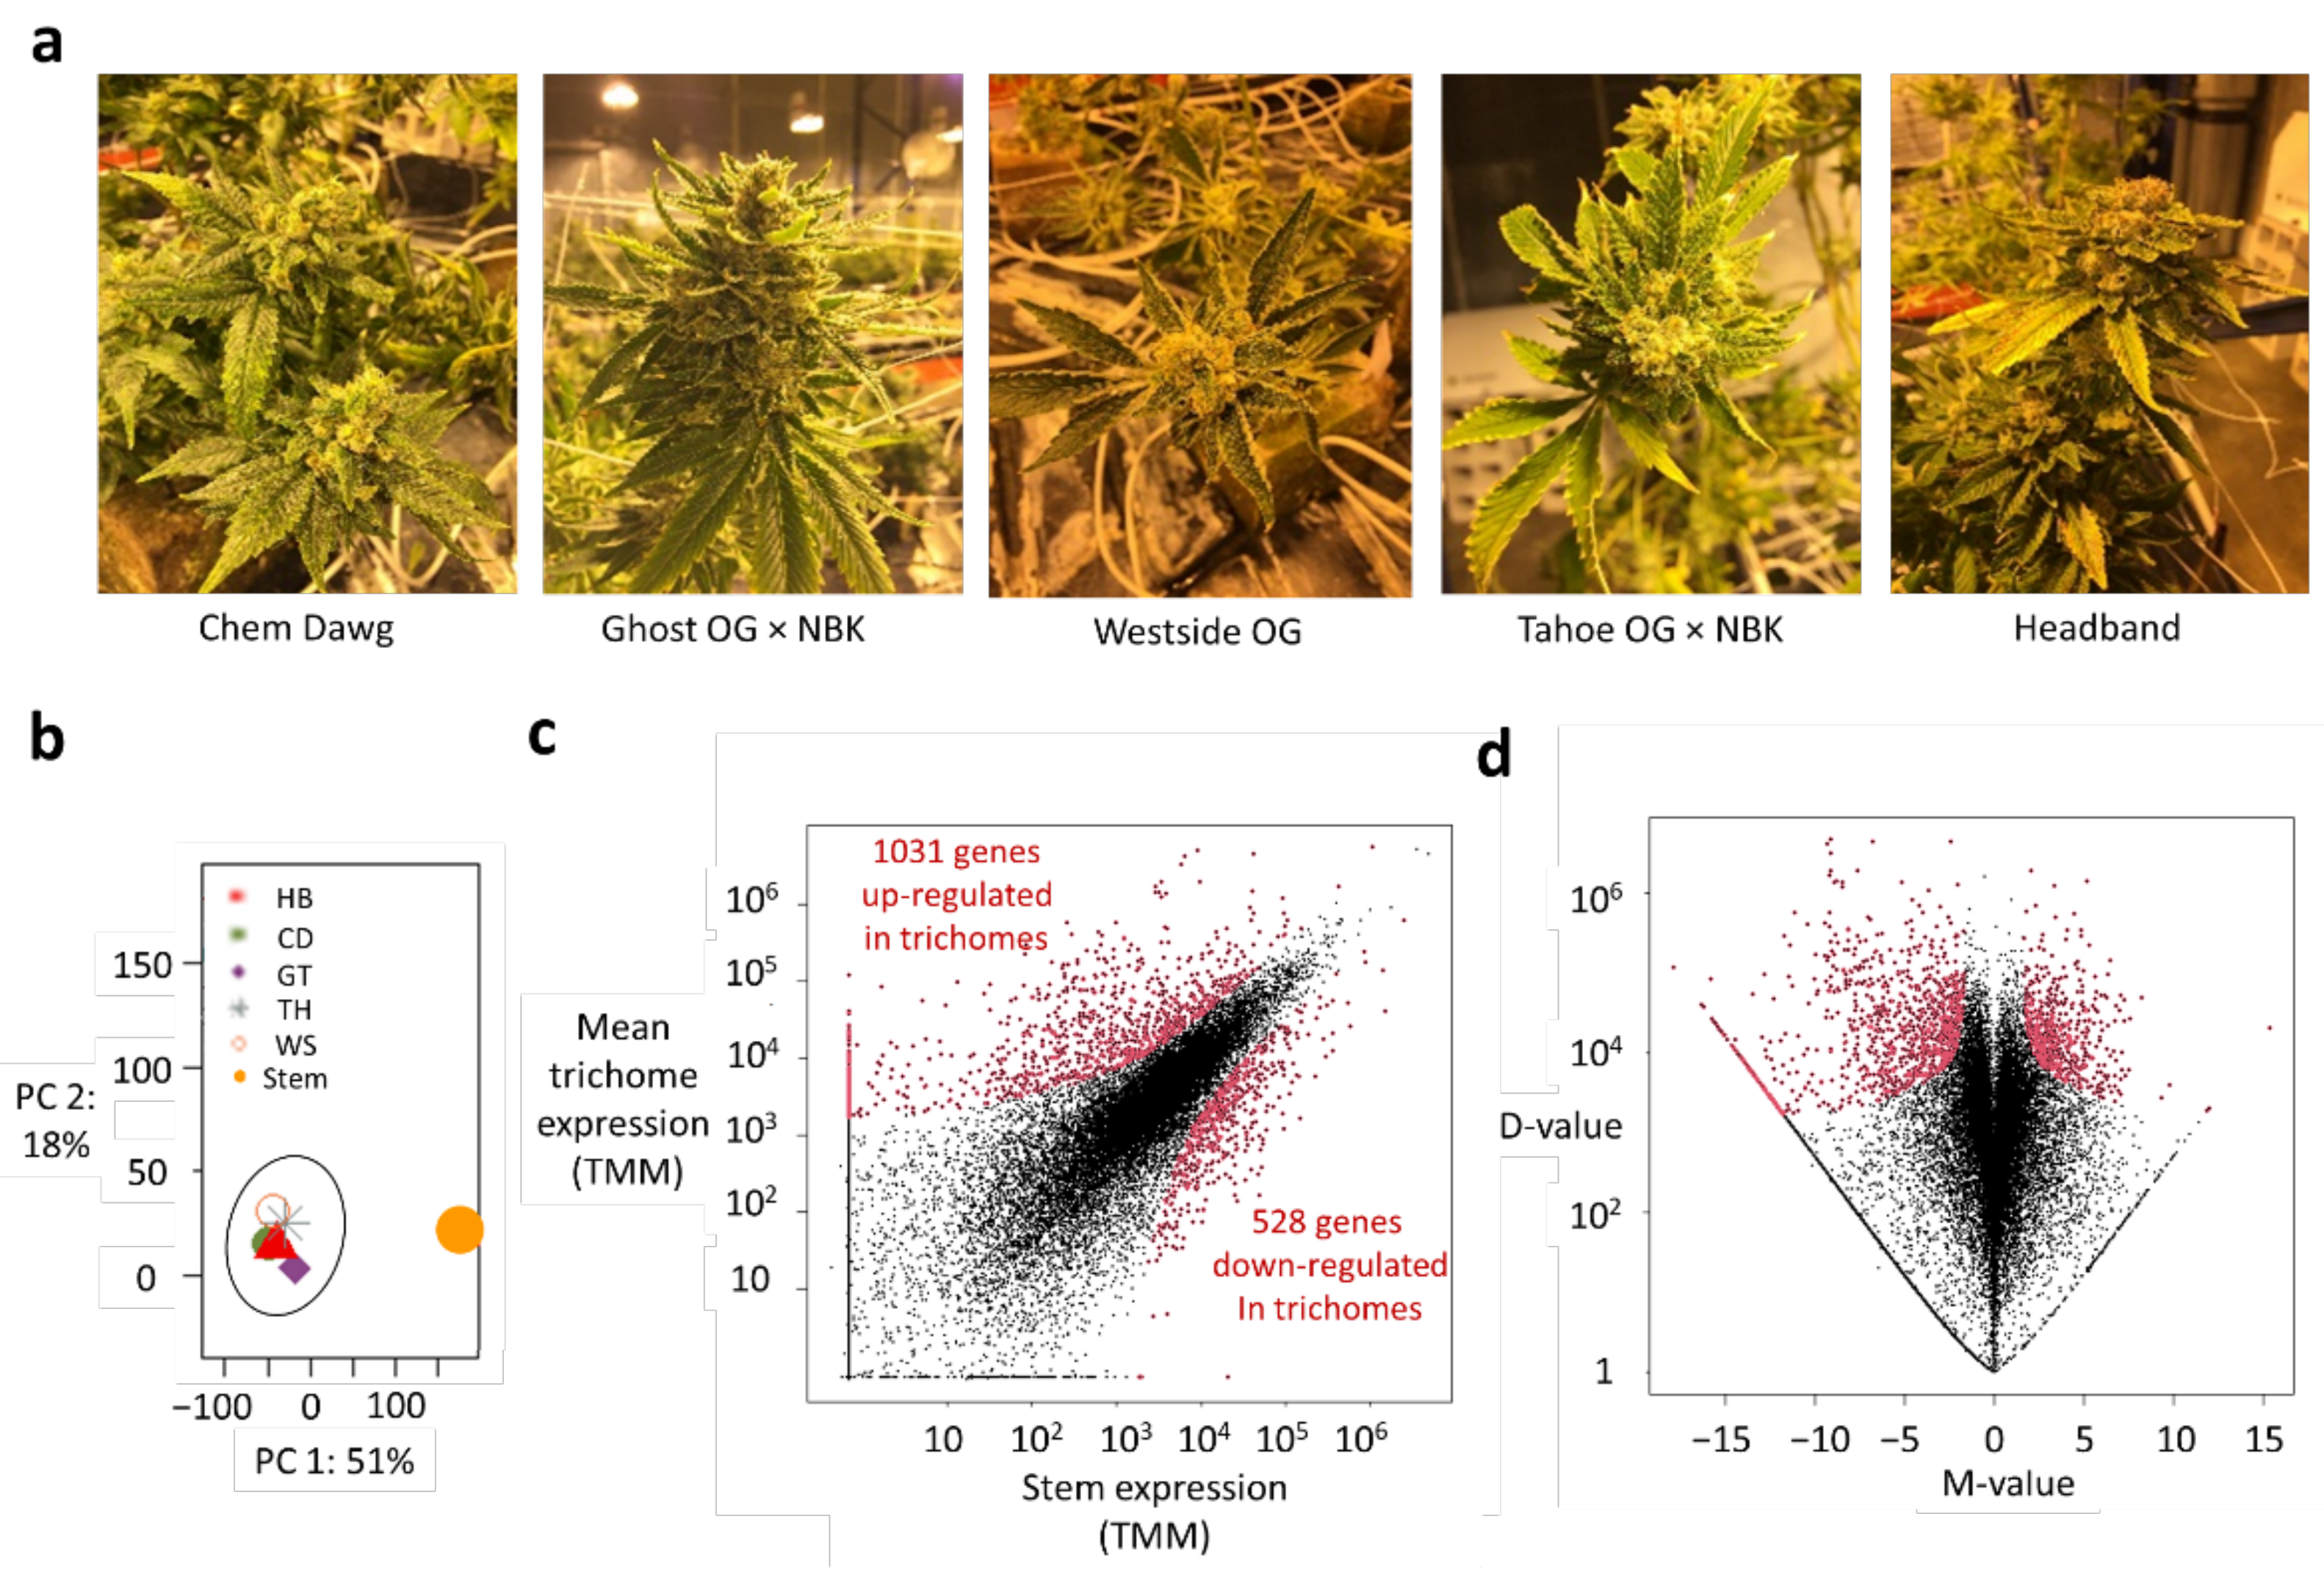
2.1. RNA-seq-Based Approach for Deciphering Conserved Expressions of Metabolic Enzymes

To elucidate the transcriptional regulation of both primary and secondary metabolic pathways in the trichomes of the Cannabis plant, an RNA-sequencing (RNA-seq) approach was pursued. Five Cannabis cultivars, Chemdawg (CD), Ghost OG × NBK (nothing but Kush) (GT), Westside OG (WS), Tahoe OG × NBK (TH), and Headband (HB), were selected for investigation, as they are commonly planted (Figure 1a). CD is a sativa cultivar, while GT, WS, TH, and HB, are indica-dominant cultivars. All of them are known to produce high levels of THC, along with lesser amounts of CBD and other minor cannabinoids. The transcriptome of the trichomes was compared with that of a representative stem of the HB cultivar, whose trichomes were removed entirely. Furthermore, differences in the biosynthetic pathways among the trichomes of the cultivars were picked out to provide the molecular basis for profiling their yield variations.
RNA-seq yielded between 248 to 277 million raw reads in both RNA strand directions per sample (Table 1), with 3–8% of the reads subsequently removed by pre-processing and quality-control measures. The resulting reads were quasi-mapped to the latest reference transcriptome of Cannabis sativa (GenBank assembly accession: GCA_900626175.2) for the generation of transcript read counts and further corrected for sequencing biases. In the process, between 200 to 235 million reads were used to tabulate the transcripts in each sample, representing 86–88% of the initial raw reads. The read counts of the transcripts were then added up for each gene. As a result, a total of 22,578 genes had reads mapped to their sequences in at least one sample. After further data normalization to enable sample and gene comparisons, the data quality was assessed using principal component analysis, which revealed a tight clustering of trichome samples away from the stem sample, indicating the absence of any trichome outliers (Figure 1b). For each cultivar, the global gene expression values of the trichomes were then plotted against those of stem tissue using a scatter plot, revealing their broadly similar distribution vis-à-vis the stem tissue: most genes lay near the diagonal through the origin and were thus not differentially expressed, as should be the case after normalization (Figure S1). Their alikeness was also apparent from the plot of absolute-difference-in-expression values (D-values) versus log2 FC values (M-values), thereby confirming the broad consistency in data quality among the cultivars. A subsequent hierarchical clustering of the M-values of DEGs further revealed regions of similar expression patterns between the GT and TH cultivars, and between WS and TH, with the former being possibly attributed to their common NBK ancestry (Figure S2a). On the other hand, CD and HB showed distinctive profiles. Overall, the five cultivars had about half of their DEGs in common, with 10% (or fewer) unique to each cultivar (Figure S2b, Table S3). Taken together, the observations suggested a moderate degree of diversity among the cultivars. Expectedly, a sizable percentage of the common DEGs encode for metabolic enzymes (40%), molecular transporters (16%), and transcription factors (5%), among other things (Table S4). To identify the regulation of metabolic enzymes more robustly, gene expressions of the trichomes for various cultivars were then jointly compared with the reference stem sample. As a result, 1031 and 528 genes were broadly identified as being up- and down-regulated in the trichomes, respectively (Figure 1c). Their D-values were generally greater than 1700, while their M-values were smaller or greater than −1.6 and 1.6, respectively (Figure 1d; Table S5).

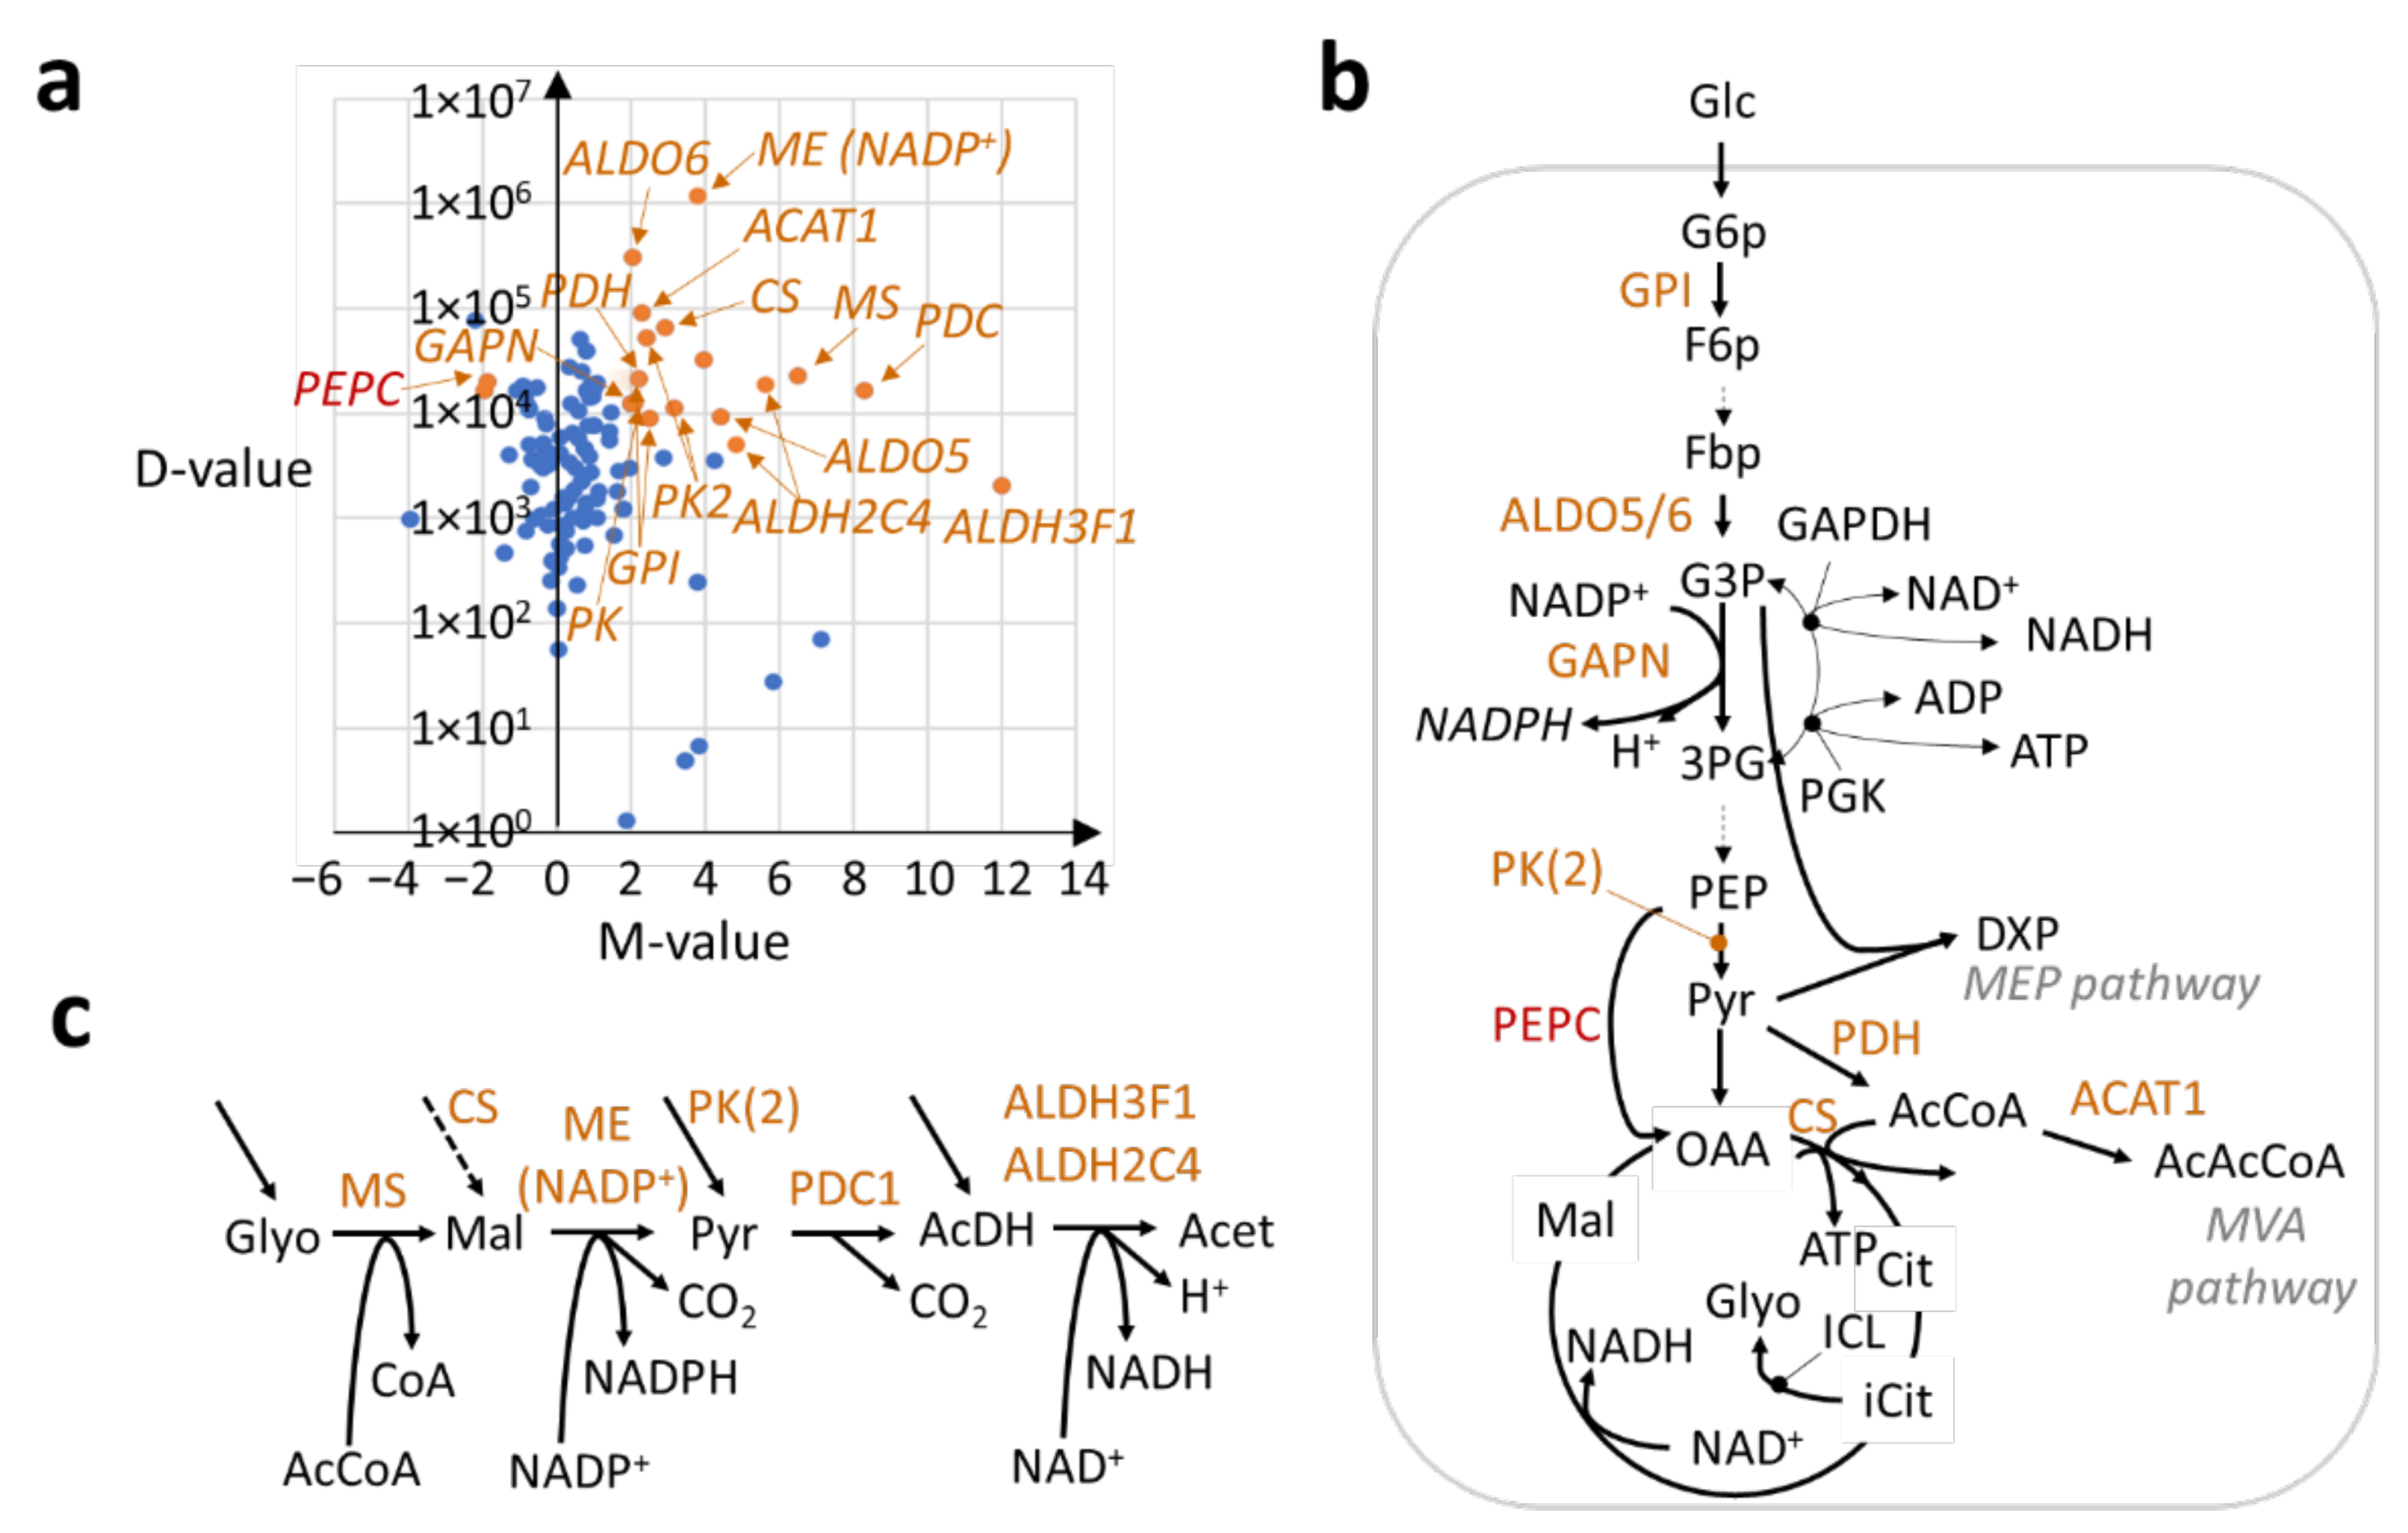
2.2. Transcriptional Regulation of the Central Metabolism in Trichomes for Enhancing Carbon Feedstock Production

Differential gene expression statistics were then mapped to the metabolic pathways to examine the likely effects of their transcriptional regulation on cannabinoid and terpenoid production. Most gene expression encoding enzymes in the central metabolism were up-regulated, as exemplified by the disproportionately larger number of positive M-values compared to negative ones (Figure 2a). Upon further analysis, the glycolytic pathway in the trichomes was found to be re-routed in a consequential manner compared to the stem, due to a significant increase in the expression of specific genes (Figure 2b). For example, the genome-wide expression of genes encoding the glucose-6-phosphate isomerase (GPI) enzyme increased by 73% overall (D = 2.09 × 10⁴, Table S6), thus allowing more glucose to be channeled into the pathway. In addition, a 154% net increase in the gene expression for fructose-bisphosphate aldolase (ALDO, D = 3.71 × 10⁵, Table S6) implied a markedly enhanced availability of G3P metabolites to the MEP pathway for cannabinoid and terpene production. G3P can also be used to produce more NADPH via higher expression of the gene encoding the glyceraldehyde-3-phosphate dehydrogenase [NADP+] (GAPN) enzyme (log2FC = 2, D = 1.23 × 10⁴) to meet the increased demand of the cofactors during secondary metabolite production (Figure 2b). The enhanced expression of GAPN in the trichomes has been verified by qPCR (Figure S3). On the other hand, the alternative production of NADH and ATP using G3P, through the action of glyceraldehyde-3-phosphate dehydrogenase (GAPDH) and phosphoglycerate kinase (PGK), was found to be suppressed by the down-regulation of the PGK-encoding gene in the trichomes (Figure 2b). This suggests a shift from NADH and ATP production to that of NADPH in the trichomes to support secondary metabolism.
Besides G3P and NADPH, pyruvate formation was also found to be promoted in the trichomes. There was a significantly higher expression of genes for pyruvate kinase (PK) enzymes (Figure 2b) that produce pyruvate, with an overall 78% increase in expression (D = 7.69 × 10⁴, Table S6). In further coordination, the phosphoenolpyruvate carboxylase (PEPC) enzyme was also down-regulated (log2FC = −1.9, D = 1.99 × 10⁴) to redirect phosphoenolpyruvate to pyruvate conversion, instead of oxaloacetate production. Pyruvate is also used as a substrate for forming acetyl coenzyme A (AcCoA) via pyruvate dehydrogenase (PDH) reactions [24]. Consistently, gene expression encoding a component of PDH (dihydrolipoyllysine-residue acetyltransferase component 5) was found to be up-regulated in the trichomes, with a corresponding log2 FC value of 2.2, representing an increase of 2.71 × 10⁴ in the ‘Trimmed Means of M-values’ (TMM) expression (Figure 2b). In turn, the AcCoA was in high stoichiometric demand by the MVA pathway and for the biosynthesis of malonyl coenzyme A and hexanoyl coenzyme A, all of which are needed to produce cannabinoids and terpenes. Further, AcCoA was found to be essential for replenishing the tricarboxylic acid (TCA) cycle in the trichomes, as evidenced by the up-regulation of the ATP-citrate synthase (CS) enzyme in comparison to stem tissue (log2FC = 2.9, D = 6.64 × 10⁴, Figure 2b). Altogether, the importance of enhancing and tuning the balance between four intracellular feedstocks—NADPH, G3P, pyruvate, and AcCoA—in the central metabolism for promoting the production of secondary metabolites in the trichomes was uncovered.

2.3. An Uncovered Pathway for Meeting NAD(P)H Demand in Trichomes

Besides GAPN, the current analysis further implicated the transcriptional amplification of four consecutive reactions catalyzed by malate synthase (MS), malic enzyme [NADP+ dependent] (ME [NADP+]), pyruvate decarboxylase 1 (PDC1), and aldehyde dehydrogenases (ALDH) to further meet the demand of NAD(P)H cofactors for secondary metabolite production in the trichomes (Figure 2c). The pathway is as follows: the MS enzyme first transfers the acetyl moiety of AcCoA to glyoxylate for the formation of malate. In turn, malate, which is also well replenished by the TCA cycle due to enhanced CS expression (Figure S3), is oxidized by ME (NADP+) in the second reaction to form pyruvate, as well as the first NADPH molecule produced by the pathway. In the third reaction, pyruvate, which is also well provided by glycolysis, is then oxidized by PDC1 to form acetaldehyde. The resulting aldehyde molecule can then be oxidized by ALDHs (ALDH2C4 (ALDH family 2 member C4) and ALDH3F1 (ALDH family 3 member F1)) to generate the second NADH molecule as well as acetate (Figure 2c). Besides being major cellular sources of reducing equivalents through NAD(P)H production [25], ALDHs are also required for generating hexanoic acid, a key precursor for cannabinoid production [4]. Importantly, the pathway prioritized NADPH production over NADH, which was similarly observed with the relative regulation of GAPN, GAPDH, and PGK, as described previously. For example, while the fold-change value of the pathway enzymes was generally large (log2FC = 3.8 to 8.3) compared to stem tissue, the ME (NADP+) enzyme stood out in having an increased expression (D) that was at least 50 times those of the three individual pathway enzymes (1.2 × 10⁶ versus 1.7 × 10⁴–2.3 × 10⁴) and close to a hundred times that of GAPN (1.23 × 10⁴) (Figure S3). This observation thus implicates ME (NADP+) as another major contributor to NADPH production in trichome cells, besides GAPN.

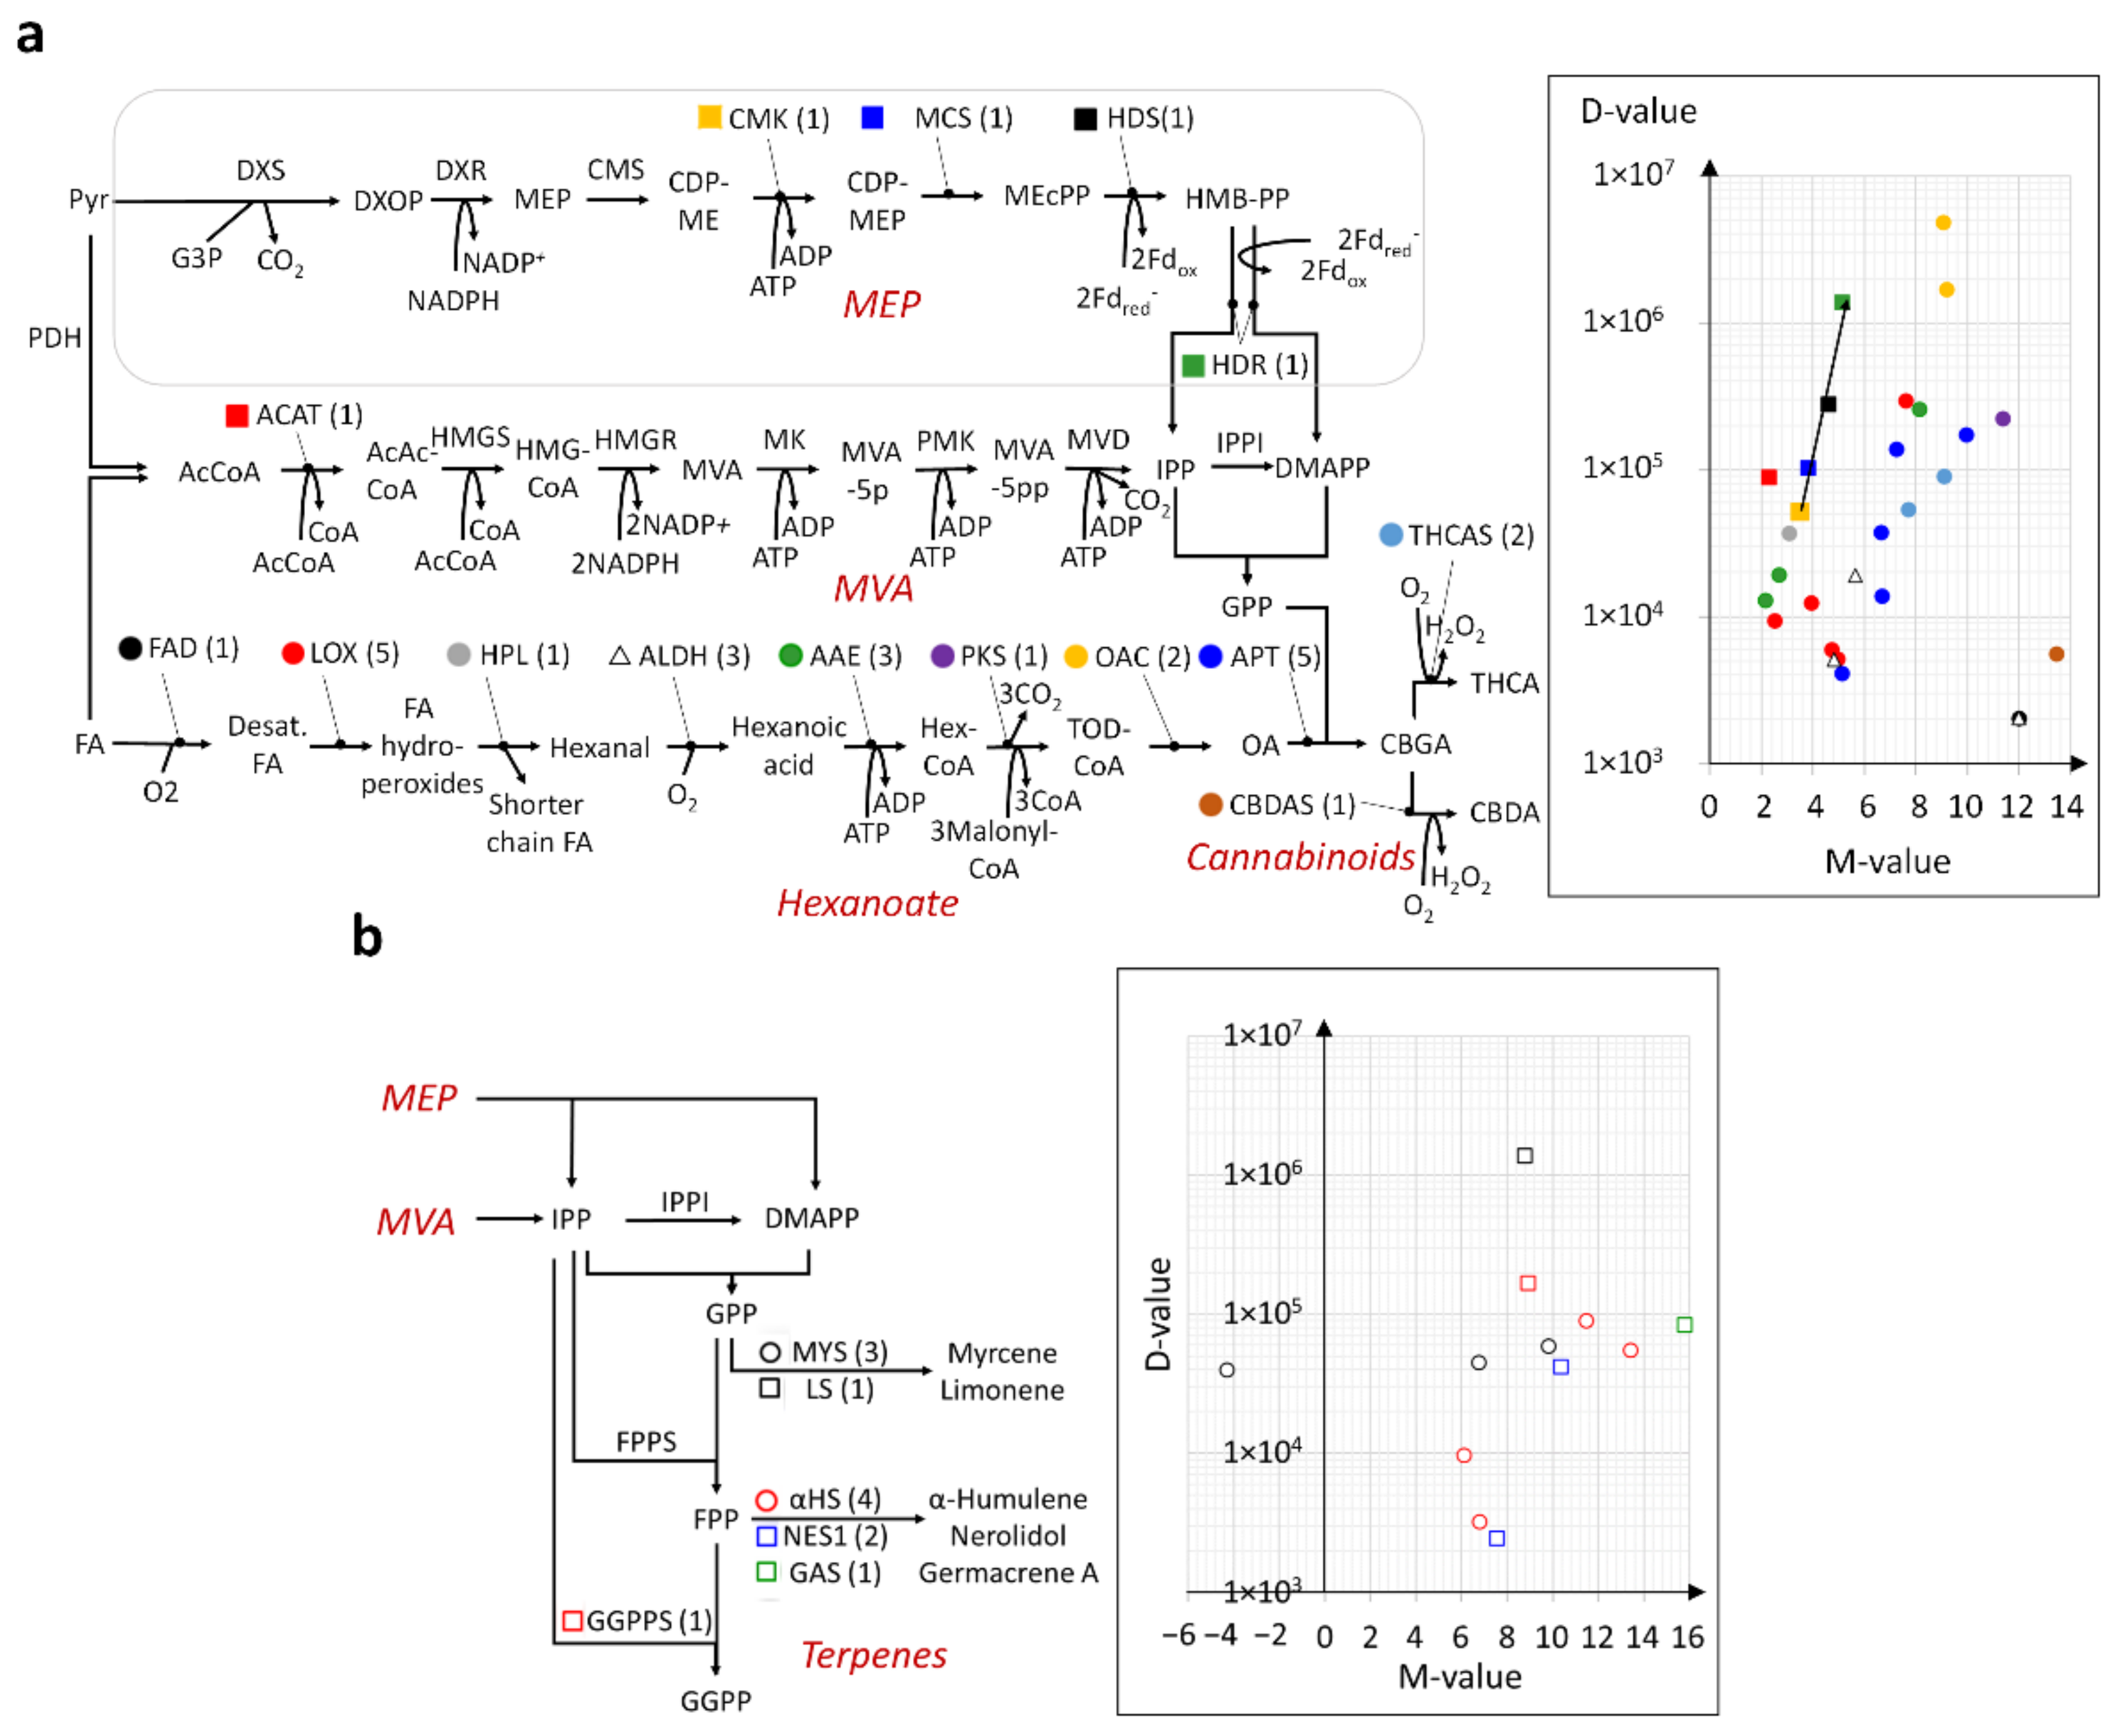
2.4. Modular and Calibrated Regulation of MEP and MVA Pathways

There are also notable features regarding the regulation of MEP and MVA pathways. Firstly, the regulation of the MEP pathway appeared to be modular and calibrated with the up-regulation of four successive end reactions in an increasing manner, i.e., both log2FC and D-values increased in the order of 4-diphosphocytidyl-2-C-methyl-d-erythritol kinase (CMK), 2-C-methyl-d-erythritol 2,4-cyclodiphosphate synthase (MCS), 4-hydroxy-3-methylbut-2-en-1-yl diphosphate synthase [ferredoxin] (HDS), and 4-hydroxy-3-methylbut-2-enyl diphosphate reductase (HDR) (Figure 3a and Figure S4). Among them, HDS and HDR are known to be rate-limiting [26], and, as such, their regulation is expected to enhance the sensitivity of tuning the pathway. Figure S3 shows the up-regulated expression of MCS, HDS and HDR in the trichomes of all varieties compared to the stem. In this regard, the current finding provides fresh evidence that they serve as control points in the pathway [27]. On the other hand, in the MVA pathway, only the initial fast reaction catalyzed by acetyl-coenzyme A acetyltransferase 1 (ACAT1) was found to be significantly increased in terms of gene expression (Figure 2b, Figure 3a, and Figure S3), thus suggesting a limited increase in the utilization of the pathway. Overall, the modular and calibrated mode of regulation for both pathways might be due to their broader role in integrating environmental and developmental cues, thus necessitating the careful and effective adjustment of pathway activity by specialized modules [27].

2.5. En Bloc and Multi-Loci Up-Regulation of the Hexanoate Pathway and Cannabinoid Biosynthesis

The regulation of the hexanoate pathway was distinct from the MEP and MVA pathways in two ways: (i) the en bloc transcriptional up-regulation of all seven steps in the pathway, which is frequently achieved via (ii) numerous gene loci (Figure 3a). Such multi-loci regulated enzymes included linoleate lipoxygenase (LOX), ALDH, AAE, and OAC, with their log2 FC values of gene expression ranging from 2.5 to 7.6 (5 loci), 4.8 to 12 (3 loci), 2.1 to 8.1 (3 loci), and 9.1 to 9.2 (2 loci), respectively. This mode of regulation was also found with enzymes directly involved in cannabinoid biosynthesis (Figure 3a). For example, the aromatic prenyltransferases (APT) and THCA synthase (THCAS) enzyme genes showed respective log2 FC values ranging between 5.1 and 9.9 (5 loci), and 7.7 and 91 (2 loci). The en bloc and multigene loci mode of regulation shared by both pathways can be ascribed to their more straightforward role in cannabinoid production in the trichomes compared to the MEP and MVA pathways.

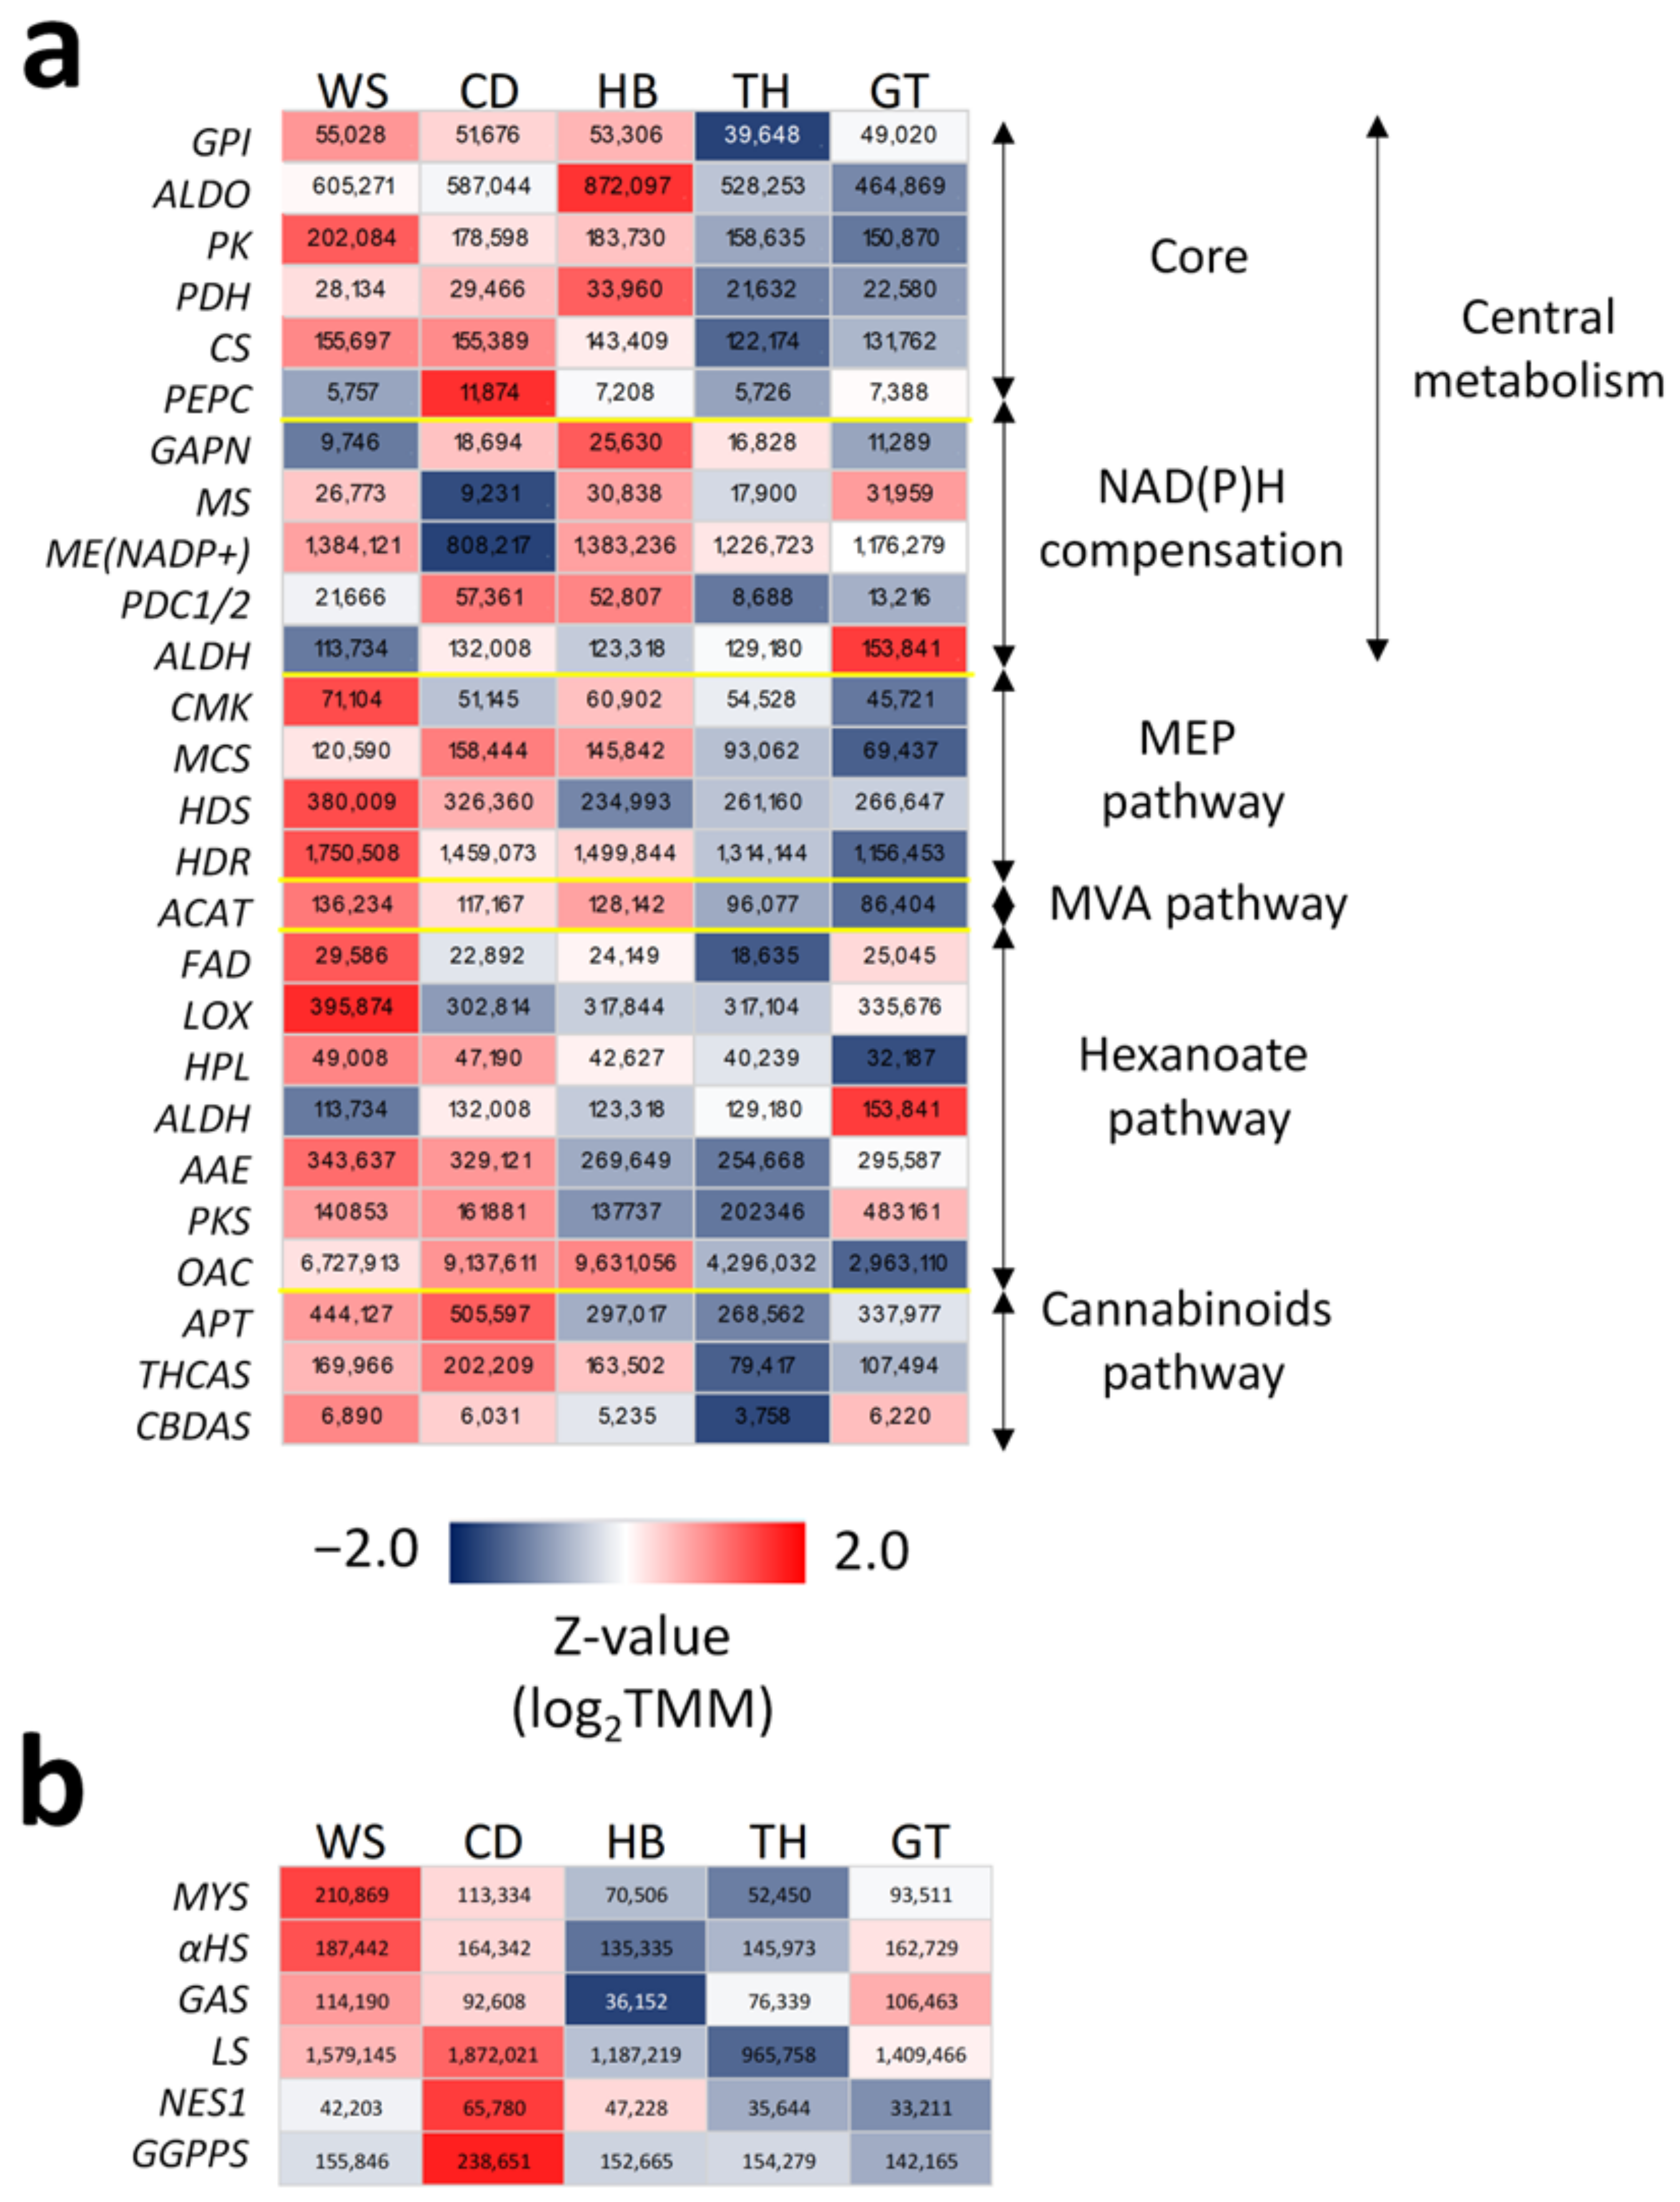
2.6. Metabolic Profiles of Cultivars

Furthermore, the gene expressions of the metabolic enzymes were compared among the cultivars to elucidate their relative production capacities. Most genes in the core central metabolism, as well as MEP and MVA pathways, were highly expressed in the WS cultivar, unlike others, suggesting that it has the highest NADPH and carbon feedstock productivities (Figure 4a). Consistently, the WS cultivar also had one of the lowest gene expressions for the PEPC enzyme, thus enabling it to redirect phosphoenolpyruvate to pyruvate feedstock production. Additionally, in the WS cultivar, the low gene expression for PDC and ALDH enzymes that drive NADH production (Figure 2c) may be compensated by high CS expression replenishing the TCA cycle to make the cofactors. Similarly, the high expression of CS and ME (NADP+) in WS may make up for its relatively low GAPN expression in producing NADPH. On the other hand, the HB cultivar seemed to excel in NADPH production via the up-regulation of both GAPN and ME (NADP+) genes, but was partly offset by its lower CS expression level compared to the WS cultivar. The WS cultivar also had broadly higher gene expressions in the hexanoate pathway (Figure 4a), suggesting its larger upstream capacity for cannabinoid production. In this regard, its lower ALDH level could already be sufficient for generating the required hexanoic acid for synthesizing cannabinoids (Figure 3a). Both the WS and CD cultivars also had some of the highest transcript abundances for APT, THCAS, and CBDAS enzymes but were still somewhat matched by the HB cultivar for THCAS and by the GT cultivar for CBDAS. Notably, the TH cultivar showed relatively low gene expression levels across all metabolic pathways (Figure 4a).
Expectedly, the gene expression for five major TPSs, namely, myrcene synthase (MYS), limonene synthase (LS), α-humulene synthase (αHS), nerolidol synthase (NES), and germacrene A synthase (GAS), were significantly up-regulated in the trichomes compared to the stem (Figure 3b and Figure S4). The CD cultivar had the highest total transcript levels for LS (TMM = 1.87 × 10⁶) and NES (6.58 × 10⁴), which were about twice those of the TH cultivar with the lowest expression (TMM = 9.66 × 10⁵ and 3.32 × 10⁴, respectively) (Figure 4b). On the other hand, the WS cultivar had the highest gene expression for MYS, αHS, and GAS.
As no chemical profiling data were available for rationalizing the metabolic outputs based on gene expression, publicly available information was used for the few comparisons that were possible (Table S7). Although THC levels were indeed higher in both WS and CD cultivars compared to others, as would be expected from their THCAS expression (Figure 4a), the levels of cannabinoids were, however, not in line with the relative gene expression of THCAS in WS and CD. CBDA and β-myrcene were also expectedly higher in WS compared to CD, based on respective CBDAS and MYS expressions (Figure 4b). On the other hand, the relative levels of limonene in WS and CD cultivars were inconsistent with the relative expressions of LS in the two cultivars.

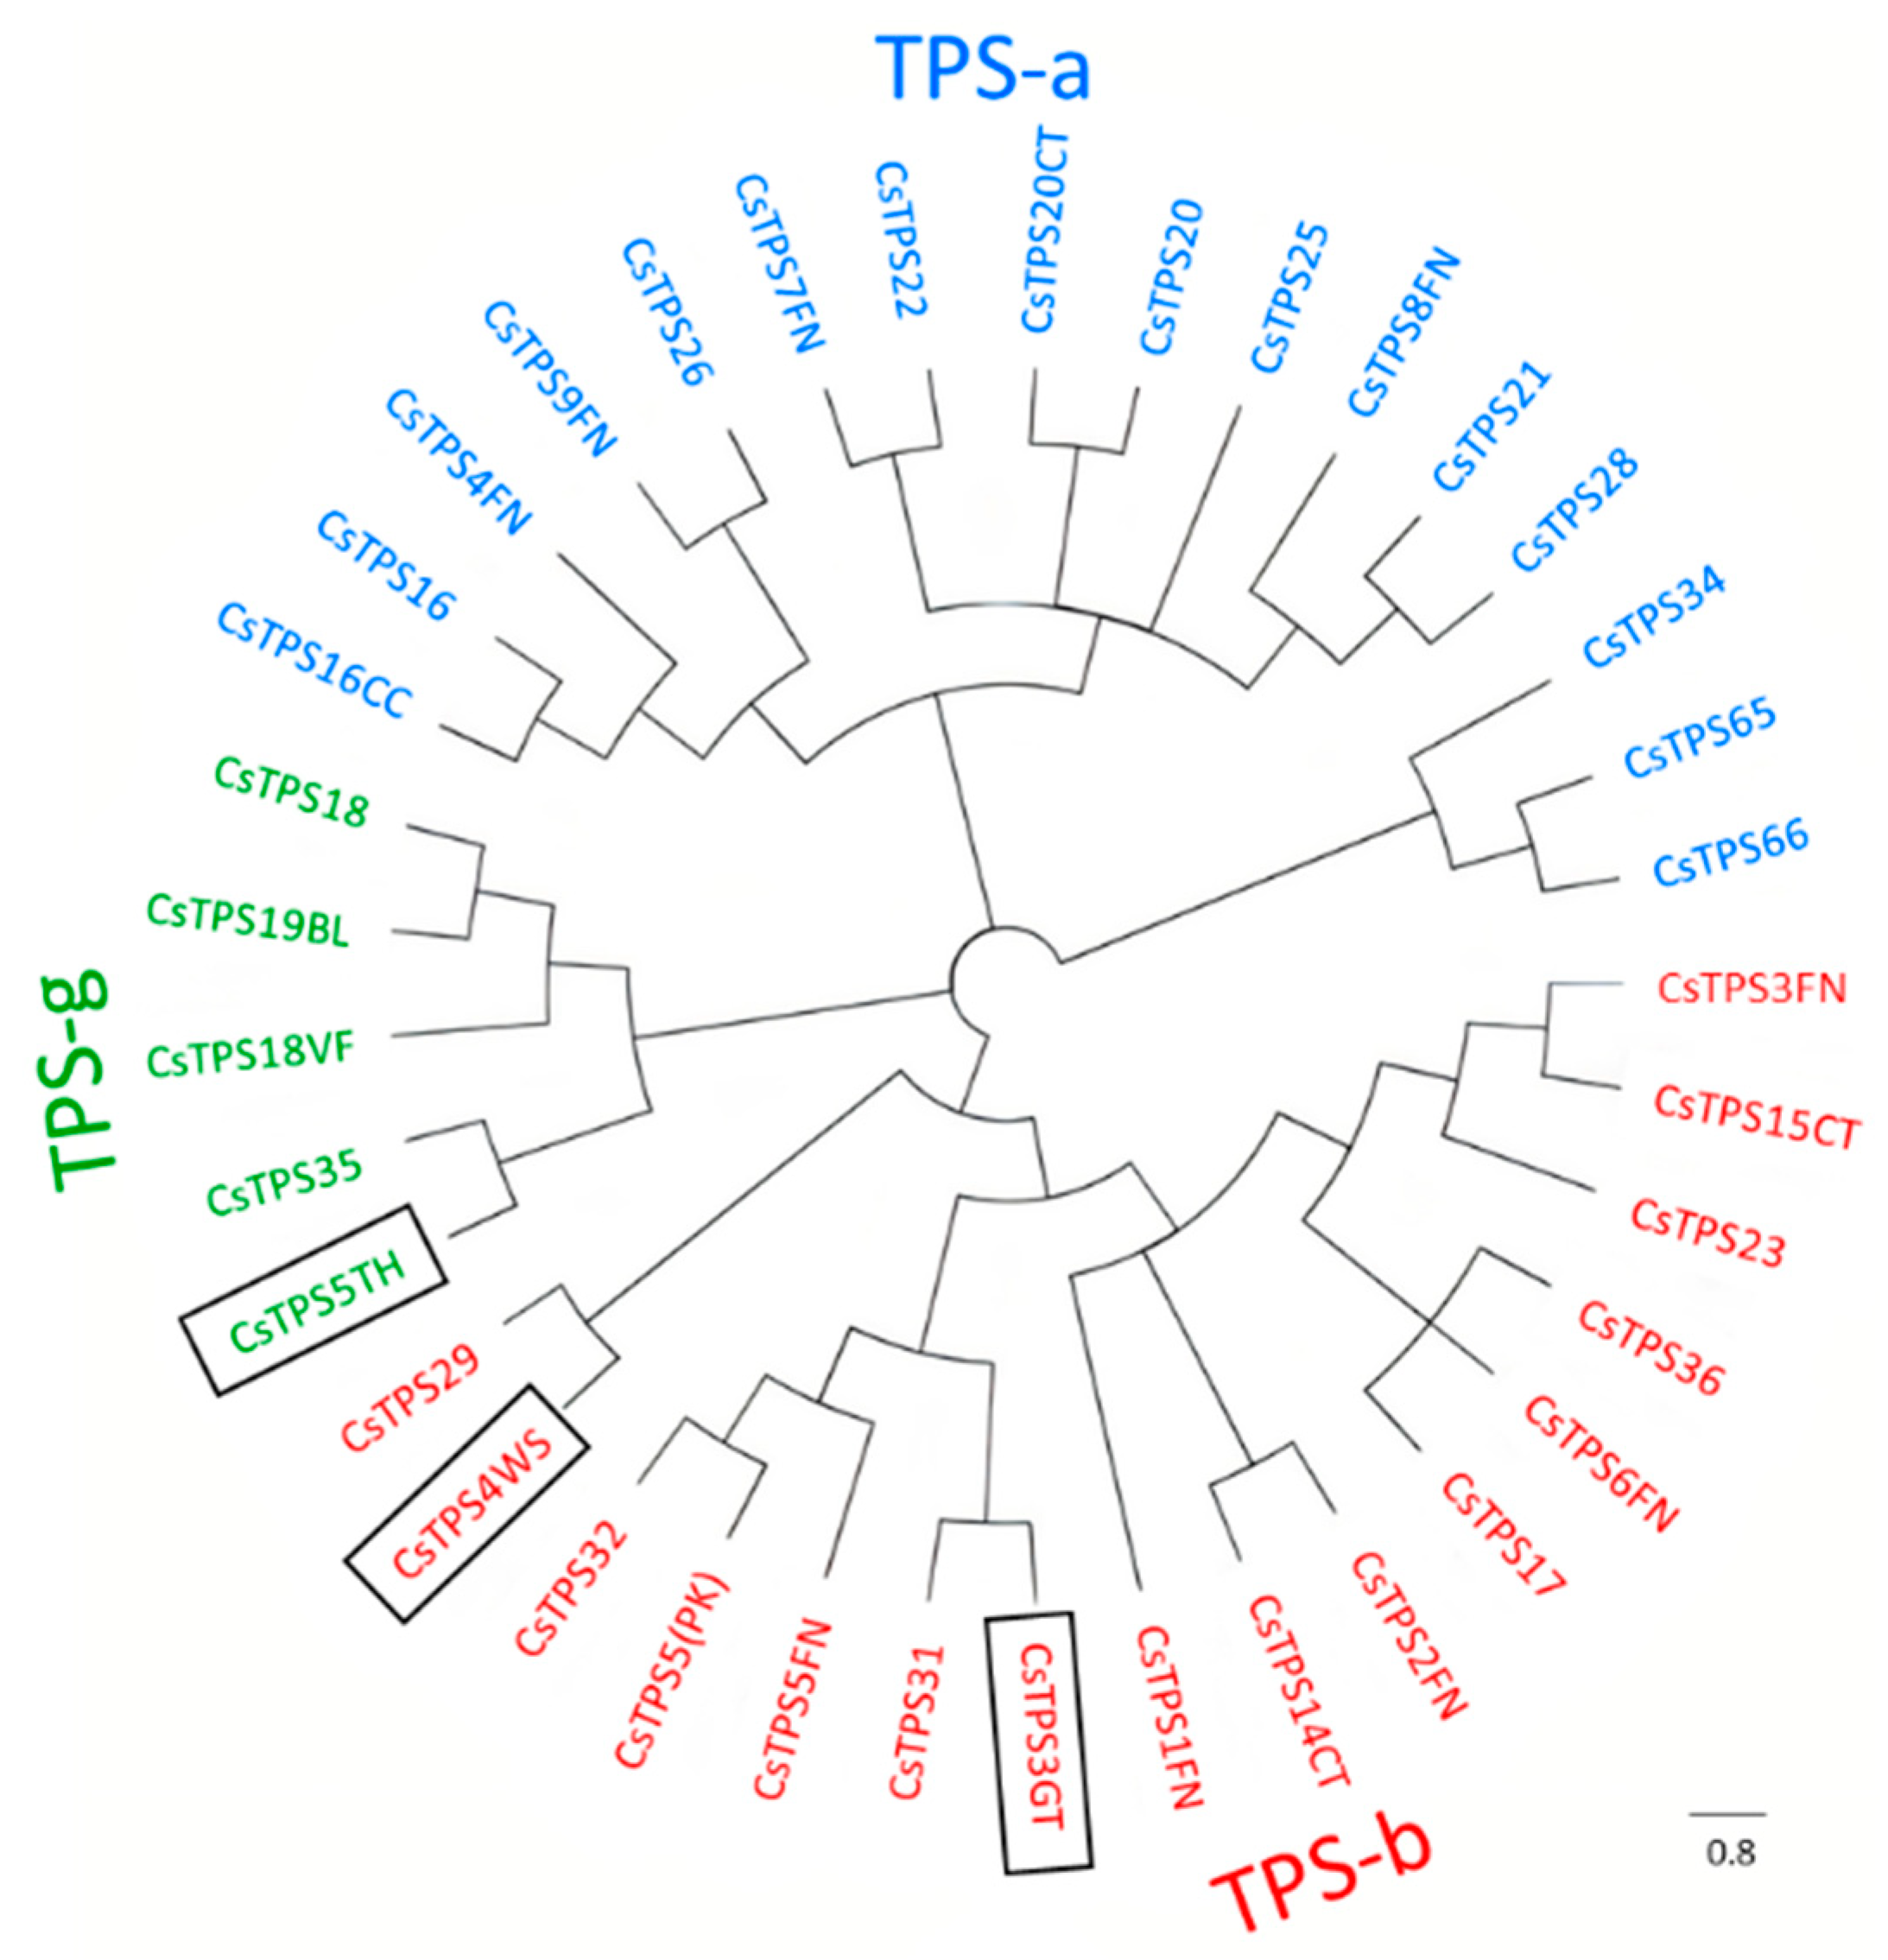
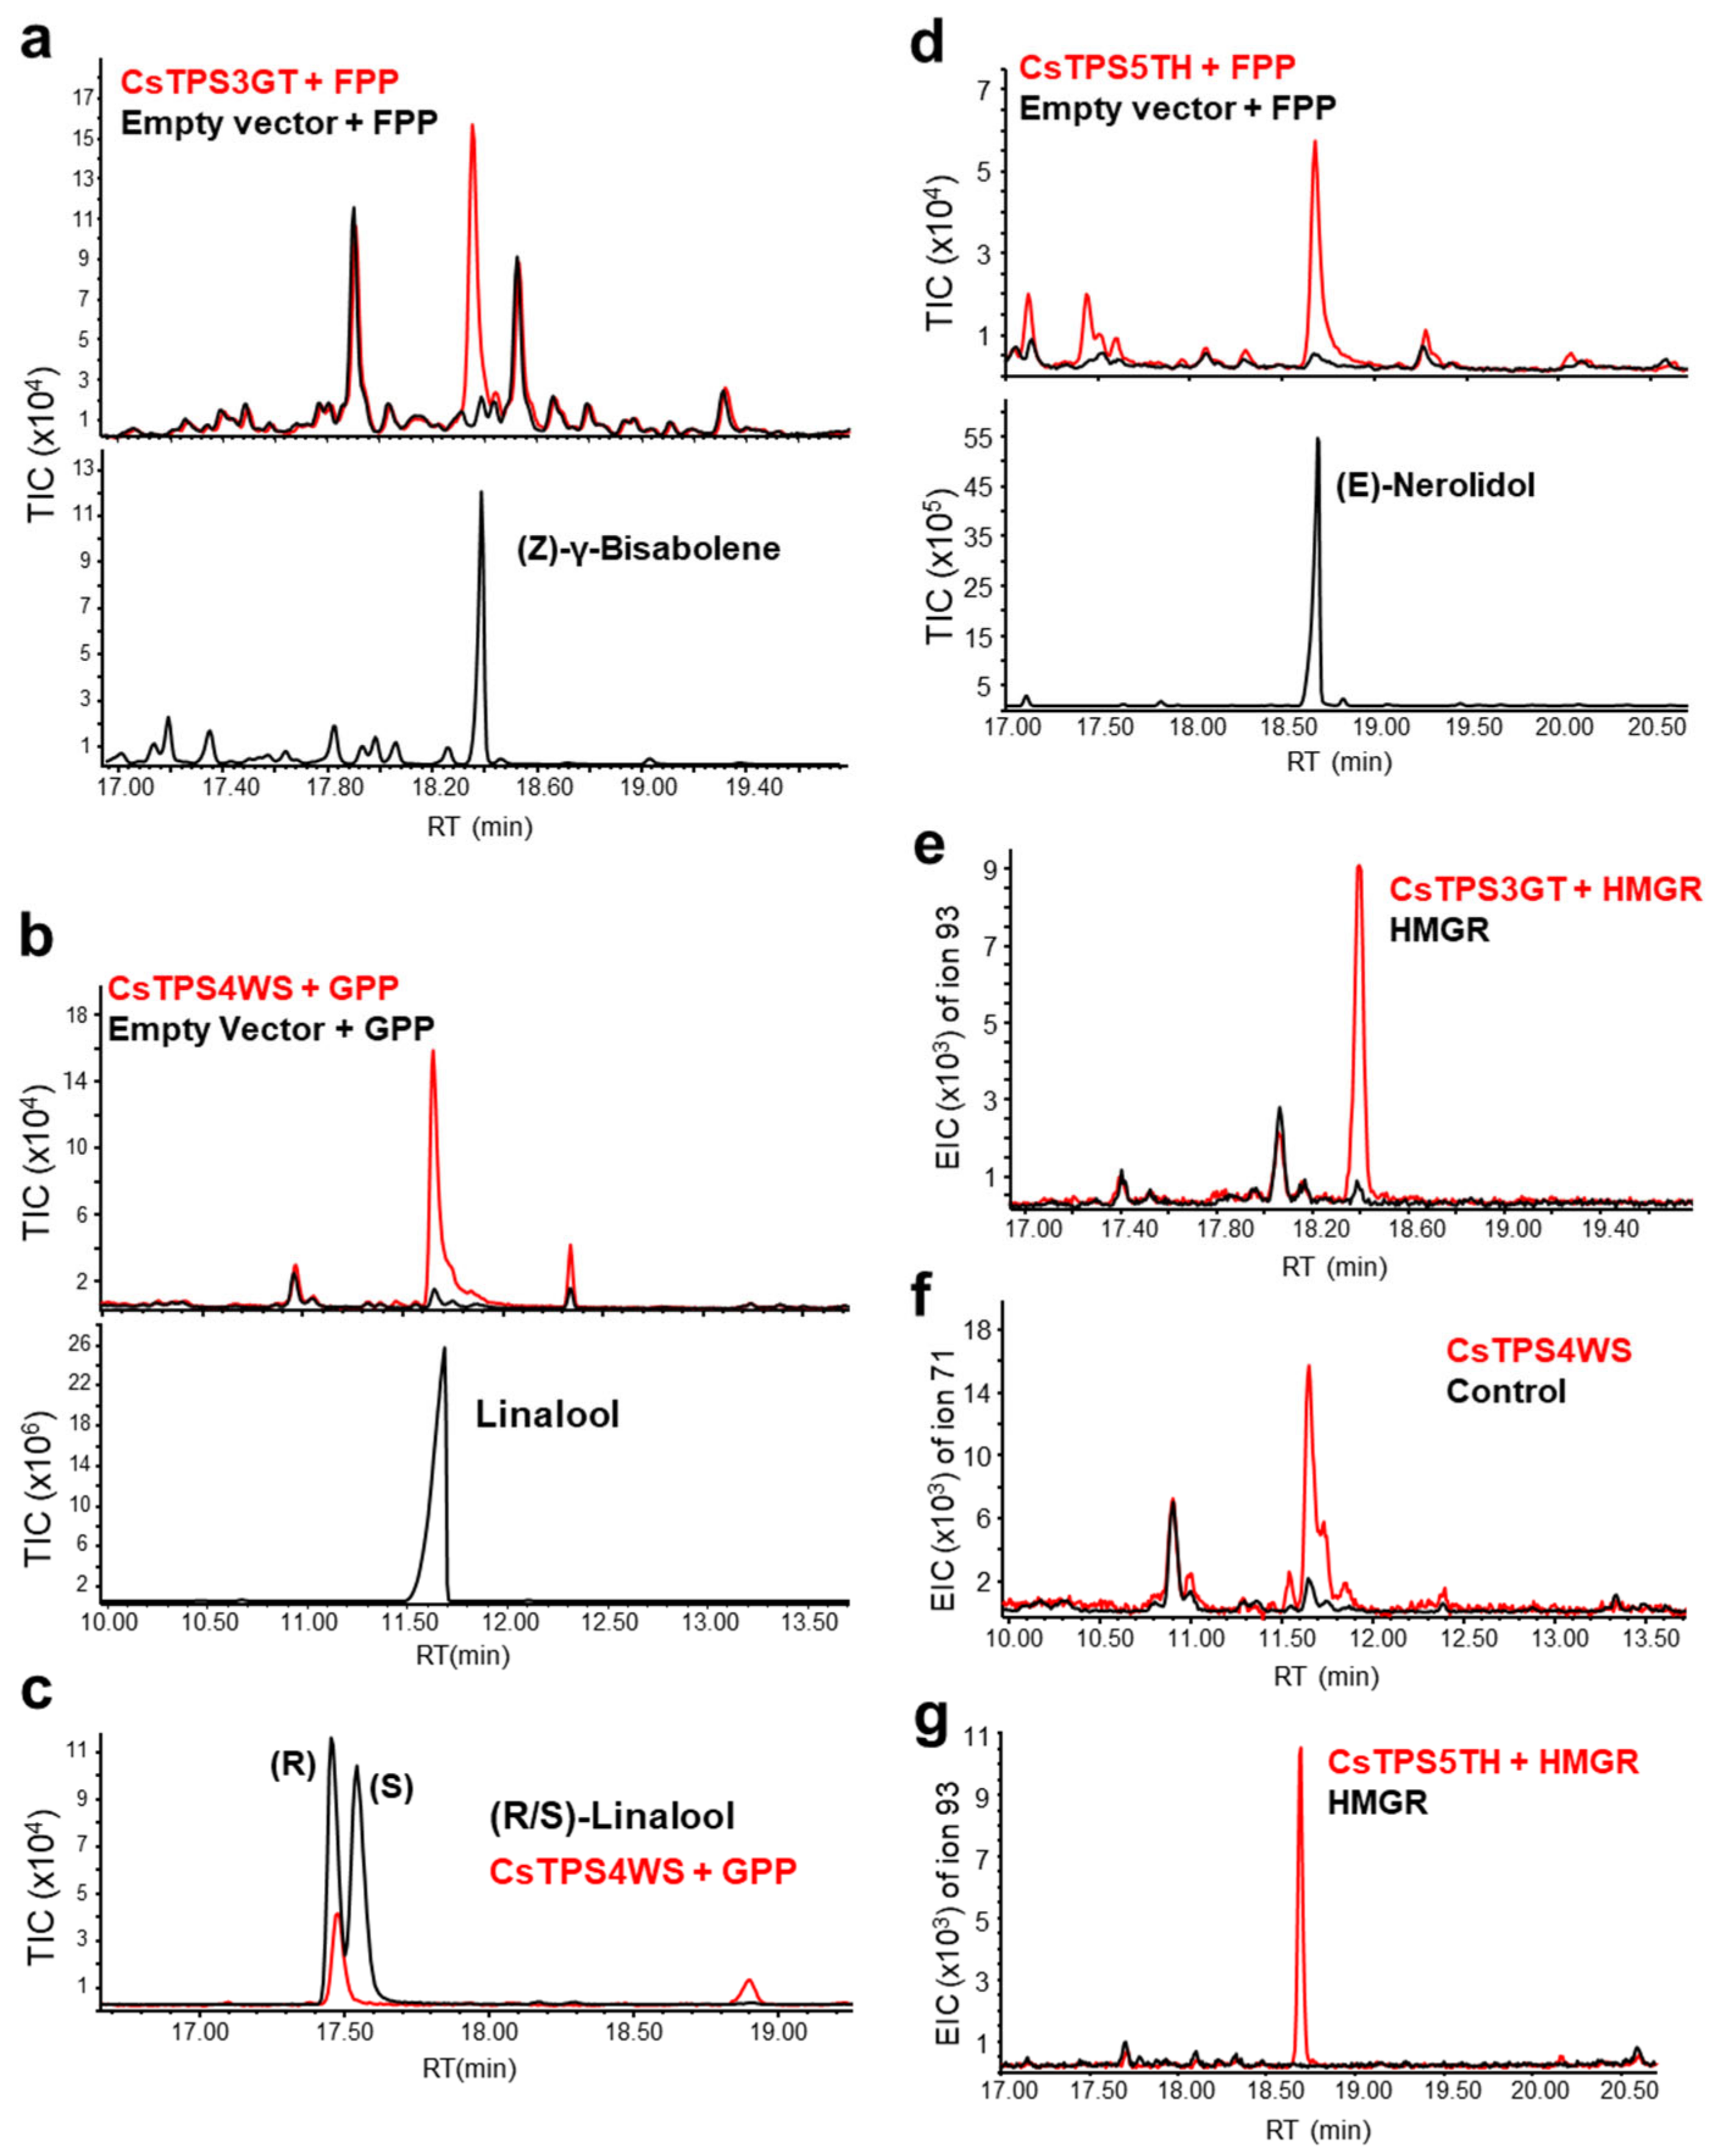
2.7. Functional Characterization of New TPSs

Besides previously reported TPSs from Cannabis [28,29,30,31], three new TPSs were identified from the RNA-seq data containing full-length open reading frames (ORFs). They were designated as CsTPS3GT, CsTPS4WS, and CsTPS5TH, to reflect their respective origins in the GT, WS, and TH cultivars. CsTPS4WS and CsTPS5TH had very high expressions in the trichomes of all cultivars, whereas CsTPS3GT showed lower expression in the trichomes of the HB, CD, and WS cultivars compared to the stem (Figure S5). Based on amino acid sequence similarity, CsTPS3GT was 96% similar to CsTPS31 (accession number: QLC36839.1), which was previously characterized as producing an unknown sesquiterpene with an RI of 1916 and a base peak of 93 [29]. Furthermore, CsTPS4WS was identical to CsTPS29 (accession number: QLC36833.1), which was previously identified as a linalool synthase [29], while CsTPS5TH was 98.7% similar to CsTPS35 (accession number: QLC36840.1), a linalool/nerolidol synthase [29].
As expected for TPSs, all three peptides contain the ‘DDXXD’ and ‘NSE/DTE’ motifs, which allow them to participate in divalent metal ion-assisted binding of substrates and cofactors [32]. Furthermore, both CsTPS3GT and CsTPS4WS contained a tandem arginine/tryptophan motif, ‘RR(X8)W’, at the N-terminal region (Figure S6), which could be used for monoterpene cyclization [33]. However, the plastid-targeting peptide, which is unique to mono-TPSs, was absent in CsTPS3GT (Figure S6). Phylogenetic analysis placed CsTPS3GT and CsTPS4WS in the TPS-b sub-family, whereas CsTPS5TH fell under the TPS-g sub-family (Figure 5).
The intracellular localization of each TPS was investigated in N. benthamiana leaf cells. Upon transient expression of YFP-tagged TPSs in the leaf cells, both CsTPS3GT and CsTPS5TH were found to localize to the cytosol (Figure 6), which is consistent with their lack of transit peptide sequences and thus suggests that they are sesqui-TPSs, rather than mono-TPSs (Figure 6). On the other hand, CsTPS4WS was localized to the chloroplasts, indicating it to be a mono-TPS.

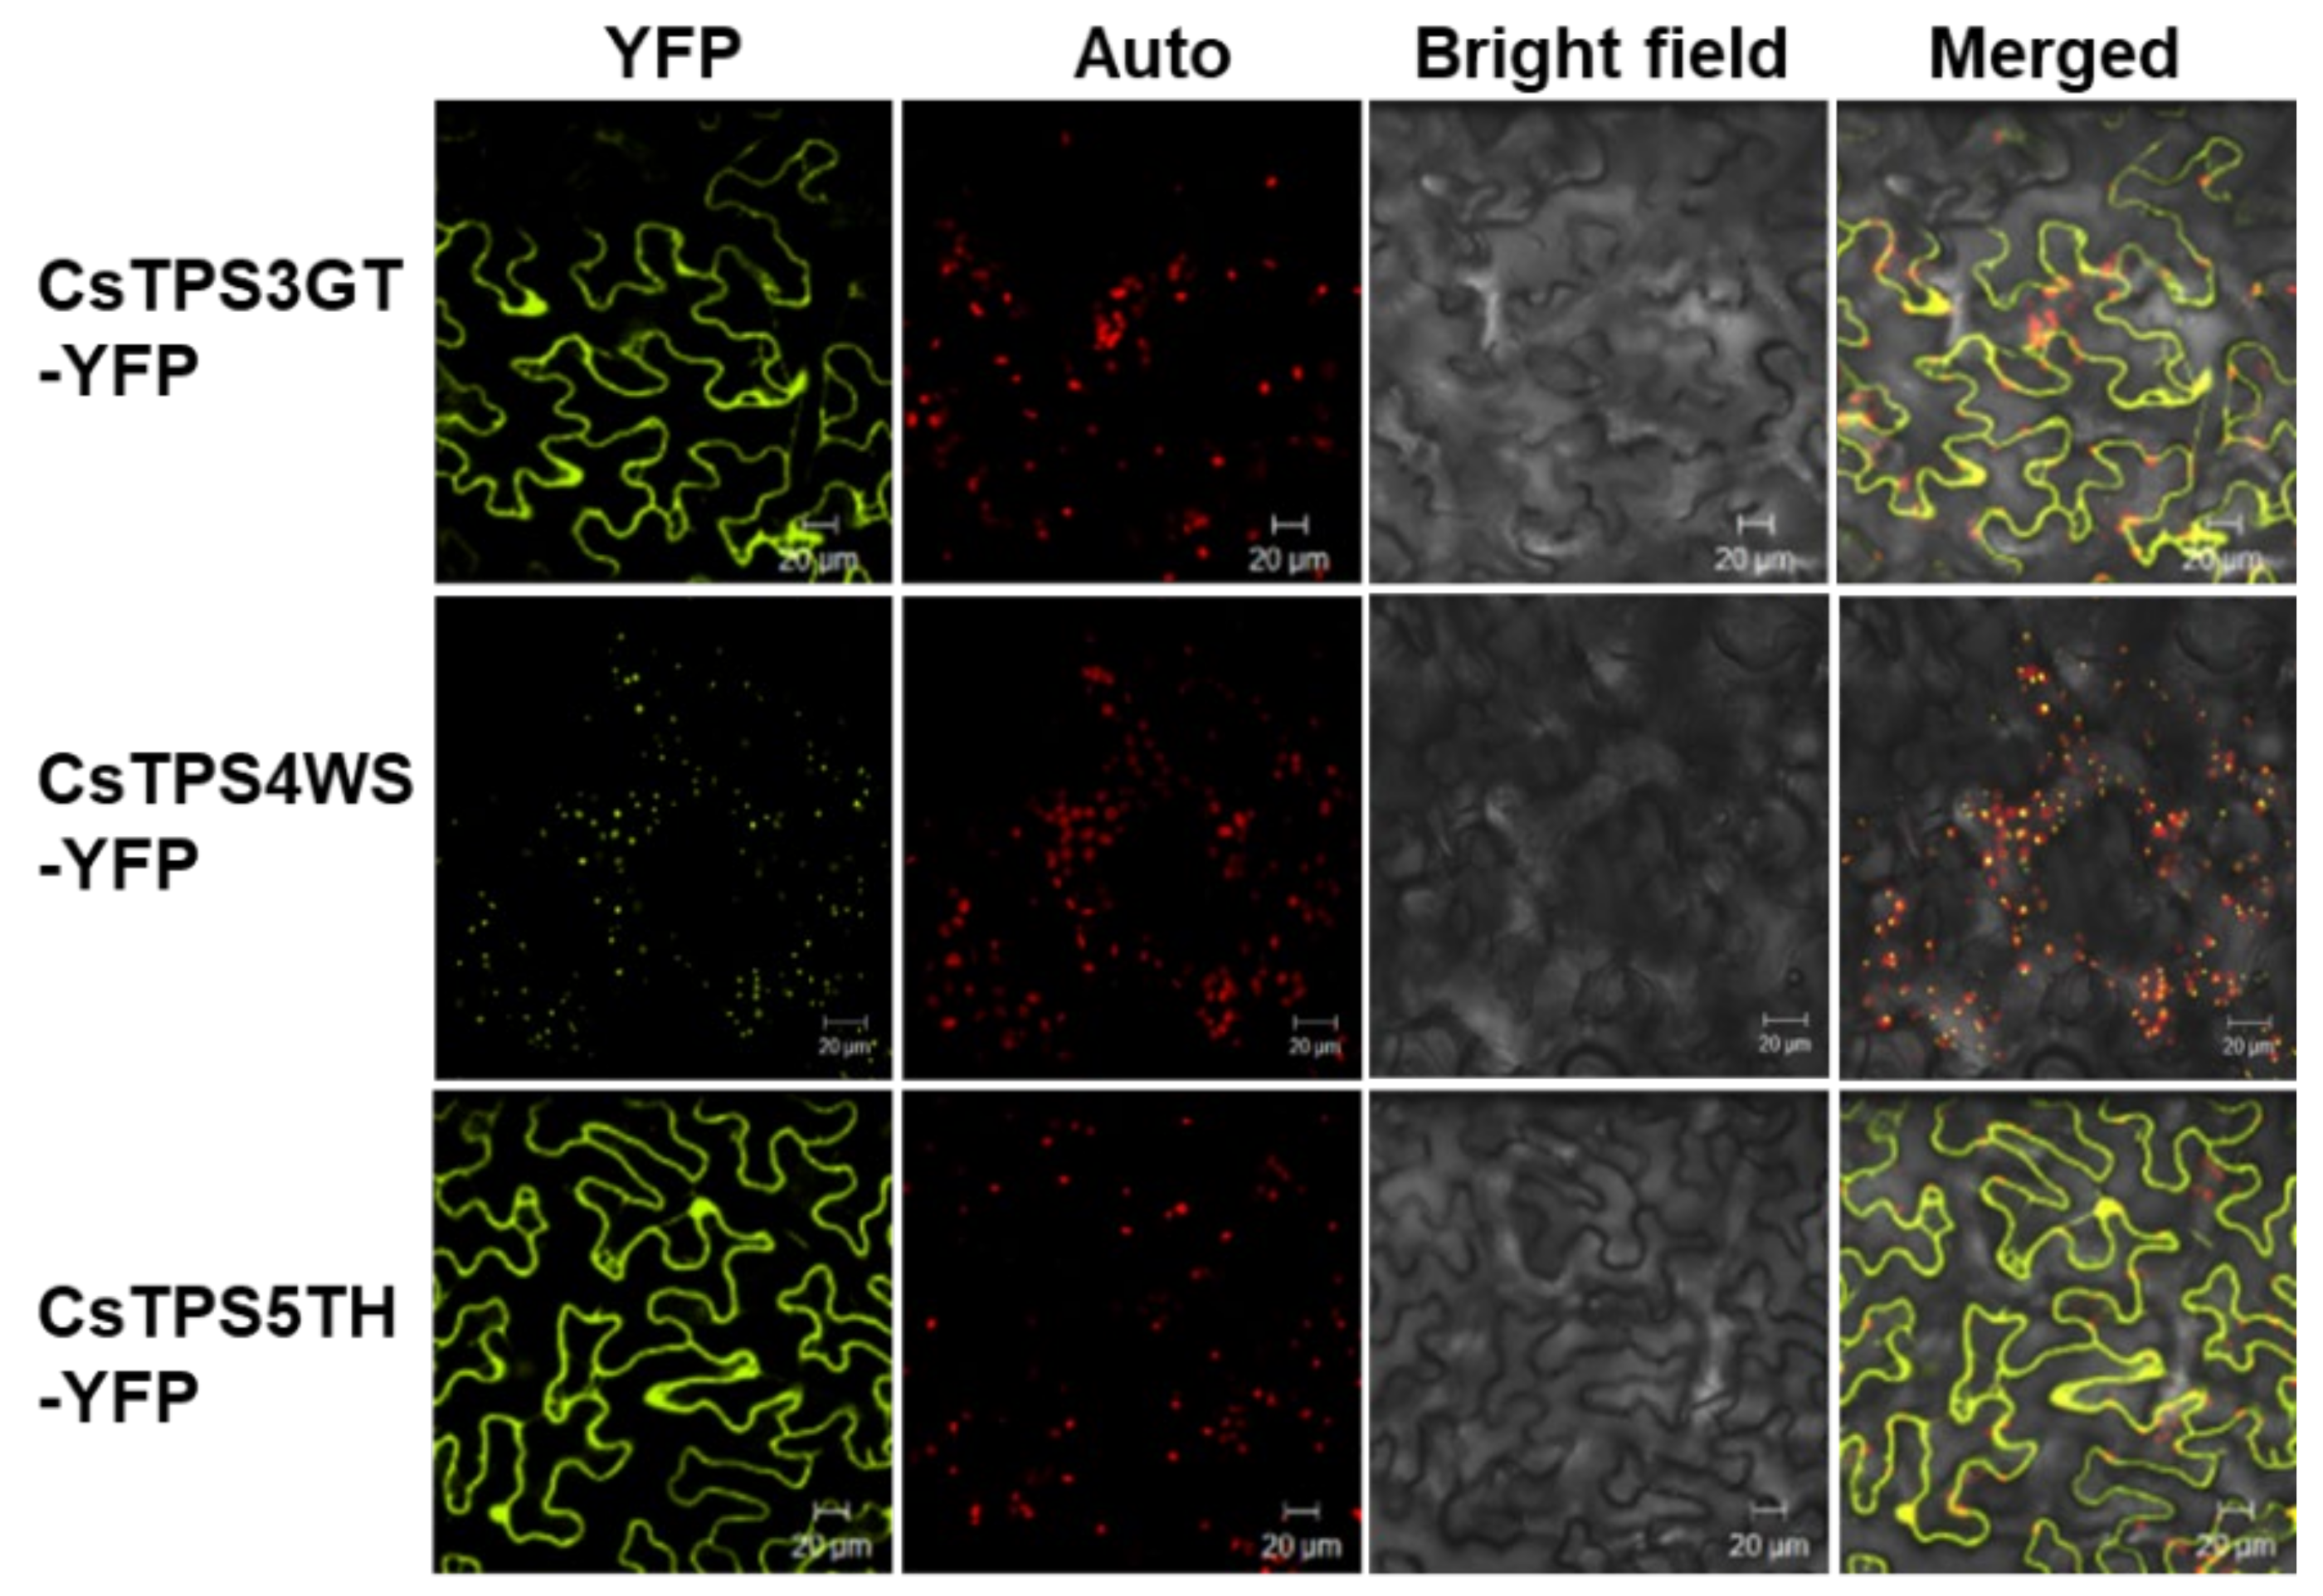
2.8. In Vitro and In Vivo Identification of CsTPSs

The enzymatic activities of the CsTPSs were tested with an in vitro assay, using GPP, FPP, GGPP, and neryl pyrophosphate (NPP) as substrates. CsTPS3GT was found to react only with FPP to form sesquiterpene (Z)-γ-bisabolene, while CsTPS4WS reacted exclusively with GPP to form linalool, a monoterpene alcohol, as reported for CsTPS29 (Figure 7a,b; [29]). As there are two natural enantiomers for linalool (R and S) [34,35], CsTPS4WS was further confirmed to be (R)-linalool synthase via chiral gas chromatography (Figure 7c). On the other hand, CsTPS5TH produced the sesquiterpene (E)-nerolidol with only FPP, thus confirming it as an (E)-nerolidol synthase (Figure 7d). CsTPS activity was further evaluated in vivo by transiently expressing them in the leaves of N. benthamiana. Consistent with the in vitro results, the characteristic peak of (R)-linalool with CsTPS4WS at 3 dpi (days post-infiltration) was detected. Similarly, CsTPS3GT and CsTPS5TH were confirmed to produce (Z)-γ-bisabolene and (E)-nerolidol, respectively (Figure 7e–g).

3. Discussion

This study provides clear evidence at the transcriptome level that illuminates the holistic and concerted adaptations of metabolism in Cannabis trichomes to facilitate cannabinoid and terpene production. For example, our findings on the importance of enhanced and coordinated AcCoA production in Cannabis trichomes is supported by studies in various organisms; an increase in AcCoA supply via overexpression of PDH and AcCoA synthetase (ACS) improved IPP precursor biosynthesis through the MVA pathway [24], while the enhancement of pyruvate level by up-regulating pyruvate kinase expression (e.g., PK and PK2) led to improved AcCoA availability, promoting terpene production [36]. The excessive demand of NADPH for secondary metabolite production was also supported by the increase in expression (D-value) of the gene encoding the ME (NADP+) enzyme (Figure 2a), which was the largest among the primary pathways. Consequently, the MDH reactions that compete for the same malate substrate to generate NADH instead were likely reduced. The phenomena of swapping NADH for NADPH production in Cannabis trichomes was repeated with the four-fold increase in the expression of the gene for the GAPN enzyme, which re-routed G3P away from the GAPDH and PGK reactions that produce NADH and ATP as an alternative. The findings further indicate that, if inappropriately dealt with, NADPH deficiency can be a major production bottleneck in the Cannabis plant. In this regard, the provision of NADPH and the other uncovered carbon substrates (G3P, pyruvate, and AcCoA) has been repeatedly demonstrated to result in high terpenoid productivity by engineered Escherichia coli, with a mass yield of up to 45% [36,37,38,39]. Thus, the current analysis newly demonstrates similar convergence in the adaptations of the Cannabis plant to enhance secondary metabolite yields. In addition, it was also found that the NAD(P)H-producing pathway, with enhanced ME (NADP+) expression (Figure 2c), possibly constitutes a modified acetate fermentation pathway. Firstly, PDH, PDC, and ALDH have functional roles in the pathway [40], and PDC is known to be induced in an anoxic environment [41]. When the fate of acetate (as the end metabolite of the pathway) was investigated, there was no indication of its being recycled to regenerate AcCoA [42] due to low ACS expression. Thus, the metabolite could be secreted in a fermentative manner. Furthermore, the glandular trichomes of the peppermint plant were also recently shown to exhibit fermentative metabolism [43], thus suggesting a similar feature in the Cannabis plant, for which the glandular trichomes of female flowers are the major sites of cannabinoid and terpene production [44]. This suggests that an anaerobic environment may not be required for the fermentation, as the trichome cells could just be prioritizing usage of their enzymatic capacity [45,46] for secondary metabolite production, over acetate recycling. Furthermore, the recycling is unnecessary, as carbon supplies are expected to be plentiful, given the productive role of the trichomes.
Furthermore, the current analysis highlights the heightened capacity of the MEP pathway compared to the MVA pathway in the trichomes, as suggested by the up-regulation of more genes encoding biosynthetic enzymes catalyzing rate-limiting reactions, and further characterized by larger fold changes and increased expressions (Figure 3a). This could be explained by the increased requirement for GPP as a precursor for monoterpene as well as cannabinoid biosynthesis in the fully matured flowers. Consistently, studies of other cultivars in a similar flowering stage also found genes encoding enzymes in the MEP pathway to be more highly expressed than those in the MVA pathway [47,48]. Genes in the latter pathway are instead more highly expressed during the early stage of flowering [48], in line with the larger sesquiterpene output reported during this time [49]. In addition, the exchange of isoprenoid precursors between two pathways is known to be possible [27], which further raises the possibility of the MEP pathway replenishing the MVA pathway for sesquiterpene biosynthesis, subject to the limited physical capacity of the chloroplast. Given the intense selection pressure for secondary metabolite production in the cultivars, such an adaptation would also benefit from the higher stoichiometric yield [50,51] and lower oxygen requirement [26] of the MEP pathway. The coordination of the pathways has also been previously proposed in a study, which established a negative correlation between HMGR expression in the MVA pathway and the MEP module comprising CMK, MCS, and HDS [52], which is consistent with the findings in this work. HMGR is further known to be a rate-limiting enzyme for the MVA pathway in many plants, whereas DXS and DXR are similarly so in the MEP pathway [53,54]. Although the bottlenecked production of limiting enzymes may be overcome by their over-expression, as demonstrated in many plants, the relevant research has not yet been carried out for Cannabis, to the best of our knowledge.
To illustrate the application of the current findings for crop selection to achieve high yields, a comparison of the expressions of pivotal enzyme genes, which were identified in commonly used cultivars, was pursued. There were large variations in their expressions and consequently in the implied production capacities of the cultivars. For example, there were 3.3-, 1.9-, 2.6-, and 1.8-fold differences in expression for OAC, APT, THCAS, and CBDAS among five cultivars (Figure 4a), thus exemplifying the need to profile cultivars molecularly. Although the WS and TH cultivars were easily identified as high and low producers, respectively, based on their highly consistent expression profiles, it is less clear how the other cultivars ought to be classified—a situation further exacerbated by the lack of chemical profiles for evaluation. Thus, further studies are needed to determine the relative utilities of key identified enzymes in discerning cultivar outputs.
Transcriptomics data are also highly useful for mining uncharacterized but highly expressed TPSs, which may contribute to the characteristic terpene repertoire of cultivars. Of the three genes picked out in this study, CsTPS5TH was experimentally verified to be an (E)-nerolidol synthase. On the other hand, CsTPS3GT and CsTPS4WS were initially described as mono-TPS1 (MTS1) and TPS9 in the cs10 Cannabis reference genome. However, in this work, CsTPS3GT and CsTPS4WS were found to synthesize a sesquiterpene (Z)-γ-bisabolene and a monoterpene (R)-linalool, respectively. Such misannotation of MTS1 underscores the challenge of using in silico assays for evaluating TPS function. Previously, an apple TPS was also mischaracterized as being most similar to mono-TPS due to the presence of the ‘RR(X8)W’ motif near the N-terminus [55]. However, it lacked the plastid transit peptide associated with mono-TPS, just like CsTPS3GT. Similarly, CsTPS4WS was initially considered to be capable of monoterpene cyclization because of the presence of the ‘RR(X8)W’ motif. However, it was found that it could only produce an acyclic monoterpene alcohol, (R)-linalool, using both in vitro and in vivo assays in this study. Given that the two natural enantiomers of linalool have distinct olfactory qualities, CsTPS4WS may contribute to the lavender-like smell of Cannabis with its production of (R)-linalool [56], rather than the floral and petitgrain-like scent of (S)-linalool [57]. This study also further affirms that minute amino acid differences can result in significantly different TPS activities. For example, although CsTPS5TH and CsTPS35 share 98.7% similarity at the amino acid level, CsTPS5TH could only produce nerolidol from FPP, which is unlike CsTPS35, which can synthesize both linalool from GPP and (E)-nerolidol from FPP. Similarly, CsTPS4FN and CsTPS9FN form different products [58], despite being 97% identical in their amino acid sequences.

4. Materials and Methods

4.1. Plant Material, Trichome Isolation, and RNA Isolation

All plants were grown indoors in a growth chamber using Coco coir–perlite (3:1) growing medium. The photoperiod was maintained under a 16 h light/8 h dark cycle during vegetative phase and a 12 h light/12 h dark cycle during generative phase to induce flowering. The ambient temperature was maintained at 28 °C. Flowers from CD, GT, WS, TH, and HB were collected at the 10th, 9th, 9th, 9th and 10th weeks, respectively. Trichomes from the fully matured female flowers of five Cannabis cultivars were separated by soaking the flowers in RNAlater solution with crushed ice, with continuous shaking for 5 min. The solutions were then passed through differently sized cell strainers to separate trichomes from other cell debris [58,59]. To obtain stem samples, trichomes were brushed off from the stems of HB cultivar plants; they were few in number and had very low levels of secondary metabolites, unlike the trichomes of flowers [60]. The collected trichomes and brushed stem samples were then sent to SeqMatic LLC (Fremont, CA) for RNA isolation and sequencing. Total RNAs from Cannabis trichomes were isolated using the SpectrumTM Plant Total RNA Kit (Sigma-Aldrich), according to the manufacturer’s instructions, and their RIN scores were found to range between 5 and 8. The lower RIN scores of trichomes were due to their high metabolite contents. One biological replicate was used for transcriptomic analysis of the stem tissue and the trichomes of each cultivar. It is important to note that one biological replicate of the trichome consists of thousands of trichomes pooled together. Nicotiana benthamiana plants were grown in a greenhouse under long-day conditions (16 h under light/8 h in darkness) for 4 weeks before using them for subcellular localization experiments and in vivo TPS assays.

4.2. RNA Library, RNA-seq, Pre-Processing, and Quality Control

RNA libraries were constructed according to Illumina’s TruSeq strand-specific protocol, with a median insert size of ~230 bp (~100–350 bp). They were then sequenced using HiSeq 2500@PE100 platform (Illumina, San Diego, CA). Adaptor sequences were removed from the reads using Trimmomatic [61], while the quality of the reads was maintained by trimming using the ‘adaptive quality trimming’ algorithm [62]. The latter strikes a balance between quality score and sufficient read length, which is necessary for unambiguous mapping to the genome. Resulting reads < 36 bp were deemed to cause unspecific mapping and were thus discarded. Furthermore, only reads with a mean Q-score > 25 were retained, which translated to <1% error on average for each base pair. Upon completion, quality-control checks using FastQC did not reveal any issues with the final pre-processed reads.

4.3. Reference Genome Mapping and GC-Bias Correction

SALMON [63] was used to quantify transcript expression from the pre-processed reads in a rapid and memory-efficient manner by coupling quasi-mapping onto a reference transcriptome with a read count inference procedure. In doing so, it considers the specific experiment attributes and corrects their biases, including GC contents, to provide a more accurate estimate of the read counts. The latest cs10 transcriptomic and genomic sequences (https://www.ncbi.nlm.nih.gov/genome/?term=txid3482[orgn], accessed on 18 October 2020) were used as references for transcriptome mapping and identification of genomic decoys to prevent spurious mapping, respectively. A read count table based on transcripts was produced as a result.

4.4. Gene-Level Expression, Normalization, and Quality Control

Tximport [64] was used to sum up transcript read counts at the gene level. Following this, read counts were normalized using the TMM method and further divided by gene length to enable comparison across samples [65]. The TMM method normalizes the total RNA amount across samples and assumes that most genes are not differentially expressed. As such, it allows for the comparison of diverse samples, such as from different batches and tissue types, in contrast to within-sample normalization methods, such as RPM, FPKM, and TPM. Principal component analysis was then conducted on the gene expression dataset to assess whether there were any trichome sample outliers.

4.5. Differential Expression Analysis

The NOISeq algorithm [66] was used for the identification of DEGs, as it allows for a good control of false positives among lowly expressed genes by considering both M- and D-values. This is because lowly expressed genes tend to have high absolute M-values due to noise and may be construed wrongly as differentially expressed; however, by considering their low D-values, the false positives can be picked out statistically in a robust manner. This is especially applicable in discerning DEGs in the secondary pathways of plants (e.g., Cannabis plants) that may be lowly expressed but are biologically relevant. An 80% probability of being a true positive is used as the threshold for flagging a gene as differentially expressed. For genes having multiple genomic loci contributing to their expression, the percentage increase in trichome expression over the stem tissue for each gene can be determined by first taking the expression value of each locus in the trichomes as the average of all 5 cultivars. Then, the sum of all loci values can be taken to be the expression value of the gene. Gene expression in the stem tissue was similarly evaluated and then subtracted away from the corresponding expression in the trichome to determine the increase in expression. Gene expression increase was then reported as a percentage of its expression in the stem.

4.6. Hierarchical Clustering and Venn Diagram Analysis of DEG

Hierarchical clustering was carried out in R using complete linkage, and 1 − ρ2 as a measure of dissimilarity between all pairwise genes, where ρ is the Pearson’s correlation between the log2 fold-change (FC) values of pairwise genes. For representation of the clustering in heatmaps, the log2 FC values of each gene were centered and scaled based on the cultivars. The Venn diagram analysis was conducted online (http://www.interactivenn.net/) [67].

4.7. Gene Mapping to Metabolic Pathways

To analyze gene expressions in the metabolic pathways, they were first identified by a BLASTX search of cs10 gene sequences against the NCBI database to identify their Viridiplantae protein homologs. The KEGG IDs of the latter were then mapped to the pathways using the Blast2GO [68] module in OmicsBox 1.3.11 software (https://www.biobam.com/omicsbox [BioBam Bioinformatics, Valencia, Spain], accessed on 12 November 2020). In this way, cs10 genes with membership in metabolic pathways were identified (Table S5). More were manually picked out by inspecting their cs10 descriptions.

4.8. Quantitative Real-Time PCR (qRT-PCR)

The quantity and quality of RNA were measured using a Nanodrop spectrophotometer (ND-1000, Thermo Fisher Scientific, Waltham, MA, USA), and approximately 500 ng of RNA was reverse transcribed to cDNA using an iScriptTM cDNA Synthesis kit obtained from Bio-Rad, Singapore. Expression levels of enzyme genes along the trichomes of five cultivars and the stem of the HB cultivar were analyzed using qRT-PCR. Primers for qRT-PCR were designed by exploiting the cDNA sequences obtained from the RNA-seq data. The qRT-PCR reactions were performed in a 384-well PCR plate using KAPA SYBR fast master mix (Roche, Singapore) and an ABI PRISM 900HT real-time PCR system. For a total PCR reaction of 5 µL, 0.3 µL of cDNA was used and the cycling profile was set at 50 °C for 2 min, 95 °C for 10 min, 40 cycles of 95 °C for 15 s, and 60 °C for 60 s. After thermal cycles, the dissociation analysis (melting curve) was carried out to confirm the specific amplifications of the PCR reaction by adding a profile of 95 °C for 15 s, 60 °C for 15 s, and 95 °C for 15 s. In the current study, CsGAPDH was used as an internal reference, due to its similar expression across the five cultivars. A non-template reference was included for each gene to eliminate the possibility of random genomic DNA contamination and primer dimer formation. SDS 2.4 software (Applied Biosystems) was used to analyze the obtained results. The threshold cycle (Ct) value of a gene is the cycle number required for the SYBR Green fluorescence signal to reach the threshold level during the exponential phase for detecting the amount of accumulated nucleic acid [69]. Comparative delta Ct values of target genes to CsGAPDH were taken as relative expressions among different tissues. The amounts of target genes, normalized to the CsGAPDH gene, were calculated by 2−(Ct[target gene]-Ct[GAPDH]). Error bars represent means ± SDs. All primers used in this study were designed manually and are listed in Table S1.

4.9. Phylogenetic Tree and Clustal Analysis

A phylogenetic tree was constructed using MEGA7 software (Version 7.0, Pennsylvania State University, PA, USA) [70] by the neighbour-joining method with bootstrap values of 1000 replicates. The required sequences were obtained from the NCBI database, with their accession numbers listed in Table S2. The deduced amino acid sequences of CsTPSs were aligned with other functionally characterized CsTPSs using Clustal W, with the following parameters: gap open: 10; gap extension: 0.1; protein weight matrix: Gonnet; penalties: on; gap separation: 4; cut off: 30%.

4.10. Subcellular Localization of TPSs

Full-length ORFs of CsTPS3GT, CsTPS4WS, and CsTPS5TH were cloned into pENTR vectors using the pENTR™/D-TOPO® Cloning Kit (Thermo Fisher Scientific, Singapore) and transformed into XL1-blue competent cells. Plasmids from the positive clones were isolated and cloned into the destination vector pBA-DC-YFP [71], which contains the YFP in frame at the C-terminal and cauliflower mosaic virus (CaMV) 35S promoter, to generate CsTPS3GT-YFP, CsTPS4WS-YFP, and CsTPS5TT-YFP, respectively. The constructs were transformed into the Agrobacterium tumefaciens EHA105 strain by a heat shock method [72]. The transformed EHA105 cells were cultured at 28 °C and resuspended in a solution containing 100 µM acetosyringone, 10 mM MES (pH 5.6), and 10 mM MgCl2. The above mixture was incubated at room temperature for 3 h and later infiltrated into N. benthamiana leaves using a 1 mL syringe. After 2 d, the infiltrated leaves were excised, and the fluorescence signals were observed under a confocal scanning laser microscope (LSM 5 Exciter, ZEISS, Jena, Germany). All constructs were verified by DNA sequencing.

4.11. In Vitro and In Vivo TPS Assays

For the in vitro TPS assay, the recombinant protein with 6His-tag was cloned into the destination vector pDEST17 and expressed using the E. coli BL21 pLysS strain. A cell pellet from 5 mL of isopropyl β-d-1-thiogalactopyranoside (IPTG)-induced culture was passed through a His spin trap (GE Healthcare) to obtain the cell lysate. The assay was carried out by mixing 250 µL of 2× reaction buffer (50 mM HEPES (pH 7.4), 200 mM KCl, 15 mM MgCl2, 10% glycerol, 10 mM DTT) with 50 µg of cell lysate, 5 µg of the substrate (GPP, FPP, NPP, and GGPP) and massed up to 500 µL with 25 mM HEPES (pH 7.4) in an inert glass bottle. Then, 250 µL of hexane was added on top slowly and the reaction bottle was sealed with parafilm. After an incubation at 30 °C for 2 h, the reaction mixture was vortexed for 1 min and centrifuged at 1200 rpm for 30 min. The hexane layer was then transferred to a fresh GC bottle and subjected to GC–MS analysis.
For the in vivo assay, A. tumefaciens cultures harbouring plasmids 35Spro:CsTPS, 35Spro:HMGR, and silencing suppressor 35Spro:p19 were pelleted and resuspended in MMA (10 mM MES, 10 mM MgCl2, and 100 µM acetosyringone) solution to OD600 = 1. The solutions were then mixed or infiltrated separately into N. benthamiana leaves using a 1 mL syringe, and 2–3 infiltrated leaves were excised after 3 d and incubated with 500 µL hexane for 1 hr. The homogenized samples were then centrifuged for 10 min at 13,000 revolutions per min (rpm). The hexane layer was transferred to glass vials and analyzed using GC–MS (7890A with 5975C inert mass selective detector, Agilent Technologies, Santa Clara, CA, USA). Then, 2 µL samples were injected, and separation was achieved with a temperature program of 50 °C for 1 min, increased at a rate of 8 °C/min to 300 °C and held for 5 min, on a 30 m HP-5 MS column or CP-Chirasil Dex CB column (25 m × 0.25 mm, 0.25 μm film thickness) (Agilent Technologies, Santa Clara, CA, USA). The compounds were identified by comparison with the mass spectra reference library NIST MS 2014. The data were processed by MSD ChemStation Data Analysis (Agilent Technologies). The enantiomeric identity of linalool was confirmed by comparison with the GC data of (S)-linalool and (R)-linalool standards.

5. Conclusions

In this study, transcriptome data of the glandular trichomes of five Cannabis cultivars were generated and compared with those of stem tissue without trichomes, thereby uncovering the coordinated regulation of primary and secondary metabolic pathways in the trichomes, which is consistent with their high levels of secondary metabolite production. However, further studies on the effects of these gene regulations are still needed at the protein, metabolite, and phenotypic levels (functional genomics) to support our findings. We examined the DEGs between trichomes and an organ without trichomes (namely, the stem after removal of all trichomes)—this because we were focused on the metabolic adaptations required for secondary metabolite production, rather than the differences among various organs, which may have been too convoluted for the achievement of our objective. Certainly, future studies could be directed at similarly comparing different organs, for example, leaves, stems, and flowers, to elucidate other nuanced metabolic adaptations in the latter.
Recently, there has been also a lot of research on selecting and developing Cannabis cultivars with specific traits. In this regard, the availability of transcriptomic profiles will enable researchers to make progress by elucidating the relevant genes to be targeted. With this in mind, the data for the five cultivars can serve as resources for such work. In addition, the function of three TPS genes were characterized, identifying them as (R)-linalool synthase, (Z)-γ-bisabolene synthase, and (E)-nerolidol synthase, thus adding to our communal knowledge of the diverse repertoire of Cannabis TPSs. Altogether, this work will contribute to the effective genetic characterization, selection, and development of Cannabis cultivars.

Supplementary Materials

The following supporting information can be downloaded at: https://www.mdpi.com/article/10.3390/ijms23158310/s1.

Author Contributions

S.R. and I.-C.J. conceived the project. H.C.Y., V.A.R., S.R., and I.-C.J. designed the experiments. V.A.R., B.-G.M., and S.H.L. performed the molecular and biochemical experiments. H.C.Y. performed RNA-seq assembly. H.C.Y. processed, analyzed, and interpreted the biological implications of the RNA-seq data. S.D. aided in cloning. H.C.Y. and V.A.R. wrote the manuscript, which was edited by S.R. and I.-C.J. All authors have read and agreed to the published version of the manuscript.

Funding

This work was supported by the National Research Foundation, Prime Minister’s Office, Singapore, under its Synthetic Biology Research and Development Programme (Award No: SBP-P3).

Institutional Review Board Statement

Not applicable.

Informed Consent Statement

Not applicable.

Data Availability Statement

RNA sequencing data can be retrieved from the NCBI Sequence Read Archive (PRJNA706039). Sequence data for CsTPS3GT, CsTPS4WS, and CsTPS5TH have been deposited in GenBank under the accession numbers MW713051, MW713052, and MW713053, respectively.

Acknowledgments

We thank the Temasek Life Sciences Laboratory’s central facility for support in confocal microscopy and Xiujing He for her technical assistance with regard to RNA-seq.

Conflicts of Interest

The authors declare no conflict of interest.

References

  1. Izzo, A.A.; Borrelli, F.; Capasso, R.; Di Marzo, V.; Mechoulam, R. Non-psychotropic plant cannabinoids: New therapeutic opportunities from an ancient herb. Trends Pharmacol. Sci. 2009, 30, 515–527. [Google Scholar] [CrossRef]
  2. Namdar, D.; Anis, O.; Poulin, P.; Koltai, H. Chronological Review and Rational and Future Prospects of Cannabis-Based Drug Development. Molecules 2020, 25, 4821. [Google Scholar] [CrossRef]
  3. Small, E.; Beckstead, H.D.; Chan, A. The Evolution of Cannabinoid Phenotypes in Cannabis. Econ. Bot. 1975, 29, 219–232. [Google Scholar] [CrossRef]
  4. Gülck, T.; Møller, B.L. Phytocannabinoids: Origins and Biosynthesis. Trends Plant Sci. 2020, 25, 985–1004. [Google Scholar] [CrossRef] [PubMed]
  5. Fellermeier, M.; Eisenreich, W.; Bacher, A.; Zenk, M.H. Biosynthesis of cannabinoids. Eur. J. Biochem. 2001, 268, 1596–1604. [Google Scholar] [CrossRef] [PubMed]
  6. Rodziewicz, P.; Loroch, S.; Marczak, Ł.; Sickmann, A.; Kayser, O. Cannabinoid synthases and osmoprotective metabolites accumulate in the exudates of Cannabis sativa L. glandular trichomes. Plant Sci. 2019, 284, 108–116. [Google Scholar] [CrossRef] [PubMed]
  7. Van Bakel, H.; Stout, J.M.; Cote, A.G.; Tallon, C.M.; Sharpe, A.G.; Hughes, T.R.; Page, J.E. The draft genome and transcriptome of Cannabis sativa. Genome Biol. 2011, 12, R102. [Google Scholar] [CrossRef] [PubMed] [Green Version]
  8. Hanuš, L.O.; Meyer, S.M.; Muñoz, E.; Taglialatela-Scafati, O.; Appendino, G. Phytocannabinoids: A unified critical inventory. Nat. Prod. Rep. 2016, 33, 1357–1392. [Google Scholar] [CrossRef] [PubMed] [Green Version]
  9. ElSohly, M.A.; Radwan, M.M.; Gul, W.; Chandra, S.; Galal, A. Phytochemistry of Cannabis sativa L. In Phytocannabinoids: Unraveling the Complex Chemistry and Pharmacology of Cannabis sativa; Kinghorn, A.D., Falk, H., Gibbons, S., Kobayashi, J.I., Eds.; Springer International Publishing: Cham, Switzerland, 2017; pp. 1–36. [Google Scholar]
  10. ElSohly, M.A.; Slade, D. Chemical constituents of marijuana: The complex mixture of natural cannabinoids. Life Sci. 2005, 78, 539–548. [Google Scholar] [CrossRef] [PubMed]
  11. Sirikantaramas, S.; Morimoto, S.; Shoyama, Y.; Ishikawa, Y.; Wada, Y.; Shoyama, Y.; Taura, F. The gene controlling marijuana psychoactivity: Molecular cloning and heterologous expression of δ1-tetrahydrocannabinolic acid synthase from Cannabis sativa L. J. Biol. Chem. 2004, 279, 39767–39774. [Google Scholar] [CrossRef] [Green Version]
  12. Taura, F.; Sirikantaramas, S.; Shoyama, Y.; Yoshikai, K.; Shoyama, Y.; Morimoto, S. Cannabidiolic-acid synthase, the chemotype-determining enzyme in the fiber-type Cannabis sativa. FEBS Lett. 2007, 581, 2929–2934. [Google Scholar] [CrossRef] [PubMed] [Green Version]
  13. Taura, F.; Tanaka, S.; Taguchi, C.; Fukamizu, T.; Tanaka, H.; Shoyama, Y.; Morimoto, S. Characterization of olivetol synthase, a polyketide synthase putatively involved in cannabinoid biosynthetic pathway. FEBS Lett. 2009, 583, 2061–2066. [Google Scholar] [CrossRef] [PubMed] [Green Version]
  14. Welling, M.T.; Shapter, T.; Rose, T.J.; Liu, L.; Stanger, R.; King, G.J. A Belated Green Revolution for Cannabis: Virtual Genetic Resources to Fast-Track Cultivar Development. Front. Plant Sci. 2016, 7, 1113. [Google Scholar] [CrossRef]
  15. Booth, J.K.; Bohlmann, J. Terpenes in Cannabis sativa—From plant genome to humans. Plant Sci. 2019, 284, 67–72. [Google Scholar] [CrossRef] [PubMed]
  16. Russo, E.B. Taming THC: Potential cannabis synergy and phytocannabinoid-terpenoid entourage effects. Br. J. Pharmacol. 2011, 163, 1344–1364. [Google Scholar] [CrossRef]
  17. Russo, E.B. The Case for the Entourage Effect and Conventional Breeding of Clinical Cannabis: No “Strain,” No Gain. Front. Plant Sci. 2019, 9, 1969. [Google Scholar] [CrossRef]
  18. Gertsch, J.; Leonti, M.; Raduner, S.; Racz, I.; Chen, J.-Z.; Xie, X.-Q.; Altmann, K.-H.; Karsak, M.; Zimmer, A. Beta-caryophyllene is a dietary cannabinoid. Proc. Natl. Acad. Sci. USA 2008, 105, 9099–9104. [Google Scholar] [CrossRef] [Green Version]
  19. Guirimand, G.; Guihur, A.; Perello, C.; Phillips, M.; Mahroug, S.; Oudin, A.; Dugé de Bernonville, T.; Besseau, S.; Lanoue, A.; Giglioli-Guivarc’h, N.; et al. Cellular and Subcellular Compartmentation of the 2C-Methyl-D-Erythritol 4-Phosphate Pathway in the Madagascar Periwinkle. Plants 2020, 9, 462. [Google Scholar] [CrossRef] [PubMed] [Green Version]
  20. Vranová, E.; Coman, D.; Gruissem, W. Network Analysis of the MVA and MEP Pathways for Isoprenoid Synthesis. Annu. Rev. Plant Biol. 2013, 64, 665–700. [Google Scholar] [CrossRef] [PubMed]
  21. Thabet, I.; Guirimand, G.; Guihur, A.; Lanoue, A.; Courdavault, V.; Papon, N.; Bouzid, S.; Giglioli-Guivarc’h, N.; Simkin, A.J.; Clastre, M. Characterization and subcellular localization of geranylgeranyl diphosphate synthase from Catharanthus roseus. Mol. Biol. Rep. 2012, 39, 3235–3243. [Google Scholar] [CrossRef]
  22. Okada, K.; Saito, T.; Nakagawa, T.; Kawamukai, M.; Kamiya, Y. Five geranylgeranyl diphosphate synthases expressed in different organs are localized into three subcellular compartments in Arabidopsis. Plant Physiol. 2000, 122, 1045–1056. [Google Scholar] [CrossRef] [PubMed] [Green Version]
  23. Pu, X.; Dong, X.; Li, Q.; Chen, Z.; Liu, L. An update on the function and regulation of methylerythritol phosphate and mevalonate pathways and their evolutionary dynamics. J. Integr. Plant Biol. 2021, 63, 1211–1226. [Google Scholar] [CrossRef] [PubMed]
  24. Shiba, Y.; Paradise, E.M.; Kirby, J.; Ro, D.K.; Keasling, J.D. Engineering of the pyruvate dehydrogenase bypass in Saccharomyces cerevisiae for high-level production of isoprenoids. Metab. Eng. 2007, 9, 160–168. [Google Scholar] [CrossRef] [PubMed]
  25. Brocker, C.; Vasiliou, M.; Carpenter, S.; Carpenter, C.; Zhang, Y.; Wang, X.; Kotchoni, S.O.; Wood, A.J.; Kirch, H.-H.; Kopečný, D.; et al. Aldehyde dehydrogenase (ALDH) superfamily in plants: Gene nomenclature and comparative genomics. Planta 2013, 237, 189–210. [Google Scholar] [CrossRef] [PubMed] [Green Version]
  26. Zhao, L.; Chang, W.-C.; Xiao, Y.; Liu, H.-W.; Liu, P. Methylerythritol phosphate pathway of isoprenoid biosynthesis. Annu. Rev. Biochem. 2013, 82, 497–530. [Google Scholar] [CrossRef] [PubMed] [Green Version]
  27. Rodríguez-Concepción, M. Early Steps in Isoprenoid Biosynthesis: Multilevel Regulation of the Supply of Common Precursors in Plant Cells. Phytochem. Rev. 2006, 5, 1–15. [Google Scholar] [CrossRef]
  28. Booth, J.K.; Page, J.E.; Bohlmann, J. Terpene synthases from Cannabis sativa. PLoS ONE 2017, 12, e0173911. [Google Scholar] [CrossRef] [PubMed] [Green Version]
  29. Booth, J.K.; Yuen, M.M.S.; Jancsik, S.; Madilao, L.L.; Page, J.E.; Bohlmann, J. Terpene Synthases and Terpene Variation in Cannabis sativa. Plant Physiol. 2020, 184, 130–147. [Google Scholar] [CrossRef]
  30. Allen, K.D.; McKernan, K.; Pauli, C.; Roe, J.; Torres, A.; Gaudino, R. Genomic characterization of the complete terpene synthase gene family from Cannabis sativa. PLoS ONE 2019, 14, e0222363. [Google Scholar]
  31. Zager, J.J.; Lange, I.; Srividya, N.; Smith, A.; Lange, B.M. Gene Networks Underlying Cannabinoid and Terpenoid Accumulation in Cannabis. J. Plant Physiol. 2019, 180, 1877–1897. [Google Scholar] [CrossRef] [PubMed] [Green Version]
  32. Martin, D.M.; Aubourg, S.; Schouwey, M.B.; Daviet, L.; Schalk, M.; Toub, O.; Lund, S.T.; Bohlmann, J. Functional Annotation, Genome Organization and Phylogeny of the Grapevine (Vitis vinifera) Terpene Synthase Gene Family Based on Genome Assembly, FLcDNA Cloning, and Enzyme Assays. BMC Plant Biol. 2010, 10, 226. [Google Scholar] [CrossRef] [PubMed] [Green Version]
  33. Kumar, Y.; Khan, F.; Rastogi, S.; Shasany, A.K. Genome-wide detection of terpene synthase genes in holy basil (Ocimum sanctum L.). PLoS ONE 2018, 13, e0207097. [Google Scholar] [CrossRef] [PubMed]
  34. Dhandapani, S.; Jin, J.; Sridhar, V.; Sarojam, R.; Chua, N.-H.; Jang, I.-C. Integrated metabolome and transcriptome analysis of Magnolia champaca identifies biosynthetic pathways for floral volatile organic compounds. BMC Genom. 2017, 18, 463. [Google Scholar] [CrossRef] [PubMed]
  35. Pichersky, E.; Raguso, R.A.; Lewinsohn, E.; Croteau, R. Floral Scent Production in Clarkia (Onagraceae) (I. Localization and Developmental Modulation of Monoterpene Emission and Linalool Synthase Activity). J. Plant Physiol. 1994, 106, 1533. [Google Scholar] [CrossRef] [Green Version]
  36. Wang, Q.; Quan, S.; Xiao, H. Towards efficient terpenoid biosynthesis: Manipulating IPP and DMAPP supply. Bioresour. Bioprocess. 2019, 6, 6. [Google Scholar] [CrossRef] [Green Version]
  37. Wang, Z.; Sun, J.; Yang, Q.; Yang, J. Metabolic Engineering Escherichia coli for the Production of Lycopene. Molecules 2020, 25, 3136. [Google Scholar] [CrossRef] [PubMed]
  38. Coussement, P.; Bauwens, D.; Maertens, J.; De Mey, M. Direct Combinatorial Pathway Optimization. ACS Synth. Biol. 2017, 6, 224–232. [Google Scholar] [CrossRef]
  39. Zhao, J.; Li, Q.; Sun, T.; Zhu, X.; Xu, H.; Tang, J.; Zhang, X.; Ma, Y. Engineering central metabolic modules of Escherichia coli for improving β-carotene production. Metab. Eng. 2013, 17, 42–50. [Google Scholar] [CrossRef] [PubMed]
  40. Rasheed, S.; Bashir, K.; Kim, J.-M.; Ando, M.; Tanaka, M.; Seki, M. The modulation of acetic acid pathway genes in Arabidopsis improves survival under drought stress. Sci. Rep. 2018, 8, 7831. [Google Scholar] [CrossRef]
  41. Rivoal, J.; Thind, S.; Pradet, A.; Ricard, B. Differential Induction of Pyruvate Decarboxylase Subunits and Transcripts in Anoxic Rice Seedlings. Plant Physiol. 1997, 114, 1021–1029. [Google Scholar] [CrossRef] [Green Version]
  42. Fu, X.; Yang, H.; Pangestu, F.; Nikolau, B.J. Failure to Maintain Acetate Homeostasis by Acetate-Activating Enzymes Impacts Plant Development. Plant Physiol. 2020, 182, 1256–1271. [Google Scholar] [CrossRef] [PubMed] [Green Version]
  43. Johnson, S.R.; Lange, I.; Srividya, N.; Lange, B.M. Bioenergetics of Monoterpenoid Essential Oil Biosynthesis in Nonphotosynthetic Glandular Trichomes. Plant Physiol. 2017, 175, 681–695. [Google Scholar] [CrossRef] [PubMed] [Green Version]
  44. Livingston, S.J.; Quilichini, T.D.; Booth, J.K.; Wong, D.C.J.; Rensing, K.H.; Laflamme-Yonkman, J.; Castellarin, S.D.; Bohlmann, J.; Page, J.E.; Samuels, A.L. Cannabis glandular trichomes alter morphology and metabolite content during flower maturation. Plant J. 2020, 101, 37–56. [Google Scholar] [CrossRef] [PubMed]
  45. Shlomi, T.; Benyamini, T.; Gottlieb, E.; Sharan, R.; Ruppin, E. Genome-Scale Metabolic Modeling Elucidates the Role of Proliferative Adaptation in Causing the Warburg Effect. PLoS Comput. Biol. 2011, 7, e1002018. [Google Scholar] [CrossRef] [PubMed] [Green Version]
  46. Yeo, H.C.; Hong, J.; Lakshmanan, M.; Lee, D.-Y. Enzyme capacity-based genome scale modelling of CHO cells. Metab. Eng. 2020, 60, 138–147. [Google Scholar] [CrossRef] [PubMed]
  47. Booth, J. Terpene and Isoprenoid Biosynthesis in Cannabis Sativa; The University of British Columbia: Vancouver, BC, Canada, 2020. [Google Scholar]
  48. Braich, S.; Baillie, R.C.; Jewell, L.S.; Spangenberg, G.C.; Cogan, N.O.I. Generation of a Comprehensive Transcriptome Atlas and Transcriptome Dynamics in Medicinal Cannabis. Sci. Rep. 2019, 9, 16583. [Google Scholar] [CrossRef] [PubMed]
  49. Aizpurua-Olaizola, O.; Soydaner, U.; Ozturk, E.; Schibano, D.; Simsir, Y.; Navarro, P.; Etxebarria, N.; Usobiaga, A. Evolution of the Cannabinoid and Terpene Content during the Growth of Cannabis sativa Plants from Different Chemotypes. J. Nat. Prod. 2016, 79, 324–331. [Google Scholar] [CrossRef] [PubMed]
  50. Whited, G.M.; Feher, F.J.; Benko, D.A.; Cervin, M.A.; Chotani, G.K.; McAuliffe, J.C.; LaDuca, R.J.; Ben-Shoshan, E.A.; Sanford, K.J. TECHNOLOGY UPDATE: Development of a gas-phase bioprocess for isoprene-monomer production using metabolic pathway engineering. Ind. Biotechnol. 2010, 6, 152–163. [Google Scholar] [CrossRef]
  51. Rude, M.A.; Schirmer, A. New microbial fuels: A biotech perspective. Curr. Opin. Microbiol. 2009, 12, 274–281. [Google Scholar] [CrossRef] [PubMed]
  52. Wille, A.; Zimmermann, P.; Vranová, E.; Fürholz, A.; Laule, O.; Bleuler, S.; Hennig, L.; Prelic, A.; von Rohr, P.; Thiele, L.; et al. Sparse graphical Gaussian modeling of the isoprenoid gene network in Arabidopsis thaliana. Genome Biol. 2004, 5, R92. [Google Scholar] [CrossRef] [Green Version]
  53. Estévez, J.M.; Cantero, A.; Reindl, A.; Reichler, S.; León, P. 1-Deoxy-d-xylulose-5-phosphate Synthase, a Limiting Enzyme for Plastidic Isoprenoid Biosynthesis in Plants*. J. Biol. Chem. 2001, 276, 22901–22909. [Google Scholar] [CrossRef] [PubMed] [Green Version]
  54. Hemmerlin, A.; Harwood, J.L.; Bach, T.J. A raison d’être for two distinct pathways in the early steps of plant isoprenoid biosynthesis? Prog. Lipid Res. 2012, 51, 95–148. [Google Scholar] [CrossRef] [PubMed]
  55. Pechous, S.W.; Whitaker, B.D. Cloning and functional expression of an (E,E)-α-farnesene synthase cDNA from peel tissue of apple fruit. Planta 2004, 219, 84–94. [Google Scholar] [CrossRef] [Green Version]
  56. Baser, K.H.C.; Özek, T.; Konakchiev, A. Enantiomeric Distribution of Linalool, Linalyl Acetate and Camphor in Bulgarian Lavender Oil. J. Essent. Oil Res. 2005, 17, 135–136. [Google Scholar] [CrossRef]
  57. Padrayuttawat, A.; Yoshizawa, T.; Tamura, H.; Tokunaga, T. Optical Isomers and Odor Thresholds of Volatile Constituents in Citrus sudachi. Food Sci. Technol. Int. Tokyo 1997, 3, 402–408. [Google Scholar] [CrossRef] [Green Version]
  58. Jin, J.; Panicker, D.; Wang, Q.; Kim, M.J.; Liu, J.; Yin, J.-L.; Wong, L.; Jang, I.-C.; Chua, N.-H.; Sarojam, R. Next generation sequencing unravels the biosynthetic ability of Spearmint (Mentha spicata) peltate glandular trichomes through comparative transcriptomics. BMC Plant Biol. 2014, 14, 292. [Google Scholar] [CrossRef] [Green Version]
  59. Kim, M.J.; Jin, J.; Zheng, J.; Wong, L.; Chua, N.-H.; Jang, I.-C. Comparative Transcriptomics Unravel Biochemical Specialization of Leaf Tissues of Stevia for Diterpenoid Production. Plant Physiol. 2015, 169, 2462–2480. [Google Scholar] [CrossRef] [Green Version]
  60. Jin, D.; Dai, K.; Xie, Z.; Chen, J. Secondary Metabolites Profiled in Cannabis Inflorescences, Leaves, Stem Barks, and Roots for Medicinal Purposes. Sci. Rep. 2020, 10, 3309. [Google Scholar] [CrossRef] [PubMed]
  61. Bolger, A.M.; Lohse, M.; Usadel, B. Trimmomatic: A flexible trimmer for Illumina sequence data. Bioinformatics 2014, 30, 2114–2120. [Google Scholar] [CrossRef] [PubMed] [Green Version]
  62. Andrews, S. FastQC: A Quality Control Tool for High Throughput Sequence Data. v0.11.9. 2010. Available online: http://www.bioinformatics.babraham.ac.uk/projects/fastqc (accessed on 16 September 2020).
  63. Patro, R.; Duggal, G.; Love, M.I.; Irizarry, R.A.; Kingsford, C. Salmon provides fast and bias-aware quantification of transcript expression. Nat. Methods 2017, 14, 417–419. [Google Scholar] [CrossRef] [PubMed] [Green Version]
  64. Soneson, C.; Love, M.I.; Robinson, M.D. Differential analyses for RNA-seq: Transcript-level estimates improve gene-level inferences. F1000Research 2015, 4, 1521. [Google Scholar] [CrossRef] [PubMed]
  65. Robinson, M.D.; Oshlack, A. A scaling normalization method for differential expression analysis of RNA-seq data. Genome Biol. 2010, 11, R25. [Google Scholar] [CrossRef] [PubMed] [Green Version]
  66. Tarazona, S.; Furió-Tarí, P.; Turrà, D.; Pietro, A.D.; Nueda, M.J.; Ferrer, A.; Conesa, A. Data quality aware analysis of differential expression in RNA-seq with NOISeq R/Bioc package. Nucleic Acids Res. 2015, 43, e140. [Google Scholar] [CrossRef] [PubMed] [Green Version]
  67. Heberle, H.; Meirelles, G.V.; da Silva, F.R.; Telles, G.P.; Minghim, R. InteractiVenn: A web-based tool for the analysis of sets through Venn diagrams. BMC Bioinform. 2015, 16, 169. [Google Scholar] [CrossRef] [PubMed]
  68. Götz, S.; García-Gómez, J.M.; Terol, J.; Williams, T.D.; Nagaraj, S.H.; Nueda, M.J.; Robles, M.; Talón, M.; Dopazo, J.; Conesa, A. High-throughput functional annotation and data mining with the Blast2GO suite. Nucleic Acids Res. 2008, 36, 3420–3435. [Google Scholar] [CrossRef] [PubMed]
  69. Walker, N.J. A Technique Whose Time Has Come. Science 2002, 296, 557. [Google Scholar] [CrossRef] [PubMed]
  70. Kumar, S.; Stecher, G.; Tamura, K. MEGA7: Molecular Evolutionary Genetics Analysis Version 7.0 for Bigger Datasets. Mol. Biol. Evol. 2016, 33, 1870–1874. [Google Scholar] [CrossRef] [PubMed] [Green Version]
  71. Zhang, X.; Garreton, V.; Chua, N.-H. The AIP2 E3 ligase acts as a novel negative regulator of ABA signaling by promoting ABI3 degradation. Genes Dev. 2005, 19, 1532–1543. [Google Scholar] [CrossRef] [PubMed] [Green Version]
  72. Höfgen, R.; Willmitzer, L. Storage of competent cells for Agrobacterium transformation. Nucleic Acids Res. 1988, 16, 9877. [Google Scholar] [CrossRef] [PubMed] [Green Version]
Figure 1. Quality assessment and differential analysis of gene expression data. (a) Picture of Cannabis cultivars selected for investigation. (b) Score plot of trichome and stem samples according to the first and second components (PC 1 and PC 2) obtained from a principal component analysis. (c) Plot of average gene expression values for the trichomes of five cultivars versus the corresponding expression in the stem tissue of HB. (d) M-D plot of global gene expression data. (M-value: log2 FC value; D-value: absolute-difference-in-expression value). Red dots in (c,d) denote genes that are differentially expressed. HB: Headband; CD: Chem Dawg; GT: Ghost OG × NBK; TH: Tahoe OG × NBK; WS: Westside OG.
Ijms 23 08310 g001
Figure 2. Transcriptional regulation of central metabolism in the trichomes of Cannabis cultivars with respect to stem tissue. (a) M-D plot of mean expression values (TMM) of genes encoding enzymes involved in the central metabolism (the glycolytic pathway, pyruvate metabolism, the pentose phosphate pathway, and the tricarboxylic acid cycle). Filled orange circles denote differentially up-regulated genes of interest, while filled blue circles represent all other genes in the central metabolism. It should be noted that PEPC is significantly down-regulated. (b) Pathway diagram of the central metabolism with corresponding enzyme names marked in red/orange. Note that ICL had very low expression. (c) Similar diagram for NAD(P)H replenishment pathway. Refer to Table S8 for corresponding gene IDs of enzymes. Enzyme abbreviations in numeric and alphabetical order: ACAT1 (acetyl-CoA acetyltransferase cytosolic 1); ALDH2C4 (aldehyde dehydrogenase family 2 member C4, NADH producing [-like]); ALDH3F1 (aldehyde dehydrogenase family 3 member F1, NADH producing); ALDO6 (fructose-bisphosphate aldolase 6, cytosolic); ALDO5 (fructose-bisphosphate aldolase 5, cytosolic); CS (ATP-citrate synthase); GAPDH (glyceraldehyde-3-phosphate dehydrogenase); GAPN (NADP-dependent glyceraldehyde-3-phosphate dehydrogenase); GPI-like (glucose-6-phosphate isomerase, chloroplastic-like); ICL (isocitrate lyase); ME (NADP+) (NADP-dependent malic enzyme); MS (malate synthase, glyoxysomal); PDC1-like (pyruvate decarboxylase 1-like); PDH (pyruvate dehydrogenase, chloroplastic); PEP (phosphoenolpyruvate carboxylase, housekeeping isozyme); PGK (phosphoglycerate kinase); PK (pyruvate kinase, cytosolic); PK2 (plastidial pyruvate kinase 2). Metabolite abbreviations in numeric and alphabetical order: 3PG (3-phosphoglyceric acid); AcCoA (Acetyl co-enzyme A); AcAcCoA (Acetoacetyl CoA); AcDH (Acetaldehyde); Acet (acetate); ADP (adenosine diphosphate); ATP (adenosine triphosphate); citrate (Cit); CoA (coenzyme A); DXP (1-deoxy-d-xylulose 5-phosphate); F6p (fructose-6-phosphate); Fbp (Fructose bisphosphatase); G3P (glyceraldehyde-3-phosphate); G6p (Glucose-6-phosphate); Glc (glucose); Glyo (glyolate); iCit (isocitrate); Mal (S-malate); NAD+ (Nicotinamide adenine dinucleotide); NADH (reduced NAD); NADP+ (NAD phosphate); NADPH (reduced NAD phosphate); OAA (oxaloacetate); PEP (phosphoenolpyruvate); Pyr (pyruvate).
Ijms 23 08310 g002
Figure 3. Distinct mode of transcriptional regulation for secondary metabolite biosynthetic pathways. (a) M-D plot of DEGs (trichomes versus stem tissue) in the MEP, MVA, hexanoate, and cannabinoid pathways, with corresponding enzyme names being similarly color-coded in the pathway schematic on the left. The numbers inside brackets indicate the numbers of DEGs. Note that the black arrow in the M-D plot illustrates the increasing gene regulation at the end of the MEP pathway. (b) Similar M-D plot and corresponding enzyme names in the context of the terpene biosynthetic pathways. Refer to Table S8 for corresponding gene IDs of enzymes. Enzyme abbreviations for MEP pathway (left to right): DXS (DOXP synthase); DXR (DXP reductoisomerase); CMS (2-C-methyl-d-erythritol 4-phosphate cytidylyltransferase); CMK (4-diphosphocytidyl-2-C-methyl-d-erythritol kinase); MCS (2-C-methyl-d-erythritol 2,4-cyclodiphosphate synthase); HDS (HMB-PP synthase); HDR (HMB-PP reductase), MVA pathway (left to right): ACAT (acetyl-coenzyme A acetyltransferase); HMGS (HMG-CoA synthase); HMGR (HMG-CoA reductase); MK (mevalonate-5-kinase); PMK (phosphomevalonate kinase); MVD (mevalonate-5-pyrophosphate decarboxylase); IPPI (isopentenyl diphosphate isomerase); GPPS (GPP synthase), Hexanoate pathway (left to right): FAD (fatty acid desaturase); LOX (lipoxygenase); HPL (hydroperoxide lyase); ALDH (aldehyde dehydrogenase); AAE (acyl activating enzyme); PKS (polyketide synthase); OAC (olivetolic acid cyclase), Cannabinoid pathway: APT (aromatic prenyl transferase); THCAS (THCA synthase); CBDAS (CBDA synthase), Terpene pathway (top to bottom): MYS (myrcene synthase); LS (limonene synthase); FPPS (Farnesyl diphosphate synthase); αHS (α-humulene synthase); NES1 (nerolidol synthase); GAS (Germacrene A synthase); GGPPS (geranylgeranyl diphosphate synthase). Metabolite abbreviations in numeric and alphabetical order: AcCoA (Acetyl co-enzyme A); AcAcCoA (Acetoacetyl CoA); ADP (adenosine diphosphate); ATP (adenosine triphosphate); CBDA (cannabidiolic acid); CBGA (cannabigerolic acid); CDP-ME (4-diphosphocytidyl-2-C-methylerythritol); CDP-MEP (4-diphosphocytidyl-2-C-methyl-d-erythritol 2-phosphate); CoA (coenzyme A); DMAP (Dimethylallyl pyrophosphate); DXOP (deoxyxylulose 5-phosphate); FA (fatty acids); Fdox (oxidized ferredoxin); Fdred- (reduced ferredoxin); FPP (Farnesyl diphosphate); G3P (glyceraldehyde-3-phosphate); GGPP (geranylgeranyl diphosphate); GPP (geranyl diphosphate); Hex-CoA (hexanoyl-CoA); HMB-PP ([E]-4-Hydroxy-3-methyl-but-2-enyl pyrophosphate); HMG-CoA (3-hydroxy-3-methylglutaryl-CoA); IPP (isopentenyl diphosphate); MEcPP (2-C-methyl-d-erythritol 2,4-cyclodiphosphate); MEP (2-C-methyl-d-erythritol 4-phosphate); MVA (mevalonate); MVA-5p (mevalonate-5-phosphate); MVA-5p (mevalonate-5-diphosphate); NADP+ (Nicotinamide adenine dinucleotide phosphate); NADPH (reduced nicotinamide adenine dinucleotide phosphate); OA (olivetolic acid); Pyr (pyruvate); TOD-CoA (trans octadecenoyl CoA); THCA (tetrahydrocannabinolic acid).
Ijms 23 08310 g003
Figure 4. Biosynthetic profiles of Cannabis cultivars. (a) Cultivar-normalized expression heatmap of significantly regulated genes encoding metabolic enzymes involved in cannabinoid and terpene biosynthesis. The heatmap is based on the total expression values of genes that encode enzymes with the same products. The total gene expression values (TMM as units) are also given in each cell. Note that ALDH is associated with both NAD(P)H compensation and the hexanoate pathway. (b) Similar heatmap for key TPSs, including those shortlisted for functional validation. For the full names for all enzymes and metabolites, refer to Figure 1 and Figure 2. Refer to Table S8 for the gene IDs involved.
Ijms 23 08310 g004
Figure 5. Phylogenetic analysis of CsTPSs. Neighbour-joining phylogenetic tree of CsTPS3GT, CsTPS4WS, and CsTPS5TH, with other CsTPSs. The scale bar indicates the number of amino acid substitutions per site.
Ijms 23 08310 g005
Figure 6. Subcellular localization of CsTPSs in N. benthamiana leaf cells. A. tumefaciens harbouring YFP-tagged CsTPS was infiltrated into N. benthamiana leaves. Then, the infiltrated leaves were visualized using a confocal microscope (2 dpi). Auto: chlorophyll autofluorescence; YFP: YFP channel image; Bright field: light microscope image; Merge: merged image between autofluorescence, YFP, and light channel. Scale bars: 20 μm.
Ijms 23 08310 g006
Figure 7. Functional characterization of CsTPSs. In vitro (ad) and in vivo (eg) characterization of CsTPS3GT, CsTPS4WS, and CsTPS5TH. The products were confirmed by comparison of retention times and mass spectra with those of standards (Figure S7). TIC: total ion chromatogram; EIC: extracted ion chromatogram; RT: retention time.
Ijms 23 08310 g007
Table 1. RNA-seq read statistics.
TissueCultivarRaw Reads (mil)Reads after QC (mil)Mapped Reads (mil)% Raw Reads after QC% Raw Reads after Further Mapping
StemHB24822820092%88%
TrichomeCD27326122796%87%
TrichomeGT25624921597%86%
TrichomeHB26025121597%86%
TrichomeTH27326222996%87%
TrichomeWS27726723596%88%
Publisher’s Note: MDPI stays neutral with regard to jurisdictional claims in published maps and institutional affiliations.

