
Comparative Transcriptome Analysis Identified Key Pathways and Genes Regulating Differentiated Stigma Color in Melon (Cucumis melo L.)

 , ,
, ,
Abstract
:1. Introduction
2. Results
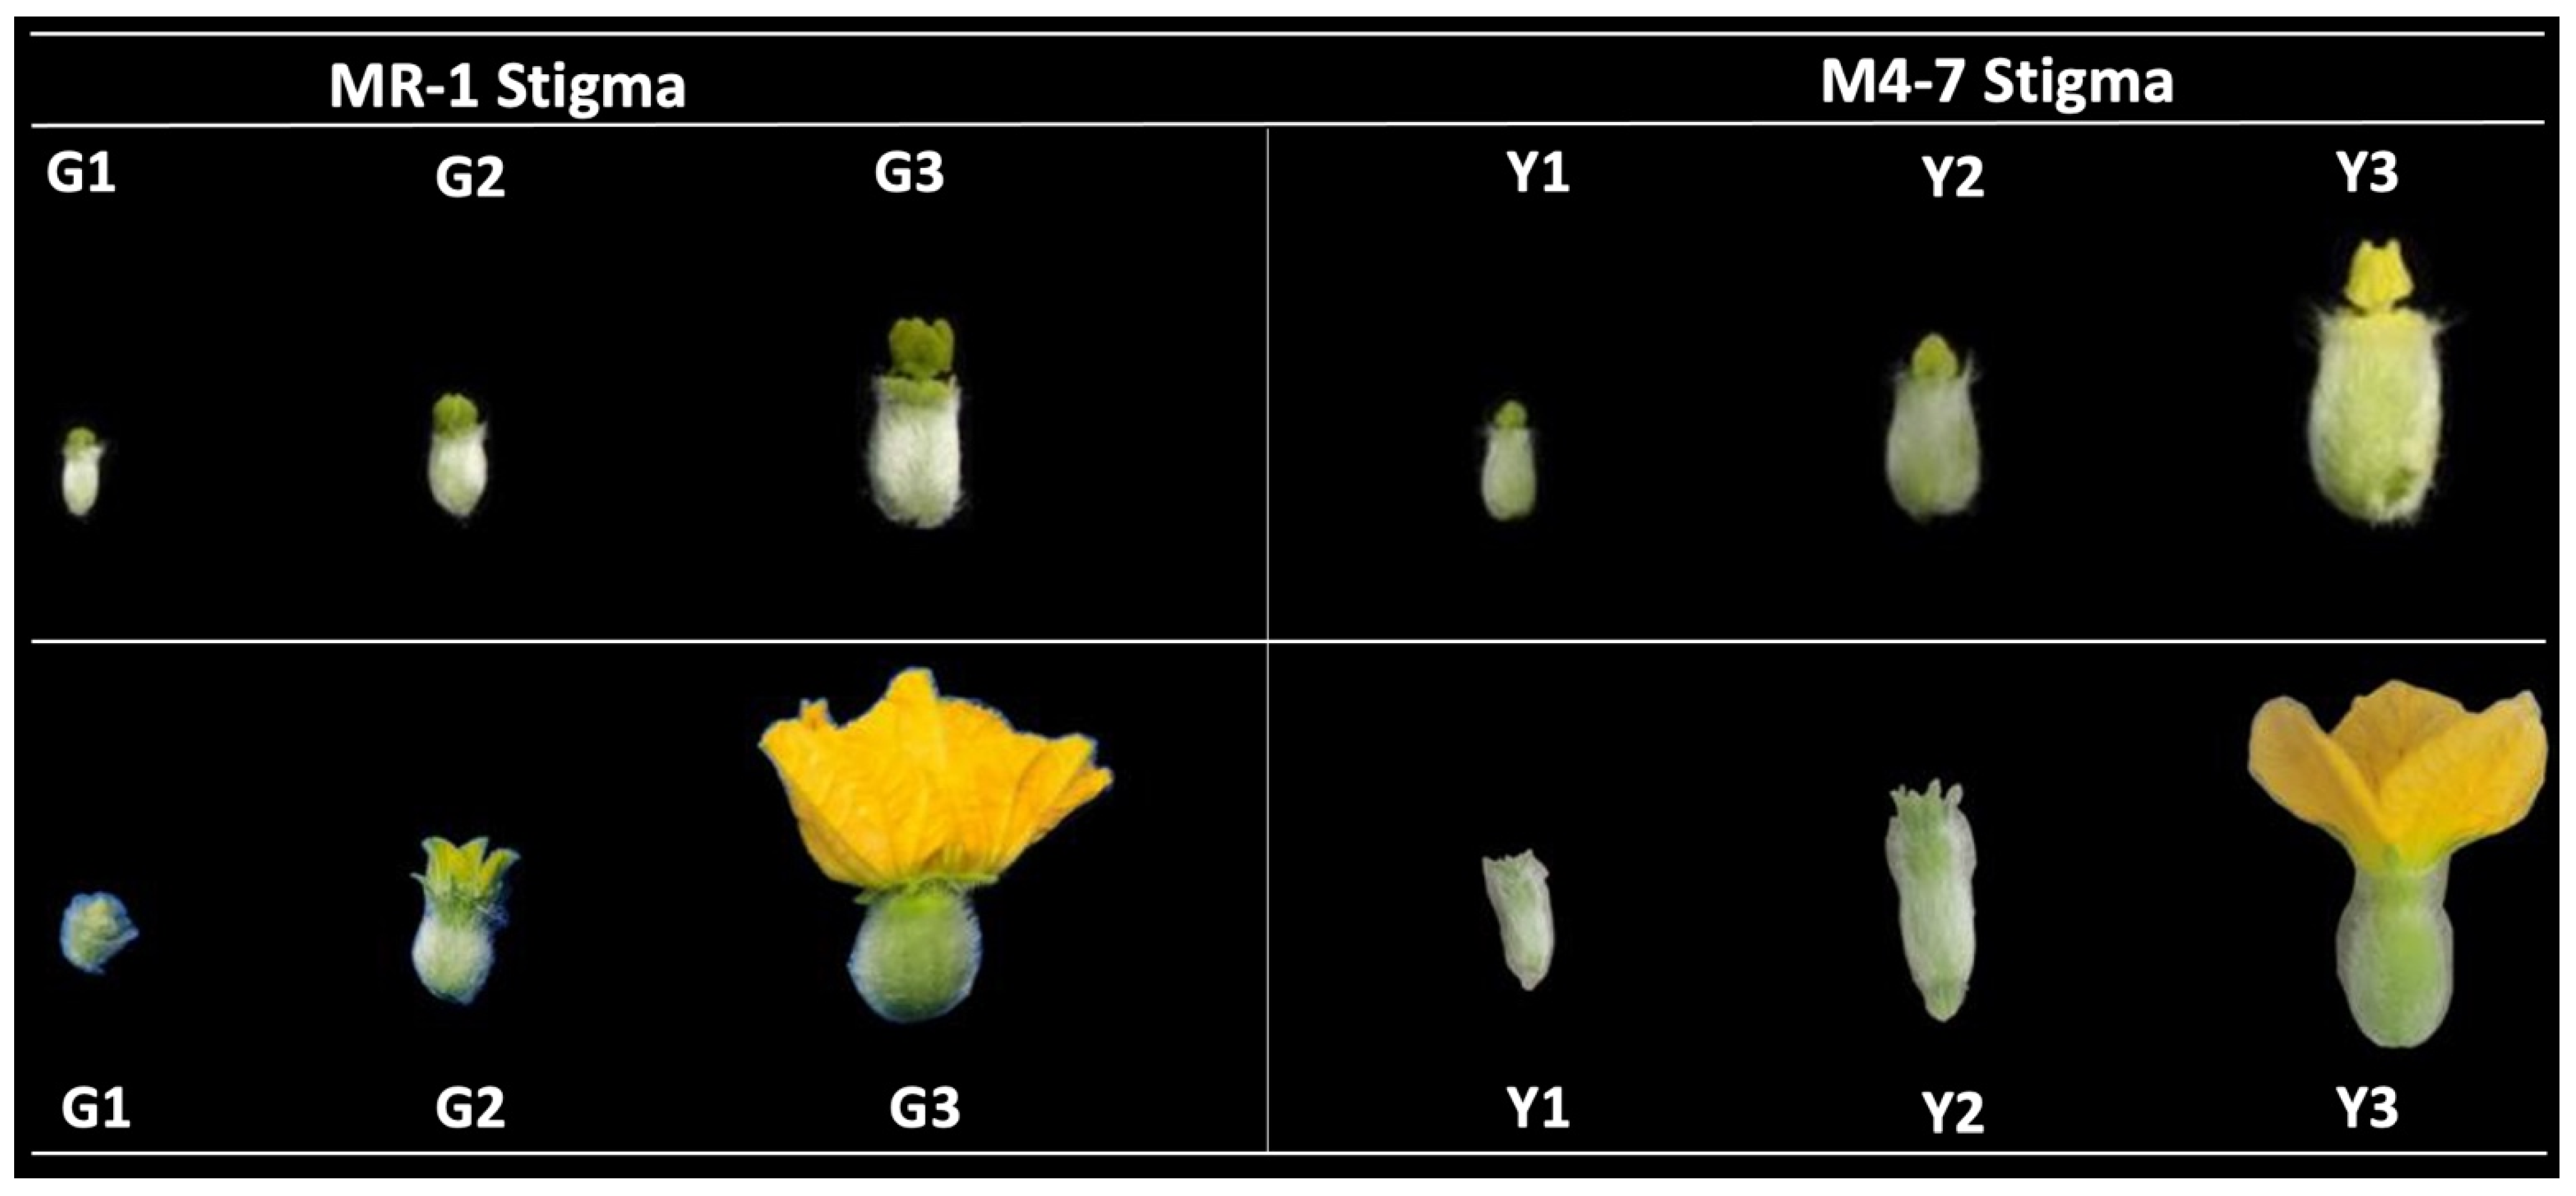
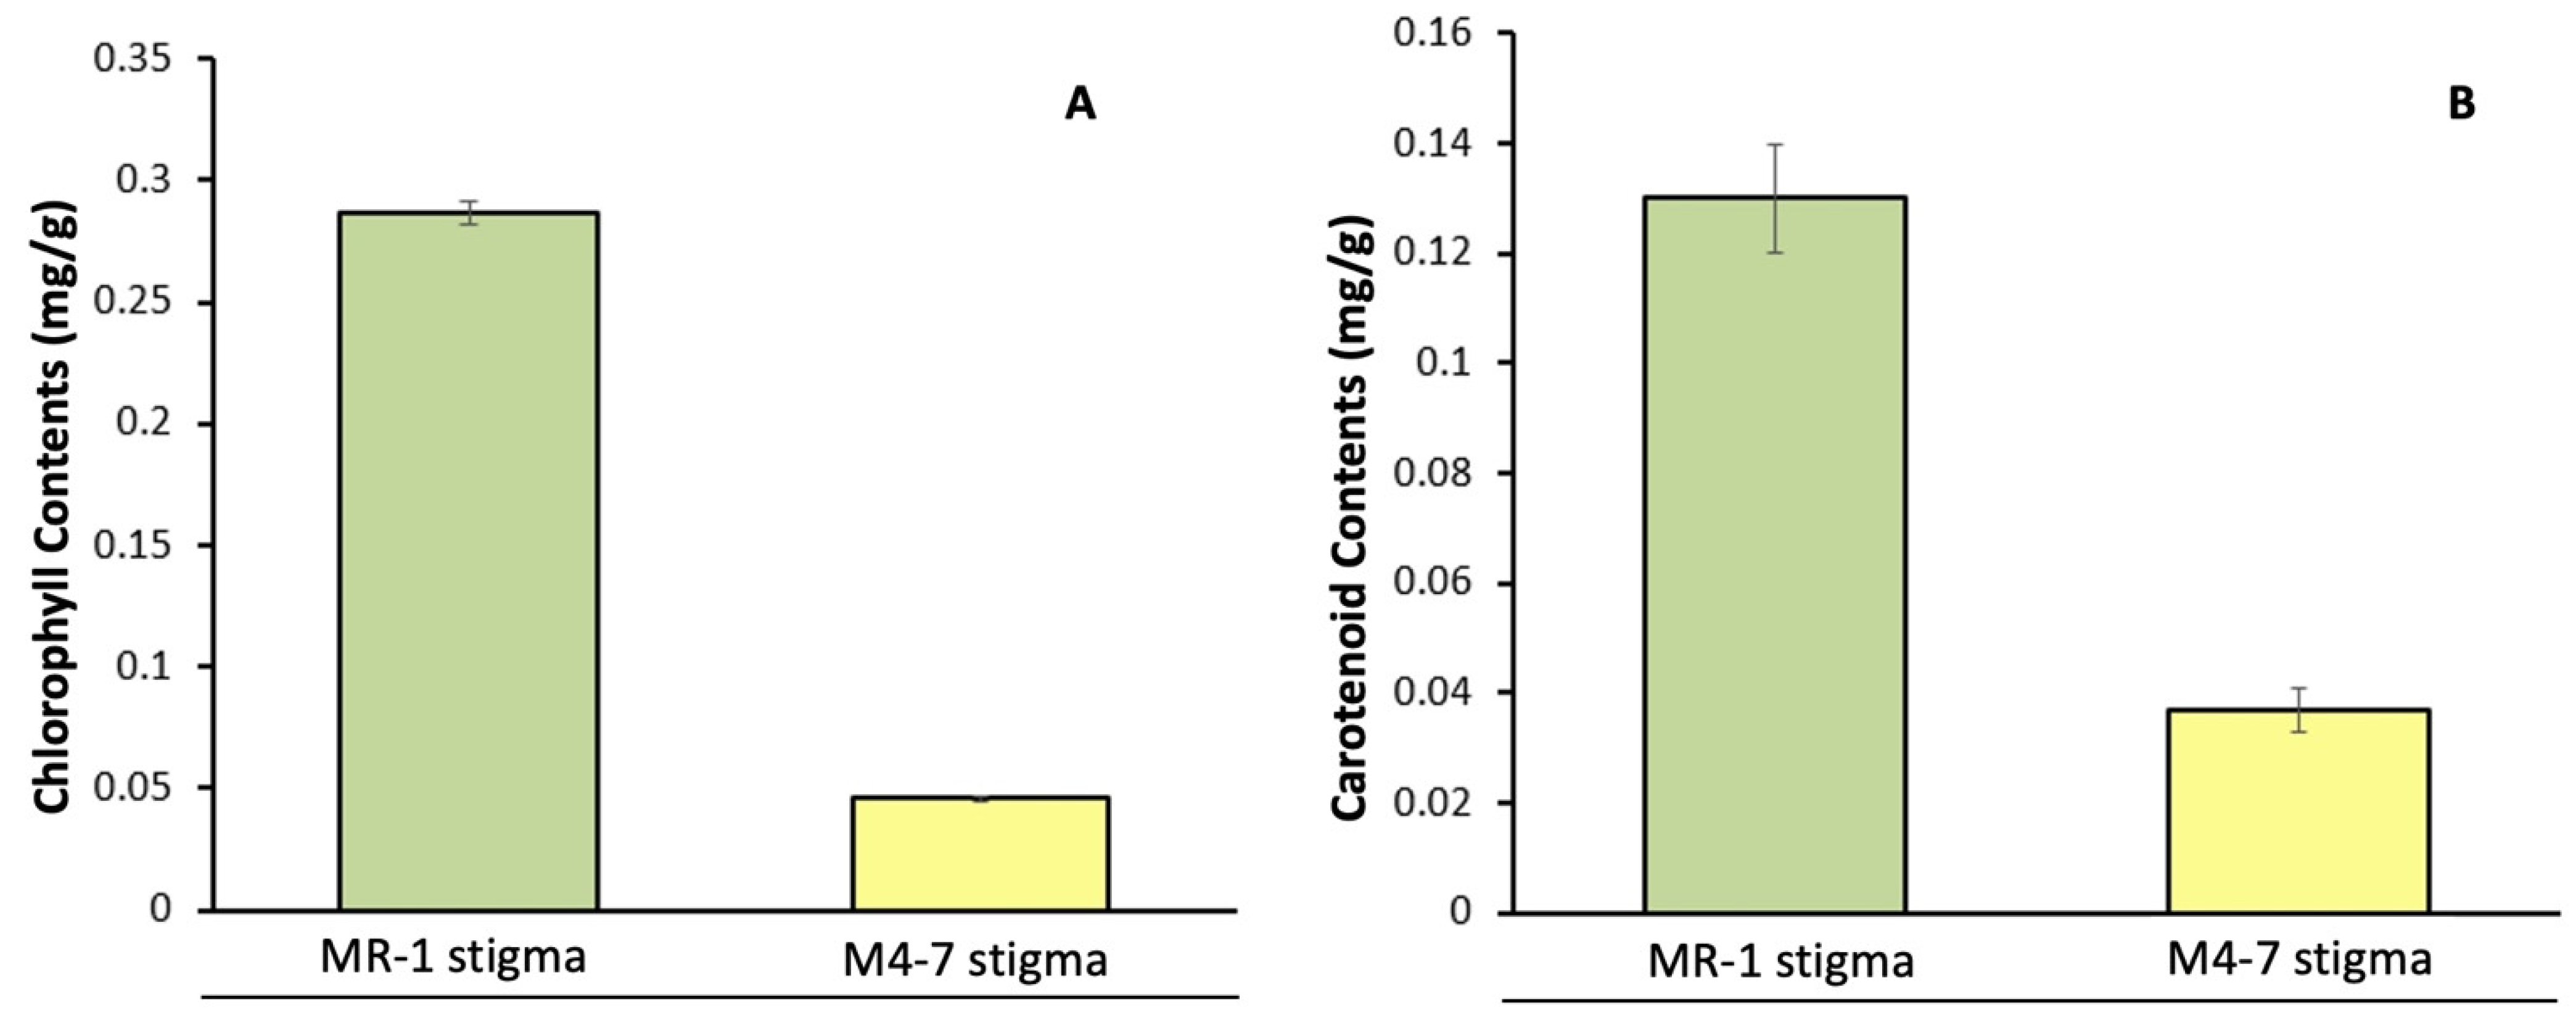
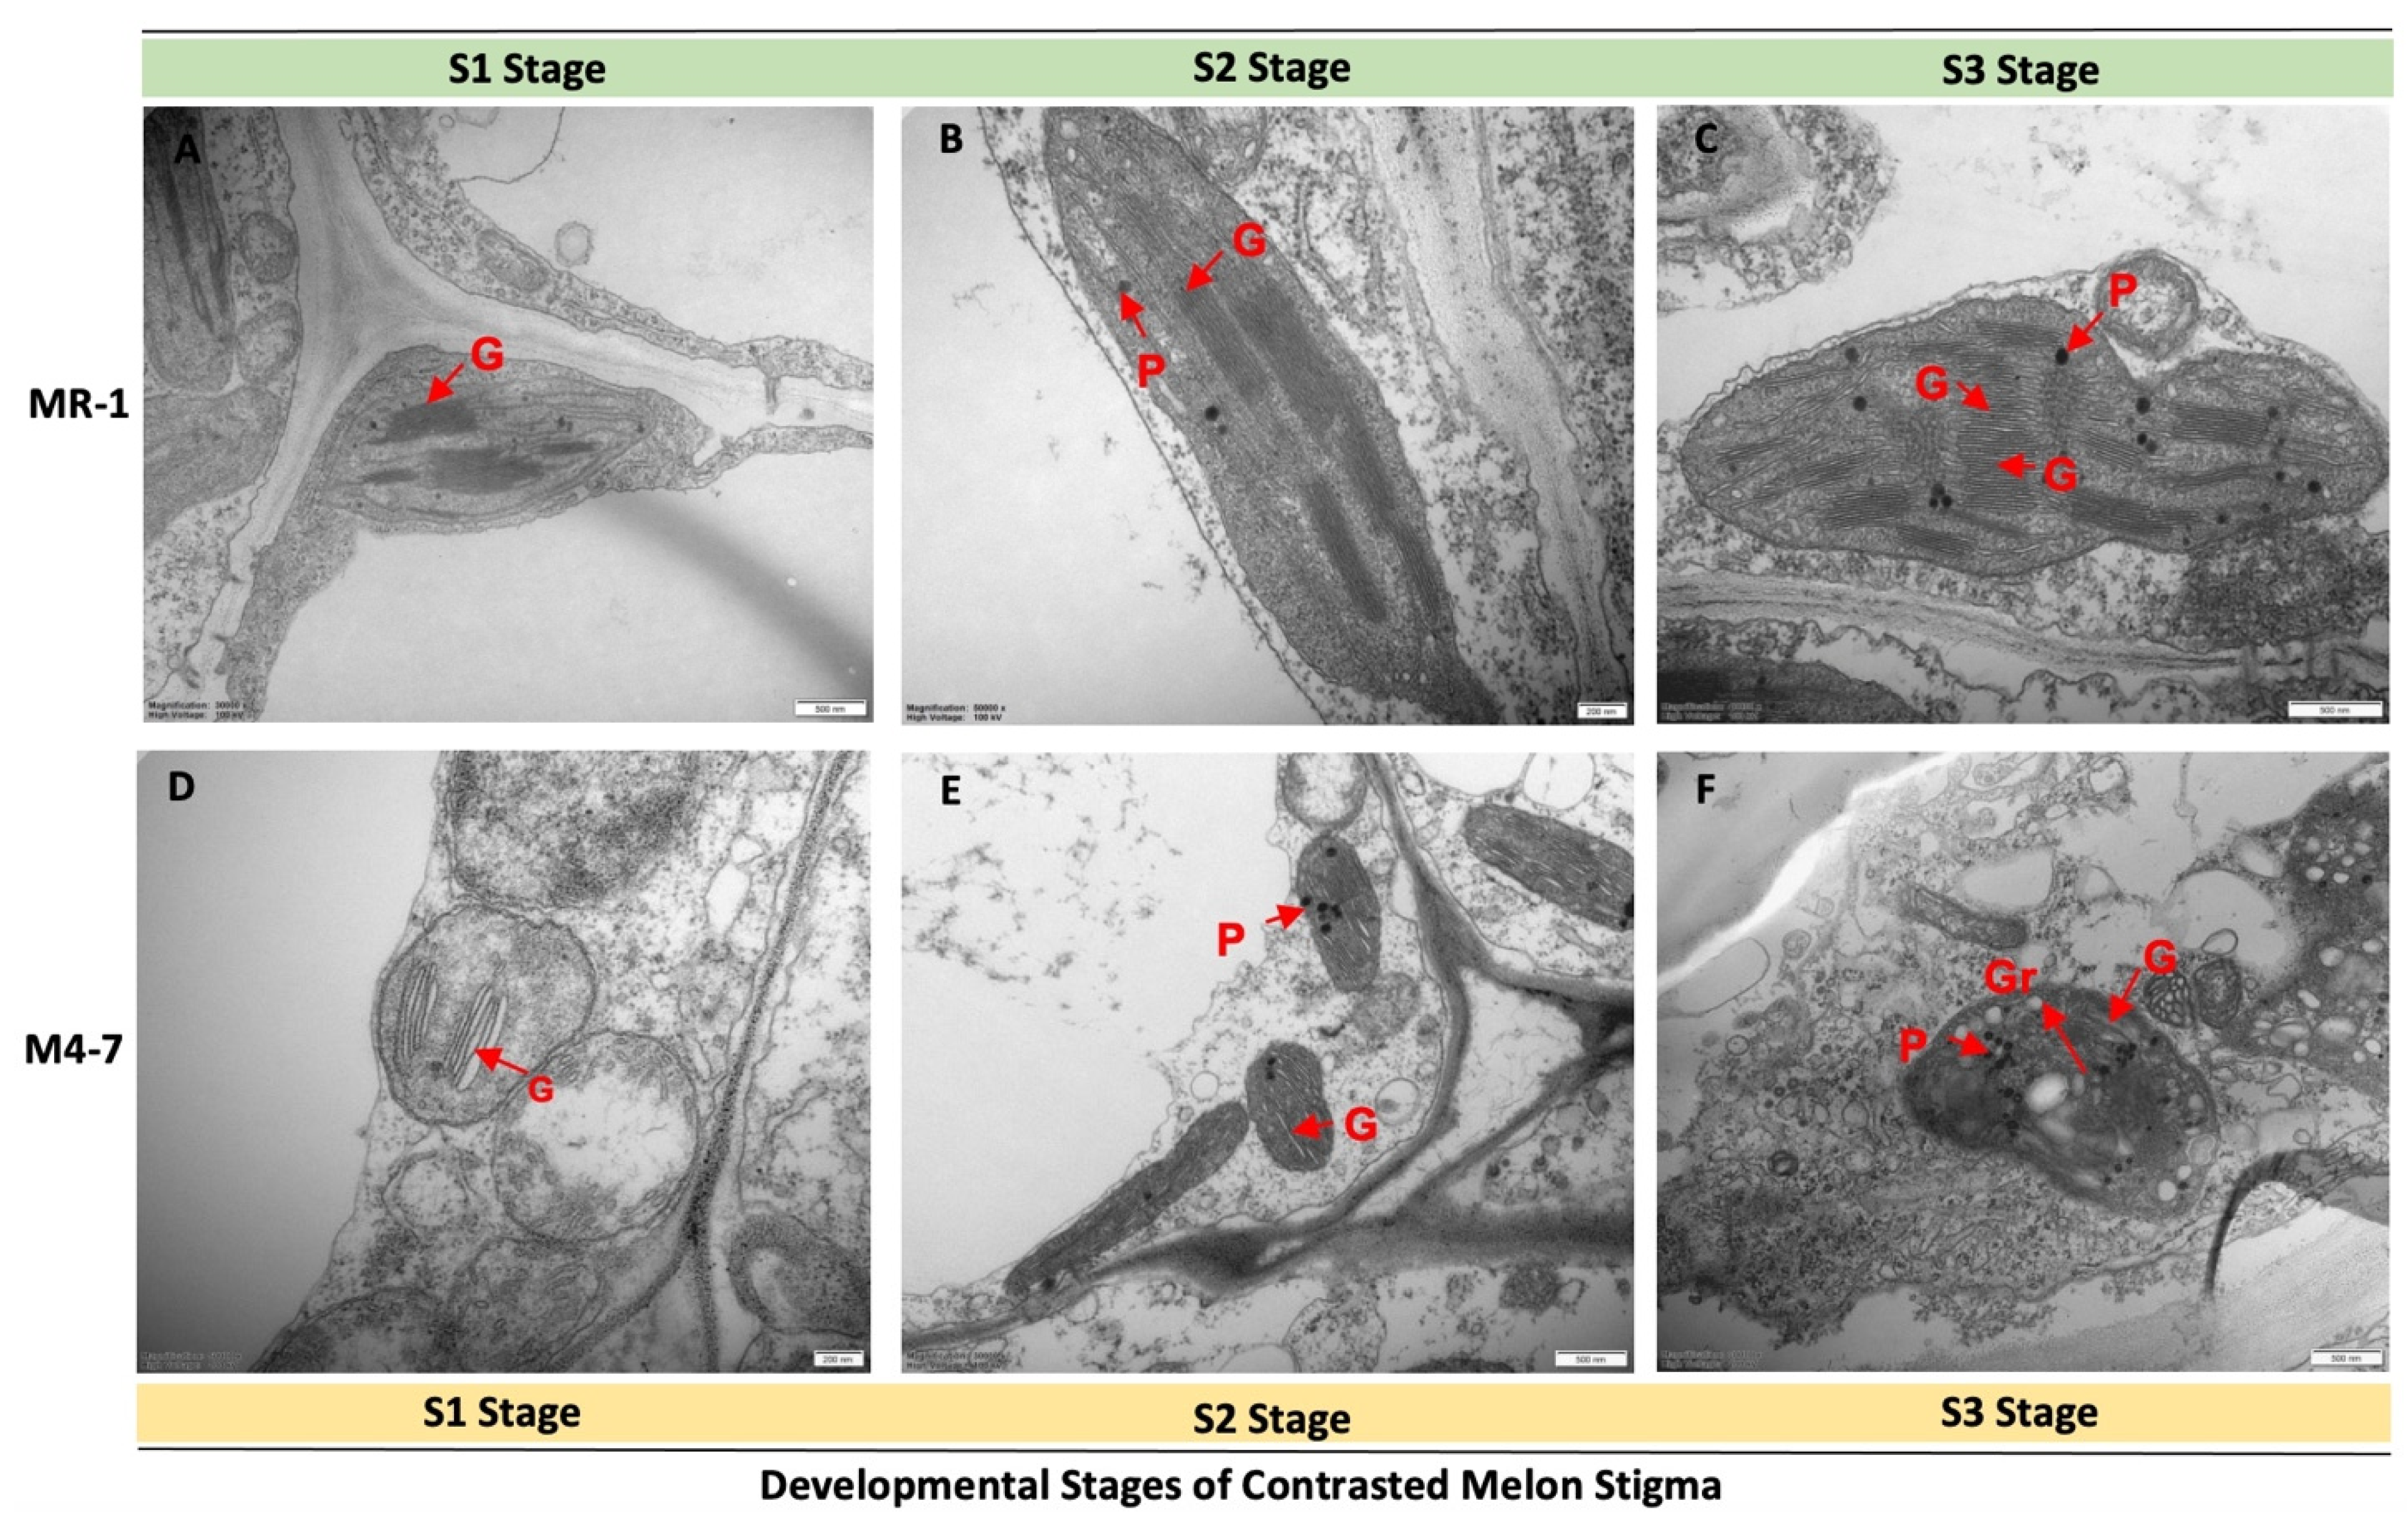
2.1. Pigment Content and the Structural Basis of the Stigma
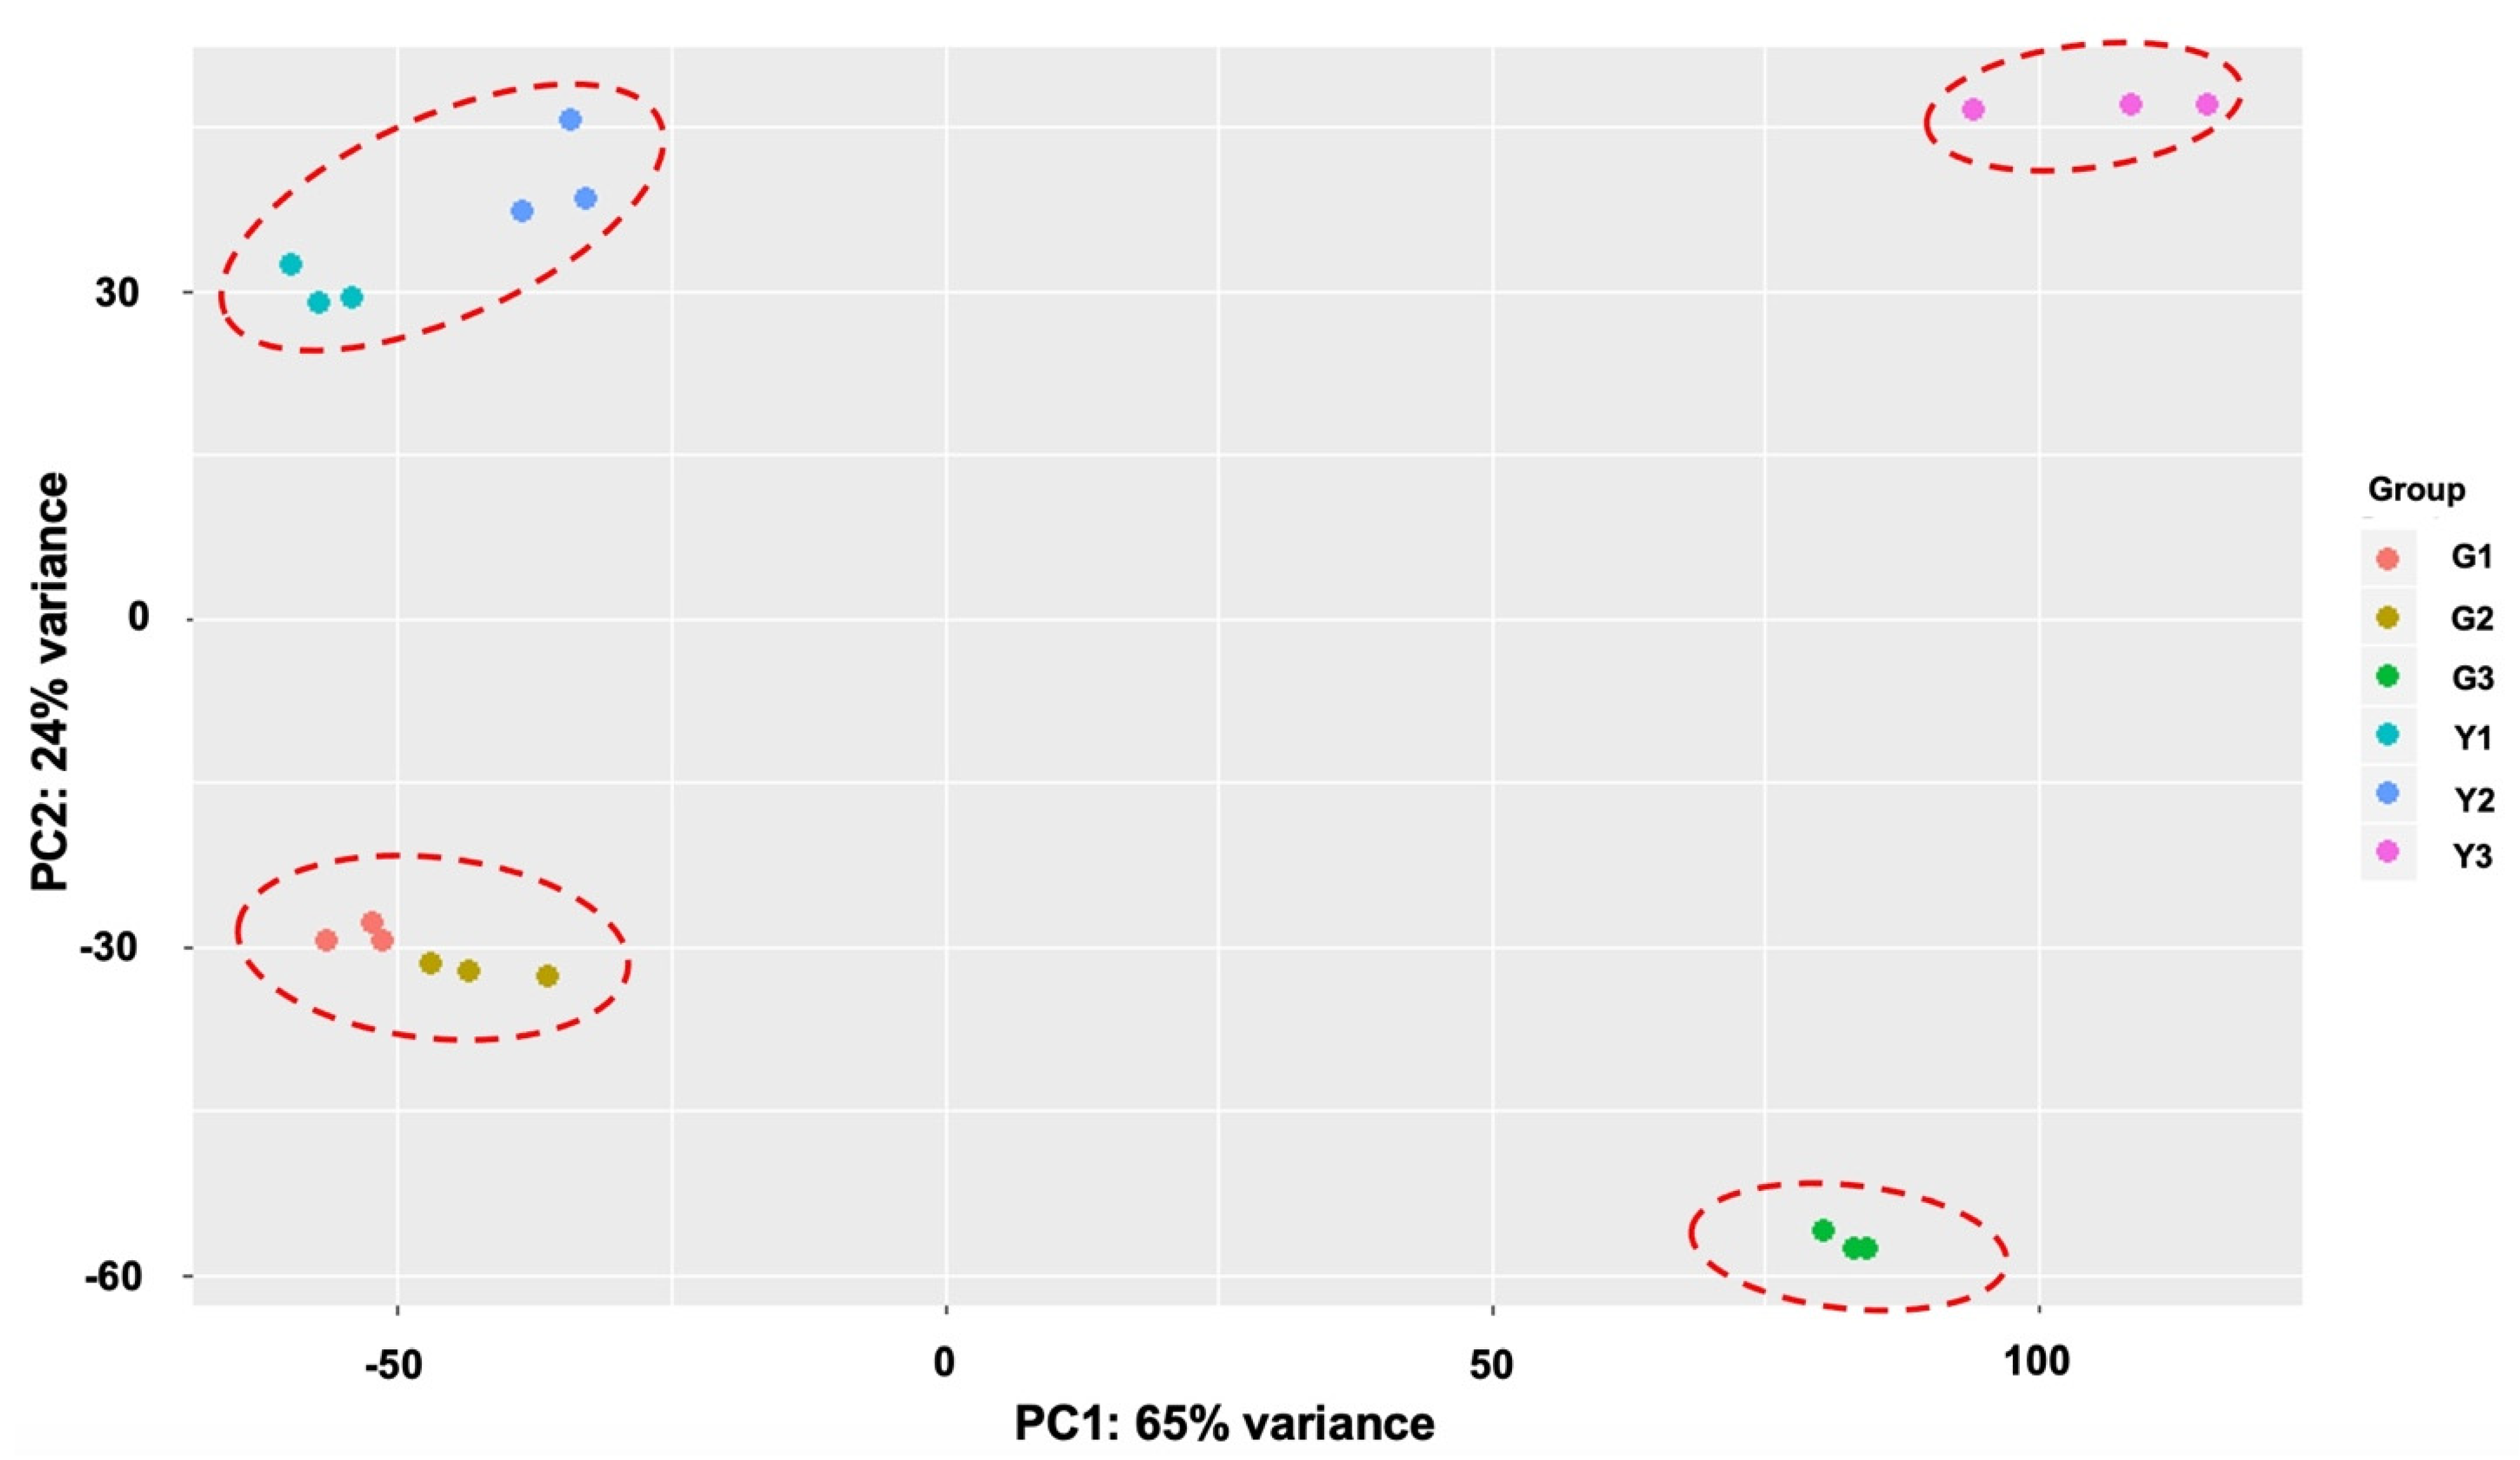
2.2. Overview of Transcriptomic Data
2.3. Identification of DEGs during Stigma Development Stages
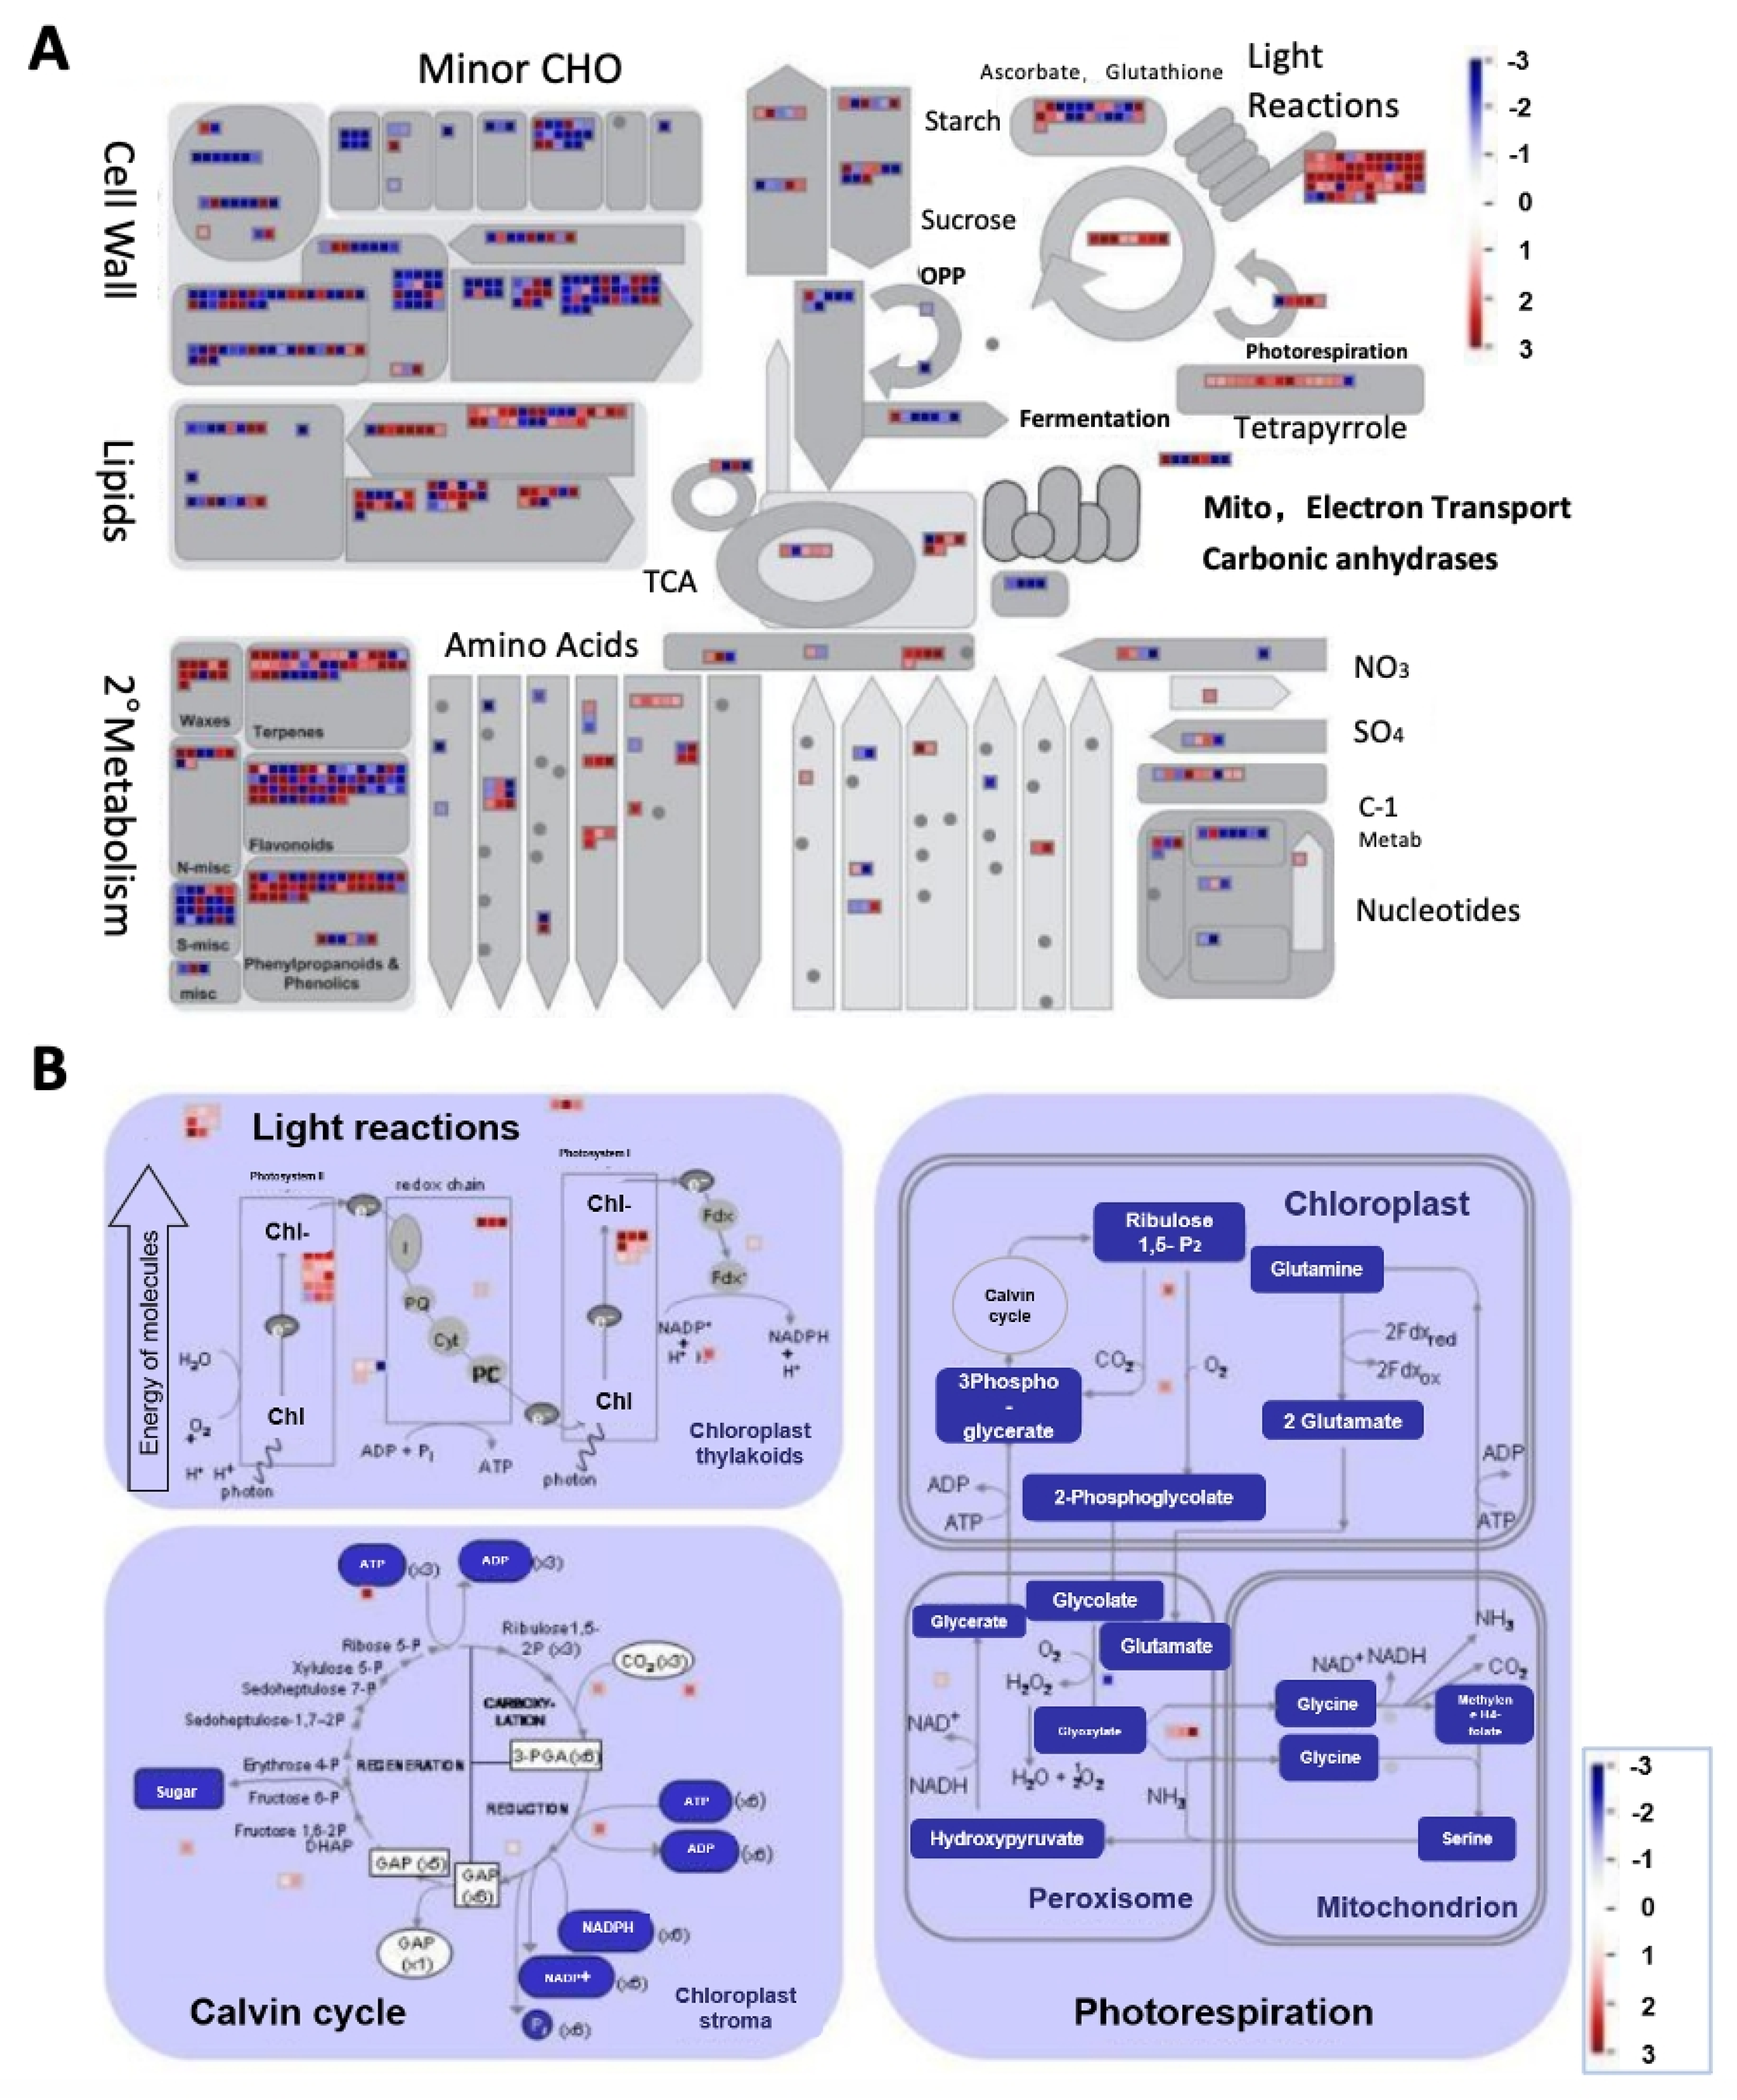
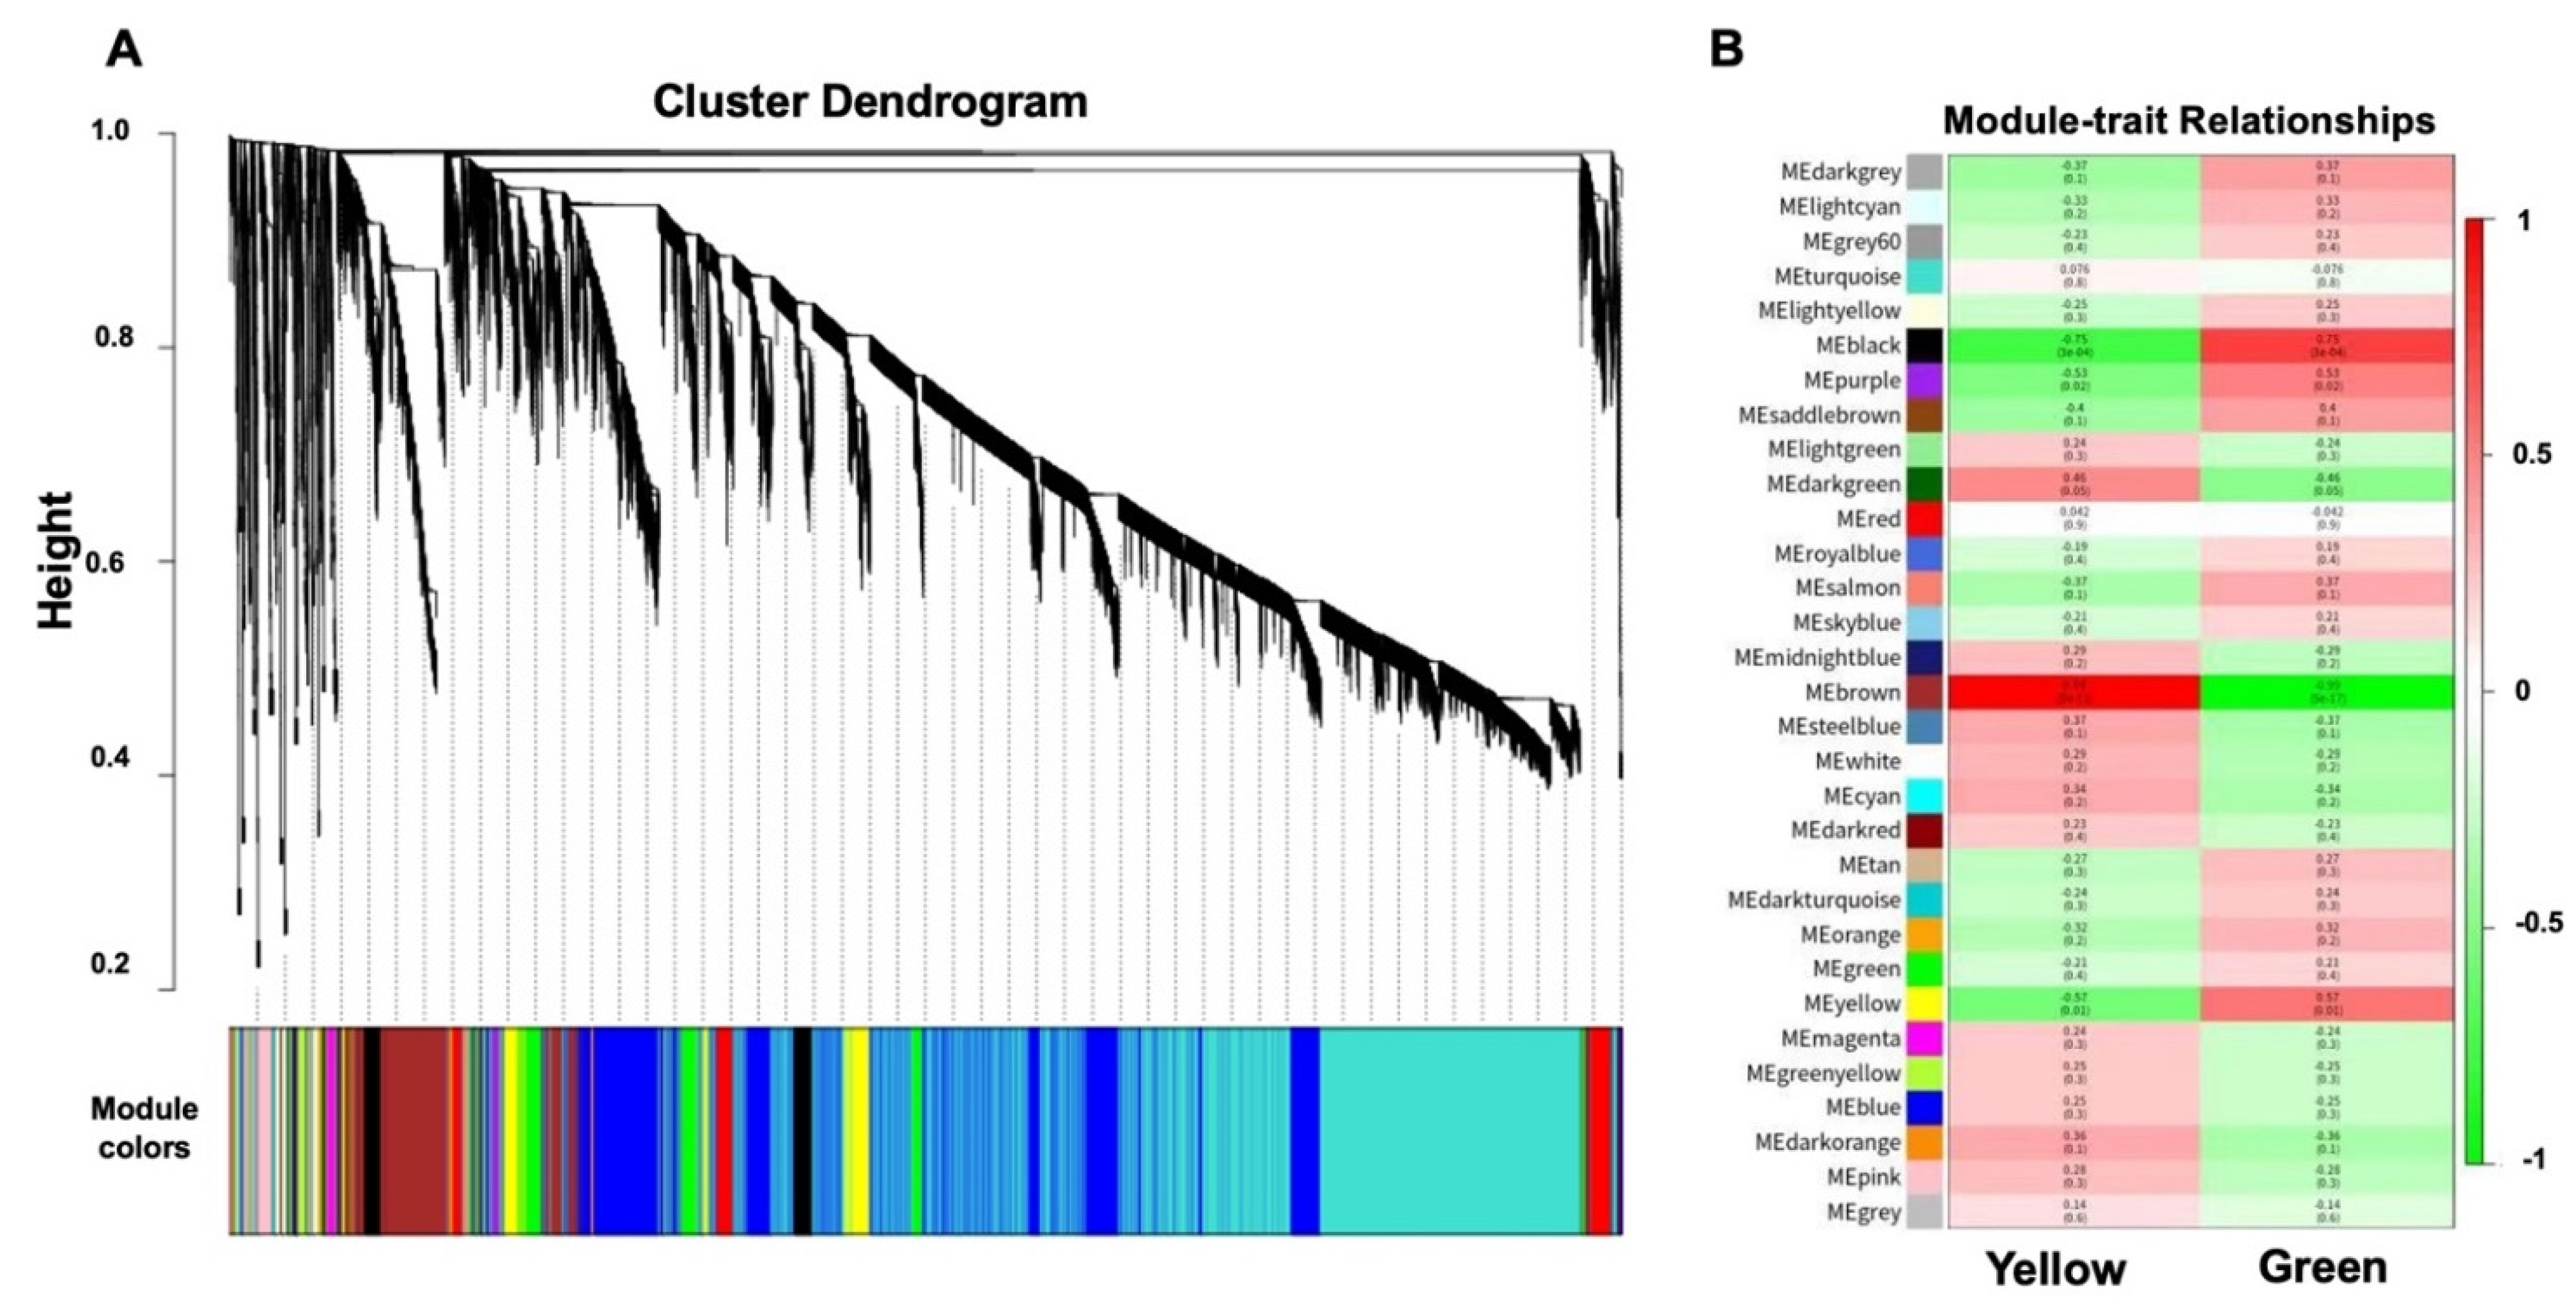
2.4. Identification of WGCNA Modules Associated with Photosynthetic Reactions
3. Discussion
3.1. Differences in Chloroplast Development of the Contrasted Melon Lines (MR-1 and M4-7)
3.2. A Complex Regulatory Network Exists for Melon Stigma Color Development
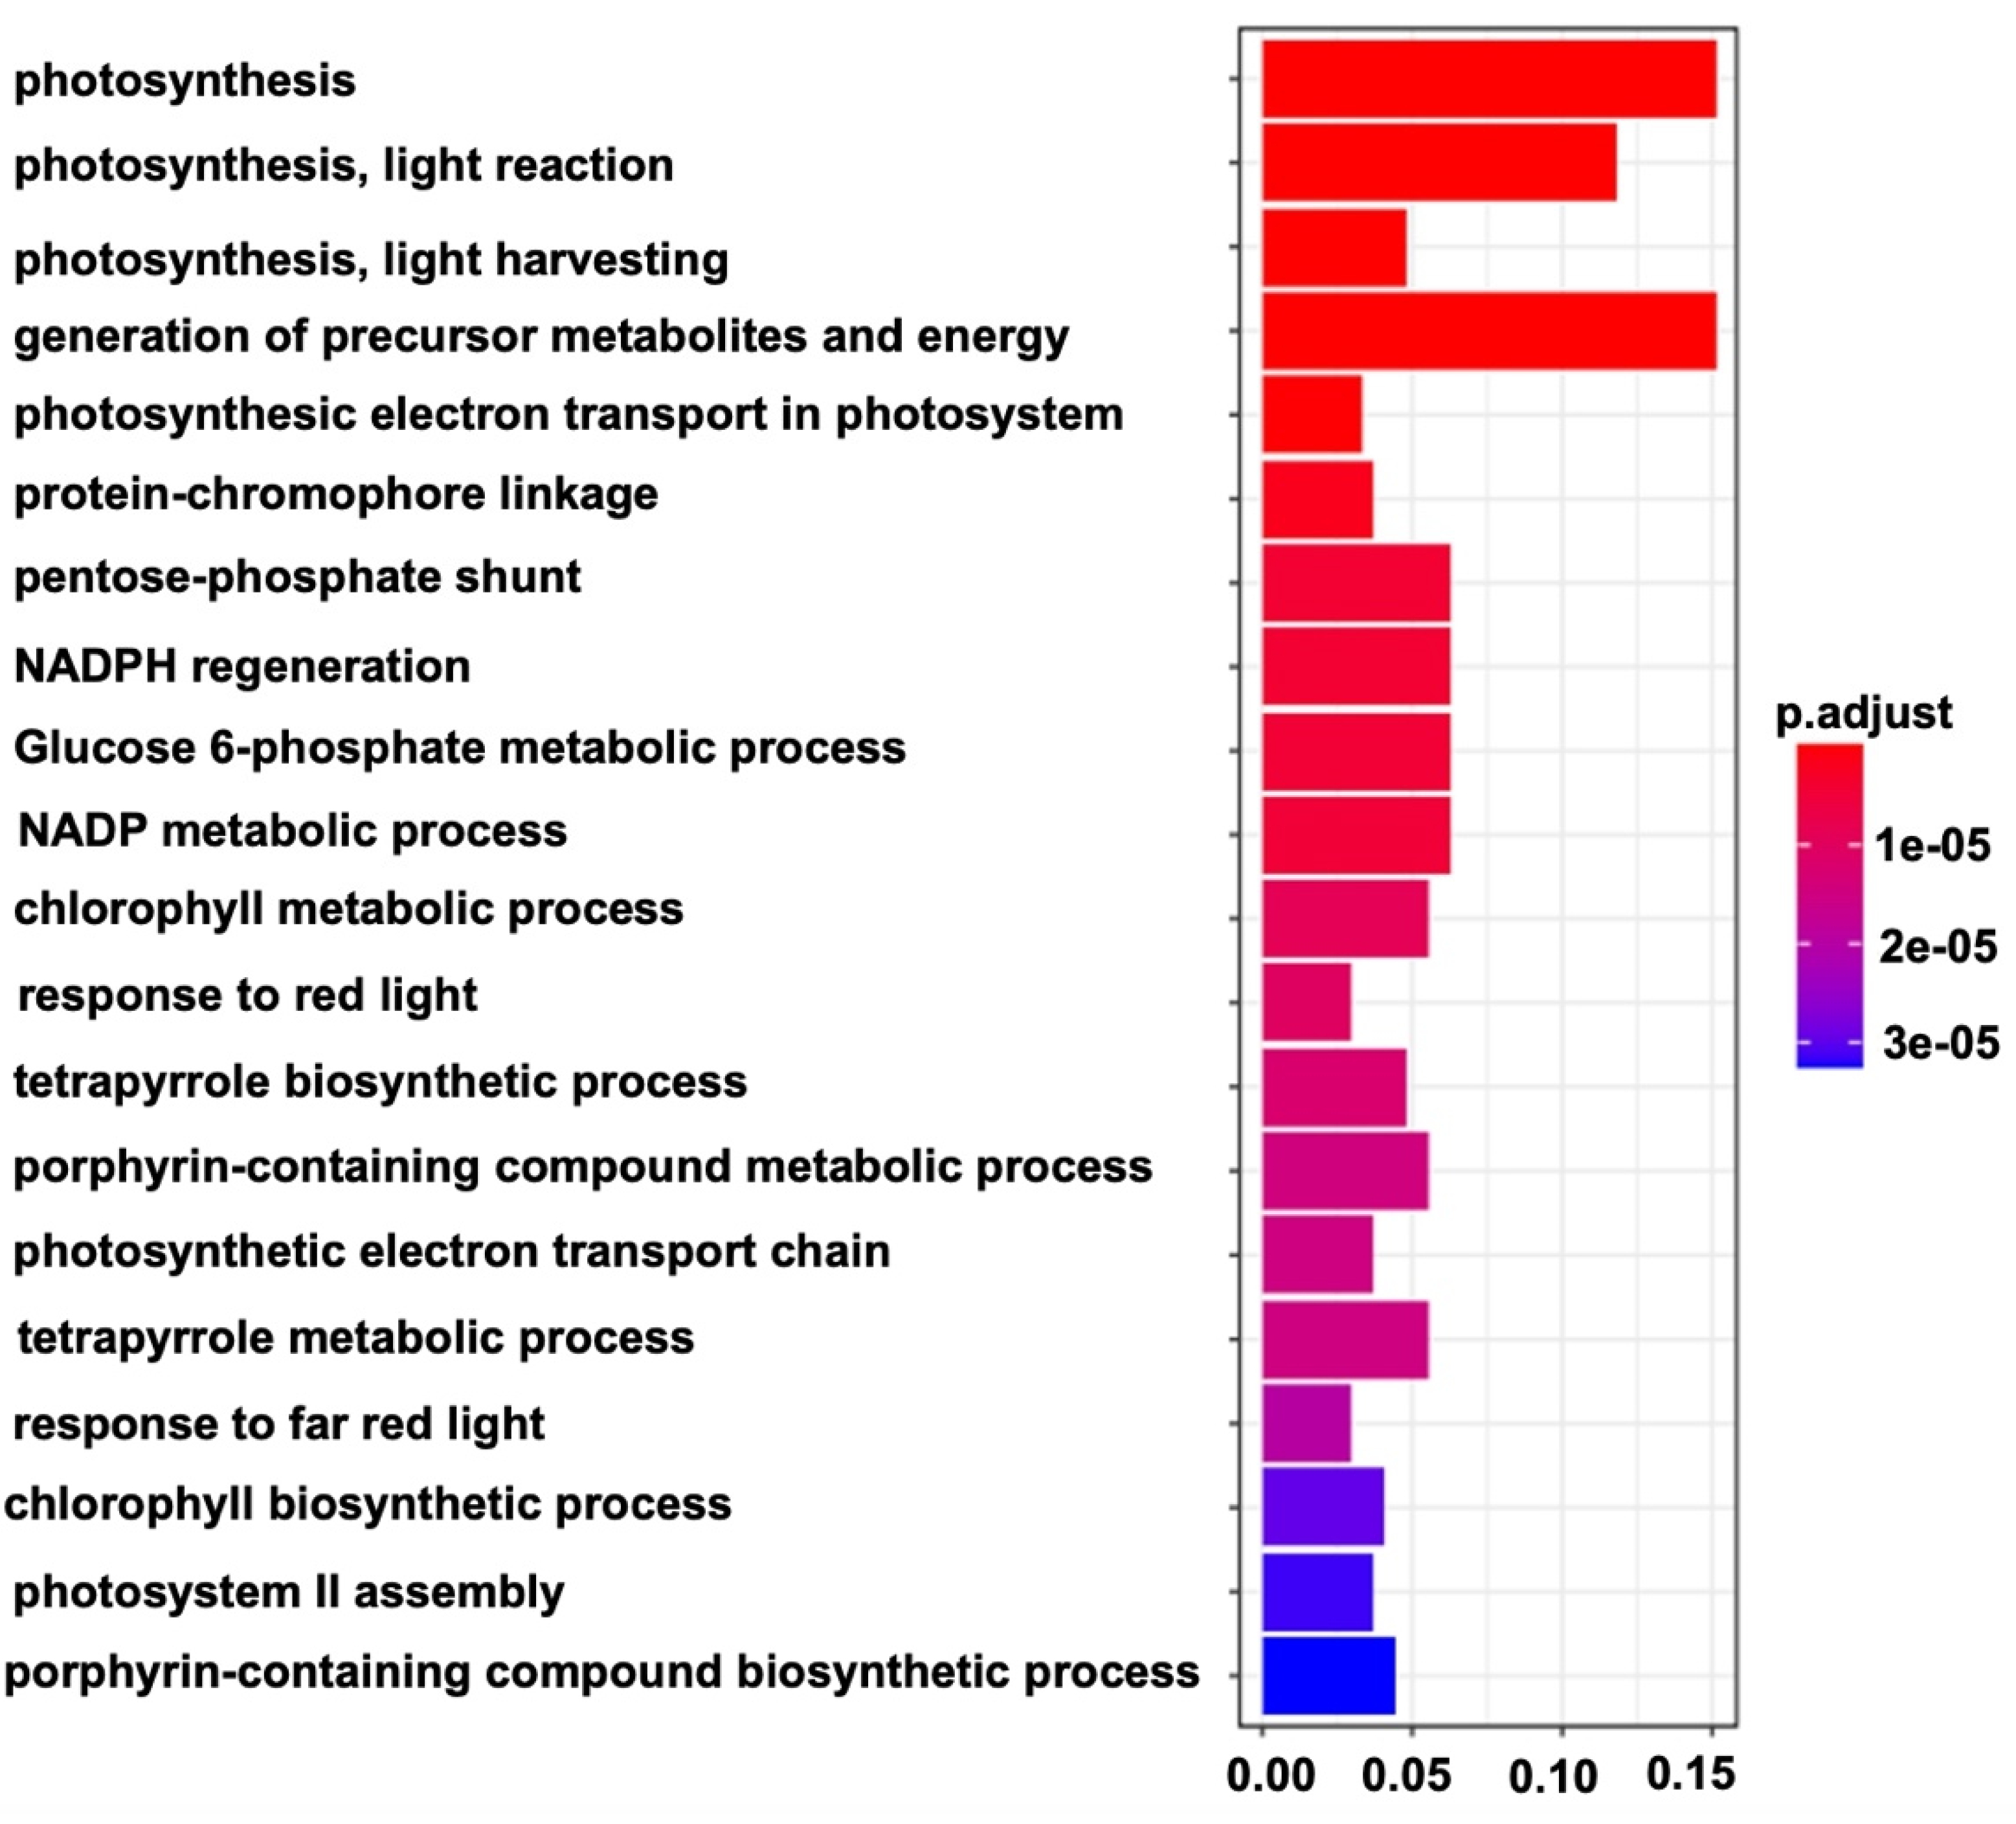
3.3. An Important Biological Process Played a Key Role in Chlorophyll Synthesis Variation and the Formation of Different Colors in Melon Stigmas
4. Materials and Methods
4.1. Plant Materials and Sampling Stages
4.2. Metabolite Detection and Transmission Electron Microscopy
4.3. RNA Sequencing and Transcriptomic Analysis
5. Conclusions
Supplementary Materials
Author Contributions
Funding
Institutional Review Board Statement
Informed Consent Statement
Data Availability Statement
Acknowledgments
Conflicts of Interest
Abbreviations
| FPKM | Fragments per kilobase of exon model per million mapped fragments |
| FDR | False discovery rate |
| DEGs | Differentially expressed genes |
| GO | Gene ontology |
| WGCNA | Co-expression network analysis |
| PSI | Photosystem I |
| CUTRT1 | Curvature thylakoid 1 |
References
- Qiao, A.; Fang, X.; Liu, S.; Liu, H.; Gao, P.; Luan, F. QTL-seq identifies major quantitative trait loci of stigma color in melon. Hortic. Plant J. 2021, 7, 318–326. [Google Scholar] [CrossRef]
- Pitrat, M. Melon genetic resources: Phenotypic diversity and horticultural taxonomy. Genet. Genom. Cucurbitaceae 2016, 20, 25–60. [Google Scholar]
- Henderson, W.R.; Scott, G.H.; Wehner, T.C. Interaction of flesh color genes in watermelon. J. Hered. 1998, 89, 50–53. [Google Scholar] [CrossRef] [Green Version]
- Austen, E.L.; Lin, S.Y.; Forrest, J.R.K. On the ecological significance of pollen color: A case study in American trout lily (Erythronium americanum). Ecology 2018, 99, 926–937. [Google Scholar] [CrossRef]
- Castillo, R.; Fernández, J.A.; Gόmez-Gόmez, L. Implications of carotenoid biosynthetic genes in apocarotenoid formation during the stigma development of Crocus sativus and its closer relatives. Plant Physiol. 2005, 139, 674–689. [Google Scholar] [CrossRef] [Green Version]
- Guiye, Z.; Lei, Q.; Muhammad, T.; Yang, Z.; Yan, Z.; Yan, L. Inheritance and phenotypic analysis of yellow stigma (ys) mutant of tomato. Acta Hortic. Sin. 2017, 44, 2109–2116. [Google Scholar]
- Han, L.; Zhang, T.; Xu, J.-D.; Li, Y.; Wang, X.-D.; Wu, X.-J. Genetic analysis and gene mapping of a purple stigma in rice. Acta Genet. Sin. 2006, 33, 642–646. [Google Scholar] [CrossRef]
- Dang, X.J.; Liu, E.B.; Liang, Y.F.; Liu, Q.M.; Breria, C.M.; Hong, D.L. QTL detection and elite alleles mining for stigma traits in Oryza sativa by association mapping. Front. Plant Sci. 2016, 7, 1188. [Google Scholar] [CrossRef] [Green Version]
- Sandonà, D.; Croce, R.; Pagano, A.; Crimi, M.; Bassi, R. Higher plants light harvesting proteins. Structure and function as revealed by mutation analysis of either protein or chromophore moieties. Biochim. Biophys. Acta. Bioenerg. 1998, 1365, 207–214. [Google Scholar] [CrossRef] [Green Version]
- Yang, Y.; Chen, X.; Xu, B.; Li, Y.; Ma, Y.; Wang, G. Phenotype and transcriptome analysis reveals chloroplast development and pigment biosynthesis together influenced the leaf color formation in mutants of Anthurium andraeanum ’Sonate’. Front. Plant Sci. 2015, 6, 139. [Google Scholar] [CrossRef] [Green Version]
- Fromme, P.; Melkozernov, A.; Jordan, P.; Krauss, N. Structure and function of photosystem I: Interaction with its soluble electron carriers and external antenna systems. FEBS Lett. 2003, 555, 40–44. [Google Scholar] [CrossRef]
- Eckhardt, U.; Grimm, B.; Hörtensteiner, S. Recent advances in chlorophyll biosynthesis and breakdown in higher plants. Plant Mol. Biol. 2004, 56, 1–14. [Google Scholar] [CrossRef]
- Ling, Z.; Zhike, Z.; Tingting, Z.; Weilin, W.; Yunmei, Z.; Yongshun, G.; Xianghui, W.; Sunquan, L. Characterization of carotenoid accumulation and carotenogenic gene expression during fruit development in yellow and white loquat fruit. Hortic. Plant J. 2016, 2, 9–15. [Google Scholar]
- Zhu, Q.; Gao, P.; Liu, S.; Zhu, Z.; Amanullah, S.; Davis, A.; Luan, F. Comparative transcriptome analysis of two contrasting watermelon genotypes during fruit development and ripening. BMC Genome. 2017, 18, 3. [Google Scholar] [CrossRef] [PubMed] [Green Version]
- Qian, X.; Ba, Y.; Zhuang, Q.F.; Zhong, G.F. RNA-Seq technology and its application in fish transcriptomics. OMICS 2014, 18, 98–110. [Google Scholar] [CrossRef] [Green Version]
- Salem, M.; Rexroad, C.E.; Wang, J.N.; Thorgaard, G.H.; Yao, J.B. Characterization of the rainbow trout transcriptome using sanger and 454 pyrosequencing approaches. BMC Genom. 2010, 11, 564–574. [Google Scholar] [CrossRef] [Green Version]
- Long, Y.; Li, L.C.; Li, Q.; He, X.Z.; Cui, Z.B. Transcriptomic characterization of temperature stress responses in larval zebrafish. PLoS ONE 2012, 7, e37209. [Google Scholar] [CrossRef] [PubMed] [Green Version]
- Calduch-Giner, J.A.; Bermejo-Nogales, A.; Benedito-Palos, L.; Ballester-Lozano, G.; Estensoro, I.; Sitja-Bobadilla, A.; Perez-Sanchez, J. Deep sequencing for de novo construction of a marine fish (Sparus aurata) transcriptome database with a large coverage ofprotein-coding transcripts. BMC Genom. 2013, 14, 178–189. [Google Scholar] [CrossRef] [PubMed] [Green Version]
- Magnanou, E.; Klopp, C.; Noirot, C.; Besseau, L.; Falcón, J. Generation and characterization of the sea bass Dicentrarchus labrax brain and liver transcriptomes. Gene 2014, 544, 56–66. [Google Scholar] [CrossRef]
- Qian, B.Y.; Xue, L.Y. Liver transcriptome sequencing and de novo annotation of the large yellow croaker (Larimichthy crocea) under heat and cold stress. Mar. Genom. 2016, 25, 95–102. [Google Scholar] [CrossRef]
- Sun, L.; Zhang, Y.; Cui, H.; Zhang, L.; Sha, T.; Wang, C.; Fan, C.; Luan, F.; Wang, X. Linkage mapping and comparative transcriptome analysis of firmness in watermelon (Citrullus lanatus). Front. Plant Sci. 2020, 11, 831. [Google Scholar] [CrossRef]
- Zhao, Z.; Dong, Y.; Wang, J.; Zhang, G.; Zhang, Z.; Zhang, A.; Wang, Z.; Ma, P.; Li, Y.; Zhang, X.; et al. Comparative transcriptome analysis of melon (Cucumis melo L.) reveals candidate genes and pathways involved in powdery resistance. Sci. Rep. 2022, 12, 4396. [Google Scholar] [CrossRef]
- Huang, J.; Wang, J.; Li, Y.; Kang, Y.; Liu, Z. Transcriptomic responses to heat stress in rainbow trout Oncorhynchus mykiss head kidney head kidney. Fish Shellfish. Immunol. 2018, 82, 32–40. [Google Scholar] [CrossRef] [PubMed]
- Ruan, J.; Dean, A.K.; Zhang, W.X. A general co-expression network-based approach to gene expression analysis: Comparison and applications. BMC Syst. Biol. 2010, 4, 8. [Google Scholar] [CrossRef] [Green Version]
- Deepak, P.; Violetta, V.L.; Pei-Yu, K.; Jiang, Z.W.; Ben, R.; Caroline, E.; Sai, K.A.D.; Zhang, W.J.; Hearn, J.C.; Ajai, C.; et al. Weighted gene co-expression network analysis (WGCNA) identifies highly proliferative myeloma sub-group responsive to CDK4/ARK5 inhibition. Blood 2014, 124, 3445. [Google Scholar]
- Pogson, B.J.; Ganguly, D.; Albrecht-Borth, V. Insights into chloroplast biogenesis and development. Biochim. Biophys. Acta. Bioenerg. 2015, 1847, 1017–1024. [Google Scholar] [CrossRef] [Green Version]
- Han, C.D.; Ceo, E.H., Jr.; Martienssen, R.A. Molecular cloning and characterization of iojap (ij), a pattern striping gene of maize. EMBO J. 1992, 11, 4037–4046. [Google Scholar] [CrossRef]
- Seo, T.S.; Bai, X.P.; Ruparel, H.; Li, Z.; Turro, N.J.; Ju, J. Photocleavable fluorescent nucleotides for DNA sequencing on a chip constructed by site-specific coupling chemistry. Proc. Natl. Acad. Sci. USA 2004, 101, 5488–5493. [Google Scholar] [CrossRef] [Green Version]
- Kato, Y.; Miura, E.; Matsushima, R.; Sakamoto, W. White leaf sectors in yellow variegated2 are formed by viable cells with undifferentiated plastids. Plant Physiol. 2007, 144, 952–960. [Google Scholar] [CrossRef] [Green Version]
- Nguyen, M.K.; Shih, T.H.; Lin, S.H.; Huang, W.D.; Yang, C.M. Transcription analysis of chlorophyll biosynthesis in wildtype and chlorophyll b-lacking rice (Oryza sativa L.). Photosynthetica 2020, 58, 702–711. [Google Scholar] [CrossRef] [Green Version]
- Wu, Q.J.; Chen, Z.D.; Sun, W.J.; Deng, T.T.; Chen, M.J. De novo sequencing of the leaf transcriptome reveals complex light-responsive regulatory networks in Camellia sinensis cv. Baijiguan. Front. Plant Sci. 2016, 7, 332. [Google Scholar] [CrossRef] [Green Version]
- Yang, W.Z.; Yoon, J.; Choi, H.; Fan, Y.L.; Chen, R.; An, G. Transcriptome analysis of nitrogen-starvation-responsive genes in rice. BMC Plant Biol. 2015, 15, 31. [Google Scholar] [CrossRef] [Green Version]
- Sujak, A.; Gabrielska, J.; Grudziński, W.; Borc, R.; Mazurek, P.; Gruszecki, W.I. Lutein and zeaxanthin as protectors of lipid membranes against oxidative damage: The structural aspects. Arch. Biochem. Biophys. 1999, 371, 301–307. [Google Scholar] [CrossRef] [PubMed]
- Sujak, A.; Okulski, W.; Gruszecki, W.I. Organization of xanthophylls pigments lutein and zeaxanthin in lipid membranes formed with dipalmitoylphosphatidylcholine. Biochim. Biophys. Acta. Biomembr. 2000, 1509, 255–263. [Google Scholar] [CrossRef] [Green Version]
- Krinsky, N.I. Possible biologic mechanisms for a protective role of xanthophylls. J. Nutr. 2002, 132, 540S–542S. [Google Scholar] [CrossRef]
- Li, L.; Yuan, H. Chromoplast biogenesis and carotenoid accumulation. Arch. Biochem. Biophys. 2013, 539, 102–109. [Google Scholar] [CrossRef] [PubMed]
- Perera, C.O.; Yen, G.M. Functional properties of carotenoids in human health. Int. J. Food Prop. 2007, 10, 201–230. [Google Scholar] [CrossRef]
- Wang, Z.; Gerstein, M.; Snyder, M. RNA-Seq: A revolutionary tool for transcriptomics. Nat. Rev. Genet. 2009, 10, 57–63. [Google Scholar] [CrossRef]
- Chalmers, D.J.; Ende, B.V.D. A reappraisal of the growth and development of peach fruit. Aust. J. Plant Physiol. 1975, 2, 623–634. [Google Scholar] [CrossRef]
- Lombardo, V.A.; Osorio, S.; Borsani, J.; Lauxmann, M.A.; Bustamante, C.A.; Budde, C.O.; Andreo, C.S.; Lara, M.V.; Fernie, A.R.; Drincovich, M.F. Metabolic profiling during peach fruit development and ripening reveals the metabolic networks that underpin each developmental stage. Plant Physiol. 2011, 157, 1696–1710. [Google Scholar] [CrossRef] [Green Version]
- Roca, M.; Mínguez-Mosquera, M.I. Carotenoid levels during the period of growth and ripening in fruits of different olive varieties (Hojiblanca, Picual and Arbequina). J. Plant Physiol. 2003, 160, 451–459. [Google Scholar] [CrossRef] [PubMed]
- Ying, H.; Shi, J.; Zhang, S.S.; Pingcuo, G.S.; Wang, S.; Zhao, F.; Cui, Y.N.; Zeng, X.L. Transcriptomic and metabolomic profiling provide novel insights into fruit development and flesh coloration in Prunus mira Koehne, a special wild peach species. BMC Plant Biol. 2019, 19, 463. [Google Scholar] [CrossRef] [PubMed]
- Zhang, B.; Horvath, S. A general framework for weighted gene co-expression network analysis. Stat. Appl. Genet. Mol. Biol. 2005, 4, 17. [Google Scholar] [CrossRef] [PubMed]
- Langfelder, P.; Horvath, S. WGCNA: An R package for weighted correlation network analysis. BMC Bioinf. 2008, 9, 559. [Google Scholar] [CrossRef] [Green Version]
- Hollender, C.A.; Kang, C.; Darwish, O.; Geretz, A.; Matthews, B.F.; Slovin, J.; Alkharouf, N.; Liu, Z.C. Floral transcriptomes in woodland strawberry uncover developing receptacle and anther gene networks. Plant Physiol. 2014, 165, 1062–1075. [Google Scholar] [CrossRef] [Green Version]
- Kogelman, L.J.A.; Cirera, S.; Zhernakova, D.V.; Fredholm, M.; Franke, L.; Kadarmideen, H.N. Identification of co-expression gene networks, regulatory genes and pathways for obesity based on adipose tissue RNA Sequencing in a porcine model. BMC Med. Genom. 2014, 7, 57. [Google Scholar] [CrossRef] [Green Version]
- Miller, J.A.; Ding, S.L.; Sunkin, S.M.; Smith, K.A.; Ng, L.; Szafer, A.; Ebbert, A.; Riley, Z.L.; Royall, J.J.; Aiona, K. Transcriptional landscape of the prenatal human brain. Nature 2014, 508, 199–206. [Google Scholar] [CrossRef]
- Wang, Y.X.R.; Huang, H.Y. Review on statistical methods for gene network reconstruction using expression data. J. Theor. Biol. 2014, 362, 53–61. [Google Scholar] [CrossRef]
- Li, T.C.; Yang, H.Y.; Lu, Y.; Dong, Q.; Liu, G.H.; Chen, F.; Zhou, Y.B. Comparative transcriptome analysis of differentially expressed genes related to the physiological changes of yellow-green leaf mutant of maize. PeerJ 2021, 9, e10567. [Google Scholar] [CrossRef]
- Burger, Y.; Paris, H.S.; Cohen, R.; Katzir, N.; Tadmor, Y.; Lewinsohn, E.; Schaffer, A.A. Genetic diversity of Cucumis melo. Hortic. Rev. 2010, 36, 165–198. [Google Scholar]
- Liu, G.Z.; Yu, H.Y.; Yuan, L.; Li, C.X.; Ye, J.; Chen, W.F.; Wang, Y.; Ge, P.F.; Zhang, J.H.; Ye, Z.B.; et al. SIRCM1, which encodes tomato Lytescent1, is required for chlorophyll synthesis and chloroplast development in fruits. Hortic. Res. 2021, 8, 128. [Google Scholar] [CrossRef] [PubMed]
- Tadmor, Y.; Burger, J.; Yaakov, I.; Feder, A.; Libhaber, S.E.; Portnoy, V.; Meir, A.; Tzuri, G.; Saáar, U.; Rogachev, I.; et al. Genetics of flavonoid, carotenoid, and chlorophyll pigments in melon fruit rinds. J. Agric. Food Chem. 2010, 58, 10722–10728. [Google Scholar] [CrossRef] [PubMed]
- Armbruster, U.; Labs, M.; Pribil, M.; Viola, S.; Xu, W.T.; Scharfenberg, M.; Hertle, A.P.; Rojahn, U.; Jensen, P.E.; Rappaport, F.; et al. Arabidopsis CURVATURE THYLAKOID1 proteins modify thylakoid architecture by inducing membrane curvature. Plant Cell 2013, 25, 2661–2678. [Google Scholar] [CrossRef] [PubMed] [Green Version]
- Sandoval-Ibáñez, O.; Sharma, A.; Bykowski, M.; Borràs-Gas, G.; Behrendorff, J.B.Y.H.; Mellor, S.; Qvortrup, K.; Verdonk, J.C.; Bock, R.; Kowalewska, L.; et al. Curvature thylakoid 1 proteins modulate prolamellar body morphology and promote organized thylakoid biogenesis in Arabidopsis thaliana. Proc. Natl. Acad. Sci. USA 2021, 118, e2113934118. [Google Scholar] [CrossRef] [PubMed]
- Xu, C.H.; Zhu, Q.J.; Chen, J.H.; Shen, L.L.; Yi, X.H.; Huang, Z.H.; Wang, W.D.; Chen, M.; Kuang, T.Y.; Shen, J.Y.; et al. A unique photosystem I reaction center from a chlorophyll d-containing cyanobacterium Acaryochloris marina. J. Integr. Plant Biol. 2021, 63, 1740–1752. [Google Scholar] [CrossRef] [PubMed]
- Leitner-Dagan, Y.; Ovadis, M.; Shklarman, E.; Elad, Y.; David, D.R.; Vainstein, A. Expression and functional analyses of the plastid lipid-associated protein CHRC suggest its role in chromoplastogenesis and stress. Plant Physiol. 2006, 142, 233–244. [Google Scholar] [CrossRef] [Green Version]
- Deruère, J.; Römer, S.; Dharlingue, A.; Backhaus, R.A.; Kuntz, M.; Camara, B. Fibril assembly and carotenoid overaccumulation in chromoplasts: A model for supramolecular lipoprotein structures. Plant Cell 1994, 6, 119–133. [Google Scholar]
- Barajas-López, J.D.; Kremnev, D.; Shaikhali, J.; Piñas-Fernández, A.; Strand, A. PAPP5 is involved in the tetrapyrrole mediated plastid signalling during chloroplast development. PLoS ONE 2013, 8, e60305. [Google Scholar]
- Pei, S.; Liu, Z.; Wang, X.; Luan, F.; Dai, Z.; Yang, Z.; Zhang, Q.; Liu, S. Quantitative trait loci and candidate genes responsible for pale green flesh colour in watermelon (Citrullus lanatus). Plant Breed. 2021, 140, 349–359. [Google Scholar] [CrossRef]
- Yang, C.; Chang, K.; Yin, M.; Huang, H. Methods for the determination of the chlorophylls and their derivatives. Taiwania 1998, 43, 116–122. [Google Scholar]
- Coyago-Cruz, M.; Corell, M.; Moriana, A.; Mapelli-Brahm, P.; Hernanz, D.; Stinco, C.M.; Beltrán-Sinchiguano, E.; Meléndez-Martínez, A. Study of commercial quality parameters, sugars, phenolics, carotenoids and plastids in different tomato varieties. Food Chem. 2019, 277, 480–489. [Google Scholar] [CrossRef] [PubMed] [Green Version]
- Wang, N.; Wang, R.; Wang, R.; Chen, S. Transcriptomics analysis revealing candidate networks and genes for the body size sexual dimorphism of Chinese tongue sole (Cynoglossus semilaevis). Funct. Integr. Genom. 2018, 18, 327–339. [Google Scholar] [CrossRef] [PubMed]
- Thimm, O.; Bläsing, O.; Gibon, Y.; Nagel, A.; Meyer, S.; Krüger, P.; Selbig, J.; Müller, L.A.; Rhee, S.Y.; Stitt, M. MAPMAN: A user-driven tool to display genomics data sets onto diagrams of metabolic pathways and other biological processes. Plant J. 2004, 37, 914–939. [Google Scholar] [CrossRef]
- Kanehisa, M.; Goto, S. KEGG: Kyoto encyclopedia of genes and genomes. Nucleic Acids Res. 2000, 28, 27–30. [Google Scholar] [CrossRef] [PubMed]
- Yang, T.; Zhang, P.; Pan, J.; Amanullah, S.; Luan, F.; Han, W.; Liu, H.; Wang, X. Genome-wide analysis of the peroxidase gene family and verification of lignin synthesis related genes in watermelon. Int. J. Mol. Sci. 2022, 23, 642. [Google Scholar] [CrossRef] [PubMed]


| GO ID | Classification | Description |
|---|---|---|
| Go:0009658 | biological process | chloroplast organization |
| Go:1905392 | biological process | plant organ morphogenesis |
| Go:0010817 | biological process | regulation of hormone levels |
| Go:0042445 | biological process | hormone metabolic process |
| Go:0051640 | biological process | organelle localization |
| Go:0042254 | biological process | ribosome biogenesis |
| Go:0022613 | biological process | ribonucleoprotein complex biogenesis |
| Go:0005618 | cellular component | cell wall |
| Go:0031976 | cellular component | plastid thylakoid |
| Go:0034357 | cellular component | photosynthetic membrane |
| Go:0009570 | cellular component | chloroplast stroma |
| Go:0003735 | molecular function | structural constituent of ribosome |
| Go:0016168 | molecular function | chlorophyll binding |
| Go:0016597 | molecular function | amino acid binding |
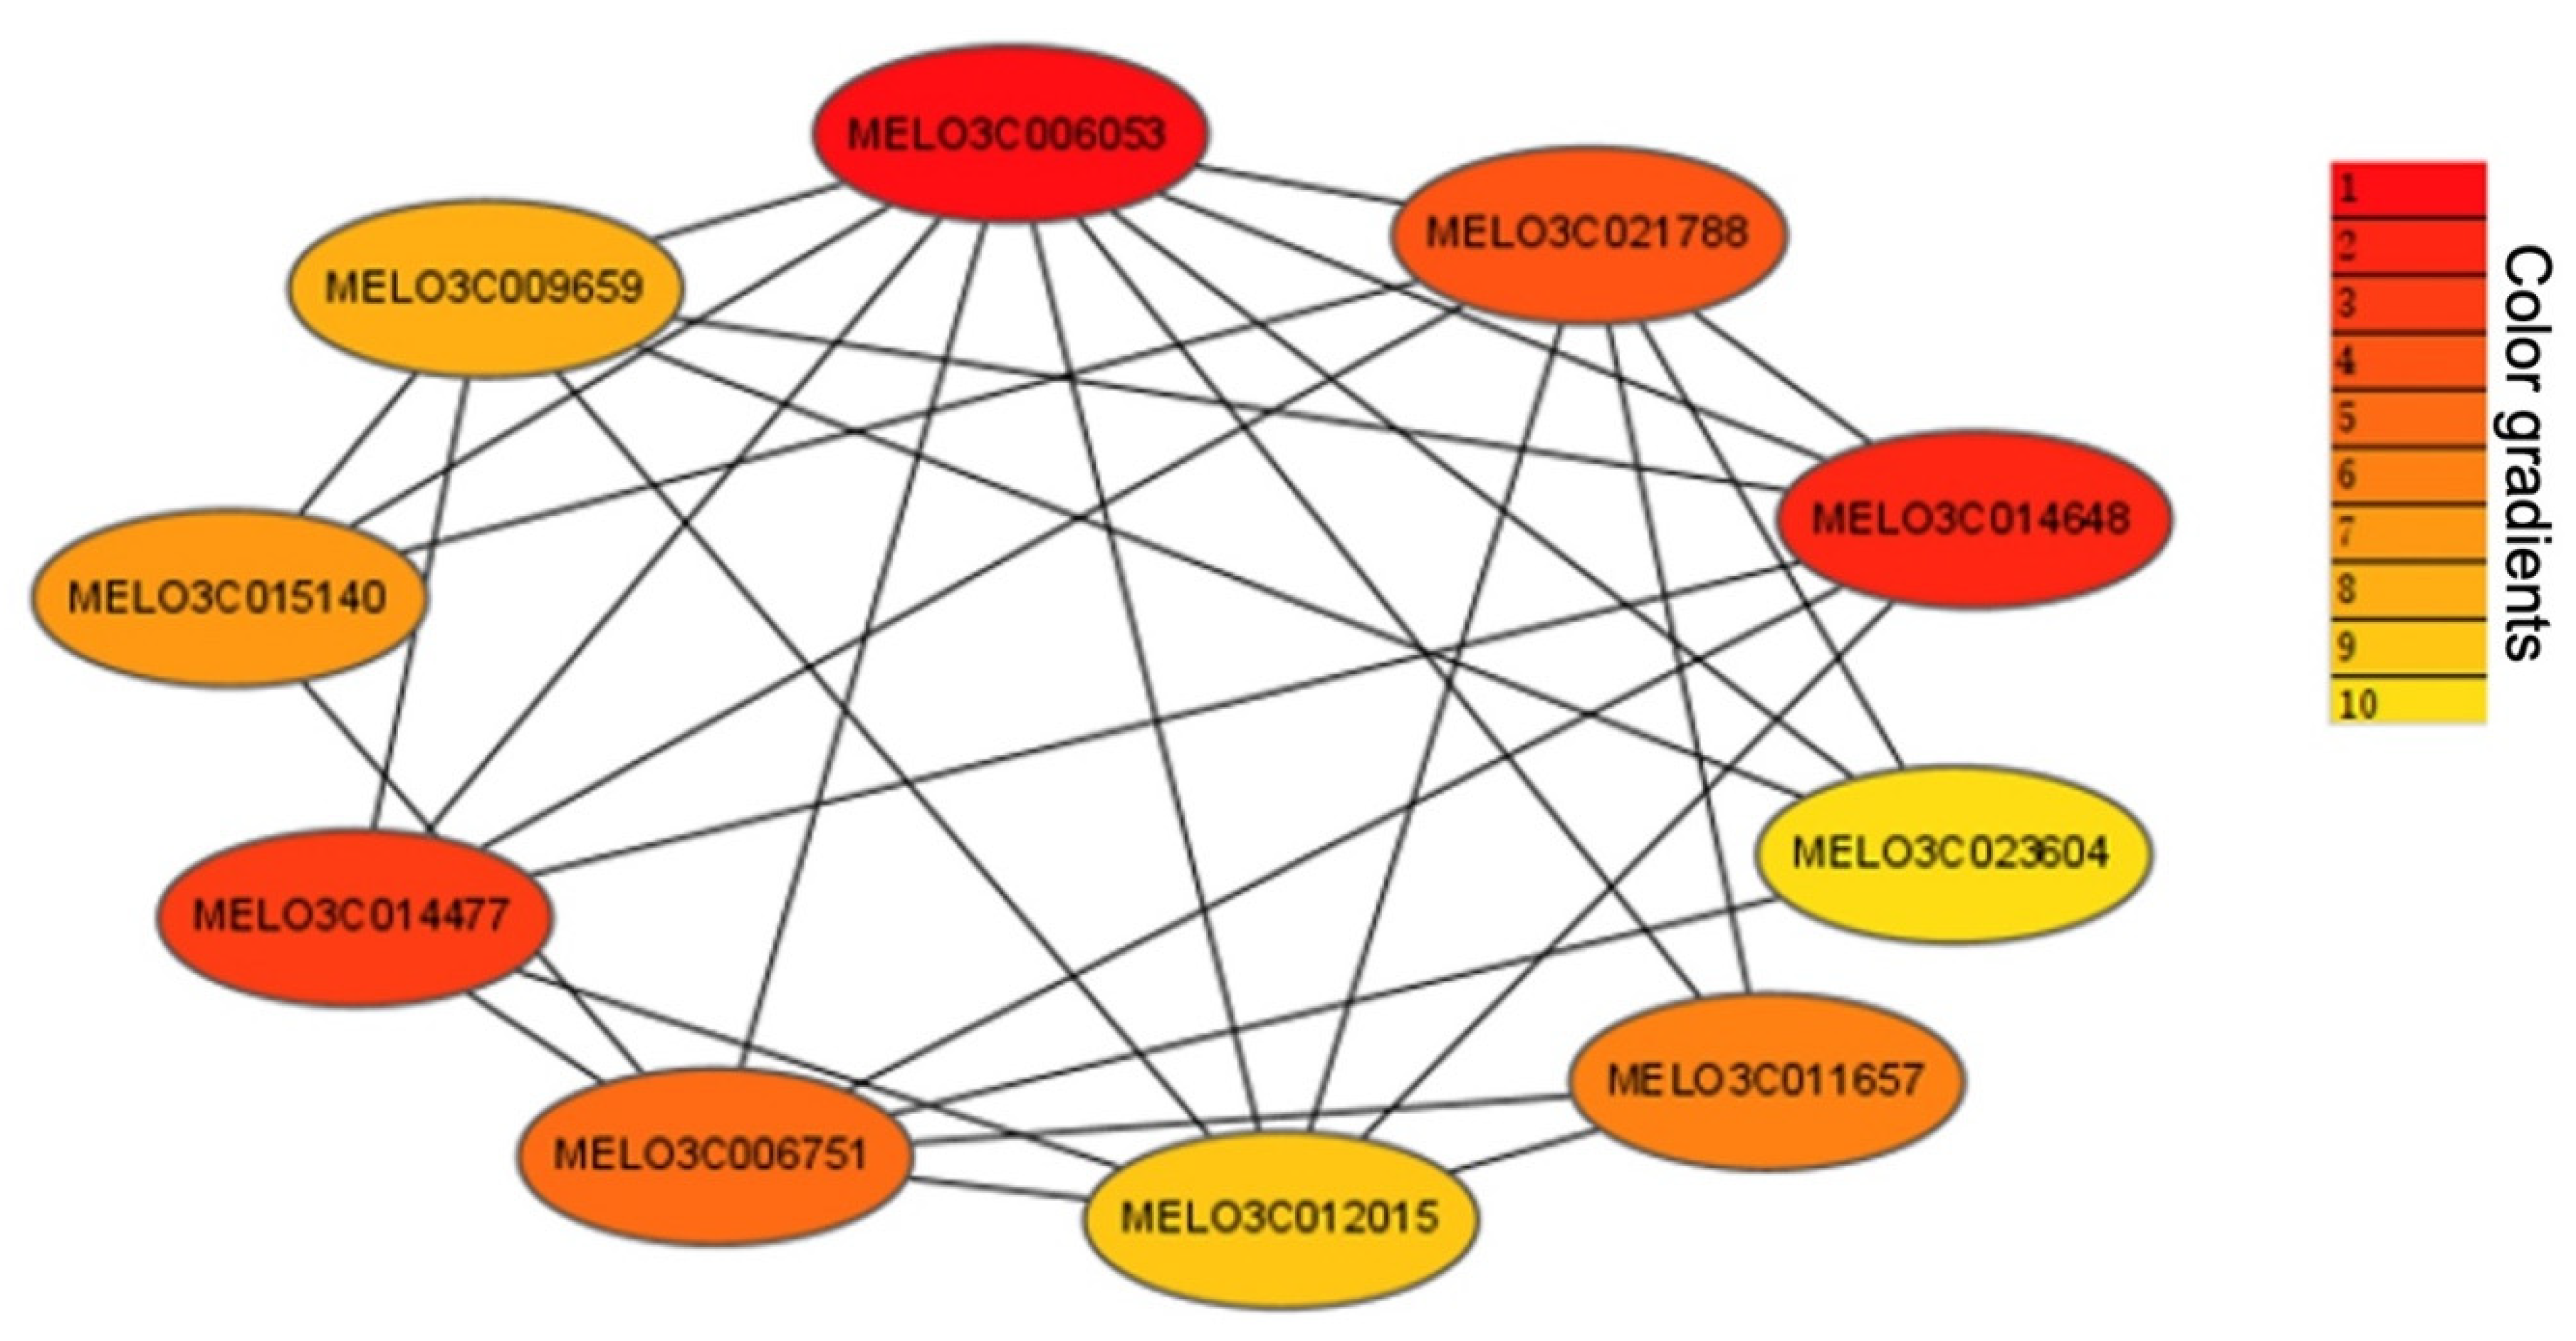
| Gene_ID | Gene Annotation |
|---|---|
| MELO3C014477 | Cyclic nucleotide-gated ion channel 1-like isoform X3 |
| MELO3C006751 | DNA-binding protein |
| MELO3C012015 | WAT1-related protein |
| MELO3C011657 | Tetrapyrrole-binding protein, chloroplastic |
| MELO3C023604 | Glutathione transport system permease gsiD |
| MELO3C014648 | Plastid lipid-associated protein |
| MELO3C021788 | Photosystem I reaction center subunit III |
| MELO3C006053 | Protein CURVATURE THYLAKOID 1A, chloroplastic |
| MELO3C009659 | WD-repeat protein, putative |
| MELO3C015140 | Cytochrome P450 |
Publisher’s Note: MDPI stays neutral with regard to jurisdictional claims in published maps and institutional affiliations. |
© 2022 by the authors. Licensee MDPI, Basel, Switzerland. This article is an open access article distributed under the terms and conditions of the Creative Commons Attribution (CC BY) license (https://creativecommons.org/licenses/by/4.0/).
Share and Cite
Lv, Y.; Amanullah, S.; Liu, S.; Zhang, C.; Liu, H.; Zhu, Z.; Zhang, X.; Gao, P.; Luan, F. Comparative Transcriptome Analysis Identified Key Pathways and Genes Regulating Differentiated Stigma Color in Melon (Cucumis melo L.). Int. J. Mol. Sci. 2022, 23, 6721. https://doi.org/10.3390/ijms23126721
Lv Y, Amanullah S, Liu S, Zhang C, Liu H, Zhu Z, Zhang X, Gao P, Luan F. Comparative Transcriptome Analysis Identified Key Pathways and Genes Regulating Differentiated Stigma Color in Melon (Cucumis melo L.). International Journal of Molecular Sciences. 2022; 23(12):6721. https://doi.org/10.3390/ijms23126721
Chicago/Turabian StyleLv, Yuanzuo, Sikandar Amanullah, Shi Liu, Chen Zhang, Hongyu Liu, Zicheng Zhu, Xian Zhang, Peng Gao, and Feishi Luan. 2022. "Comparative Transcriptome Analysis Identified Key Pathways and Genes Regulating Differentiated Stigma Color in Melon (Cucumis melo L.)" International Journal of Molecular Sciences 23, no. 12: 6721. https://doi.org/10.3390/ijms23126721