
Tracking Prostate Carcinogenesis over Time through Urine Proteome Profiling in an Animal Model: An Exploratory Approach
 , , , , , , , , , and
Abstract
:1. Introduction
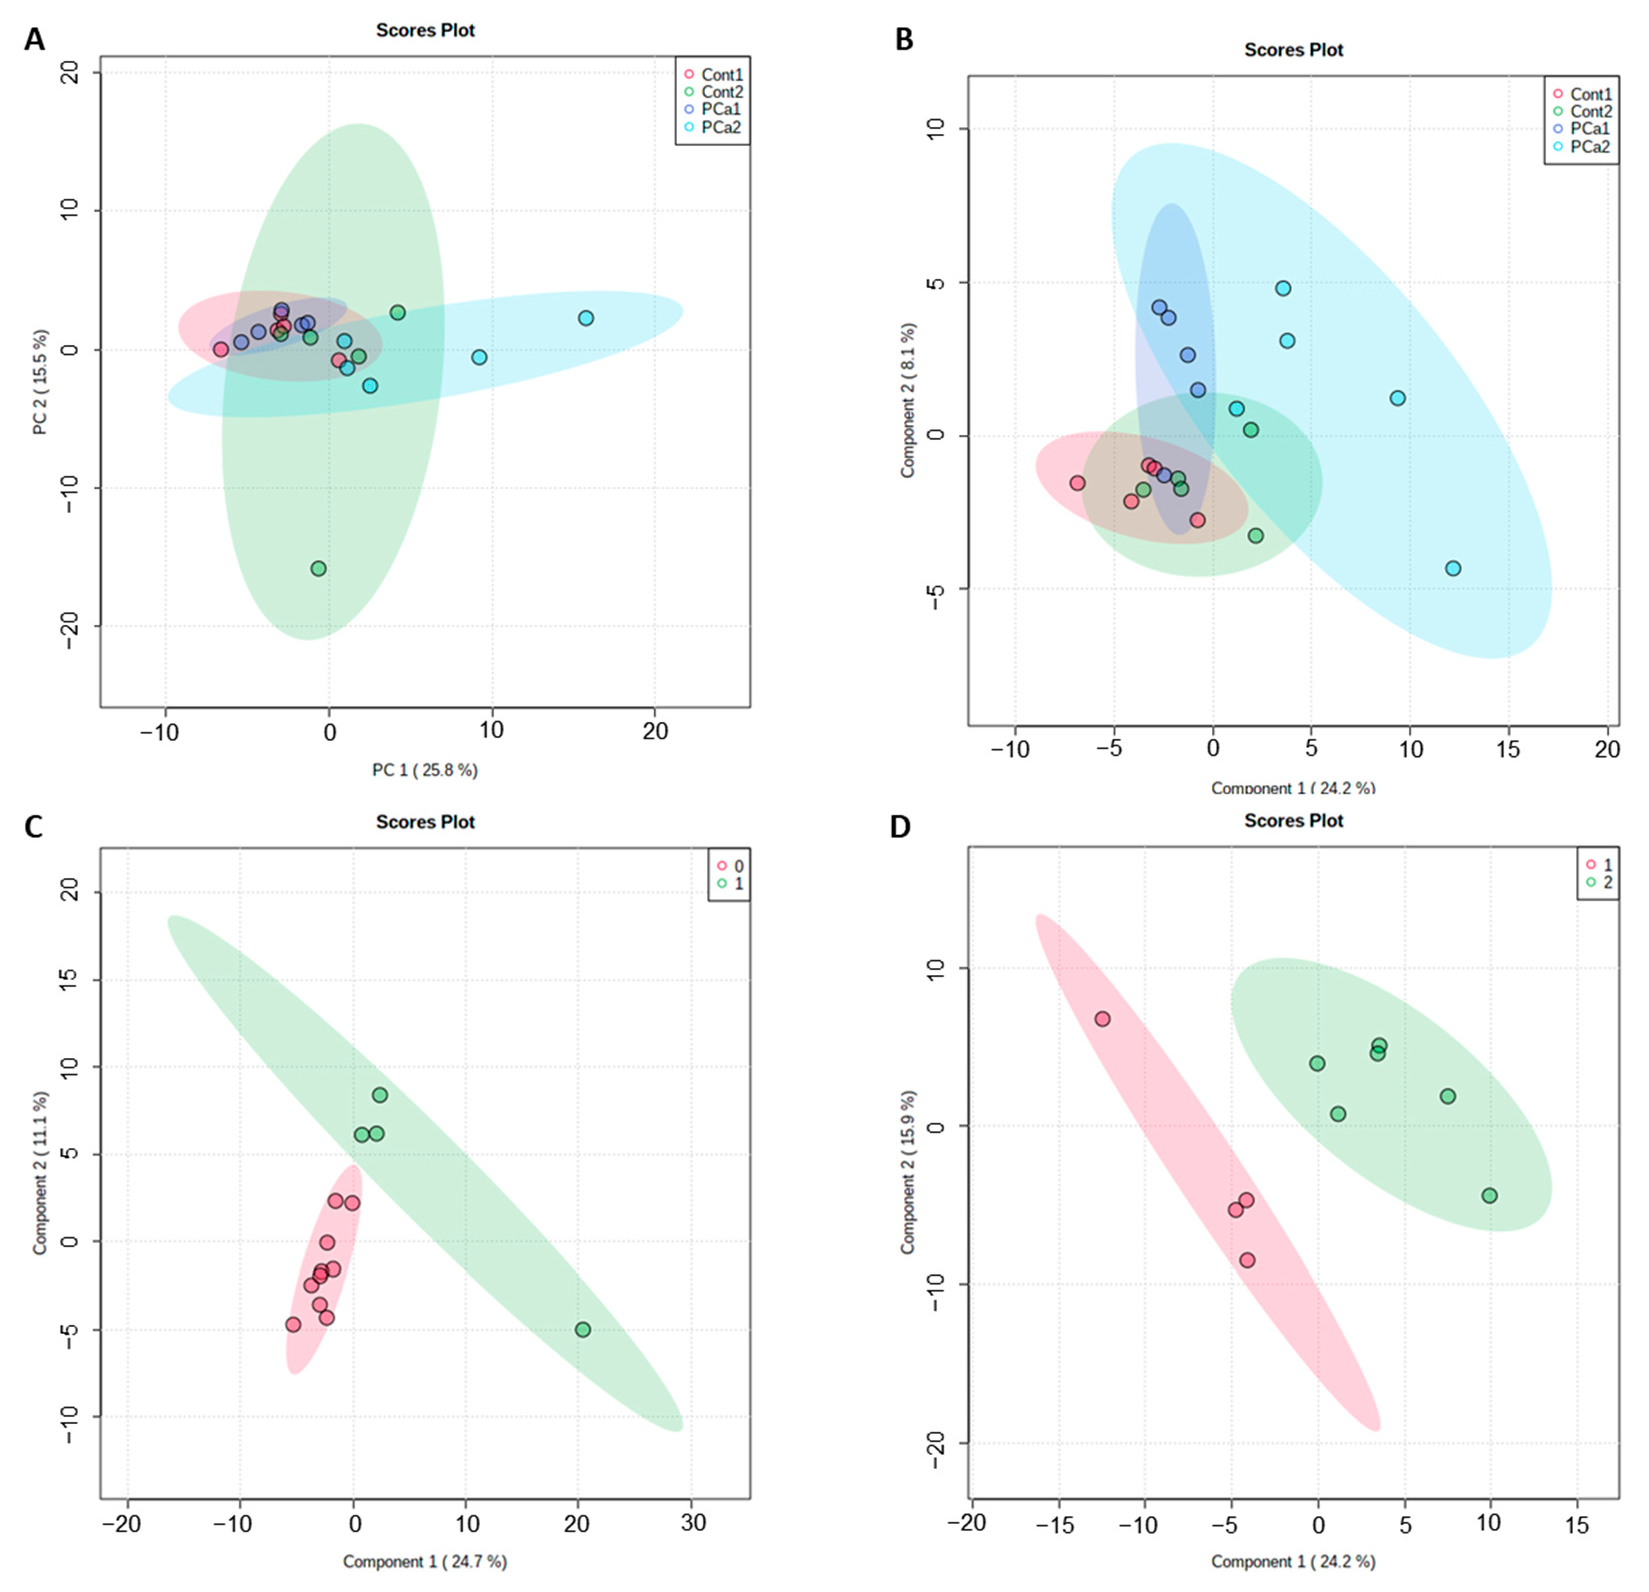
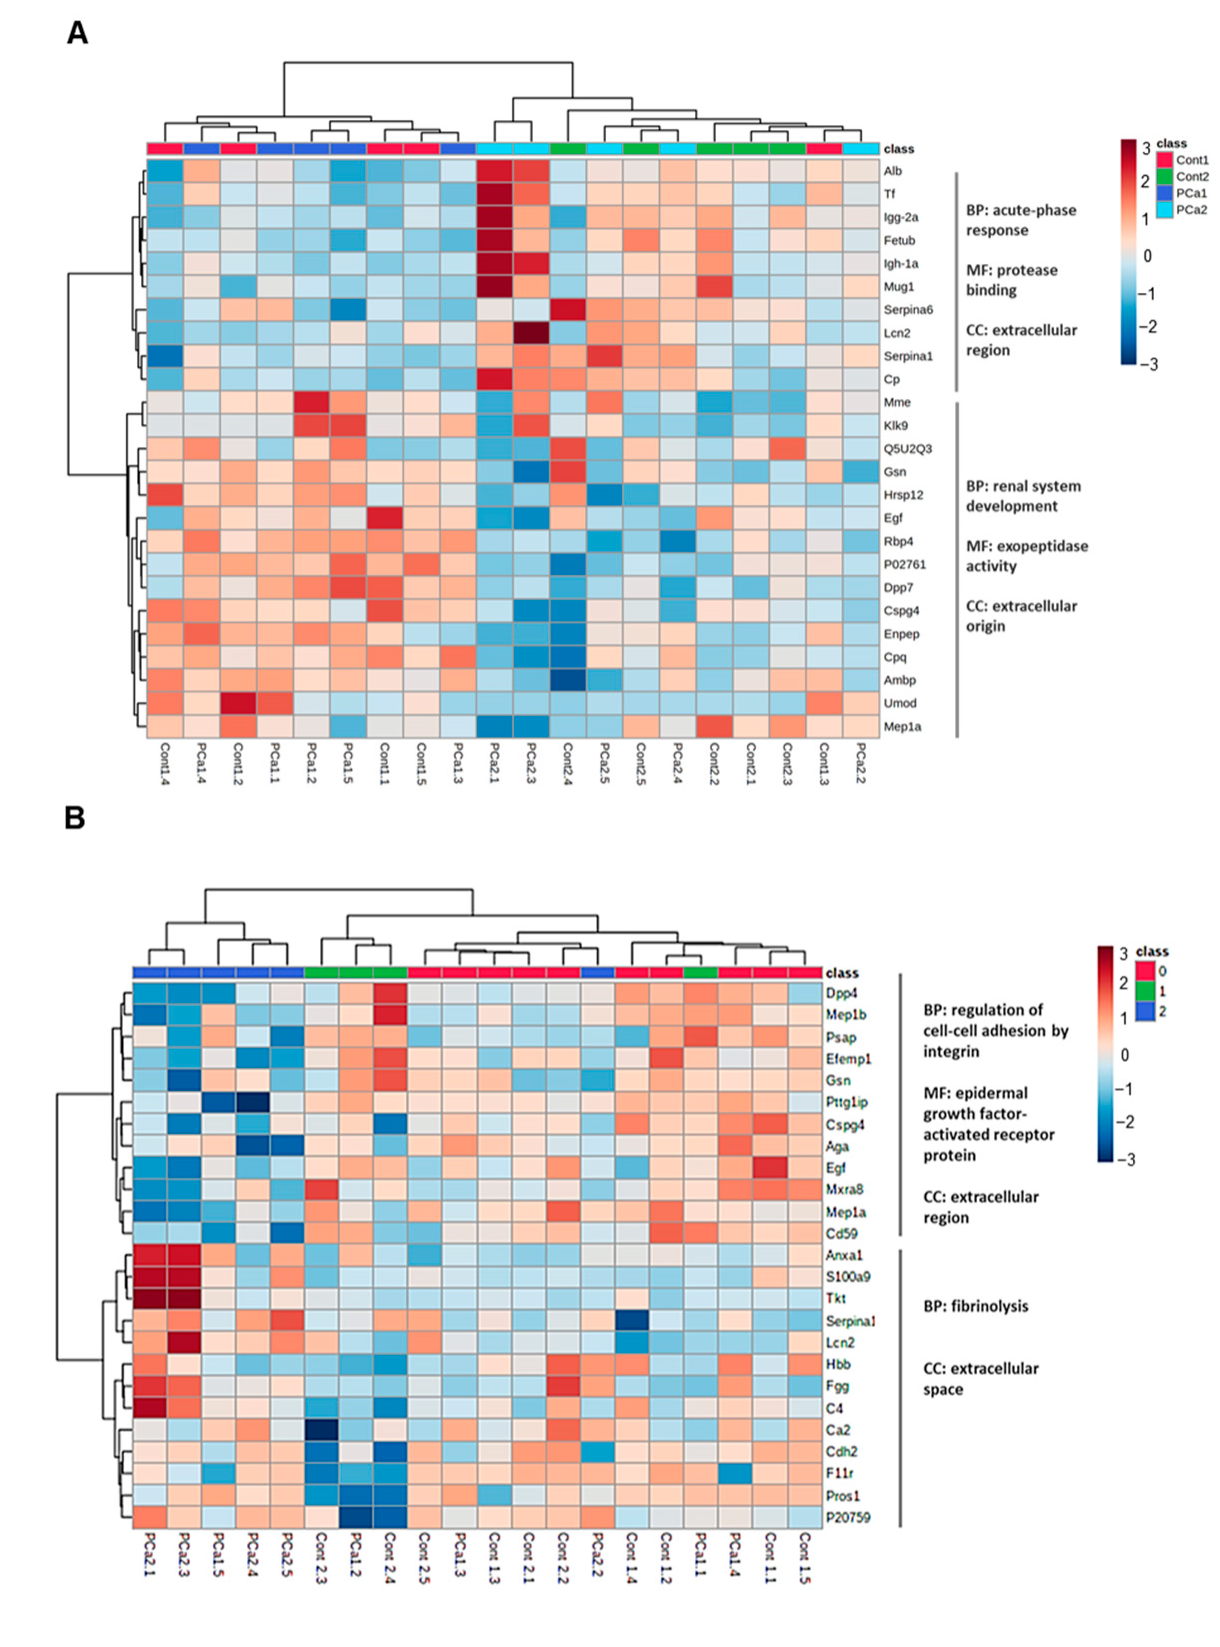
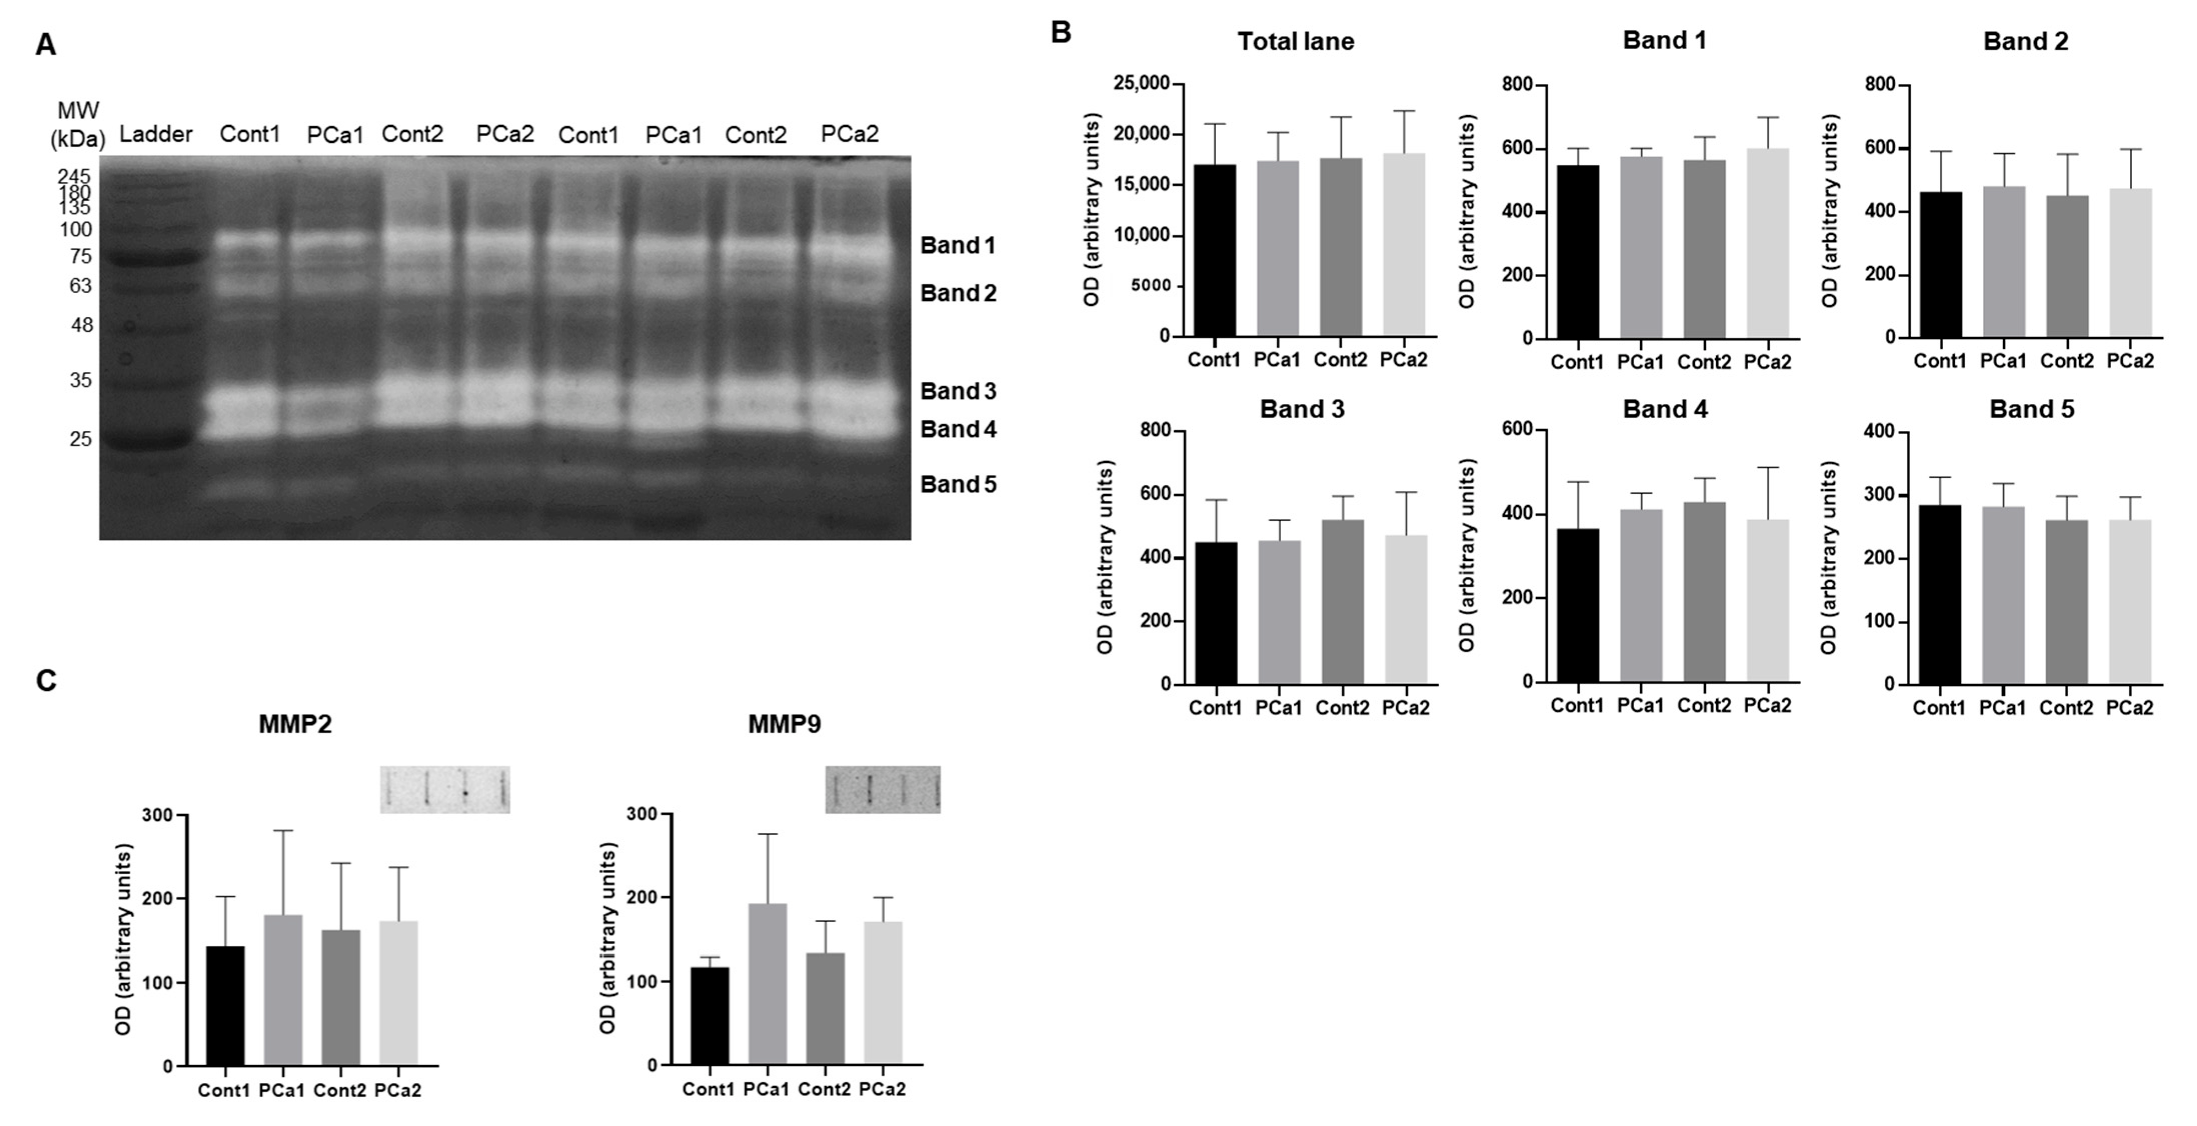
2. Results
3. Discussion
4. Materials and Methods
4.1. Animal Protocol
4.2. Histological Analysis
4.3. Urine Collection and Preparation
4.4. SDS-PAGE and In-Gel Digestion
4.5. LC-MS/MS Analysis and Protein ID
4.6. Gelatin Zymography Analysis
4.7. Immunoblot Analysis
4.8. Statistical Analysis
Supplementary Materials
Author Contributions
Funding
Institutional Review Board Statement
Informed Consent Statement
Data Availability Statement
Acknowledgments
Conflicts of Interest
References
- Sung, H.; Ferlay, J.; Siegel, R.L.; Laversanne, M.; Soerjomataram, I.; Jemal, A.; Bray, F. Global Cancer Statistics 2020: GLOBOCAN Estimates of Incidence and Mortality Worldwide for 36 Cancers in 185 Countries. CA Cancer J. Clin. 2021, 71, 209–249. [Google Scholar] [CrossRef] [PubMed]
- Cuzick, J.; Thorat, M.; Andriole, G.; Brawley, O.W.; Brown, P.H.; Culig, Z.; Eeles, R.; Ford, L.G.; Hamdy, F.C.; Holmberg, L.; et al. Prevention and early detection of prostate cancer. Lancet Oncol. 2014, 15, e484–e492. [Google Scholar] [CrossRef] [Green Version]
- Merriel, S.W.D.; Funston, G.; Hamilton, W. Prostate Cancer in Primary Care. Adv. Ther. 2018, 35, 1285–1294. [Google Scholar] [CrossRef] [PubMed] [Green Version]
- Ahmed, H.U.; El-Shater Bosaily, A.; Brown, L.C.; Gabe, R.; Kaplan, R.; Parmar, M.K.; Collaco-Moraes, Y.; Ward, K.; Hindley, R.G.; Freeman, A.; et al. Diagnostic accuracy of multi-parametric MRI and TRUS biopsy in prostate cancer (PROMIS): A paired validating confirmatory study. Lancet 2017, 389, 815–822. [Google Scholar] [CrossRef] [Green Version]
- Taitt, H.E. Global Trends and Prostate Cancer: A Review of Incidence, Detection, and Mortality as Influenced by Race, Ethnicity, and Geographic Location. Am. J. Men’s Health 2018, 12, 1807–1823. [Google Scholar] [CrossRef] [Green Version]
- Theodorescu, D.; Schiffer, E.; Bauer, H.W.; Douwes, F.; Eichhorn, F.; Polley, R.; Schmidt, T.; Schöfer, W.; Zürbig, P.; Good, D.M.; et al. Discovery and validation of urinary biomarkers for prostate cancer. Proteom. Clin. Appl. 2008, 2, 556–570. [Google Scholar] [CrossRef]
- Beasley-Green, A. Urine Proteomics in the Era of Mass Spectrometry. Int. Neurourol. J. 2016, 20, S70–S75. [Google Scholar] [CrossRef] [Green Version]
- He, T. Implementation of Proteomics in Clinical Trials. Proteom. Clin. Appl. 2019, 13, e1800198. [Google Scholar] [CrossRef]
- Principe, S.; Kim, Y.; Fontana, S.; Ignatchenko, V.; Nyalwidhe, J.O.; Lance, R.S.; Troyer, D.A.; Alessandro, R.; Semmes, O.J.; Kislinger, T.; et al. Identification of Prostate-Enriched Proteins by In-depth Proteomic Analyses of Expressed Prostatic Secretions in Urine. J. Proteome Res. 2012, 11, 2386–2396. [Google Scholar] [CrossRef] [Green Version]
- Kalantari, S.; Jafari, A.; Moradpoor, R.; Ghasemi, E.; Khalkhal, E. Human Urine Proteomics: Analytical Techniques and Clinical Applications in Renal Diseases. Int. J. Proteom. 2015, 2015, 782798. [Google Scholar] [CrossRef]
- Pedroza-Diaz, J.; Röthlisberger, S. Advances in urinary protein biomarkers for urogenital and non-urogenital pathologies. Biochem. Med. 2015, 25, 22–35. [Google Scholar] [CrossRef] [Green Version]
- Nascimento-Gonçalves, E.; Seixas, F.; Ferreira, R.; Colaço, B.; Parada, B.; Oliveira, P.A. An overview of the latest in state-of-the-art murine models for prostate cancer. Expert Opin. Drug Discov. 2021, 16, 1349–1364. [Google Scholar] [CrossRef]
- Nascimento-Gonçalves, E.; Faustino-Rocha, A.I.; Seixas, F.; Ginja, M.; Colaço, B.; Ferreira, R.; Fardilha, M.; Oliveira, P.A. Modelling human prostate cancer: Rat models. Life Sci. 2018, 203, 210–224. [Google Scholar] [CrossRef]
- Ghasemi, A.; Jeddi, S.; Kashfi, K. The laboratory rat: Age and body weight matter. EXCLI J. 2021, 20, 1431–1445. [Google Scholar] [CrossRef]
- Lima, T.; Barros, A.S.; Trindade, F.; Ferreira, R.; Leite-Moreira, A.; Barros-Silva, D.; Jerónimo, C.; Araújo, L.; Henrique, R.; Vitorino, R.; et al. Application of Proteogenomics to Urine Analysis towards the Identification of Novel Biomarkers of Prostate Cancer: An Exploratory Study. Cancers 2022, 14, 2001. [Google Scholar] [CrossRef]
- Swensen, A.C.; He, J.; Fang, A.C.; Ye, Y.; Nicora, C.D.; Shi, T.; Liu, A.Y.; Sigdel, T.K.; Sarwal, M.M.; Qian, W.-J. A Comprehensive Urine Proteome Database Generated From Patients With Various Renal Conditions and Prostate Cancer. Front. Med. 2021, 8, 548212. [Google Scholar] [CrossRef]
- Davalieva, K.; Kiprijanovska, S.; Kostovska, I.M.; Stavridis, S.; Stankov, O.; Komina, S.; Petrusevska, G.; Polenakovic, M. Comparative Proteomics Analysis of Urine Reveals Down-Regulation of Acute Phase Response Signaling and LXR/RXR Activation Pathways in Prostate Cancer. Proteomes 2017, 6, 1. [Google Scholar] [CrossRef] [Green Version]
- Nobili, V.; Alkhouri, N.; Alisi, A.; Ottino, S.; Lopez, R.; Manco, M.; Feldstein, A.E. Retinol-Binding Protein 4: A Promising Circulating Marker of Liver Damage in Pediatric Nonalcoholic Fatty Liver Disease. Clin. Gastroenterol. Hepatol. 2009, 7, 575–579. [Google Scholar] [CrossRef]
- Mondul, A.; Yu, K.; Wheeler, W.; Zhang, H.; Weinstein, S.J.; Major, J.M.; Cornelis, M.C.; Männistö, S.; Hazra, A.; Hsing, A.W.; et al. Genome-wide association study of circulating retinol levels. Hum. Mol. Genet. 2011, 20, 4724–4731. [Google Scholar] [CrossRef]
- Ravindranath, N.; Wion, D.; Brachet, P.; Djakiew, D. Epidermal growth factor modulates the expression of vascular endo-thelial growth factor in the human prostate. J. Androl. 2001, 22, 432–443. [Google Scholar] [CrossRef]
- Ferreira, R.; Oliveira, P.; Martins, T.; Magalhães, S.; Trindade, F.; Pires, M.J.; Colaço, B.; Barros, A.; Santos, L.; Amado, F.; et al. Comparative proteomic analyses of urine from rat urothelial carcinoma chemically induced by exposure to N-butyl-N-(4-hydroxybutyl)-nitrosamine. Mol. BioSyst. 2015, 11, 1594–1602. [Google Scholar] [CrossRef] [Green Version]
- McCormick, D.L.; Rao, K.V.N.; Dooley, L.; Steele, V.E.; Lubet, R.A.; Kelloff, G.J.; Bosland, M.C. Influence of N-methyl-N-nitrosourea, testosterone, and N-(4-hydroxyphenyl)-all-trans-retinamide on prostate cancer induction in wistar-unilever rats. Cancer Res. 1998, 58, 3282–3288. [Google Scholar]
- Boileau, T.W.-M.; Liao, Z.; Kim, S.; Lemeshow, S.; Erdman, J.J.W.; Clinton, S.K. Prostate Carcinogenesis in N-methyl-N-nitrosourea (NMU)-Testosterone-Treated Rats Fed Tomato Powder, Lycopene, or Energy-Restricted Diets. JNCI J. Natl. Cancer Inst. 2003, 95, 1578–1586. [Google Scholar] [CrossRef] [PubMed] [Green Version]
- Leitzmann, M.F.; Rohrmann, S. Risk factors for the onset of prostatic cancer: Age, location, and behavioral correlates. Clin. Epidemiol. 2012, 4, 1–11. [Google Scholar] [CrossRef] [PubMed] [Green Version]
- Pettersson, A.; Robinson, D.; Garmo, H.; Holmberg, L.; Stattin, P. Age at diagnosis and prostate cancer treatment and prognosis: A population-based cohort study. Ann. Oncol. 2018, 29, 377–385. [Google Scholar] [CrossRef] [PubMed] [Green Version]
- Barber, A.G.; Castillo-Martin, M.; Bonal, D.M.; Jia, A.J.; Rybicki, B.A.; Christiano, A.M.; Cordon-Cardo, C. PI3K/AKTpathway regulates E-cadherin and Desmoglein 2 in aggressive prostate cancer. Cancer Med. 2015, 4, 1258–1271. [Google Scholar] [CrossRef] [PubMed]
- Bonaldi, C.M.; Azzalis, L.A.; Junqueira, V.B.; de Oliveira, C.G.; Boas, V.A.V.; Gáscon, T.M.; Gehrke, F.S.; Kuniyoshi, R.K.; Alves, B.; Fonseca, F.L. Plasma Levels of E-cadherin and MMP-13 in Prostate Cancer Patients: Correlation with PSA, Testosterone and Pathological Parameters. Tumori J. 2015, 101, 185–188. [Google Scholar] [CrossRef]
- Vandyke, K.; Chow, A.W.; Williams, S.A.; To, L.B.; Zannettino, A.C. Circulating N-cadherin levels are a negative prognostic indicator in patients with multiple myeloma. Br. J. Haematol. 2013, 161, 499–507. [Google Scholar] [CrossRef]
- Drivalos, A.; Chrisofos, M.; Efstathiou, E.; Kapranou, A.; Kollaitis, G.; Koutlis, G.; Antoniou, N.; Karanastasis, D.; Dimopoulos, M.A.; Bamias, A. Expression of α5-integrin, α7-integrin, Ε-cadherin, and N-cadherin in localized prostate cancer. Urol. Oncol. Semin. Orig. Investig. 2016, 34, 165.e11–165.e18. [Google Scholar] [CrossRef]
- Cereda, V.; Formica, V.; Menghi, A.; Pellicori, S.; Roselli, M. Kallikrein-related peptidases targeted therapies in prostate cancer: Perspectives and challenges. Expert Opin. Investig. Drugs 2015, 24, 929–947. [Google Scholar] [CrossRef]
- DeHaan, A.M.; Wolters, N.M.; Keller, E.T.; Ignatoski, K. EGFR ligand switch in late stage prostate cancer contributes to changes in cell signaling and bone remodeling. Prostate 2009, 69, 528–537. [Google Scholar] [CrossRef] [Green Version]
- Kharmate, G.; Hosseini-Beheshti, E.; Caradec, J.; Chin, M.Y.; Guns, E.S.T. Epidermal Growth Factor Receptor in Prostate Cancer Derived Exosomes. PLoS ONE 2016, 11, e0154967. [Google Scholar] [CrossRef]
- Soulitzis, N.; Karyotis, I.; Delakas, D.; Spandidos, D. Expression analysis of peptide growth factors VEGF, FGF2, TGFB1, EGF and IGF1 in prostate cancer and benign prostatic hyperplasia. Int. J. Oncol. 2006, 29, 305–314. [Google Scholar] [CrossRef]
- Chen, W.; Chen, G. The Roles of Vitamin A in the Regulation of Carbohydrate, Lipid, and Protein Metabolism. J. Clin. Med. 2014, 3, 453–479. [Google Scholar] [CrossRef] [Green Version]
- Huss, W.J.; Lai, L.; Barrios, R.J.; Hirschi, K.K.; Greenberg, N.M. Retinoic acid slows progression and promotes apoptosis of spontaneous prostate cancer. Prostate 2004, 61, 142–152. [Google Scholar] [CrossRef]
- Chopra, D.P.; Wilkoff, L.J. β-retinoic acid inhibits and reverses testosterone-induced hyperplasia in mouse prostate organ cultures. Nature 1977, 265, 339–341. [Google Scholar] [CrossRef]
- Yu, L.; Shi, J.; Cheng, S.; Zhu, Y.; Zhao, X.; Yang, K.; Du, X.; Klocker, H.; Yang, X.; Zhang, J. Estrogen Promotes Prostate Cancer Cell Migration via Paracrine Release of ENO1 from Stromal Cells. Mol. Endocrinol. 2012, 26, 1521–1530. [Google Scholar] [CrossRef] [Green Version]
- Protopsaltis, I.; Ploumidis, A.; Sergentanis, T.N.; Constantoulakis, P.; Tzirogiannis, K.; Kyprianidou, C.; Papazafiropoulou, A.K.; Melidonis, A.; Delakas, D. Linking Pre-Diabetes with Benign Prostate Hyperplasia. IGFBP-3: A Conductor of Benign Prostate Hyperplasia Development Orchestra? PLoS ONE 2013, 8, e81411. [Google Scholar] [CrossRef]
- Liu, J.; Peng, Y.; Shi, L.; Wan, L.; Inuzuka, H.; Long, J.; Guo, J.; Zhang, J.; Yuan, M.; Zhang, S.; et al. Skp2 dictates cell cycle-dependent metabolic oscillation between glycolysis and TCA cycle. Cell Res. 2021, 31, 80–93. [Google Scholar] [CrossRef]
- Ho, S.-M.; Leav, I.; Ghatak, S.; Merk, F.; Jagannathan, V.S.; Mallery, K. Lack of Association between Enhanced TRPM-2/Clusterin Expression and Increased Apoptotic Activity in Sex-Hormone-Induced Prostatic Dysplasia of the Noble Rat. Am. J. Pathol. 1998, 153, 131–139. [Google Scholar] [CrossRef] [Green Version]
- Nalivaeva, N.N.; Zhuravin, I.A.; Turner, A.J. Neprilysin expression and functions in development, ageing and disease. Mech. Ageing Dev. 2020, 192, 111363. [Google Scholar] [CrossRef] [PubMed]
- Cowan, R.A.; Cowan, S.K.; Giles, C.A.; Grant, J.K. Prostatic distribution of sex hormone-binding globulin and cortisol-binding globulin in benign hyperplasia. J. Endocrinol. 1976, 71, 121–131. [Google Scholar] [CrossRef] [PubMed]
- Nascimento-Gonçalves, E.; Seixas, F.; Silva, M.; Fardilha, M.; Ferreira, R.; Neuparth, M.J.; Faustino-Rocha, A.I.; Colaço, B.; Venâncio, C.; Barros, L.; et al. The influence of Castanea sativa Mill. flower extract on hormonally and chemically induced prostate cancer in a rat model. Food Funct. 2021, 12, 2631–2643. [Google Scholar] [CrossRef] [PubMed]
- Bosland, M.C. Animal models for the study of prostate carcinogenesis. J. Cell. Biochem. 1992, 50, 89–98. [Google Scholar] [CrossRef] [PubMed]
- Perez-Riverol, Y.; Bai, J.; Bandla, C.; García-Seisdedos, D.; Hewapathirana, S.; Kamatchinathan, S.; Kundu, D.J.; Prakash, A.; Frericks-Zipper, A.; Eisenacher, M.; et al. The PRIDE database resources in 2022: A hub for mass spectrometry-based proteomics evidences. Nucleic Acids Res. 2022, 50, D543–D552. [Google Scholar] [CrossRef]
- Bardou, P.; Mariette, J.; Escudié, F.; Djemiel, C.; Klopp, C. jvenn: An interactive Venn diagram viewer. BMC Bioinform. 2014, 15, 293. [Google Scholar] [CrossRef] [Green Version]
- Szklarczyk, D.; Gable, A.L.; Nastou, K.C.; Lyon, D.; Kirsch, R.; Pyysalo, S.; Doncheva, N.T.; Legeay, M.; Fang, T.; Bork, P.; et al. The STRING database in 2021: Customizable protein–protein networks, and functional characterization of user-uploaded gene/measurement sets. Nucleic Acids Res. 2021, 49, D605–D612. [Google Scholar] [CrossRef]
- Caseiro, A.; Ferreira, R.; Quintaneiro, C.; Pereira, A.; Marinheiro, R.; Vitorino, R.; Amado, F. Protease profiling of different biofluids in type 1 diabetes mellitus. Clin. Biochem. 2012, 45, 1613–1619. [Google Scholar] [CrossRef]


| Cont1 (n = 8) | PCa1 (n = 10) | Cont2 (n = 10) | PCa2 (n = 14) | |
|---|---|---|---|---|
| Body weight (g) | 471.7 ± 27.8 | 408.5 ± 23.3 ** | 541.8 ± 44.9 *** | 494.6 ± 35.4 ####,+ |
| Body weight-to-tibial length ratio (g·cm−1) | 53.0 ± 3.3 | 46.8 ± 2.5 | 119.4 ± 9.5 **** | 112.5 ± 8.1 #### |
| Prostate weight (g) | 2.7 ± 0.3 | 4.4 ± 0.4 **** | 2.9 ± 0.3 | 4.8 ± 0.7 ++++ |
| Prostate-to- tibial length ratio (g·cm−1) | 0.3 ± 0.1 | 0.5 ± 0.1 **** | 0.6 ± 0.1 **** | 1.0 ± 0.1 ####,++++ |
| Gastrocnemius muscle weight (mg) | 4.7 ± 0.2 | 4.1 ± 0.4 ** | 4.4 ± 0.3 | 4.5 ± 0.3 |
| Gastrocnemius-to-body weight ratio (mg·g−1) | 1.0 ± 0.1 | 1.0 ± 0.1 | 0.8 ± 0.1 *** | 0.9 ± 0.1 ## |
| Adipose tissue weight (g) | 3.8 ± 0.6 | 3.4 ± 0.4 | 12.8 ± 3.5 **** | 9.8 ± 1.9 ###,+ |
| Adipose tissue-to-body weight ratio (mg·g−1) | 0.8 ± 0.2 | 0.8 ± 0.1 | 2.3 ± 0.5 **** | 2.0 ± 0.4 #### |
| Retroperitoneal adipose tissue weight (g) | 2.8 ± 0.4 | 2.7 ± 0.3 | 0.9 ± 0.4 **** | 0.8 ± 0.4 #### |
| Retroperitoneal adipose tissue-to-body weight ratio (mg·g−1) | 0.6 ± 0.1 | 0.6 ± 0.1 | 0.2 ± 0.1 **** | 0.1 ± 0.1 #### |
| Mesenteric adipose tissue weight (g) | 1.0 ± 0.2 | 0.7 ± 0.1 | 11.8 ± 3.3 **** | 9.1 ± 1.8 ####,+ |
| Mesenteric adipose tissue-to-body weight ratio (mg·g−1) | 0.2 ± 0.1 | 0.2 ± 0.1 | 2.2 ± 0.5 **** | 1.8 ± 0.3 #### |
| Cont1 | PCa1 | Cont2 | PCa2 | |
|---|---|---|---|---|
| Non-neoplastic alterations (atypia related to inflammation/functional hyperplasia/metaplasia) | 4/8 | 4/10 | 5/10 | 0/14 |
| Pre-neoplastic alterations (dysplasia) | 0 | 3/10 | 4/10 | 2/14 |
| Neoplasia | 0 | 3/10 | 1/10 | 12/14 |
| Gene Name/ UniProt ID | Protein Name | Fold Change | hPGC Protein Expression | |||
|---|---|---|---|---|---|---|
| PCa1 vs. Cont1 | PCa2 vs. Cont2 | Cont2 vs. Cont1 | PCa2 vs. PCa1 | |||
| Plbd2 ✓ | Putative phospholipase B-like 2 | 1.662 | medium | |||
| Fuca1 ✓ | Tissue alpha-L-fucosidase 1 | 1.929 | high | |||
| Rbp4 ✓ | Retinol-binding protein 4 | 1.225 | −1.438 | −2.352 | N/D | |
| Minpp1 ✓ | Multiple inositol polyphosphate phosphatase 1 | 1.305 | medium | |||
| Cdh2 ✗ | Cadherin-2 | −1.428 | N/D | |||
| Fetub ✓ | Fetuin-B | −1.294 | 1.808 | N/D | ||
| Eno1 ✓ | Alpha-enolase | 1.980 | 1.625 | medium | ||
| Ces1c | Carboxylesterase 1C | 1.531 | N/A | |||
| P08932 | T-kininogen 2 | 1.199 | 1.288 | N/A | ||
| Q5U2Q3 | Ester hydrolase C11orf54 homolog | −1.714 | −1.525 | N/A | ||
| Egf | Epidermal growth factor | −1.375 | −1.428 | no data | ||
| Idh2 ✓ | Isocitrate dehydrogenase | −1.923 | 2.071 | high | ||
| Mep1a ✓ | Meprin A subunit alpha | −1.337 | N/D | |||
| Cdh1 ✓ | Cadherin-1 | −1.323 | 1.215 | high | ||
| Q6LED0 | Histone H3.1 | 2.370 | N/A | |||
| Lgals5 | Galectin-5 | 1.411 | N/A | |||
| Serpina6 ✓ | Corticosteroid-binding globulin | 1.775 | N/D | |||
| Serping1 ✗ | Plasma protease C1 inhibitor | 1.555 | N/D | |||
| Clu ✗ | Clusterin | 1.996 | N/D | |||
| Mme ✓ | Neprilysin | −3.168 | high | |||
| Umod ✗ | Uromodulin | −4.900 | N/D | |||
| Klk9 ✗ | Submandibular glandular kallikrein-9 | −3.190 | N/D | |||
| Enpep ✗ | Glutamyl aminopeptidase | −1.558 | −1.549 | N/D | ||
| Cpq ✓ | Carboxypeptidase Q | −1.627 | −1.616 | low | ||
| Serpina1 ✓ | Protein Z-dependent protease inhibitor | 1.623 | N/D | |||
| Igg-2a | Ig gamma-2A chain C region | 2.089 | N/A | |||
| Cp ✓ | Ceruloplasmin | 1.984 | N/D | |||
| Mug1 | Murinoglobulin-1 | 2.170 | N/A | |||
| Tf ✗ | Serotransferrin | 1.909 | N/D | |||
| Lcn2 ✗ | Neutrophil gelatinase-associated lipocalin | 2.202 | N/D | |||
| Igh-1a | Ig gamma-2B chain C region | 2.785 | N/A | |||
| Hist1h4b ✓ | Histone H4;Osteogenic growth peptide | 1.902 | low | |||
| Fgg ✗ | Fibrinogen gamma chain | 9.933 | N/D | |||
| P02761 | Major urinary protein | −2.112 | N/A | |||
| Dpp7 ✓ | Dipeptidyl peptidase 2 | −1.874 | medium | |||
| Ambp ✗ | Protein AMBP | −1.492 | N/D | |||
| Gsn ✗ | Gelsolin | −1.540 | N/D | |||
| Hrsp12 ✗ | Ribonuclease UK114 | −1.739 | N/D | |||
| Psap ✓ | Sulfated glycoprotein 1 | −1.535 | High | |||
| Mep1b ✗ | Meprin A subunit beta | −1.681 | N/D | |||
| P81828 | Urinary protein 2 | −2.029 | N/A | |||
| Siae ✓ | Sialate O-acetylesterase | −1.510 | medium | |||
| Cspg4 ✓ | Chondroitin sulfate proteoglycan 4 | −1.464 | medium | |||
| Pvalb ✗ | Parvalbumin alpha | −1.439 | N/D | |||
| Cst3 ✓ | Cystatin-C | −1.361 | High | |||
| Pigr ✓ | Polymeric immunoglobulin receptor | −1.684 | N/D | |||
| Apcs ✗ | Serum amyloid P-component | −1.339 | N/D | |||
| Obp1f | Odorant-binding protein | −1.455 | N/A | |||
| Cd14 ✗ | Monocyte differentiation antigen CD14 | −1.746 | N/D | |||
Publisher’s Note: MDPI stays neutral with regard to jurisdictional claims in published maps and institutional affiliations. |
© 2022 by the authors. Licensee MDPI, Basel, Switzerland. This article is an open access article distributed under the terms and conditions of the Creative Commons Attribution (CC BY) license (https://creativecommons.org/licenses/by/4.0/).
Share and Cite
Moreira-Pais, A.; Nogueira-Ferreira, R.; Reis, S.; Aveiro, S.; Barros, A.; Melo, T.; Matos, B.; Duarte, J.A.; Seixas, F.; Domingues, P.; et al. Tracking Prostate Carcinogenesis over Time through Urine Proteome Profiling in an Animal Model: An Exploratory Approach. Int. J. Mol. Sci. 2022, 23, 7560. https://doi.org/10.3390/ijms23147560
Moreira-Pais A, Nogueira-Ferreira R, Reis S, Aveiro S, Barros A, Melo T, Matos B, Duarte JA, Seixas F, Domingues P, et al. Tracking Prostate Carcinogenesis over Time through Urine Proteome Profiling in an Animal Model: An Exploratory Approach. International Journal of Molecular Sciences. 2022; 23(14):7560. https://doi.org/10.3390/ijms23147560
Chicago/Turabian StyleMoreira-Pais, Alexandra, Rita Nogueira-Ferreira, Stephanie Reis, Susana Aveiro, António Barros, Tânia Melo, Bárbara Matos, José Alberto Duarte, Fernanda Seixas, Pedro Domingues, and et al. 2022. "Tracking Prostate Carcinogenesis over Time through Urine Proteome Profiling in an Animal Model: An Exploratory Approach" International Journal of Molecular Sciences 23, no. 14: 7560. https://doi.org/10.3390/ijms23147560