Article

Characterisation of LTR-Retrotransposons of Stevia rebaudiana and Their Use for the Analysis of Genetic Variability

Department of Agriculture, Food and Environment (DAFE), University of Pisa, Via del Borghetto 80, 56124 Pisa, Italy
*
Authors to whom correspondence should be addressed.
These authors contributed equally to this work.
Int. J. Mol. Sci. 2022, 23(11), 6220; https://doi.org/10.3390/ijms23116220
Submission received: 24 March 2022 / Revised: 25 May 2022 / Accepted: 30 May 2022 / Published: 1 June 2022
(This article belongs to the Special Issue Transposable Elements and Phenotypic Variation in Plants)

Abstract

:
Stevia rebaudiana is one of the most important crops belonging to the Asteraceae family. Stevia is cultivated all over the world as it represents a valid natural alternative to artificial sweeteners thanks to its leaves, which produce steviol glycosides that have high sweetening power and reduced caloric value. In this work, the stevia genome sequence was used to isolate and characterise full-length long-terminal repeat retrotransposons (LTR-REs), which account for more than half of the genome. The Gypsy retrotransposons were twice as abundant as the Copia ones. A disproportionate abundance of elements belonging to the Chromovirus/Tekay lineage was observed among the Gypsy elements. Only the SIRE and Angela lineages represented significant portions of the genome among the Copia elements. The dynamics with which LTR-REs colonised the stevia genome were also estimated; all isolated full-length elements turned out to be relatively young, with a proliferation peak around 1–2 million years ago. However, a different analysis conducted by comparing sequences encoding retrotranscriptase showed the occurrence of an older period in which there was a lot of LTR-RE proliferation. Finally, a group of isolated full-length elements belonging to the lineage Angela was used to analyse the genetic variability in 25 accessions of S. rebaudiana using the Inter-Retrotransposon Amplified Polymorphism (IRAP) protocol. The obtained fingerprints highlighted a high degree of genetic variability and were used to study the genomic structures of the different accessions. It was hypothesised that there are four ancestral subpopulations at the root of the analysed accessions, which all turned out to be admixed. Overall, these data may be useful for genome sequence annotations and for evaluating genetic variability in this species, which may be useful in stevia breeding.

1. Introduction

Repeated sequences constitute a large part of the eukaryotic genome, especially in species with large genomes. They include tandem-arranged satellite sequences, ribosomal DNA, telomeric DNA sequences, and, mostly, transposable elements (TEs) [1]. TEs can autonomously replicate and move across different parts of the host genome [2]. They belong to two major classes, Class I or retrotransposons (REs) and Class II or DNA transposons, according to the mechanism by which they transpose. Class I elements transpose through a “copy and paste” mechanism, using an RNA molecule as an intermediate for replication; instead, Class II TEs move through a “cut and paste” mechanism [3].
The most ubiquitous and abundant TEs are notoriously REs, especially those with long-terminal repeats (LTRs). RE abundance is related to their “copy and paste” mechanism of transposition, by which the element is first transcribed into an RNA molecule, then retro-transcribed to DNA, and finally inserted at another locus in the genome, determining an increase in RE copy number [2]. REs range in size from a few hundred base pairs to over 10 kb [2], and in the case of complete autonomous elements, they include a coding portion containing two open reading frames (ORFs) to be used for the replication and integration of the element in the host genome [4]. The coding portion is flanked by the two LTRs. The two ORFs include pol, which encodes a polyprotein (with a protease, a reverse transcriptase, an RNaseH, and an integrase enzyme domain), and gag, which encodes a virus-like particle structural protein. Autonomous REs have all of these enzyme domains, which are necessary for transposition. In cases where one or more enzyme domains are missing, non-autonomous LTR-REs can use enzymes produced by autonomous REs to retrotranspose [2].
Although REs have long been considered not to provide adaptive advantages to the host species and have therefore been termed “selfish” DNA [5], it is now largely accepted that REs have considerably contributed to the evolution of the genome of eukaryotic species. In addition to polyploidy, LTR-RE transposition is a key mechanism that produces genome size variation [6]. REs are involved in genome restructuration favouring chromosome structural changes; they supply chromatin boundary signals for heterochromatin domains, playing a central role in structuring the nucleus [7]. Even more importantly, RE repeats have a primary role in modifying the host’s regulatory network and, consequently, gene expression [8]. The insertion or loss of an LTR-RE can change promoters’ and enhancers’ structures, possibly altering the regulatory patterns of coding regions and leading to phenotypic variations [9,10,11,12]. Finally, LTR-RE insertion or loss can alter the phenotype, changing the epigenetic setting of a genetic locus, with consequences for chromatin organisation and the expression of adjacent genes [7,13].
The sequence similarity of LTR-REs among species is often minimal and limited to coding regions [2]. Plant LTR-REs are subdivided into two major superfamilies, Gypsy and Copia, according to sequence and structural similarities. The most striking difference between the two superfamilies refers to the linear order of the enzyme domains along the Pol protein. In angiosperms, many Gypsy and Copia lineages have been identified [14,15,16,17,18,19]. The main Gypsy lineages are Chromovirus, a lineage of REs carrying a chromodomain at the 5′ end of the coding portion, which are especially abundant in centromeres [15,20], and non-Chromovirus, subdivided into Athila and Tat and represented by large elements with a further open reading frame located upstream of the gag gene [19]. Copia LTR-REs can also belong to many different lineages, the most diffused being Ale, Ivana, Angela, Bianca, TAR, and SIRE [14,19,21].
In this work, we aimed to characterise the LTR-REs of Stevia rebaudiana Bertoni. S. rebaudiana represents one of the most important crops belonging to the Asteraceae family, native to South America and cultivated today all over the world, as it represents a valid natural alternative to artificial sweeteners. In fact, its leaves produce steviol glycosides (SVglys) with high sweetening power (about 300 times higher than sucrose) and a reduced caloric value. In addition to its sweetening properties, stevia stands out for its numerous pharmacological, antioxidant, anti-inflammatory, and antimicrobial properties [22,23].
Stevia shows wide climatic adaptability, successfully growing in a range of agroecological environments, including semi-humid, subtropical, and temperate zones, which is probably related to a wide genetic variability [24], reflecting its biochemical variability, i.e., regarding the yield of steviol glycosides in the leaves [25]. In its native area, stevia is grown as a perennial plant, especially at high altitudes [26]. In colder regions, it is grown as an annual crop [27].
Stevia breeding aims to produce higher-performing and yielding genotypes [28,29], selecting genotypes capable of adapting to different environmental conditions and characterised by both high levels of secondary metabolites and biomass yield. Therefore, evaluating the genetic variability among different accessions is important for carrying out breeding programmes [30,31].
S. rebaudiana (2n = 22) has quite a large genome [32]. A chromosome-level assembly of the stevia genome has been released based on Illumina, PacBio, and Hi-C sequencing [33]. The assembly covers 1416 Mb, and more than 80% is made of repeated sequences, especially LTR-REs, which amount to 65.07% of the genome, while other REs and DNA transposons represent only 4.38% and 5.83% of the genome, respectively [33]. However, the LTR-REs of S. rebaudiana have only been marginally investigated to date.
LTR-REs can be exploited to discover molecular markers [34,35]. The protocol generally consists of PCR amplification between a conserved retrotransposon feature and other conserved features in the genome. For example, in the case of inter-retrotransposon-amplified polymorphisms (IRAPs) [36], PCR amplification is obtained using a single primer that anneals to LTRs of two adjacent LTR-REs. IRAP markers are dominant, i.e., alleles at a locus are represented by the presence or absence of a DNA fragment, not distinguishing between homozygous and heterozygous loci. Given the ubiquity, abundance, dispersion, and dynamism of LTR-REs, IRAP markers can be conveniently used in species with large-sized genomes, such as S. rebaudiana.
In this work, we identified complete LTR-RE sequences (i.e., from 5′-LTR to 3′-LTR) in the available reference genome of stevia. The retrieved sequences were annotated at the lineage level, and some of them were selected for investigating LTR-RE-related genetic variability of different S. rebaudiana accessions by IRAP analysis.

2. Results

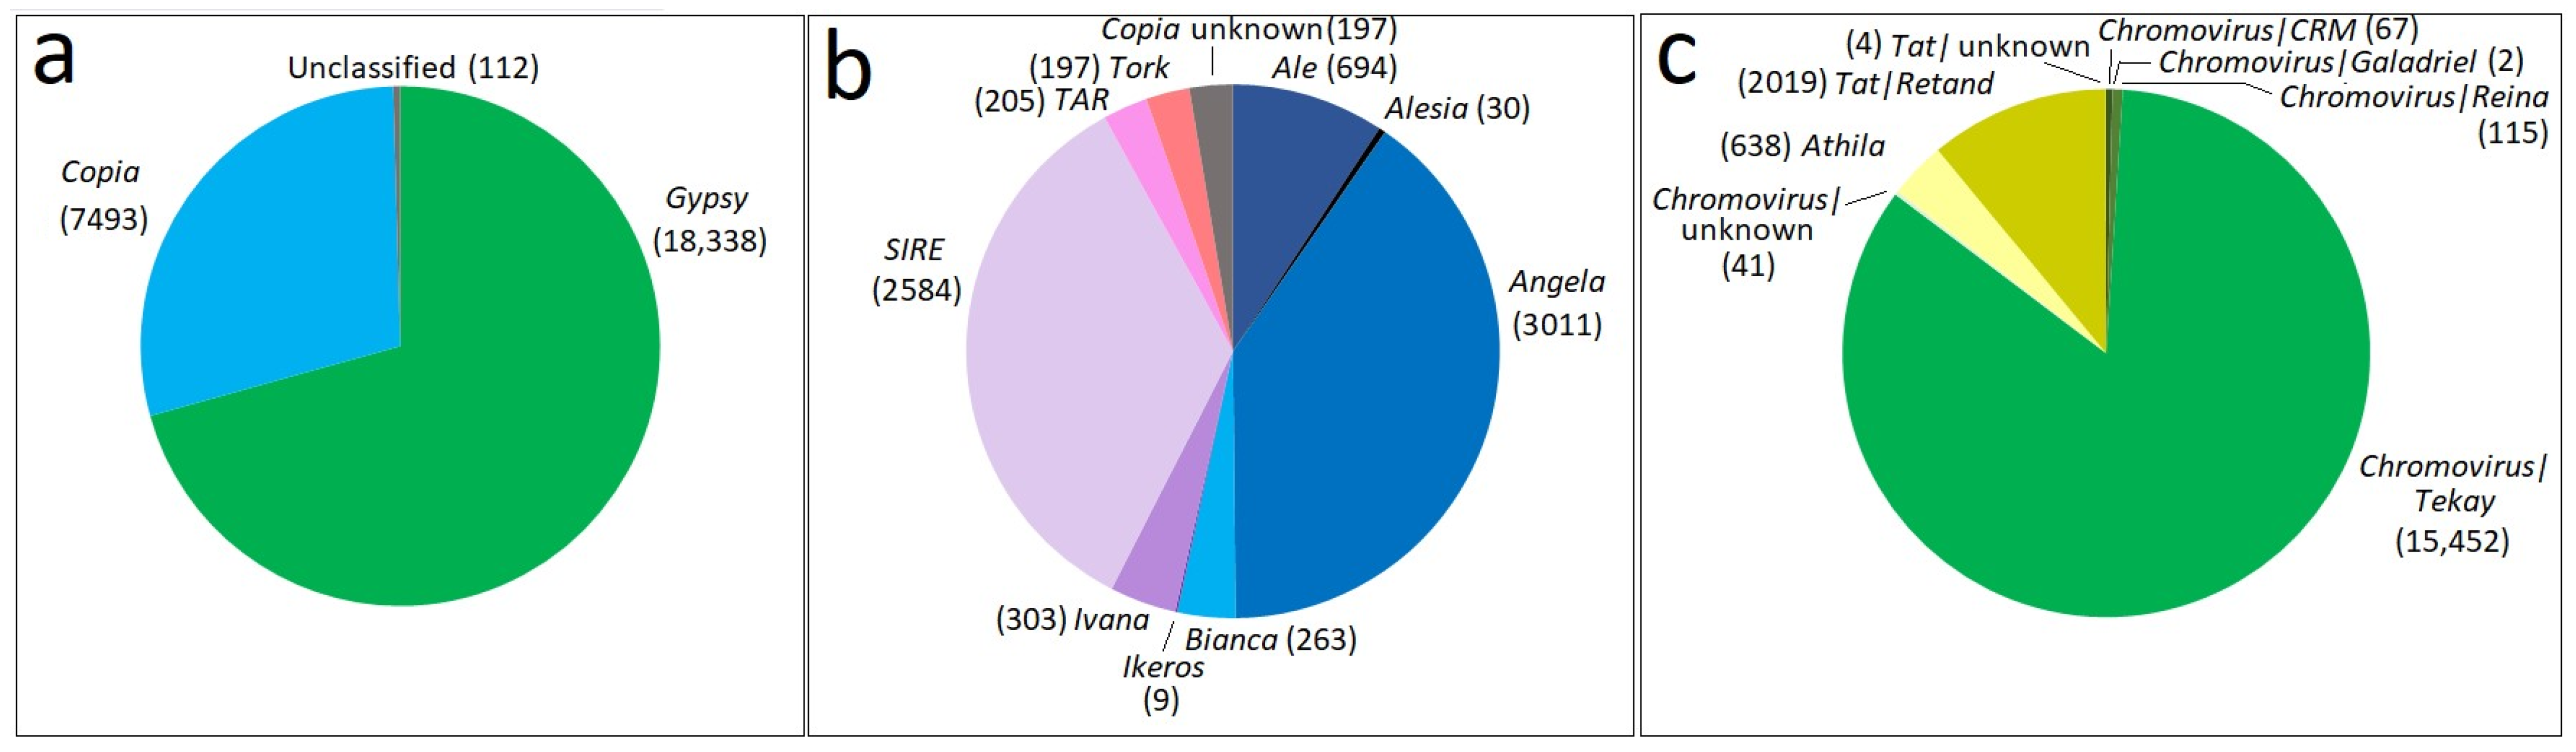
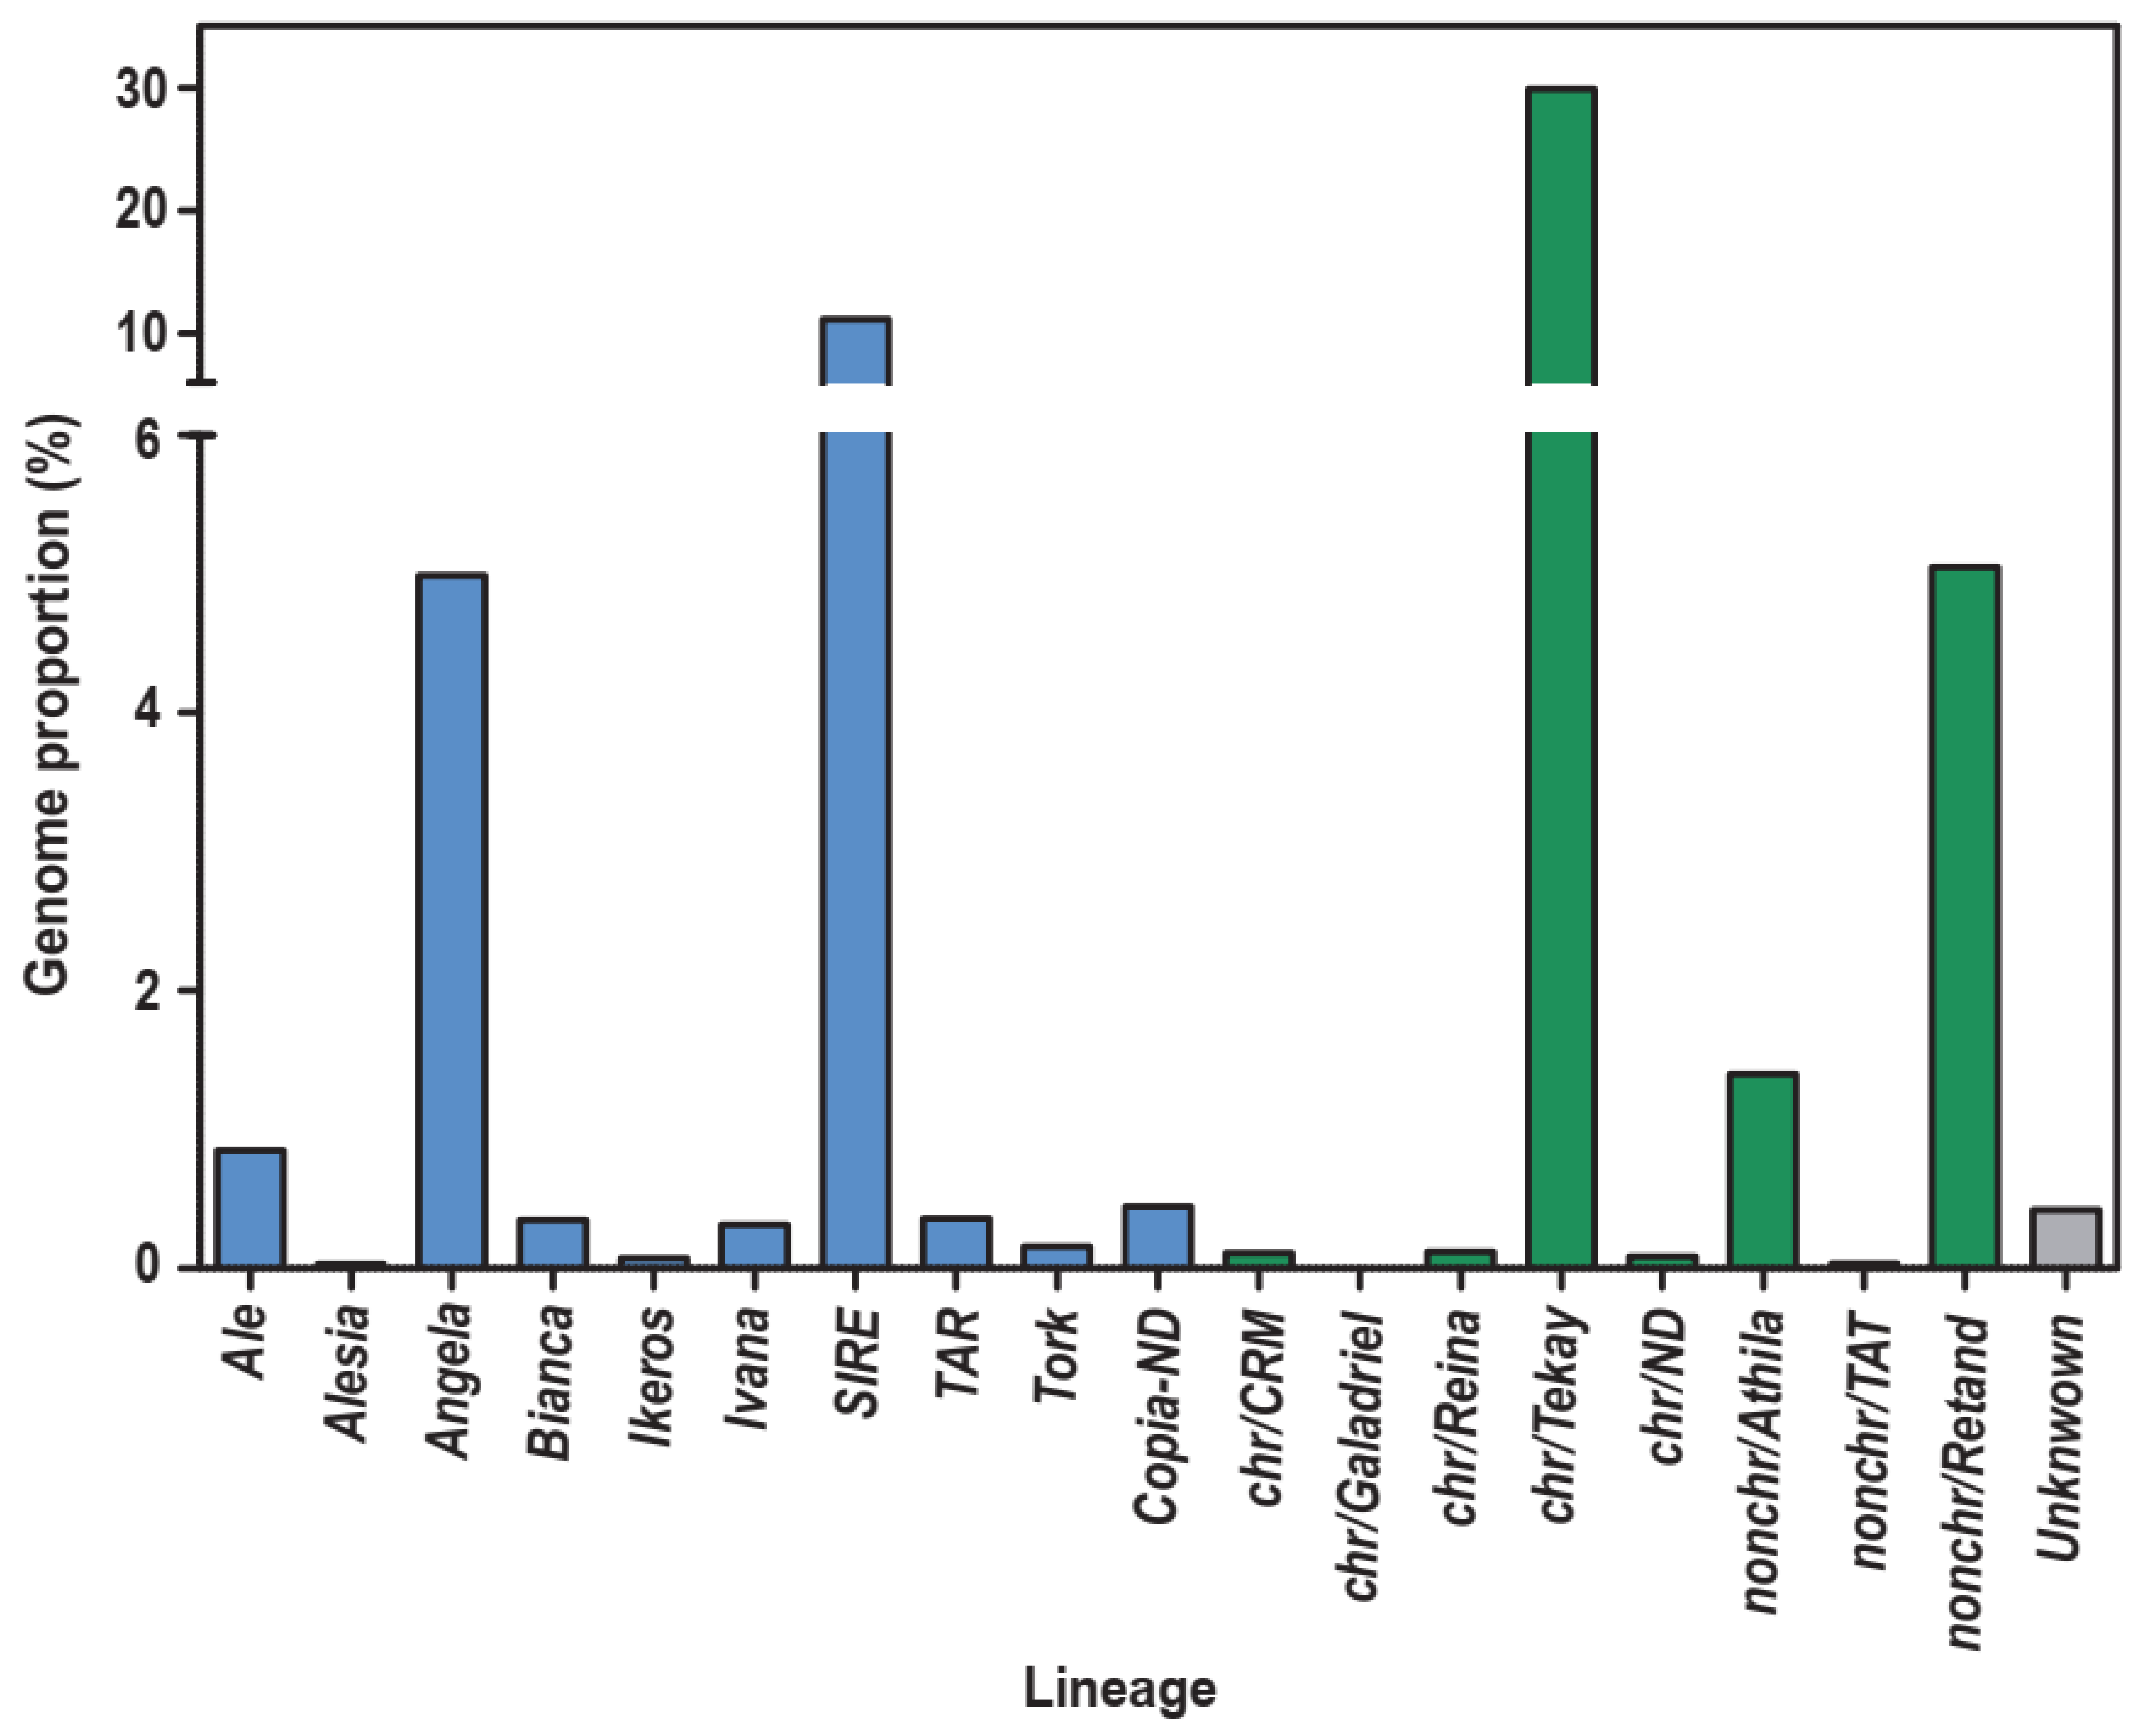
2.1. Identification and Characterisation of Full-Length LTR Retrotransposons in the S. rebaudiana Genome

To identify the LTR-REs, we chose to perform a structural analysis using LTRharvest [37]. This tool appears to be one of the most affordable for LTR-RE isolation [38]. A total of 25,943 full-length LTR-REs (i.e., both LTRs) were isolated from the stevia genome. Overall, 70.68% Gypsy and 28.88% Copia elements were classified according to protein domain- and homology-based annotation (Figure 1a). The number of Gypsy elements was about 2.4-fold higher than the Copia elements. However, 0.44% LTR-REs remained undetermined. As an additional highlight, 38.37% of elements showed all protein domains, whereas, in the remaining 61.63% of elements, at least one protein domain was missing; hence, they can be considered transpositionally non-autonomous.
LTR-REs were also annotated at the lineage level. With regard to the Copia superfamily (Figure 1b), 40.18% Angela, 34.49% SIRE and 9.26% Ale full-length elements were the most abundant. Additionally, 2.63% of Copia elements remained undetermined. The Angela lineage was predominant, followed by SIRE. Other lineages were less represented.
As for the Gypsy superfamily (Figure 1c), Chromovirus elements were the most abundant, with 85.49% of Gypsy elements. Chromovirus elements are mainly represented by Tekay elements (84.26%). Furthermore, 0.22% of Chromovirus elements remained undetermined. Regarding the non-Chromovirus lineages, 3.48% of Athila and 11.01% of Tat-Retand elements were characterised. For 0.2% of Tat elements, the sublineage remained undetermined. Tekay elements were by far predominant in the Chromovirus lineage and, more generally, in the Gypsy superfamily, followed by Tat-Retand elements.
Concerning the genomic abundance of LTR-REs in the stevia genome, mapping Illumina DNA reads to the full-length LTR-REs (see Methods) showed that full-length elements were mapped to 55.8% of the reads used in this analysis, representing 55.8% of the stevia genome. Gypsy was the most plentiful superfamily; in fact, Gypsy full-length elements accounted for 36.7% and Copia elements for 18.7% of the genome. LTR-REs, whose superfamily could not be identified, represented only 0.4% of the genome. The ratio between the genome proportions of Gypsy and Copia LTR-REs amounts to around 2:1, similar to other Asteraceae, in which Gypsy elements are by far the most represented.
Mapping Illumina DNA reads to the full-length LTR-REs was also performed at the lineage level. Figure 2 reports the genome proportions of each Copia and Gypsy lineage. The most represented lineages belonging to the Copia superfamily were SIRE (11.1% of the genome) and Angela (5.0%). As for the Gypsy superfamily, the most abundant lineage was Chromovirus/Tekay (29.9%), followed by Tat/Retand (5.0%) and Athila (1.4%). All other Copia and Gypsy lineages accounted for less than 1% of the genome (Figure 2).

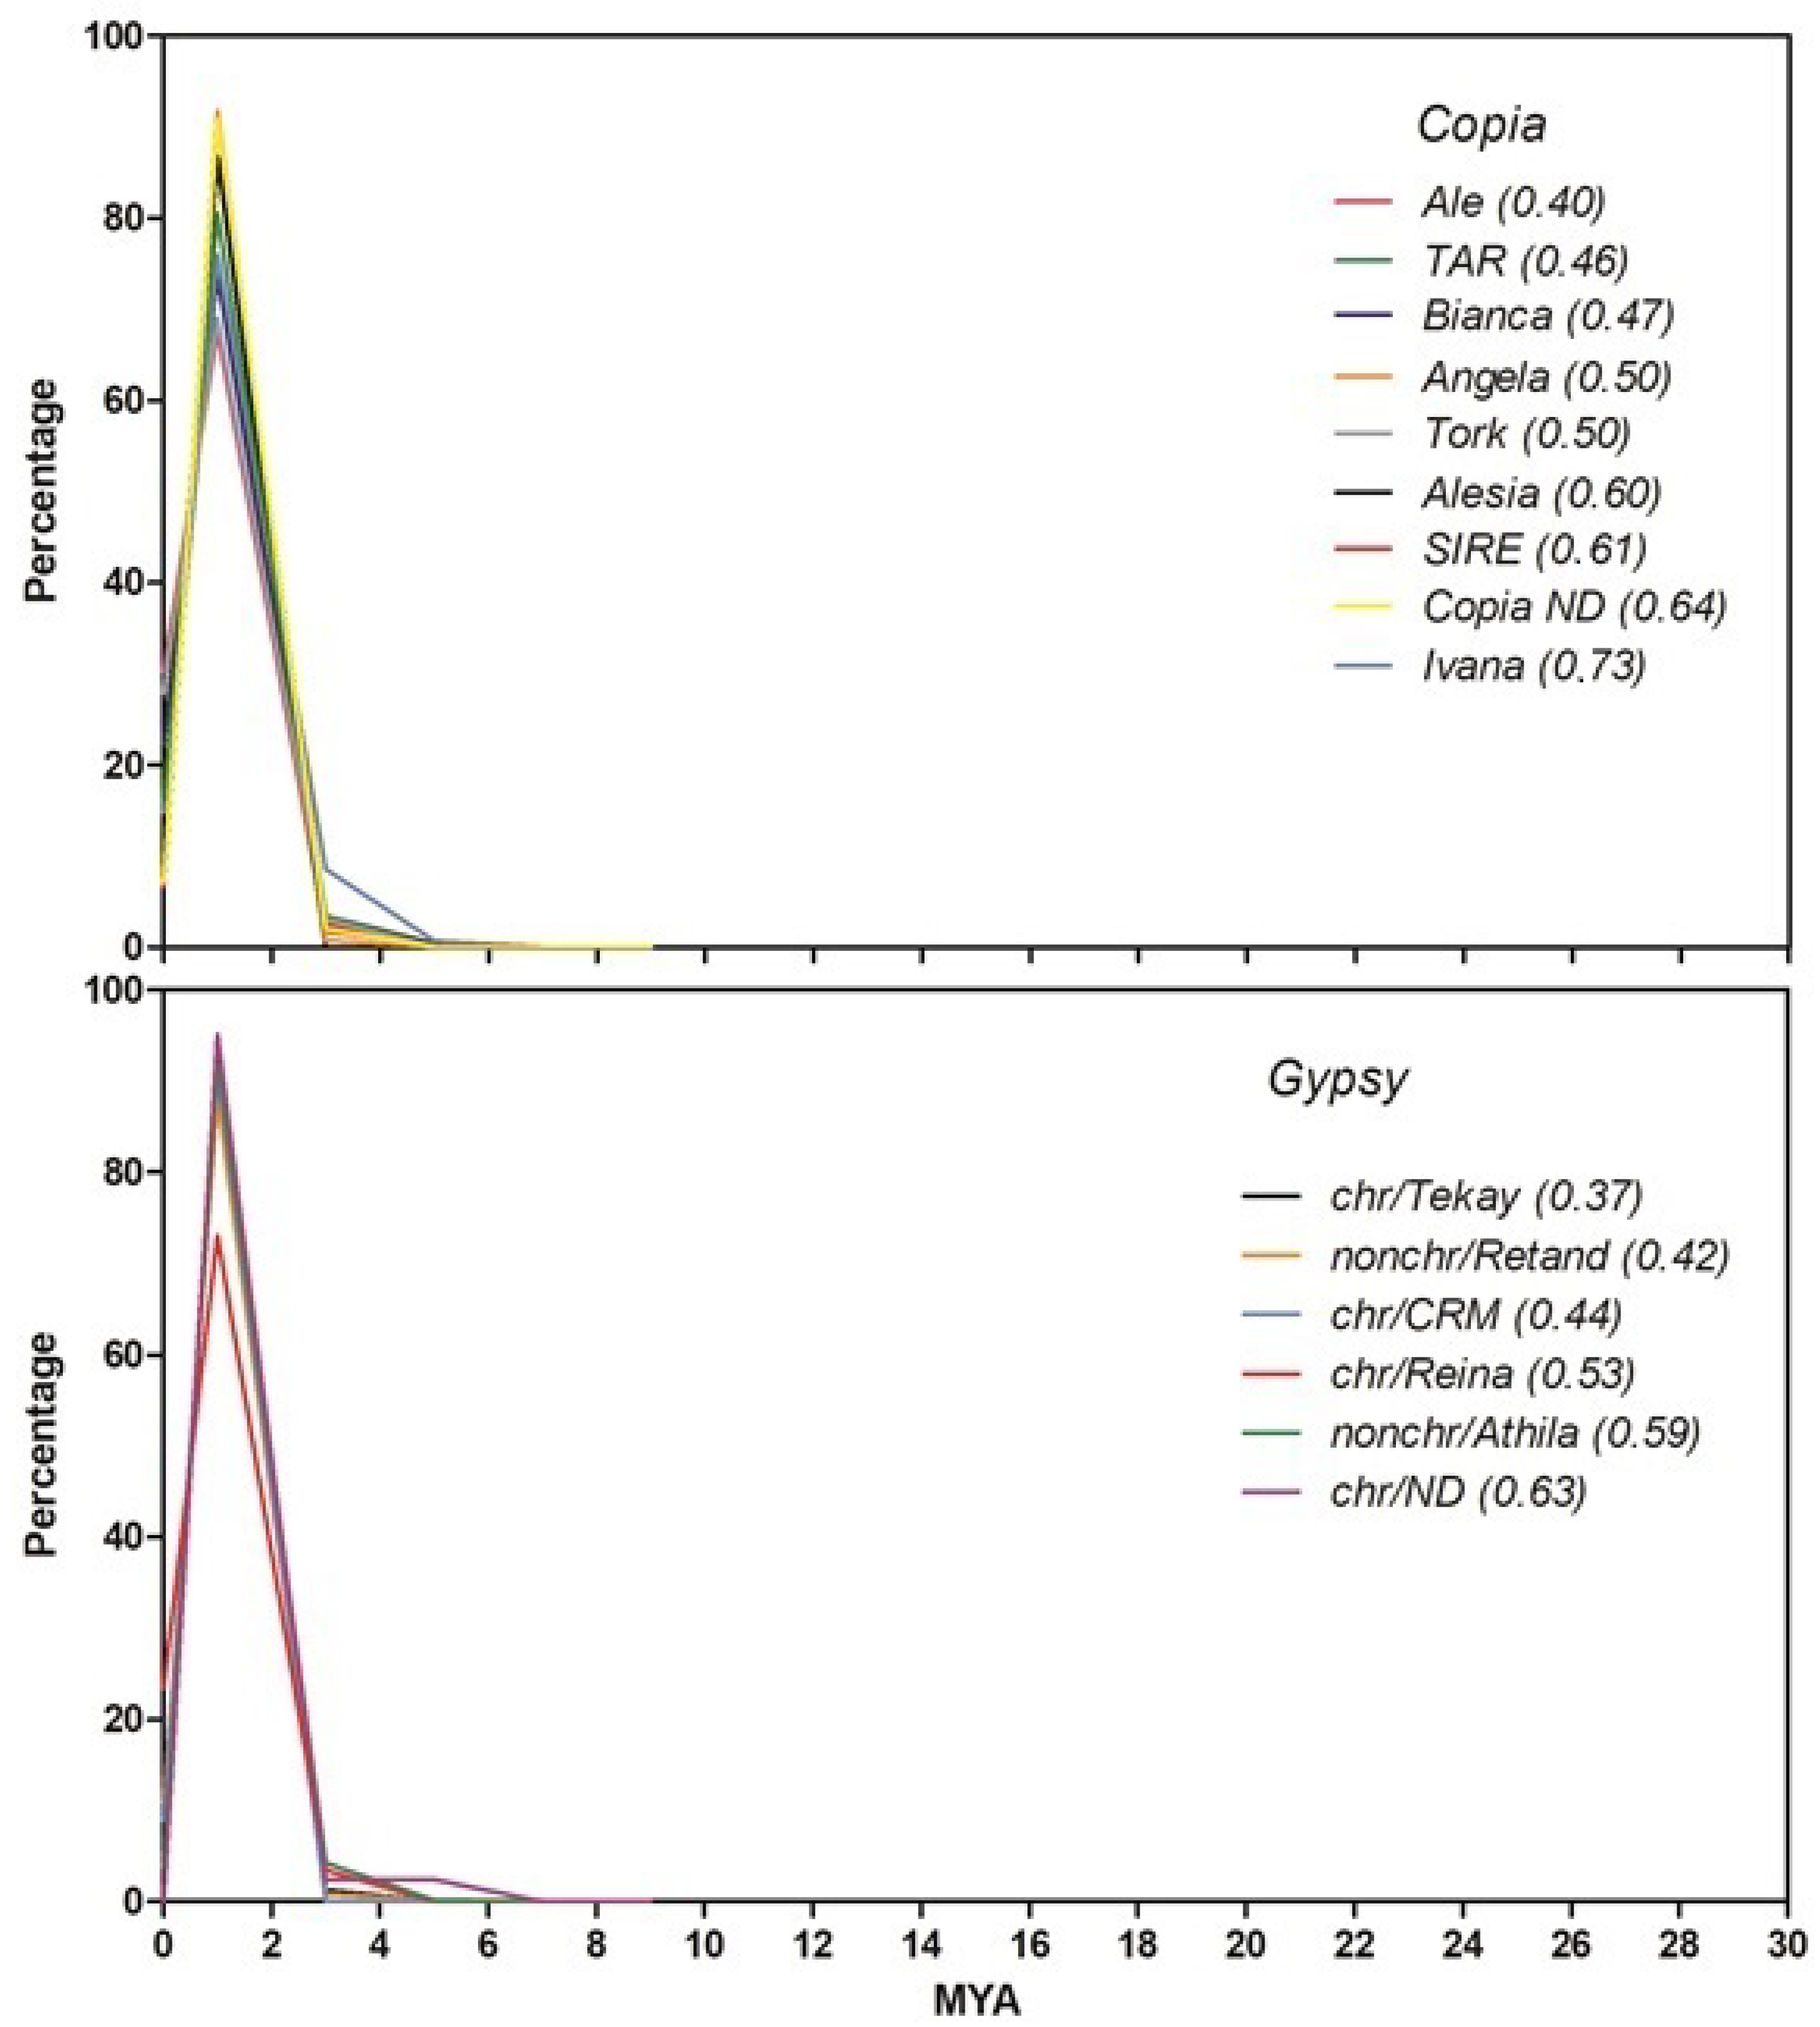
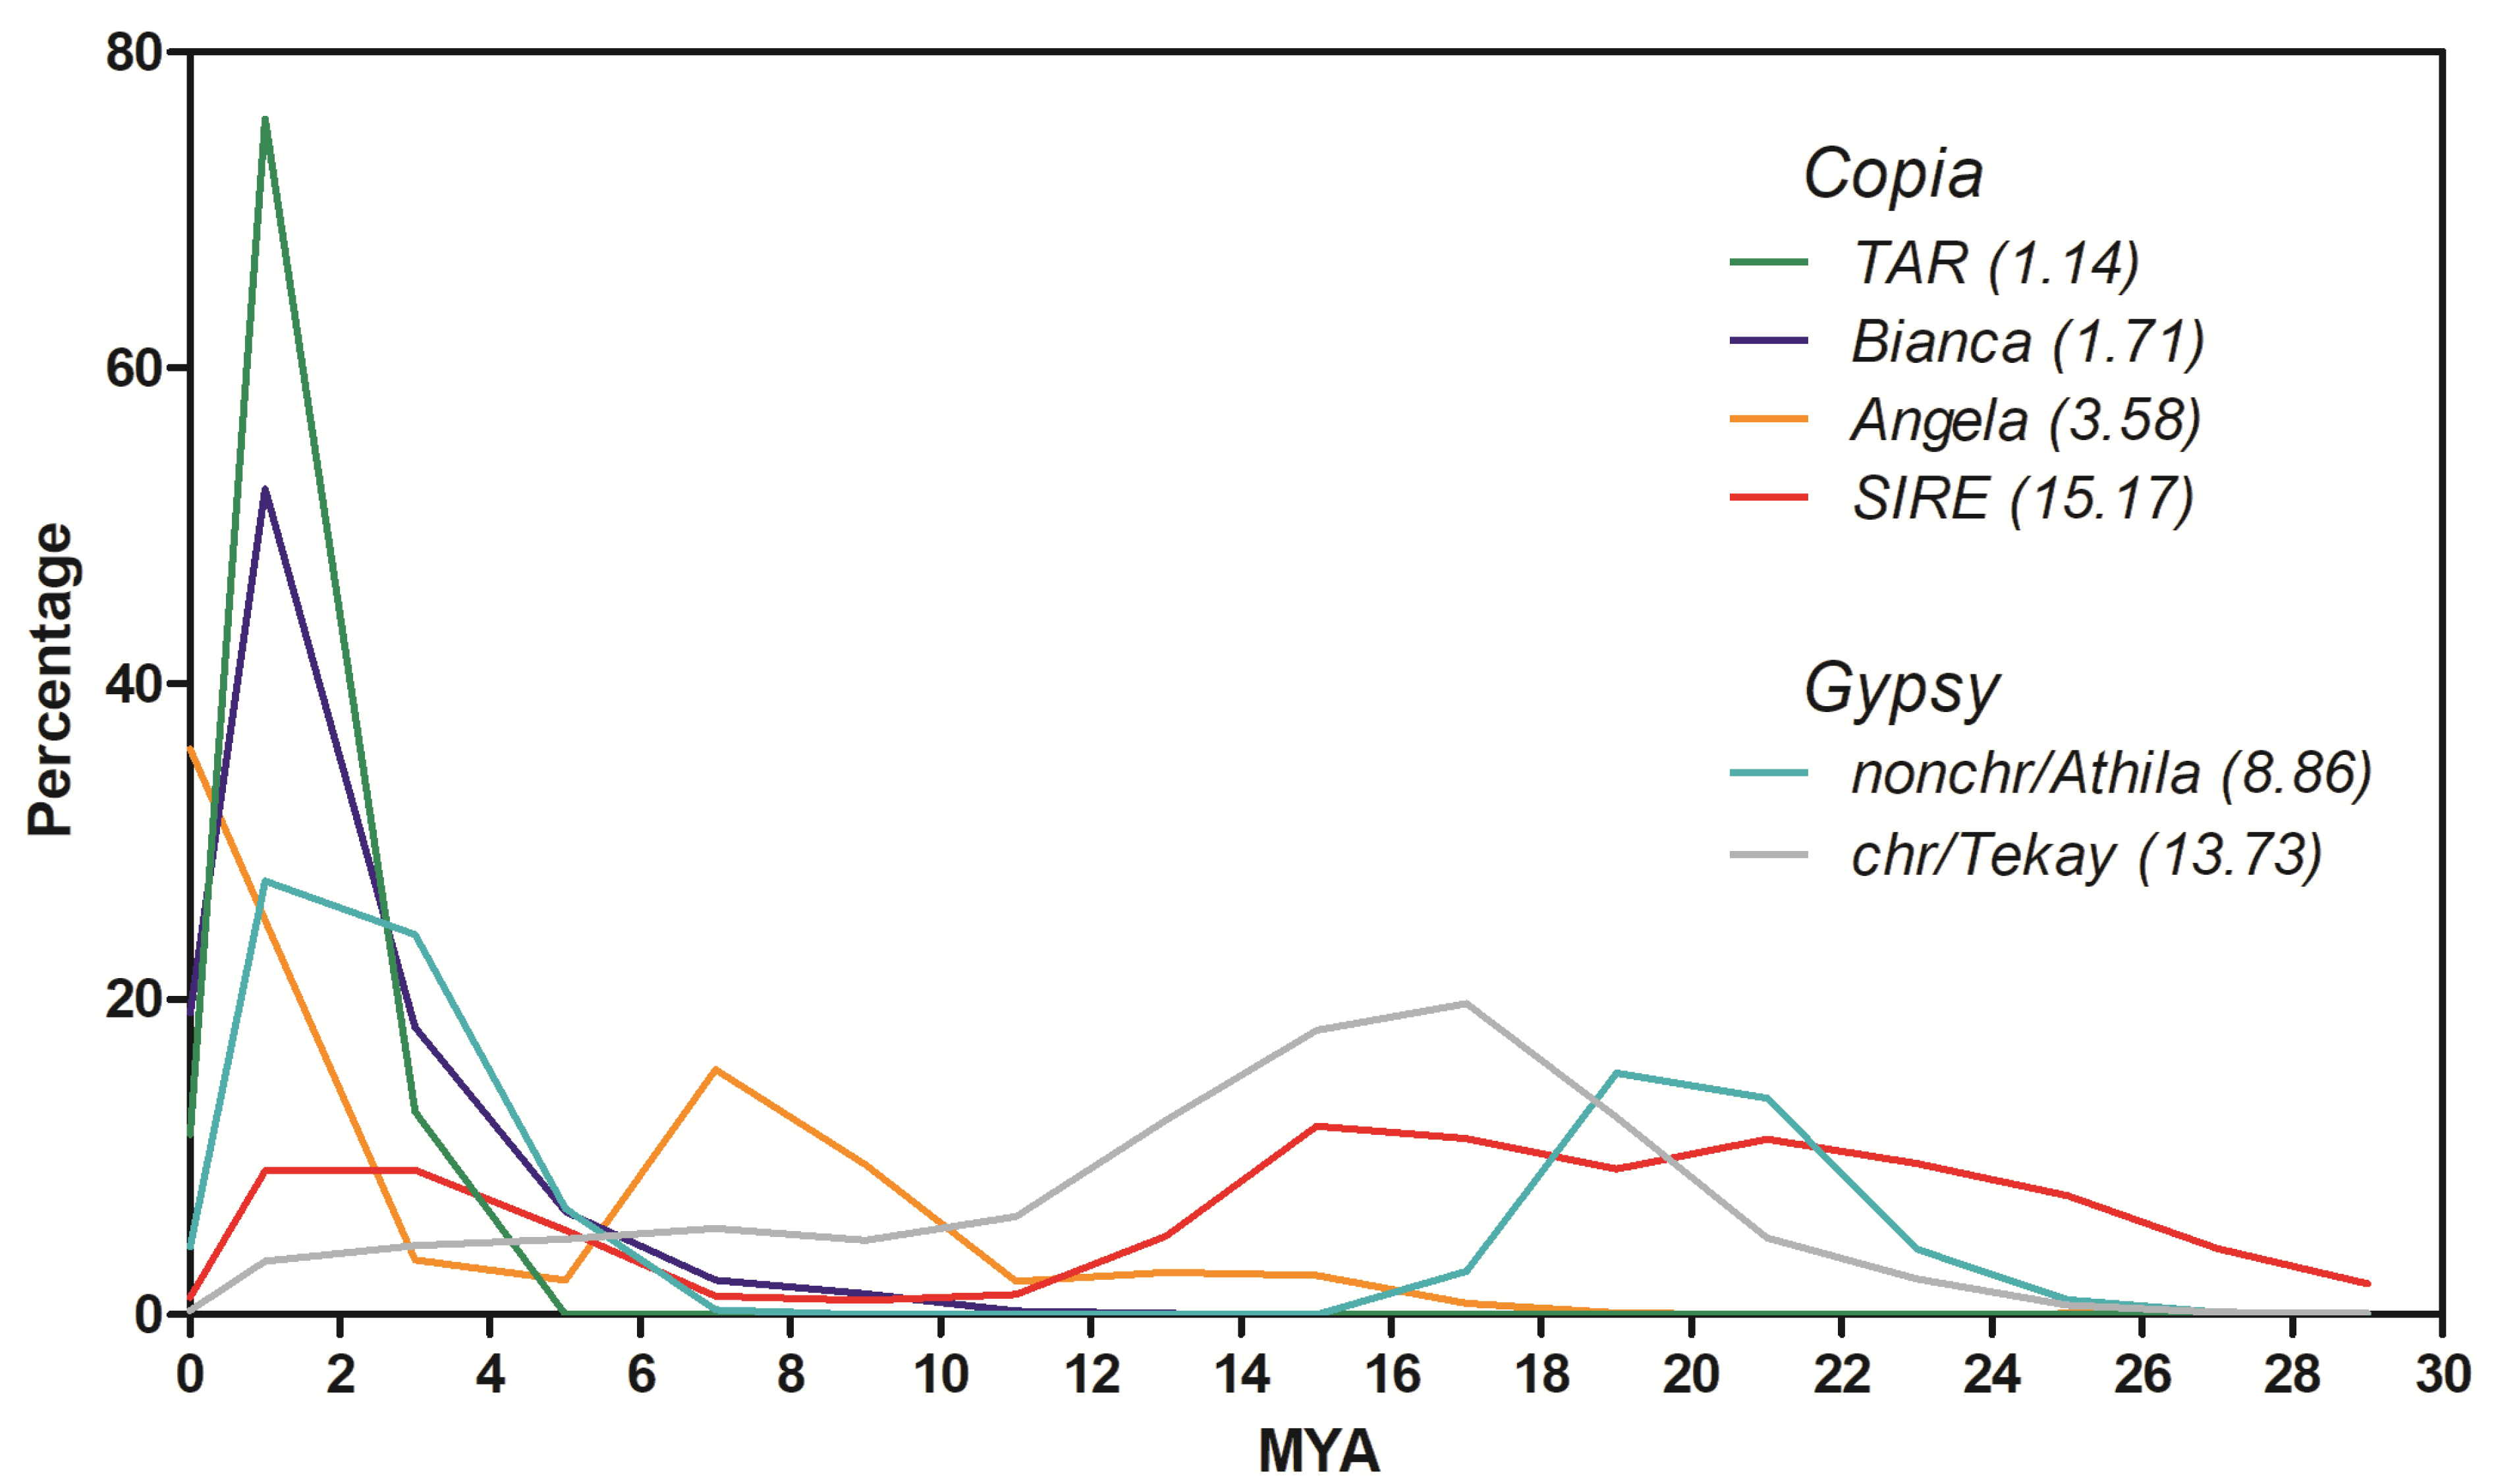
2.2. Insertion Time Profiles of Stevia LTR Retrotransposons

The proliferation time profiles of the most abundant Copia and Gypsy LTR-RE lineages in the stevia genome were first inferred by measuring pairwise distances between the LTRs of the same element. In fact, the two LTRs of a retrotransposon should be identical immediately after the insertion event and then undergo mutations over time [39]. Distances were then converted into insertion dates using a mutation rate that was twice the rate calculated for synonymous substitutions in Helianthus annuus gene sequences [40,41], presuming that repeats accumulate more mutations than genes as time passes [42]. Although the translation of genetic distances into insertion dates is subject to error, this analysis allowed us to compare proliferation waves among RE lineages.
The results of this analysis are reported in Figure 3. All lineages showed a transposition peak at 2 millions of years ago (MYA), although some lineages were younger on average: CRM and Tekay Chromovirus and Athila lineages for the Gypsy superfamily and Ale, Angela, Ivana and Tork lineages for the Copia superfamily (Figure 3).
The isolation of full-length elements is biased towards younger retrotransposons, since ancient elements are subject to more structural changes during evolutionary time. For this reason, insertion time profiles of LTR-RE lineages were also measured using another method, i.e., not based on LTR comparison of full-length elements but by calculating pairwise distances between paralogous RT-encoding sequences belonging to elements of the same lineage [43]. After assembling a sample of Illumina reads, we retrieved RT sequences of six Copia or Gypsy lineages and used these sequences to isolate DNA sequence reads for comparison. Distances were then translated into insertion dates using the same mutation rate described above. In fact, at each insertion, the new RE copy was identical to its parental element, except for mutations occurring during retrotranscription, which is error-prone [44]; further mutations can accumulate as time passes [42].
A one million read sample of Illumina reads was clustered using RepeatExplorer (see Methods). Using the same tool, clusters were searched for the presence of RT domains. Subsequently, the reads aligned to the RT domains were pairwise compared, and the proliferation time profiles of four Copia and two Gypsy lineages (i.e., those of which many aligned reads were available) were calculated. This analysis allowed us to identify different proliferation profiles depending on the different RE lineages analysed (Figure 4).
Two peaks of retrotranspositional activity, one relatively recent (around 1–2 MYA) and one more ancient (from 7–20 MYA, depending on the lineage), were observed. Copia/SIRE and Gypsy/Athila lineages showed two proliferation peaks, while Gypsy/Chromovirus/Tekay lineage showed only an ancient peak, and Copia/Bianca and Copia/TAR only the most recent peak (Figure 4). Interestingly, this analysis showed that Copia/Angela elements are the most active in proliferation at present (Figure 4).

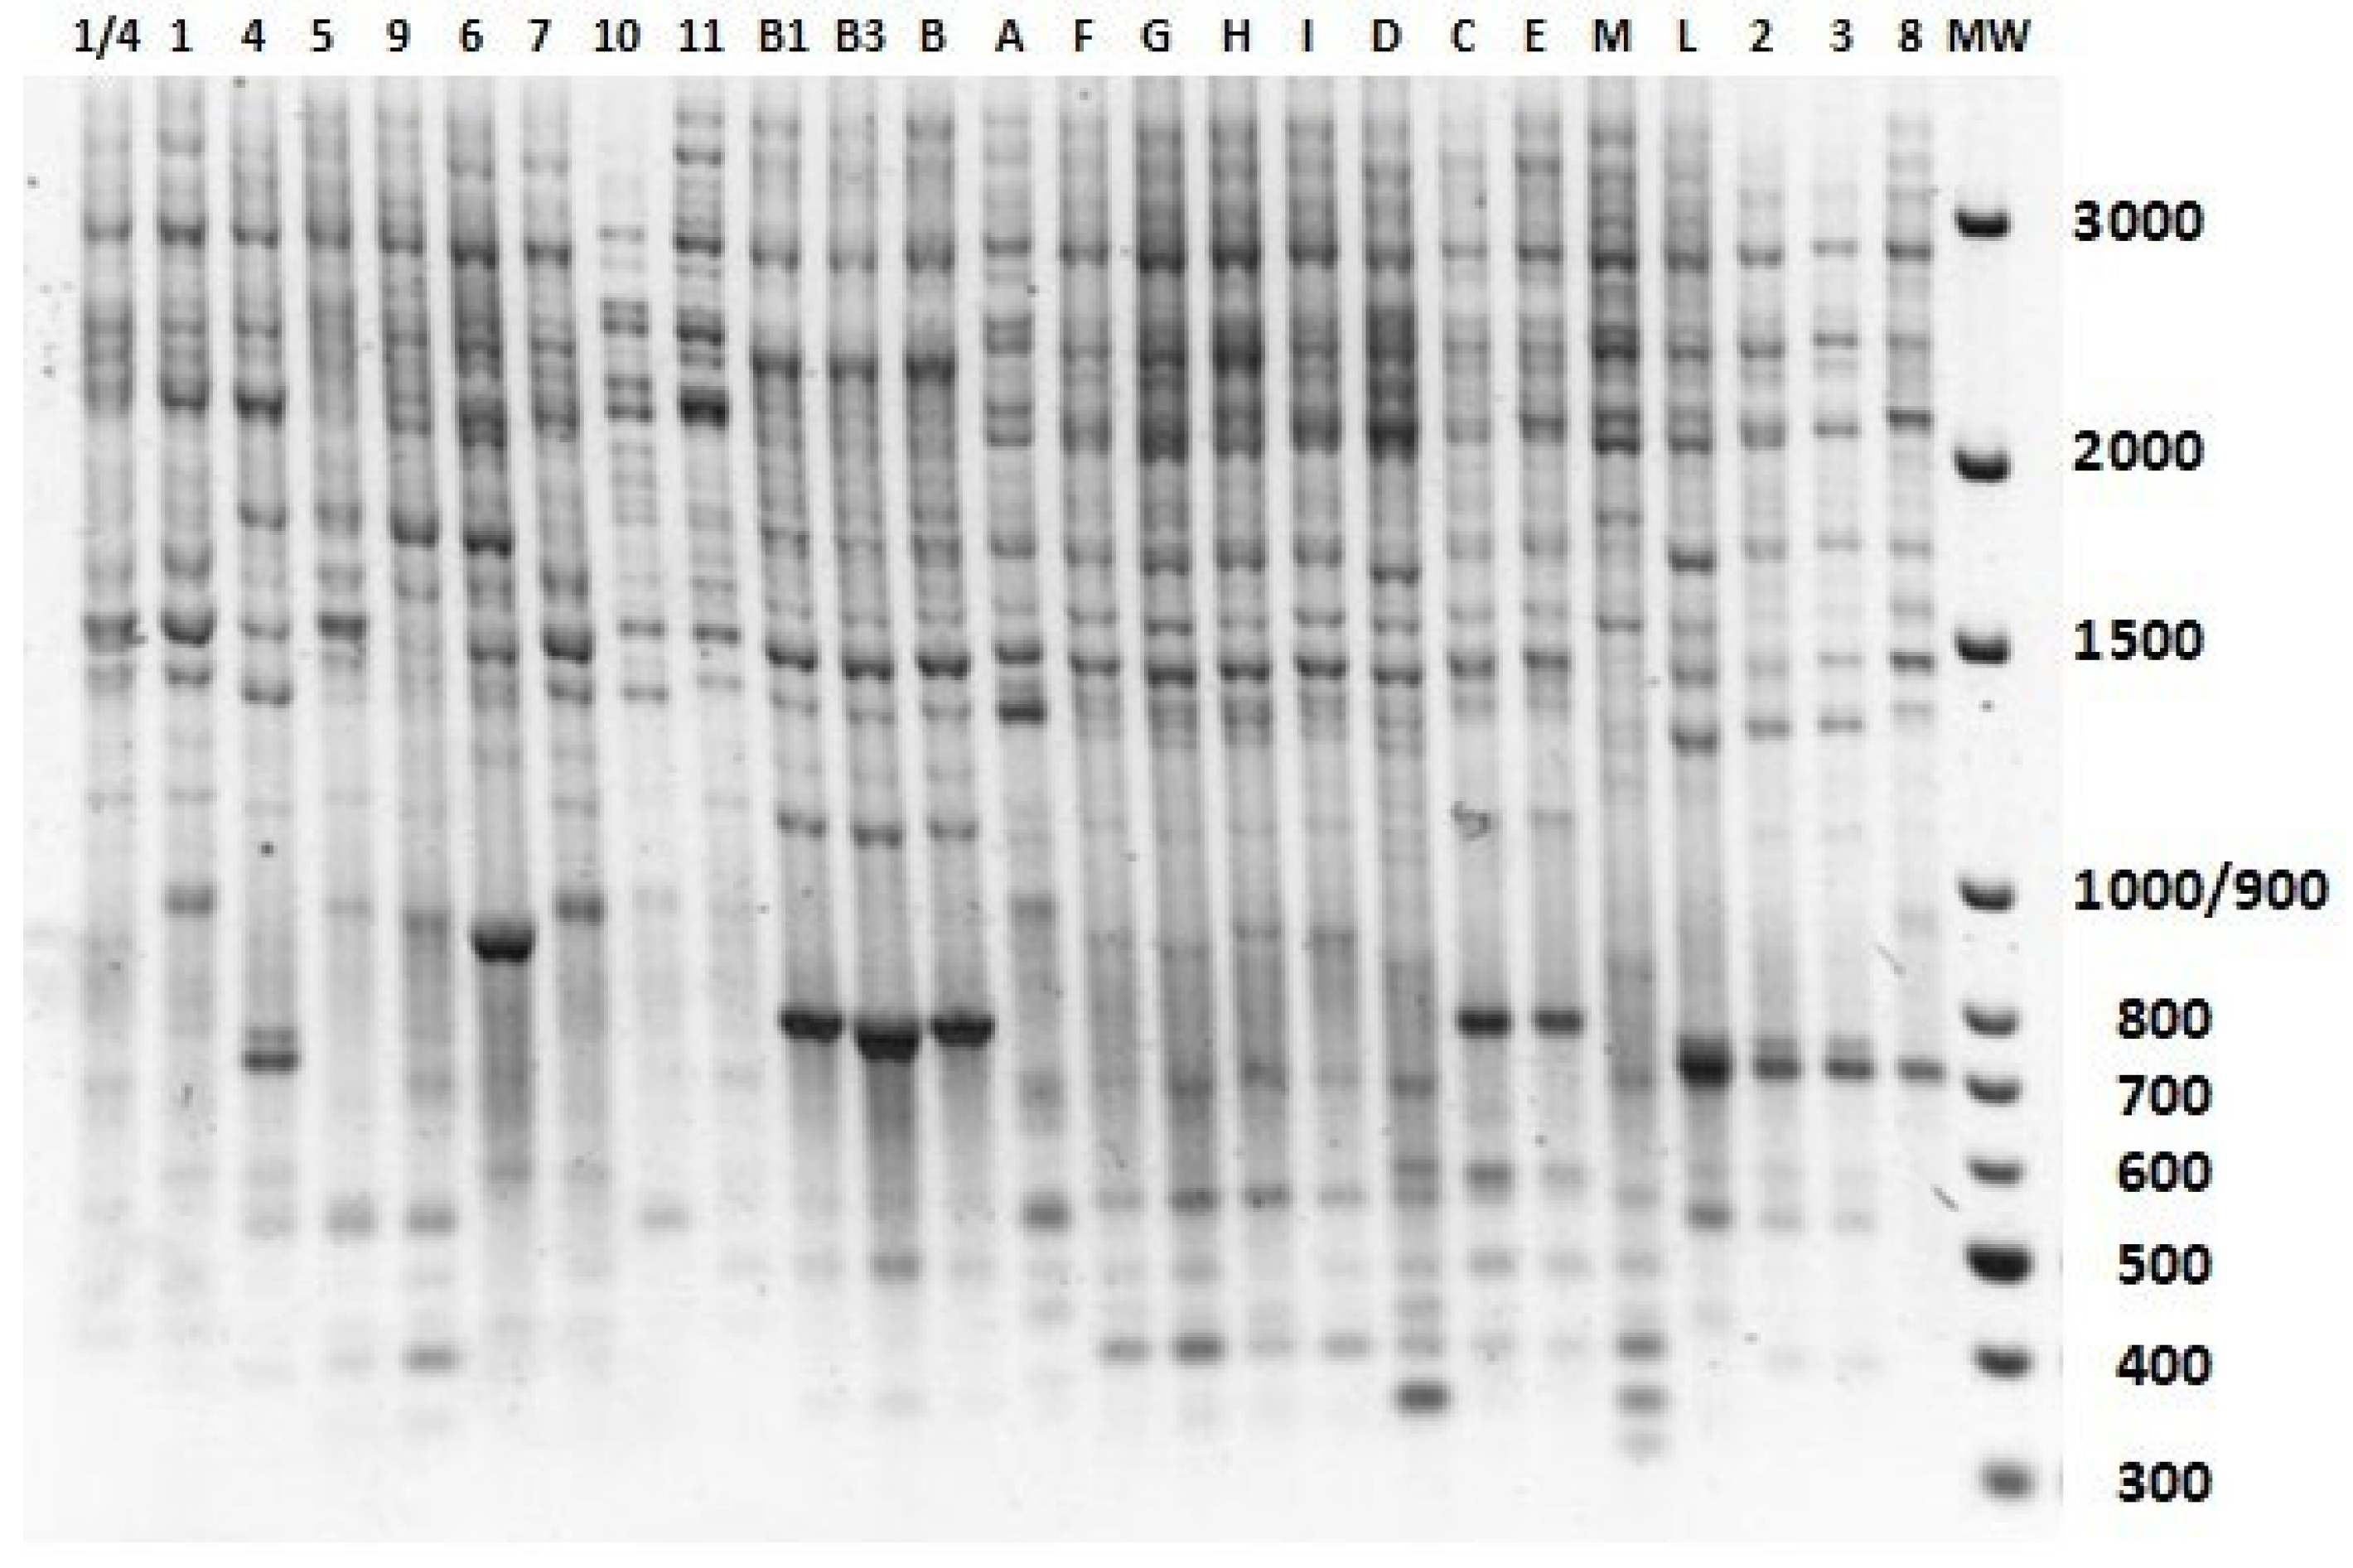
2.3. IRAP-Based Analysis of Genetic Variability among Stevia rebaudiana Accessions

In another set of experiments, we analysed the genetic variability in a small germplasm collection (25 accessions) of S. rebaudiana conserved at our department, performing the IRAP protocol [36] using primers designed on the sequences of LTR-REs. The IRAP protocol detects genomic loci bounded by long terminal repeats of two retrotransposons lying close enough to be amplified by PCR. IRAP PCR fragments can be produced using a single primer when two elements sharing the same LTR sequence are oriented head-to-tail or when two primers are designed on the LTRs of two different head-to-head oriented REs.
For this analysis, we selected a large group of LTR-REs showing large regions of similarity among at least 511 of the 3011 full-length elements belonging to the Angela lineage. Eleven oligonucleotides were designed on the LTRs of these full-length elements. They were tested by PCR on the DNA of three accessions (Supplementary Figure S1). Of the tested oligonucleotides, one (named ANG5+) produced a pattern consisting of several easily scorable bands, with many polymorphic amplification products among the genotypes used in this preliminary experiment, confirming that it identified the LTR region of a highly redundant element. BLAST analysis of the occurrence of this primer in the genome sequence of cv. ‘Zhongshan No. 7’ [33] confirmed the redundancy of the primer, evidencing 2271 copies in the genome. Consequently, primer 5+ was used to analyse all genotypes.
Polymorphic bands ranging from 100 to 3000 bp were produced. The electrophoretic patterns using primer 5+ are reported in Figure 5. Nearly identical patterns were obtained in three independent experiments. In rare cases of non-reproducible bands, they were excluded from subsequent analyses. Altogether, primer ANG5+ produced many amplified fragments, apparently related to the redundancy of the element identified by the primer; the observed polymorphism evidence variability in the loci in which these retrotransposons were inserted.
Among the 25 accessions, IRAP fingerprints produced 39 polymorphic bands. Accessions B, B1, and B3 showed an identical electrophoretic pattern, as expected since they are vegetatively propagated clones derived from the same Brazilian accession. In other cases, different accessions showed the same pattern, allowing clarification of their origins. For example, accessions C and E, despite coming from different Italian locations (Ragusa and Nocera), were found to have the same genotype. The same applies to samples 2 and 3 from Brazil (Figure 5). An IRAP fingerprint-based Principal Component Analysis (PCA), illustrating similarities among stevia accessions is reported in Supplementary Figure S2.

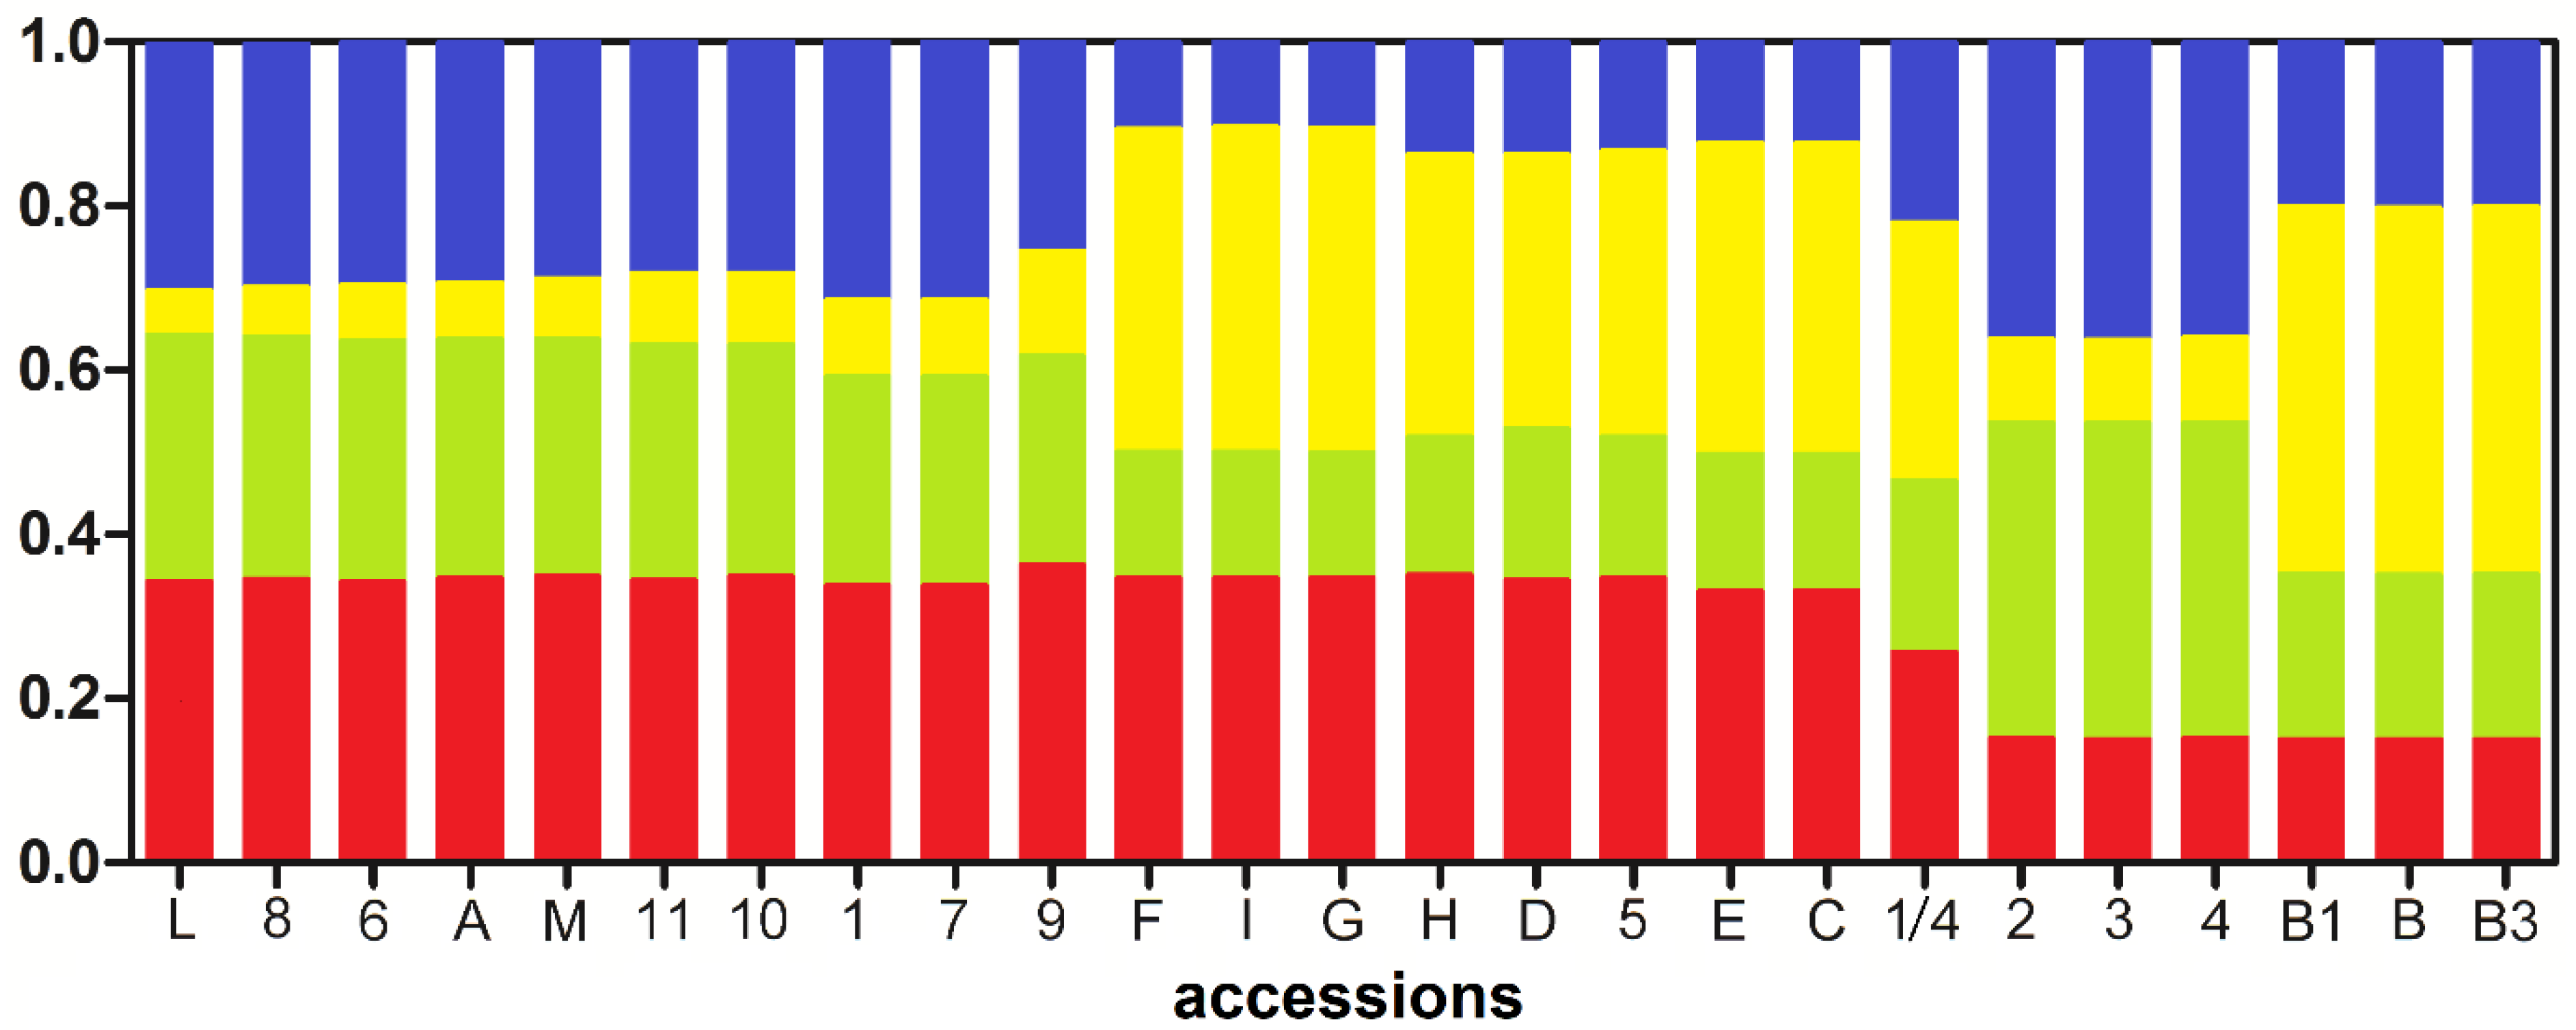
2.4. Analysis of Population Structure

The numerous bands obtained using primer ANG5+ represented a large number of loci in the stevia genome. In this sense, we used primer ANG5+ related polymorphism to analyse the genome structure of our stevia collection and the occurrence of admixed genotypes.
In Supplementary Figure S3, a schematic representation of the IRAP matrix is reported. The analysis of the population structure and the classification of stevia accessions into groups were performed using the Bayesian method in the STRUCTURE software [45]. The number of initial subpopulations (K) was defined as 1 to 25, performing seven replications per run. The maximum value of ΔK was obtained at K = 4 (Supplementary Figure S3). Therefore, in relation to the polymorphisms of full-length Angela LTR-REs, the analysed stevia accessions may consist of four ancestral subpopulations (Figure 6). A genotype can be unequivocally assigned to a subpopulation when its admixture coefficient (Qi) is >0.8 for that subpopulation [46,47]. Genotypes with intermediate admixture coefficients (i.e., with Qi < 0.8) are considered admixed. After STRUCTURE was applied, all analysed accessions were classified as admixed (Figure 6).
In order to obtain indications on the possibility of using the IRAP protocol for identifying chromosomal loci related to steviol glycoside content, the stevia genome sequence was investigated to establish whether genes potentially involved in steviol glycoside metabolism lie close to the loci individuated by the IRAP primer (ANG5+), i.e., within 100,000 bp upstream and 100,000 downstream. In particular, we collected a repertoire of 103 genes involved in steviol glycoside metabolism, as identified by BLAST analysis on the SwissProt manually curated a database against stevia protein sequences [33] (Simoni, personal communication) and searched for the occurrence of the ANG5+ primer sequence within 100,000 bp upstream and downstream of each gene. The occurrence of the ANG5+ primer was recorded in proximity to 35 of 103 SVglys genes, whereas a total of 16 ANG5+ primer was detected in proximity to 103 randomly collected genes. The Chi-square test showed a significant difference (p-value = 0.0036) in the occurrence of ANG5+ primer in the frame of 100,000 bp surrounding SVglys genes. Table 1 reports the gene families to which these 35 genes belong. This result suggests that the described IRAP protocol could be potentially used for identifying steviol glycoside content-related loci in the stevia genome. We are collecting a large number of stevia genotypes to carry on this analysis.

3. Discussion

3.1. Repetitive Component of the S. rebaudiana Genome

DNA sequencing of long sequence reads and new sequence-assembling strategies permit the achievement of much more precise genome sequences than before. In particular, genomes sequenced using long sequence reads allow for more precise and reliable structural identification and characterisation of repeated elements [38,48].
Our analyses allowed us to identify and characterise the full-length LTR-REs in the S. rebaudiana genome. The identification of repetitive DNA has already been reported by Xu et al. [33]. Concerning LTR-REs, Xu et al. [33] reported the identification of 653,092 elements, but they did not specify whether this number also included LTR-RE fragments. In fact, during genome evolution, LTR-REs are subject to rearrangements, producing several retrotransposon remnants [49,50]. The large difference between the number of elements reported by Xu et al. [33] and the number of full-length LTR-REs identified in our experiments (25,943) suggests that many of the elements were identified by Xu et al. [33] are RE fragments/remnants. As a matter of fact, in sunflower, where LTR-REs show an abundance similar to that observed in the stevia genome, the number of full-length elements is of the same order of magnitude as that found in stevia [51].
Full-length elements were annotated at the superfamily and lineage levels. Similar to other Asteraceae, such as the sunflower [52], full-length elements of the Copia superfamily are much less frequent than Gypsy. All main lineages of the LTR-REs are present in the stevia genome. Concerning the Copia superfamily, Angela elements were the most frequent, followed by SIRE LTR-REs, as observed in other Asteraceae, such as Lactuca sativa [51]. For the Gypsy superfamily, the most frequent lineage was by far Chromovirus, sublineage Tekay, as already reported for another Asteraceae genus, Hieracium [53]. All these species have medium-large genome sizes [51,53]. The prevalence of one superfamily or of one lineage over the others is not related to the genome size of the species [54], as expected, since REs are autonomous in replication.
The genome abundance and putative insertion age were estimated for each full-length LTR-RE. Overall, full-length LTR-REs amount to 55.8% of the genome, as shown by mapping Illumina reads to their sequences. By masking the genome with a collection of repeat sequences, Xu et al. [33] estimated the abundance of LTR-REs to be 69.4% of the stevia genome. Presumably, the difference in LTR-RE abundance estimation is related to the occurrence of many RE remnants and fragments (i.e., incomplete elements) belonging to old families with degenerated sequences that are not recognised by the software that predicts only full-length LTR-REs, as observed in other species [55].
Mapping analysis showed that the abundance of sequences related to Gypsy full-length REs is around two-fold that of Copia ones, confirming the data reported by Xu et al. [33]. The ratio between the abundance of the Gypsy and Copia sequences is highly variable and differs between species [54]. In Asteraceae, the family to which the genus Stevia belongs, this ratio is generally higher than 1, for example, in sunflower [56,57] or Hieracium [53], although there are also genera, such as Melampodium [58], Anacyclus, and Heliocauta [59], in which there are more Copia than Gypsy elements.
Concerning the Gypsy lineages, the most frequent lineages in the collection of full-length LTR-REs, Chromovirus/Tekay, non-chromovirus/Retand and non-chromovirus/Athila were also the most abundant in the genome. In contrast, concerning the Copia superfamily, although Angela full-length elements are the most numerous, the most abundant lineage is by far SIRE, covering around 10% of the genome, while the Angela lineage accounts for around 5%. This indicates the occurrence, in the stevia genome, of many SIRE remnants and fragments. In fact, SIRE LTR-REs are apparently the most ancient, as shown by the insertion time profiles calculated comparing RT sequences. Presumably, many ancient SIRE REs have undergone many mutation events, remaining in the genome as fragmented elements (i.e., not full-length) not recognised by the tools based on de novo detection. It should be noted that SIRE elements are the most abundant in many Asteraceae genera, such as Cynara, Artemisia, Carthamus, and Chrysanthemum [51].
Further characterisation of stevia LTR-REs consisted of estimating the insertion time profiles of different RE lineages. Insertion time calculation based on LTR sequence comparison [39] showed that the insertions of all the isolated full-length elements are relatively recent, with a transposition peak at 1–2 MYA. It is, however, presumable that insertion time calculated on LTR comparison of full-length elements is biased because the more ancient the element, the more it does not maintain structural integrity and hence cannot be identified by tools analysing structural features.
For this reason, another analysis was performed on a sample of Illumina sequence reads complementary to retrotranscriptase sequences, according to Piegu et al. [43]. The insertion time profiles of those lineages for which a reliable number of sequences were available showed how the proliferation of REs in S. rebaudiana occurred mainly in two distinct evolutionary periods, with two peaks, one at 5 MYA and the other more ancient, from 14 to 24 MYA, depending on the lineage. In the case of Chromovirus/Tekay elements, which are by far the most abundant in the genome, their abundance seemed to be especially related to the oldest proliferation peak. The Angela lineage does not seem to have reached the peak of proliferation yet.

3.2. Use of LTR-Retrotransposons for Genetic Variability Analyses

Due to their repetitive and dispersed nature, REs are very suitable sequences to exploit for the analysis of genetic variability [35]. An IRAP protocol [36] was developed to evaluate the genetic variability of 25 S. rebaudiana accessions relative to a specific LTR-RE. This RE belongs to the Angela lineage of the Copia superfamily. It was selected because it is abundant in the genome and belongs to a lineage that appears to still be active. PCR analyses using a primer designed on this element produced electrophoretic patterns characterised by many bands of different lengths, many of which were polymorphic.
This analysis allowed the identification of cases of identity between some accessions, for example, the pair formed by accessions 1 (MA pt1) and 7 (MA pt3), and that formed by accessions 2 (MA 13/1) and 3 (MA pt2), all of Brazilian origin. For other accessions, PCA made it possible to establish relationships of strict similarity. For example, the genotypes F (CO), I (BR1) and G (BR5) are very close, despite F being of Israeli origin and I and G being Brazilian accessions. Moreover, Brazilian genotypes 5 (MA pt5) and 9 (SV1) resulted similar to Israeli genotype D (SL), sharing many of their polymorphic bands, suggesting a probable common origin, which requires further investigation.
After performing a population structure analysis and considering the genomic regions identified by the polymorphisms of the Copia/Angela LTR-RE, we hypothesised the existence of four ancestral subpopulations from which our 25 accessions originated. All accessions, which come from different regions of the world where S. rebaudiana is cultivated (Brasil, Paraguay, Israel, and Italy), were found to be admixed, with no relation to geographic origin, indicating that the 4 original subpopulations probably had the same geographic origin.
Many more copies of the sequence identified by the primer used for obtaining IRAP fingerprints were found in the stevia genome in the proximity of genes involved in steviol glycoside metabolism, for example, encoding many UDP-glycosyltransferases, than in the proximity of randomly selected genes. It is known that the presence of non-coding sequences, such as retrotransposons, may affect the expression of proximal genes. In fact, an inserted retrotransposon may epigenetically change the expression [60] or act as a distal enhancer of genes along the chromosomal locus, even at distances of 1000 base pairs. For example, the maize teosinte-branched1 gene expression pattern differed depending on the presence of a hopscotch retrotransposon at more than 60,000 bp from the tb1 gene [61]. Our analysis suggests the possibility of using the IRAP protocol described in this article to identify chromosomal loci involved in steviol glycoside content.

4. Materials and Methods

4.1. Full-Length LTR-Retrotransposons Collection and Characterisation

The stevia genome assembly (https://doi.org/10.6084/m9.figshare.14169491.v1; accessed on 5 July 2021) [33] was scanned for Class I full-length LTR-REs. The elements were identified using EDTA v1.9.3 [62]. EDTA implemented a combination of LTR_FINDER v1.06 [63], LTRharvest v1.5.10 [48], and LTR_retriever v2.5 [64]. All implemented programme parameters were automatically set, as reported in the default pipeline [62].
The identified full-length LTR-REs were submitted to domain-based annotation using DANTE v1.0.0, available on the RepeatExplorer2 Galaxy-based website (https://repeatexplorer-elixir.cerit-sc.cz/galaxy/; accessed on 8 November 2021). The annotation process was performed with default parameters using the REXdb of transposable element protein domains [19] and a BLOSUM80 scoring matrix. The protein matches were filtered by significance using the parameters provided by the platform.
To reduce the number of uncharacterised full-length LTR-REs, we performed blastn and tblastx processes [65] between uncharacterised and characterised elements. BLAST processes were performed with default parameters.
The insertion profile time course of the different LTR-RE lineages was studied by calculating the distributions of pairwise divergence comparisons of the 5′- and 3′-LTRs. LTR pairwise alignments were calculated using a stretcher of the EMBOSS v6.6.0.0 suite, applying the Kimura two-parameter model of sequence evolution [66]. Distance matrices were prepared using distmat tools of the same suite [67]. The insertion times of each LTR-RE were estimated using a mutation rate of 2 × 10⁻⁸, which is two-fold the rate calculated for synonymous substitutions in gene sequences in Helianthus annuus [42] because LTR-REs accumulate more mutations with time compared to gene sequences. Peaks in frequency distribution were interpreted as transposition burst events, with those peaks associated with lower divergence values considered to represent relatively recent proliferation events [17,42].
LTR-RE insertion time profiles were also calculated using another method based on RT-encoding sequences [41,43,68]. First, a database of stevia repeats was produced using the RepeatExplorer on a sample of one million randomly selected paired-end reads. Briefly, Illumina DNA sequences of S. rebaudiana were collected from the NCBI Sequence Read Archive (NCBI, WA, USA, https://www.ncbi.nlm.nih.gov/sra; accessed on 5 July 2021). The ID code of the sequence read set is SRR6792730. FastQC v0.11.5 [69] was run to check the sequence reads for quality. Trimmomatic v0.33 [70] was used to remove Illumina adapters and low-quality regions, with the following parameters: ILLUMINACLIP: 2:30:10, SLIDINGWINDOW: 4:28, HEADCROP: 15, and MINLEN: 85.
Assembled nucleotide sequences encoding the RT domains (at least 150 nt in length) were selected from clusters related to the LTR-REs of the different lineages using the DANTE protein domain search tool of RepeatExplorer2. The time course was studied by calculating the distributions of pairwise divergence values for Illumina reads aligned with the RT domain-encoding sequences for the different lineages. Briefly, Illumina 85-nt reads were aligned to the RT sequences using CLC Genomics Workbench v9.5.3 (CLC-BIO, Aarhus, Denmark) with the following parameters: mismatch cost = 1, insertion/cost = 1, length fraction = 0.9, and similarity fraction = 0.8. Then, pairwise divergence values between reads were calculated using MEGA v10.1.8 [71] under the Kimura two-parameter model of sequence evolution [66]. Kimura distances were converted to MYA using the same substitution rate as above.

4.2. Plant Materials and DNA Isolation

A collection of 25 accessions of S. rebaudiana was analysed, as reported in Table 2. This collection is available at the Department of Agriculture, Food, and Environment (DAFE), University of Pisa. Genomic DNA was extracted from young leaves (0.5 g fresh weight) of S. rebaudiana plants, as described by Doyle and Doyle [72].

4.3. IRAP Analysis

OLIGO v7.0 software [73] was used to design primers related to the DNA sequences belonging to the LTRs of a Copia RE. The primers are reported in Table 3. Genomic DNA from the 25 stevia accessions was used as templates.
Table 3. List of primers designed on putative LTRs of a group of Copia/Angela full length LTR-REs and used for IRAP analysis.
Primer CodeSequence
ANG RNase+ (forward)5′-ATGGGACTTCGWTATTCTAGTG-3′
ANG 1− (reverse)5′-TTTGAGAGCGGGTCAGTCCAA-3′
ANG 3− (reverse)5′-CCATTCAATAACATCATCATCT-3′
ANG 44− (reverse)5′-TTATTTACTTATGTTATTTACCA-3′
ANG 44+ (forward)5′-ATTGGTAAATAACATAAGTAAAT-3′
ANG 4− (reverse)5′-CACAAGCTTGTATACCCCAAG-3′
ANG 5+ (forward)5′-TTCAAGAATCACACCCTCTA-3′
ANG 55+ (forward)5′-TCATAACCTAGCCAAGACCT-3′
ANG 55− (reverse)5′-AGGTCTTGGCTAGGTTATGA-3′
ANG 6+ (forward)5′-AACAAACGCGACAAACTAAAAC-3′
ANG gag− (reverse)5′-CAATTCTCAAGTTTCGATACCA-3′
PCR reactions were carried out as described by Vukich et al. [74] in a reaction mixture (volume 20 μL) containing 50 ng genomic DNA, 2.5 mM MgCl2, 0.5 μM primers, and 1.25 U Taq FirePol (Biodyne) DNA polymerase. Thermocycling was performed at 94 °C for 3 min, 30 cycles at 94 °C for 30 s, 55 °C for 30 s, and 72 °C for 120 s, and a final extension at 72 °C for 7 min. PCR products were visualised on Gel-Red (Biotium) stained 2% agarose gel.
Each electrophoresis was repeated three times, and fingerprints were scored to prepare binary matrices. IRAP fingerprints were analysed by comparing the presence of amplification fragments among the analysed genotypes. The value of “1” or “0” was assigned to each amplification fragment (visualised as a single band on the IRAP fingerprint) in case of presence or absence, respectively, in the analysed accession. Each band was presumed to be representative of a single locus [75]. Non-reproducible bands were rare and excluded from the analyses, along with weak bands.
In order to visualise genetic distance and similarities among genotypes, a principal component analysis (PCA) was performed on the IRAP matrix by using Graphpad Prism (v9.0.0) (GraphPad Software, Inc., La Jolla, CA, USA).

4.4. Analysis of Population Structure

To detect mixed genotypes, the population structure was analysed using the Bayesian method with the STRUCTURE v2.3.4 software package [45], based on the IRAP matrix. The number of initial subpopulations (K) was defined from 1 to 25, and five replications were performed per run. The length of the burn-in period was set to 50,000, and the number of Markov Chain Monte Carlo replications was set to 100,000. An admixture model and correlated allele frequencies were chosen. The results were run in STRUCTURE Harvester [76] to choose the most likely number of initial subpopulations, applying the delta K (ΔK) method based on calculating the logarithm of the likelihood for each K (Ln P (D) = L (K)) [77] and the ΔK statistic, the latter of which is based on the secondary rate of change in likelihood (ΔK = (L″(K))/standard deviation) [78]. Using this method, the probability of a slope breaks at the point where the number of hypothetical initial subpopulations is at the maximum point of likelihood.

4.5. Analysis of Proximity between Retrotransposons and Genes Involved in Steviol Glycoside Accumulation

A repertoire of 103 genes involved in steviol glycoside accumulation [33] was localised in the S. rebaudiana genome [33] through a BLAST analysis of stevia protein sequences against the SwissProt database. After that, another blastn analysis was performed against the S. rebaudiana genome using the primer designed on the LTR-RE for the IRAP analysis to evaluate their overall occurrences. The blastn process was performed using the -task “blastn-short” option for short sequences. Then, 100,000 bp upstream and downstream of each of the 103 genes involved in steviol glycoside accumulation were collected and intersected with the blastn results of the LTR-RE primer using BEDTools v2.30.0 [79]. Another 103 genes were randomly selected in the stevia genome by using an in-house python script and the occurrence of the IRAP primer in their proximity (100,000 bp upstream and downstream of each of the 103 genes) was analysed as above. The difference in the occurrence of primers in the frame of 100,000 bp surrounding 103 SVglys genes and 103 randomly collected genes was performed by using the Chi-square test.

5. Conclusions

This work reports on the identification and characterisation of the LTR-REs of Stevia rebaudiana, a cultivated species of great interest for its application in the sweetener industry. We also verified the possibility of producing and using molecular markers related to repeated sequences in this species. Overall, these data may be useful for the annotation of genomic sequences and for the evaluation of genetic variability to guide stevia breeding.

Supplementary Materials

The following are available online at https://www.mdpi.com/article/10.3390/ijms23116220/s1.

Author Contributions

Conceptualization, A.C., F.M. and T.G.; data curation, S.S., C.C., G.U., A.V., L.N., S.T. and L.G.A.; investigation, S.S., C.C., G.U., A.V., S.T., F.M. and T.G.; methodology, S.S., C.C., G.U., A.V., A.C., F.M. and T.G.; writing—original draft, A.C. and T.G.; writing—review and editing, S.S., C.C., G.U., A.V., L.N., S.T., L.G.A., A.C., F.M. and T.G. All authors have read and agreed to the published version of the manuscript.

Funding

This research was supported by the Department of Agriculture, Food, and Environment of the University of Pisa, Italy, Project “Plantomics”.

Institutional Review Board Statement

Not applicable.

Informed Consent Statement

Not applicable.

Data Availability Statement

Not applicable.

Conflicts of Interest

The authors declare no conflict of interest.

Abbreviations

LTRLong-terminal repeats
REsRetrotransposons
TEsTransposable elements
MYAMillion Years Ago
SVglysSteviol glycosides

References

  1. Woo, T.H.; Hong, T.H.; Kim, S.S.; Chung, W.H.; Kang, H.J.; Kim, C.B.; Seo, J.M. Repeatome: A database for repeat element comparative analysis in human and chimpanzee. Genom. Inform. 2007, 5, 179–187. [Google Scholar]
  2. Wicker, T.; Sabot, F.; Hua-Van, A.; Bennetzen, J.L.; Capy, P.; Chalhoub, B.; Flavell, A.; Leroy, P.; Morgante, M.; Panaud, O.; et al. A unified classification system for eukaryotic transposable elements. Nat. Rev. Genet. 2007, 8, 973–982. [Google Scholar] [CrossRef]
  3. Galindo-González, L.; Mhiri, C.; Deyholos, M.K.; Grandbastien, M.A. LTR retrotransposons in plants: Engines of evolution. Gene 2017, 626, 14–25. [Google Scholar] [CrossRef] [PubMed]
  4. Sabot, F.; Schulman, A.H. Parasitism and the retrotransposon life cycle in plants: A hitchhiker’s guide to the genome. Heredity 2006, 97, 381–388. [Google Scholar] [CrossRef] [Green Version]
  5. Orgel, L.; Crick, F. Selfish DNA: The ultimate parasite. Nature 1980, 284, 604–607. [Google Scholar] [CrossRef]
  6. Hawkins, J.S.; Kim, H.; Nason, J.D.; Wing, R.A.; Wendel, J.F. Differential lineage-specific amplification of transposable elements is responsible for genome size variation in Gossypium. Genome Res. 2006, 16, 1252–1261. [Google Scholar] [CrossRef] [PubMed] [Green Version]
  7. Dubin, M.J.; Scheid, O.M.; Becker, C. Transposons: A blessing curse. Curr. Opin. Plant Biol. 2018, 42, 23–29. [Google Scholar] [CrossRef]
  8. Slotkin, R.K.; Martienssen, R. Transposable elements and the epigenetic regulation of the genome. Nat. Rev. Genet. 2007, 8, 272. [Google Scholar] [CrossRef]
  9. Van Driel, R.; Fransz, P.F.; Verschure, P.J. The eukaryotic genome: A system regulated at different hierarchical levels. J. Cell Sci. 2003, 116, 4067–4075. [Google Scholar] [CrossRef] [Green Version]
  10. Song, J.T.; Lu, H.; McDowell, J.M.; Greenberg, J.T. A key role for ALD1 in activation of local and systemic defenses in Arabidopsis. Plant J. 2004, 40, 200–212. [Google Scholar] [CrossRef]
  11. Hollister, J.D.; Gaut, B.S. Epigenetic silencing of transposable elements: A tradeoff between reduced transposition and deleterious effects on neighboring gene expression. Genome Res. 2009, 19. [Google Scholar] [CrossRef] [PubMed] [Green Version]
  12. Hollister, J.D.; Smith, L.M.; Guo, Y.L.; Ott, F.; Weigel, D.; Gaut, B.S. Transposable elements and small RNAs contribute to gene expression divergence between Arabidopsis thaliana and Arabidopsis lyrata. Proc. Natl. Acad. Sci. USA 2011, 108, 2322–2327. [Google Scholar] [CrossRef] [PubMed] [Green Version]
  13. Usai, G.; Vangelisti, A.; Simoni, S.; Giordani, T.; Natali, L.; Cavallini, A.; Mascagni, F. DNA modification patterns within the transposable elements of the fig (Ficus carica L.) genome. Plants 2021, 10, 451. [Google Scholar] [CrossRef] [PubMed]
  14. Wicker, T.; Keller, B. Genome-wide comparative analysis of copia retrotransposons in Triticeae, rice, and Arabidopsis reveals conserved ancient evolutionary lineages and distinct dynamics of individual copia families. Genome Res. 2007, 17, 1072–1081. [Google Scholar] [CrossRef] [Green Version]
  15. Llorens, C.; Futami, R.; Covelli, L.; Domínguez-Escribá, L.; Viu, J.M.; Tamarit, D.; Aguilar-Rodríguez, J.; Vicente-Ripolles, M.; Fuster, G.; Bernet, G.P.; et al. The Gypsy Database (GyDB) of mobile genetic elements: Release 2.0. Nucleic Acids Res. 2011, 39, 70–74. [Google Scholar] [CrossRef] [PubMed] [Green Version]
  16. Barghini, E.; Mascagni, F.; Natali, L.; Giordani, T.; Cavallini, A. Analysis of the repetitive component and retrotransposon population in the genome of a marine angiosperm, Posidonia oceanica (L.) Delile. Mar. Genom. 2015, 24, 397–404. [Google Scholar] [CrossRef] [PubMed]
  17. Usai, G.; Mascagni, F.; Natali, L.; Giordani, T.; Cavallini, A. Comparative genome-wide analysis of repetitive DNA in the genus Populus L. Tree Genet. Genomes 2017, 13, 96. [Google Scholar] [CrossRef] [Green Version]
  18. Buti, M.; Moretto, M.; Barghini, E.; Mascagni, F.; Natali, L.; Brilli, M.; Lomsadze, A.; Sonego, P.; Giongo, L.; Alonge, M.; et al. The genome sequence and transcriptome of Potentilla micrantha and their comparison to Fragaria vesca (the woodland strawberry). GigaScience 2018, 7, giy010. [Google Scholar] [CrossRef] [Green Version]
  19. Neumann, P.; Novák, P.; Hoštáková, N.; Macas, J. Systematic survey of plant LTR retrotransposons elucidates phylogenetic relationships of their polyprotein domains and provides a reference for element classification. Mob. DNA 2019, 10, 1. [Google Scholar] [CrossRef]
  20. Gorinšek, B.; Gubenšek, F.; Kordiš, D. Evolutionary genomics of chromoviruses in eukaryotes. Mol. Biol. Evol. 2004, 21, 781–798. [Google Scholar] [CrossRef] [Green Version]
  21. Mascagni, F.; Vangelisti, A.; Usai, G.; Giordani, T.; Cavallini, A.; Natali, L. A computational genome-wide analysis of long terminal repeats retrotransposon expression in sunflower roots (Helianthus annuus L.). Genetica 2020, 148, 13–23. [Google Scholar] [CrossRef] [PubMed]
  22. Lemus-Mondaca, R.; Vega-Gálvez, R.; Zura-Bravo, L.; Ah-Hen, K. Stevia rebaudiana Bertoni, source of a high-potency natural sweetener: A comprehensive review on the biochemical, nutritional and functional aspects. Food Chem. 2012, 132, 1121–1131. [Google Scholar] [CrossRef] [PubMed]
  23. Angelini, L.G.; Martini, A.; Passera, B.; Tavarini, S. Cultivation of Stevia rebaudiana Bertoni and associated challenges. In Sweeteners; Mérillon, J.M., Ramawat, K., Eds.; Reference Series in Phytochemistry; Springer: Cham, Switzerland, 2018. [Google Scholar]
  24. Soejarto, D.D. Botany of Stevia and Stevia rebaudiana. In Stevia—The Genus Stevia; Kinghorn, A., Ed.; Taylor and Francis: Abingdon, UK; New York, NY, USA, 2002; pp. 18–39. [Google Scholar]
  25. Kumari, N.; Raina, R.; Sharma, P. Interpopulation variations in morphochemical characteristics of Stevia rebaudiana Bertoni. Turk. J. Bot. 2018, 42, 491–501. [Google Scholar] [CrossRef]
  26. Brandle, J.; Starratt, A.; Gijzen, M. Stevia rebaudiana: Its agricultural, biological, and chemical properties. Can. J. Plant Sci. 1998, 78, 527–536. [Google Scholar] [CrossRef] [Green Version]
  27. Angelini, L.; Tavarini, S. Crop productivity, steviol glycoside yield, nutrient concentration and uptake of Stevia rebaudiana Bert. under Mediterranean field conditions. Commun. Soil Sci. Plant. Anal. 2014, 45, 2577–2592. [Google Scholar] [CrossRef]
  28. Barbet-Massin, C.; Giuliano, S.; Alletto, L.; Daydé, J.; Berger, M. Towards a semi-perennial culture of Stevia rebaudiana (Bertoni) under temperate climate: Effects of genotype, environment and plant age on steviol glycoside content and composition. Genet. Resour. Crop. Evol. 2016, 63, 685–694. [Google Scholar] [CrossRef]
  29. Hastoy, C.; Cossona, P.; Cavaignac, S.; Boutié, P.; Waffo-Teguo, P.; Rolin, D.; Schurdi-Levrauda, V. Deciphering performances of fifteen genotypes of Stevia rebaudiana in southwestern France through dry biomass and steviol glycoside evaluation. Ind. Crops Prod. 2019, 128, 607–619. [Google Scholar] [CrossRef]
  30. Tavarini, S.; Passera, B.; Angelini, L. Crop and steviol glycoside improvement in stevia by breeding. In Steviol Glycosides: Cultivation, Processing, Analysis and Applications in Food; The Royal Society of Chemistry: London, UK, 2018; pp. 1–31. [Google Scholar]
  31. Clemente, C.; Angelini, L.G.; Ascrizzi, R.; Tavarini, S. Stevia rebaudiana (Bertoni) as a multifunctional and sustainable crop for the mediterranean climate. Agriculture 2021, 11, 123. [Google Scholar] [CrossRef]
  32. Garcia, S.; Hidalg, O.; Jakovljević, I.; Siljak-Yakovlev, S.; Vigo, J.; Garnatje, T.; Vallès, J. New data on genome size in 128 Asteraceae species and subspecies, with first assessments for 40 genera, 3 tribes and 2 subfamilies. Plant Biosyst. 2013, 147, 1219–1227. [Google Scholar] [CrossRef]
  33. Xu, X.; Yuan, H.; Yu, X.; Huang, S.; Sun, Y.; Zhang, T.; Liu, Q.; Tong, H.; Zhang, Y.; Wang, Y.; et al. The chromosome-level Stevia genome provides insights into steviol glycoside biosynthesis. Hort. Res. 2021, 8, 129. [Google Scholar] [CrossRef]
  34. Schulman, A.H.; Flavell, A.J.; Ellis, T.H.N. The application of LTR retrotransposons as molecular markers in plants. Methods Mol. Biol. 2004, 260, 145–173. [Google Scholar] [PubMed]
  35. Kalendar, R.; Schulman, A.H. IRAP and REMAP for retrotransposon based genotyping and fingerprinting. Nat. Protoc. 2006, 1, 2478–2484. [Google Scholar] [CrossRef] [PubMed]
  36. Kalendar, R.; Grob, T.; Regina, M.; Suoniemi, A.; Schulman, A.H. IRAP and REMAP: Two new retrotransposon-based DNA fingerprinting techniques. Theor. Appl. Genet. 1999, 98, 704–711. [Google Scholar] [CrossRef]
  37. Ellinghaus, D.; Kurtz, S.; Willhoeft, U. LTRharvest, an efficient and flexible software for de novo detection of LTR retrotransposons. BMC Bioinform. 2008, 9, 18. [Google Scholar] [CrossRef] [PubMed] [Green Version]
  38. Vangelisti, A.; Simoni, S.; Usai, G.; Ventimiglia, M.; Natali, L.; Cavallini, A.; Mascagni, F.; Giordani, T. LTR-retrotransposon dynamics in common fig (Ficus carica L.) genome. BMC Plant Biol. 2021, 21, 221. [Google Scholar] [CrossRef] [PubMed]
  39. SanMiguel, P.; Gaut, B.S.; Tikhonov, A.; Nakajima, Y.; Bennetzen, J.L. The paleontology of intergene retrotransposons of maize. Nat. Genet. 1998, 20, 43–45. [Google Scholar] [CrossRef]
  40. SanMiguel, P.; Tikhonov, A.; Jin, Y.K.; Motchoulskaia, N.; Zakharov, D.; Melake-Berhan, A.; Springer, P.S.; Edwards, K.J.; Lee, M.; Avramova, Z. Nested retrotransposons in the intergenic regions of the maize genome. Science 1996, 274, 765–768. [Google Scholar] [CrossRef] [Green Version]
  41. Mascagni, F.; Usai, G.; Natali, L.; Cavallini, A.; Giordani, T. A comparison of methods for LTR-retrotransposon insertion time profiling in the Populus trichocarpa genome. Caryologia 2018, 71, 85–92. [Google Scholar] [CrossRef]
  42. Mascagni, F.; Cavallini, A.; Giordani, T.; Natali, L. Different histories of two highly variable LTR retrotransposons in sunflower species. Gene 2017, 634, 5–14. [Google Scholar] [CrossRef] [Green Version]
  43. Piegu, B.; Guyot, R.; Picault, N.; Roulin, A.; Saniyal, A.; Kim, H.; Collura, K.; Brar, D.S.; Jackson, S.; Wing, R.A.; et al. Doubling genome size without polyploidization: Dynamics of retrotransposition-driven genomic expansions in Oryza australiensis, a wild relative of rice. Genome Res. 2006, 16, 1262–1269. [Google Scholar] [CrossRef] [Green Version]
  44. Kumar, A.; Bennetzen, J.L. Plant retrotransposons. Ann. Rev. Genet. 1999, 33, 479–532. [Google Scholar] [CrossRef] [Green Version]
  45. Pritchard, J.K.; Stephens, M.; Donnelly, P. Inference of population structure using multilocus genotype data. Genetics 2000, 155, 945–959. [Google Scholar] [CrossRef] [PubMed]
  46. Vigouroux, Y.; Glaubitz, J.C.; Matsuoka, Y.; Major, M.; Doebley, J. Population structure and genetic diversity of the new world maize races assessed by microsatellites. Am. J. Bot. 2008, 95, 1240–1253. [Google Scholar] [CrossRef] [PubMed]
  47. Castillo, A.; Dorado, G.; Feuillet, C.; Sourdille, P.; Hernandez, P. Genetic structure and ecogeographical adaptation in wild barley (Hordeum chilense Roemer et Schultes) as revealed by microsatellite markers. BMC Plant Biol. 2010, 10, 266. [Google Scholar] [CrossRef] [PubMed] [Green Version]
  48. Shahid, S.; Slotkin, R.K. The current revolution in transposable element biology enabled by long reads. Curr. Opin. Plant Biol. 2020, 54, 49–56. [Google Scholar] [CrossRef]
  49. Buti, M.; Giordani, T.; Cattonaro, F.; Cossu, R.M.; Pistelli, L.; Vukich, M.; Morgante, M.; Cavallini, A.; Natali, L. Temporal dynamics in the evolution of the sunflower genome as revealed by sequencing and annotation of three large genomic regions. Theor. Appl. Genet. 2011, 123, 779–791. [Google Scholar] [CrossRef]
  50. Natali, L.; Cossu, R.M.; Barghini, E.; Giordani, T.; Buti, M.; Mascagni, F.; Morgante, M.; Gill, N.; Kane, N.C.; Rieseberg, L.; et al. The repetitive component of the sunflower genome as shown by different procedures for assembling next generation sequencing reads. BMC Genom. 2013, 14, 686. [Google Scholar] [CrossRef] [Green Version]
  51. Ventimiglia, M. ASTER-REP, a Database of Asteraceae Sequences for Studying Structure and Function of Transposable Elements. Ph.D. Thesis, University of Pisa, Pisa, Italy, 2022. [Google Scholar]
  52. Badouin, H.; Gouzy, J.; Grassa, C.J.; Murat, F.; Staton, S.E.; Cottret, L.; Lelandais-Brière, C.; Owens, G.L.; Carrère, S.; Mayjonade, B.; et al. The sunflower genome provides insights into oil metabolism, flowering and Asterid evolution. Nature 2017, 546, 148–152. [Google Scholar] [CrossRef]
  53. Zagorski, D.; Hartmann, M.; Bertrand, Y.J.; Paštová, L.; Slavíková, R.; Josefiová, J.; Fehrer, J. Characterization and dynamics of repeatomes in closely related species of Hieracium (Asteraceae) and their synthetic and apomictic hybrids. Front. Plant Sci. 2020, 11, 591053. [Google Scholar] [CrossRef]
  54. Vitte, C.; Fustier, M.A.; Alix, K.; Tenaillon, M.I. The bright side of transposons in crop evolution. Brief. Funct. Genom. 2014, 13, 276–295. [Google Scholar] [CrossRef] [Green Version]
  55. Goubert, C.; Modolo, L.; Vieira, C.; Valiente Moro, C.; Mavingui, P.; Boulesteix, M. De novo assembly and annotation of the asian tiger mosquito (Aedes albopictus) repeatome with dnaPipeTE from raw genomic reads and comparative analysis with the yellow fever mosquito (Aedes aegypti). Genome Biol. Evol. 2015, 7, 1192–1205. [Google Scholar] [CrossRef] [PubMed] [Green Version]
  56. Staton, S.E.; Burke, J.M. Evolutionary transitions in the Asteraceae coincide with marked shifts in transposable element abundance. BMC Genom. 2015, 16, 623. [Google Scholar] [CrossRef] [PubMed] [Green Version]
  57. Mascagni, F.; Giordani, T.; Ceccarelli, M.; Cavallini, A.; Natali, L. Genome-wide analysis of LTR-retrotransposon diversity and its impact on the evolution of the genus Helianthus (L.). BMC Genom. 2017, 18, 634. [Google Scholar] [CrossRef] [PubMed] [Green Version]
  58. Mccann, J.; Jang, T.S.; Macas, J.; Schneeweiss, G.M.; Matzke, N.J.; Novák, P.; Stuessy, T.F.; Villaseñor, J.L.; Weiss-Schneeweiss, H. Dating the species network: Allopolyploidy and repetitive DNA evolution in American daisies (Melampodium sect. Melampodium, Asteraceae). Syst. Biol. 2018, 67, 1010–1024. [Google Scholar] [CrossRef]
  59. Vitales, D.; Álvarez, I.; Garcia, S.; Hidalgo, O.; Nieto Feliner, G.; Pellicer, J.; Vallès, J.; Garnatje, T. Genome size variation at constant chromosome number is not correlated with repetitive DNA dynamism in Anacyclus (Asteraceae). Ann. Bot. 2019, 125, 611–623. [Google Scholar] [CrossRef]
  60. Arnaud, P.; Goubely, C.; Pelissier, T.; Deragon, J.M. SINE retroposons can be used in vivo as nucleation centers for de novo methylation. Mol. Cell Biol. 2000, 20, 3434–3441. [Google Scholar] [CrossRef]
  61. Studer, A.; Zhao, Q.; Ross-Ibarra, J.; Dobley, J. Identification of a functional transposon insertion in the maize domestication gene tb1. Nat. Genet. 2011, 43, 1160–1163. [Google Scholar] [CrossRef] [Green Version]
  62. Ou, S.; Jiang, N. LTR_FINDER_parallel: Parallelization of LTR_FINDER enabling rapid identification of long terminal repeat retrotransposons. Mob. DNA 2019, 10, 48. [Google Scholar] [CrossRef] [Green Version]
  63. Xu, Z.; Wang, H. LTR_FINDER: An efficient tool for the prediction of full-length LTR retrotransposons. Nucl. Acids Res. 2007, 35, W265–W268. [Google Scholar] [CrossRef] [Green Version]
  64. Ou, S.; Jiang, N. LTR_retriever: A highly accurate and sensitive program for identification of long terminal repeat retrotransposons. Plant Physiol. 2018, 176, 1410–1422. [Google Scholar] [CrossRef] [Green Version]
  65. Altschul, S.F.; Gish, W.; Miller, W.; Myers, E.W.; Lipman, D.J. Basic local alignment search tool. J. Mol. Biol. 1990, 215, 403–410. [Google Scholar] [CrossRef]
  66. Kimura, M. A simple method for estimating evolutionary rates of base substitutions through comparative studies of nucleotide sequences. J. Mol. Evol. 1980, 16, 111–120. [Google Scholar] [CrossRef] [PubMed]
  67. Rice, P.; Longden, I.; Bleasby, A. EMBOSS: The European molecular biology open software suite. TIG 2000, 16, 276–277. [Google Scholar] [CrossRef]
  68. Ammiraju, J.S.; Zuccolo, A.; Yu, Y.; Song, X.; Piegu, P.; Chevalier, F.; Walling, J.G.; Ma, J.; Talag, J.; Brar, D.S.; et al. Evolutionary dynamics of an ancient retrotransposon family provides insights into evolution of genome size in the genus Oryza. Plant J. 2007, 52, 342–351. [Google Scholar] [CrossRef] [PubMed]
  69. Andrews, S. FastQC: A Quality Control Tool for High Throughput Sequence Data. 2010. Available online: https://www.bioinformatics.babraham.ac.uk/projects/fastqc/ (accessed on 5 July 2021).
  70. Bolger, A.M.; Lohse, M.; Usadel, B. Trimmomatic: A flexible trimmer for Illumina sequence data. Bioinformatics 2014, 30, 2114–2120. [Google Scholar] [CrossRef] [PubMed] [Green Version]
  71. Kumar, S.; Stecher, G.; Tamura, K. MEGA7: Molecular evolutionary genetics analysis version 7.0 for bigger datasets. Mol. Biol. Evol. 2016, 33, 1870–1874. [Google Scholar] [CrossRef] [Green Version]
  72. Doyle, J.J.; Doyle, J.L. Isolation of plant DNA from fresh tissue. Focus 1989, 12, 13–15. [Google Scholar]
  73. Rychlik, W.; Rhoads, R.E. A computer program for choosing optimal oligonudeotides for filter hybridization, sequencing and in vitro amplification of DNA. Nucleic Acids Res. 1989, 17, 8543–8551. [Google Scholar] [CrossRef]
  74. Vukich, M.; Schulman, A.H.; Giordani, T.; Natali, L.; Kalendar, R.; Cavallini, A. Genetic variability in sunflower (Helianthus annuus L.) and in the Helianthus genus as assessed by retrotransposon-based molecular markers. Theor. Appl. Genet. 2009, 119, 1027–1038. [Google Scholar] [CrossRef]
  75. Lynch, M.; Milligan, B.G. Analysis of population genetic structure with RAPD markers. Mol. Ecol. 1994, 3, 91–99. [Google Scholar] [CrossRef]
  76. Earl, D.A.; Vonholdt, B.M. STRUCTURE HARVESTER: A website and program for visualizing STRUCTURE output and implementing the Evanno method. Conserv. Genet. Res. 2012, 4, 359–361. [Google Scholar] [CrossRef]
  77. Rosenberg, N.A.; Pritchard, J.K.; Weber, J.L.; Cann, H.M.; Kidd, K.K.; Zhivotovsky, L.A.; Feldman, M.W. The genetic structure of human populations. Science 2002, 298, 2381–2385. [Google Scholar] [CrossRef] [PubMed] [Green Version]
  78. Evanno, G.; Regnaut, S.; Goudet, J. Detecting the number of clusters of individuals using the software STRUCTURE: A simulation study. Mol. Ecol. 2005, 14, 2611–2620. [Google Scholar] [CrossRef] [Green Version]
  79. Quinlan, A.R.; Hall, I.M. BEDTools: A flexible suite of utilities for comparing genomic features. Bioinformatics 2010, 26, 841–842. [Google Scholar] [CrossRef] [PubMed] [Green Version]
Figure 1. Pie charts of the distribution of full-length LTR-REs in the S. rebaudiana genome considering both superfamilies (a) and Copia (b) and Gypsy (c) lineages. The number of elements for each LTR-RE superfamily or lineage is shown in the brackets.
Ijms 23 06220 g001
Figure 2. Genome proportions of different LTR-RE lineages in the S. rebaudiana genome. Blue: Copia lineages; Green: Gypsy lineages; Grey: undetermined superfamily; chr: Chromovirus; nonchr: Non-Chromovirus; ND, not determined.
Ijms 23 06220 g002
Figure 3. Timing of retrotranspositional activity of eight Copia and five Gypsy lineages of S. rebaudiana based on pairwise comparisons of the LTRs of each full-length element. For each lineage, the average insertion time (in MYA) is reported in parentheses. MYA, million years ago; chr, Chromovirus; nonchr, non-Chromovirus; ND, not determined.
Ijms 23 06220 g003
Figure 4. Timing of retrotranspositional activity of four Copia and two Gypsy lineages of S. rebaudiana based on pairwise comparisons of Illumina reads that match RT encoding sequences. The average insertion time (in MYA) for each lineage is reported in parentheses. MYA, million years ago; chr, Chromovirus; nonchr, non-Chromovirus.
Ijms 23 06220 g004
Figure 5. IRAP fingerprints obtained with a primer (ANG5+) targeting LTR-REs belonging to the Copia/Angela lineage in 25 accessions of S. rebaudiana. Genotype codes are listed in Table 3 (see Methods). A molecular weight marker (MW, 100 bp DNA Ladder (Solis Biodyne)) was loaded. The fragment size (bp) is indicated to the right.
Ijms 23 06220 g005
Figure 6. Proportions of the ancestry of 25 S. rebaudiana accessions based on K = 4 (where K is the number of initial subpopulations, each indicated with a different colour). Genotype codes are listed in Table 3 (see Methods).
Ijms 23 06220 g006
Table 1. Number of genes belonging to gene families involved in steviol glycoside metabolism found in proximity (within 100,000 bp upstream and downstream of each gene) of sequences complementary to ANG5+ IRAP primer.
Gene FamilyNumber of Genes
UDP-glycosyltransferase18
Ent-kaurene oxidase 5
Geranylgeranyl pyrophosphate synthase3
Methyl-erythritol-phosphate cytidylyltransferase3
Hydroxy-methylbutenyl diphosphate synthase (ferredoxin)2
Deoxy-xylulose-phosphate reductoisomerase1
Deoxy-xylulose-phosphate synthase1
Isopentenyl-diphosphate Delta-isomerase1
Methyl-erythritol cyclodiphosphate synthase1
Table 2. ID code, name, and origin of 25 S. rebaudiana accessions used in this research.
ID CodeAccession NameOriginCultivated in
1/4MA1/4Brasilpot
1MApt1Brasilpot
2MA13/1Brasilpot
3MApt2Brasilpot
4MA10/1Brasilpot
5MApt5Brasilpot
6MA7/3Brasilpot
7MApt3Brasilpot
8MApt4Brasilpot
9SV1Brasilpot
10CriollaParaguaypot
11Sweet HerbParaguaypot
APLIsraelfield
BBR16Brasilpot
CRGmItalyfield
DSLIsraelfield
ENumItalypot
FCOIsraelfield
GBR5Brasilfield
HSW30Italyfield
IBR1Brasilfield
LMASV4-2/2Brasilpot
MEireteParaguaypot
B1BR16Brasilpot
B3BR16Brasilpot
Publisher’s Note: MDPI stays neutral with regard to jurisdictional claims in published maps and institutional affiliations.

