
Platelet-Derived miR-126-3p Directly Targets AKT2 and Exerts Anti-Tumor Effects in Breast Cancer Cells: Further Insights in Platelet-Cancer Interplay

 , and
, and 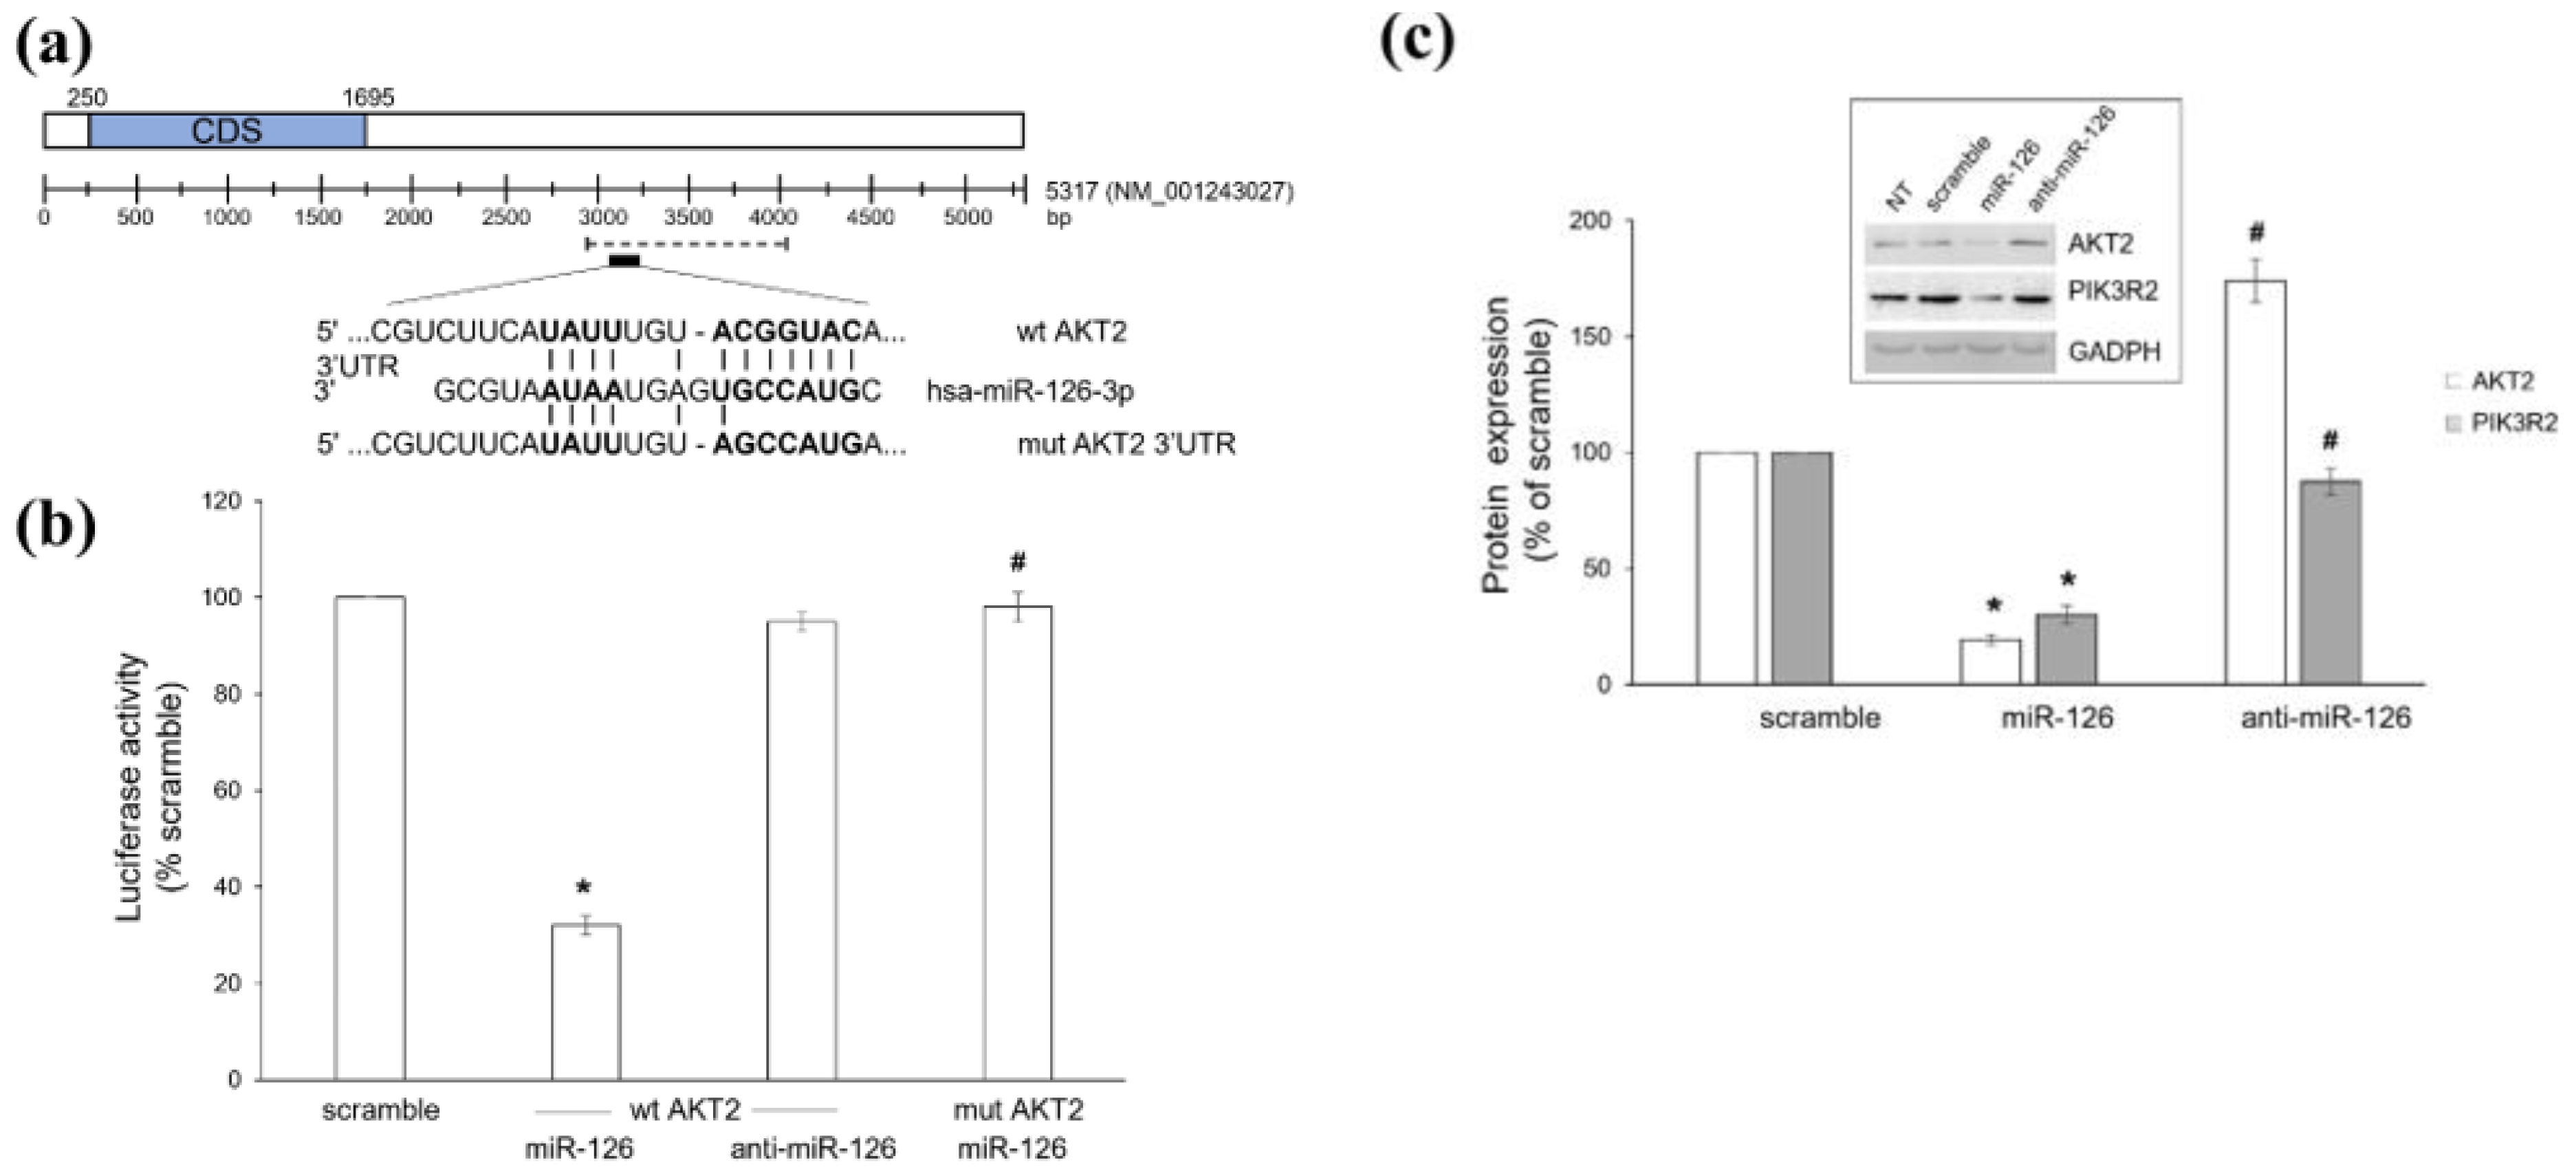
Abstract
:1. Introduction
2. Results
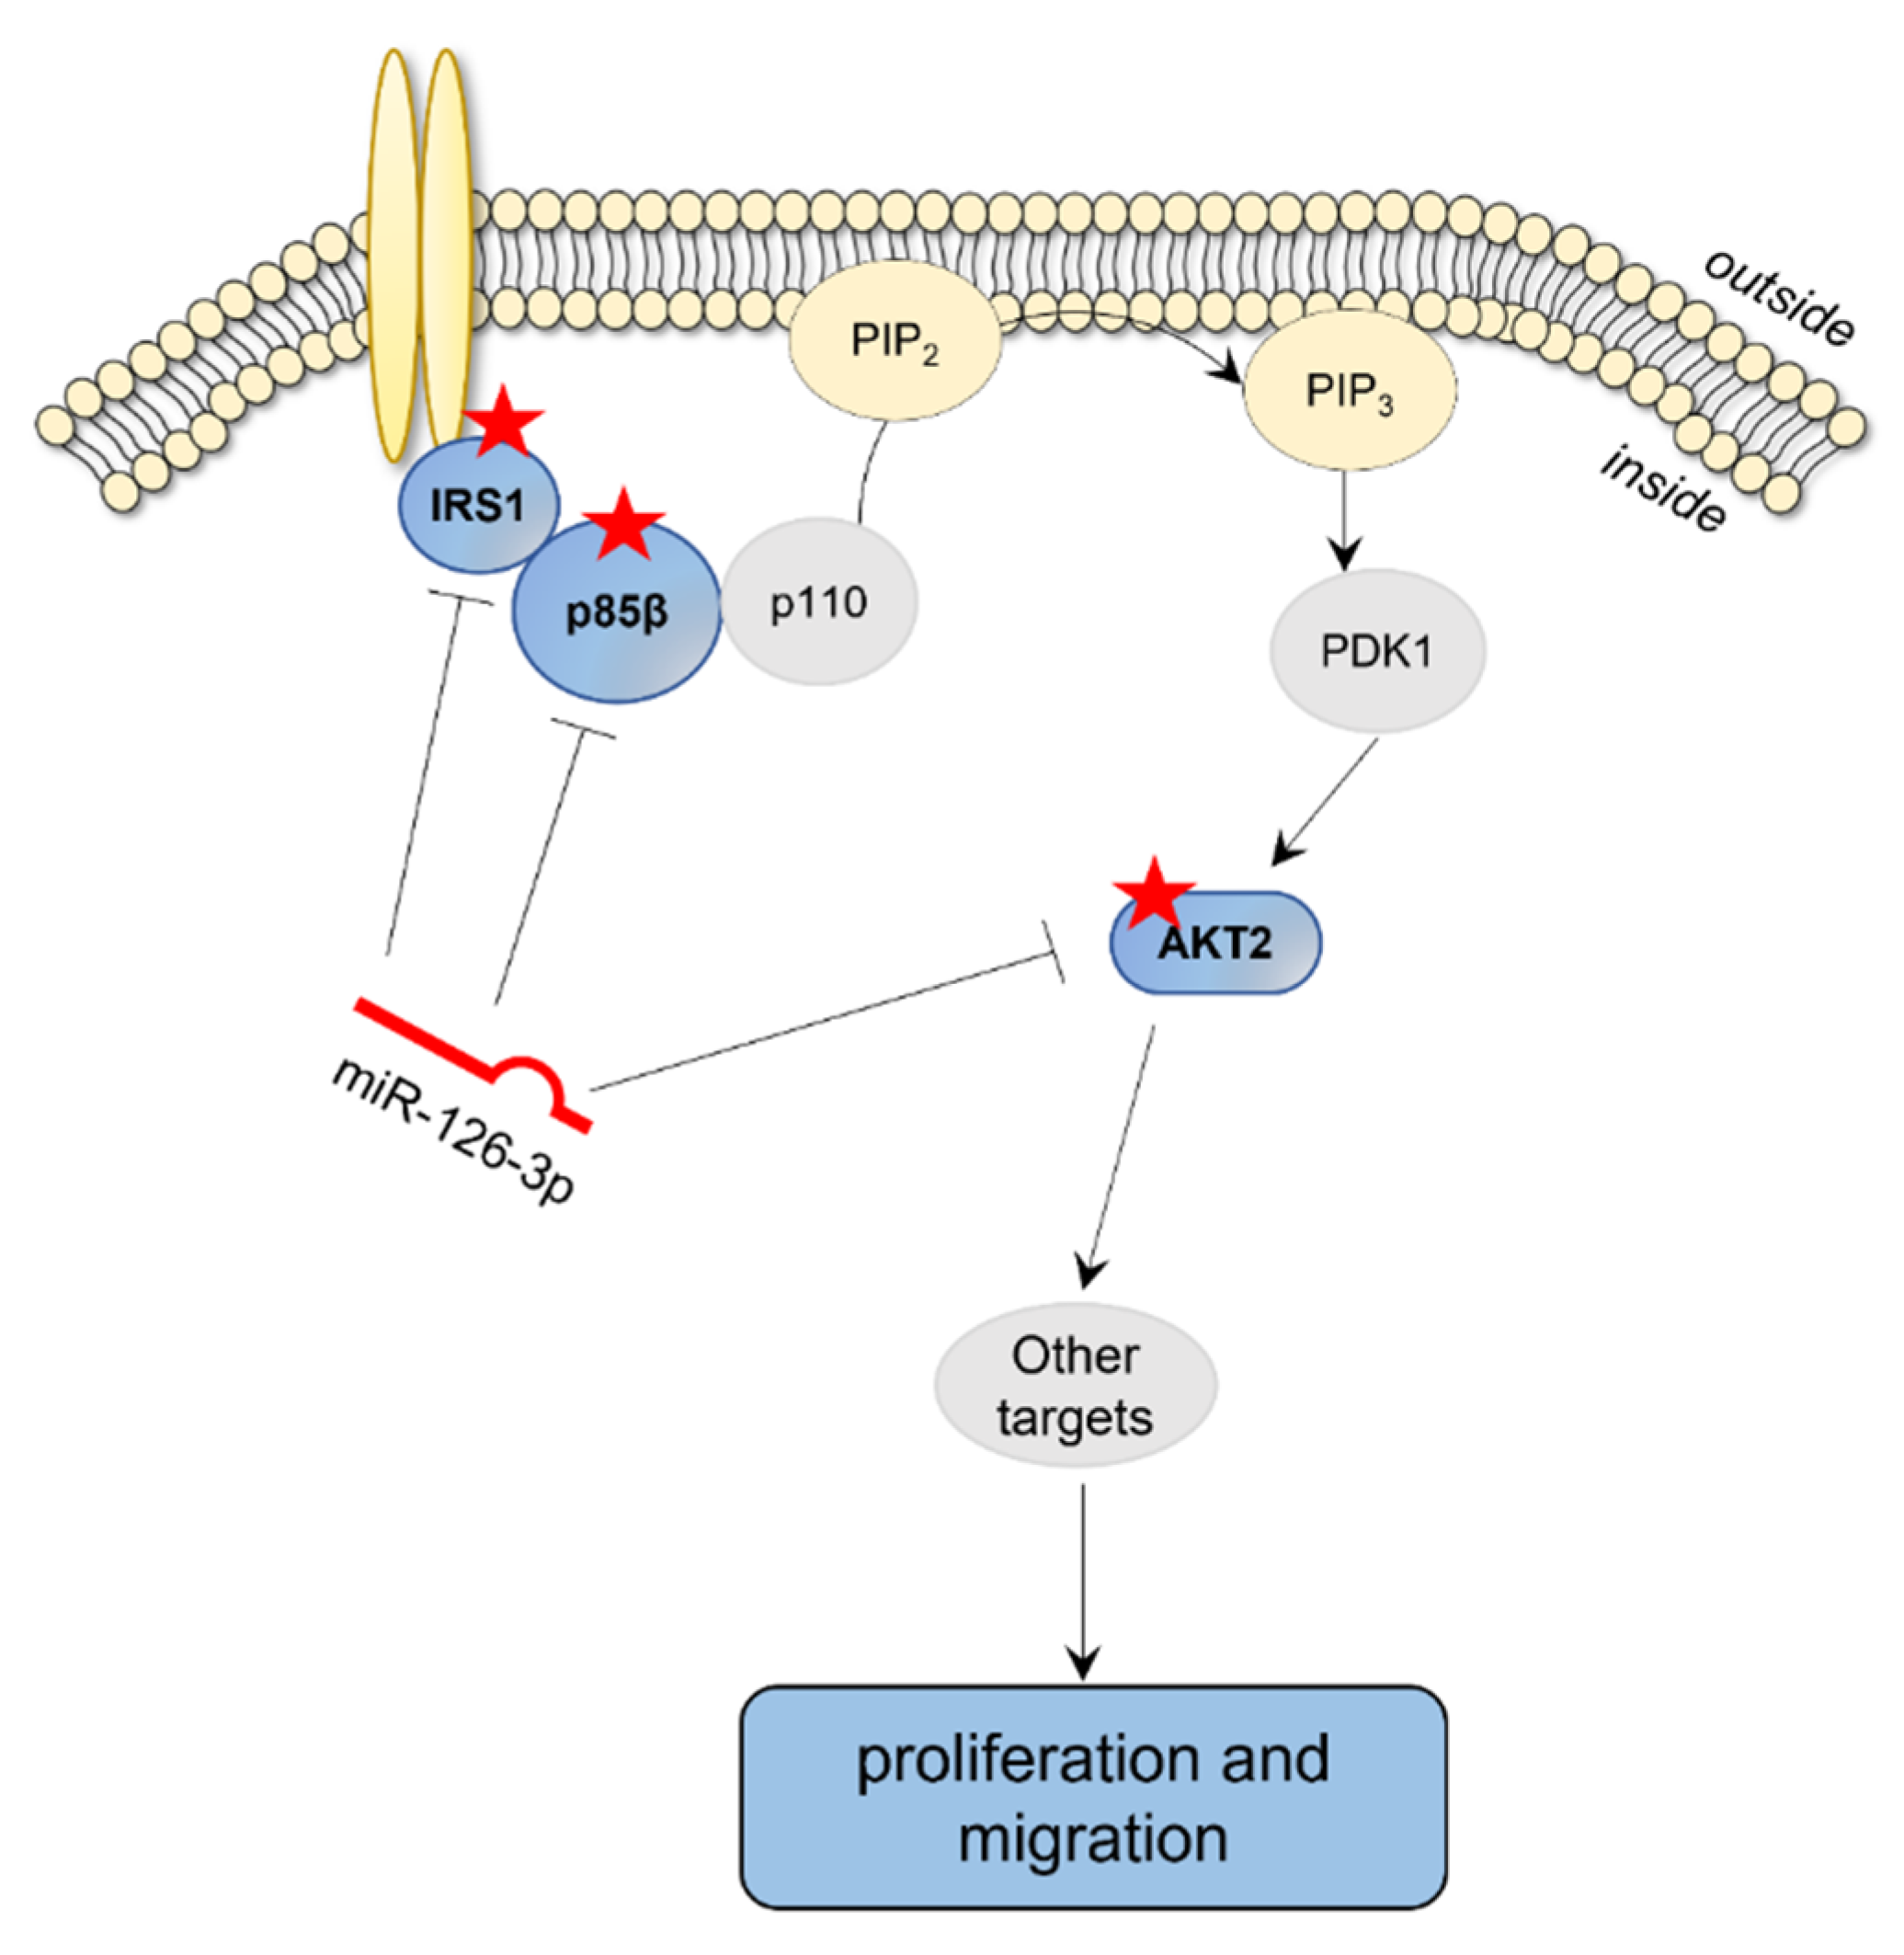
2.1. Platelet-Derived miR-126 Directly Targets AKT2
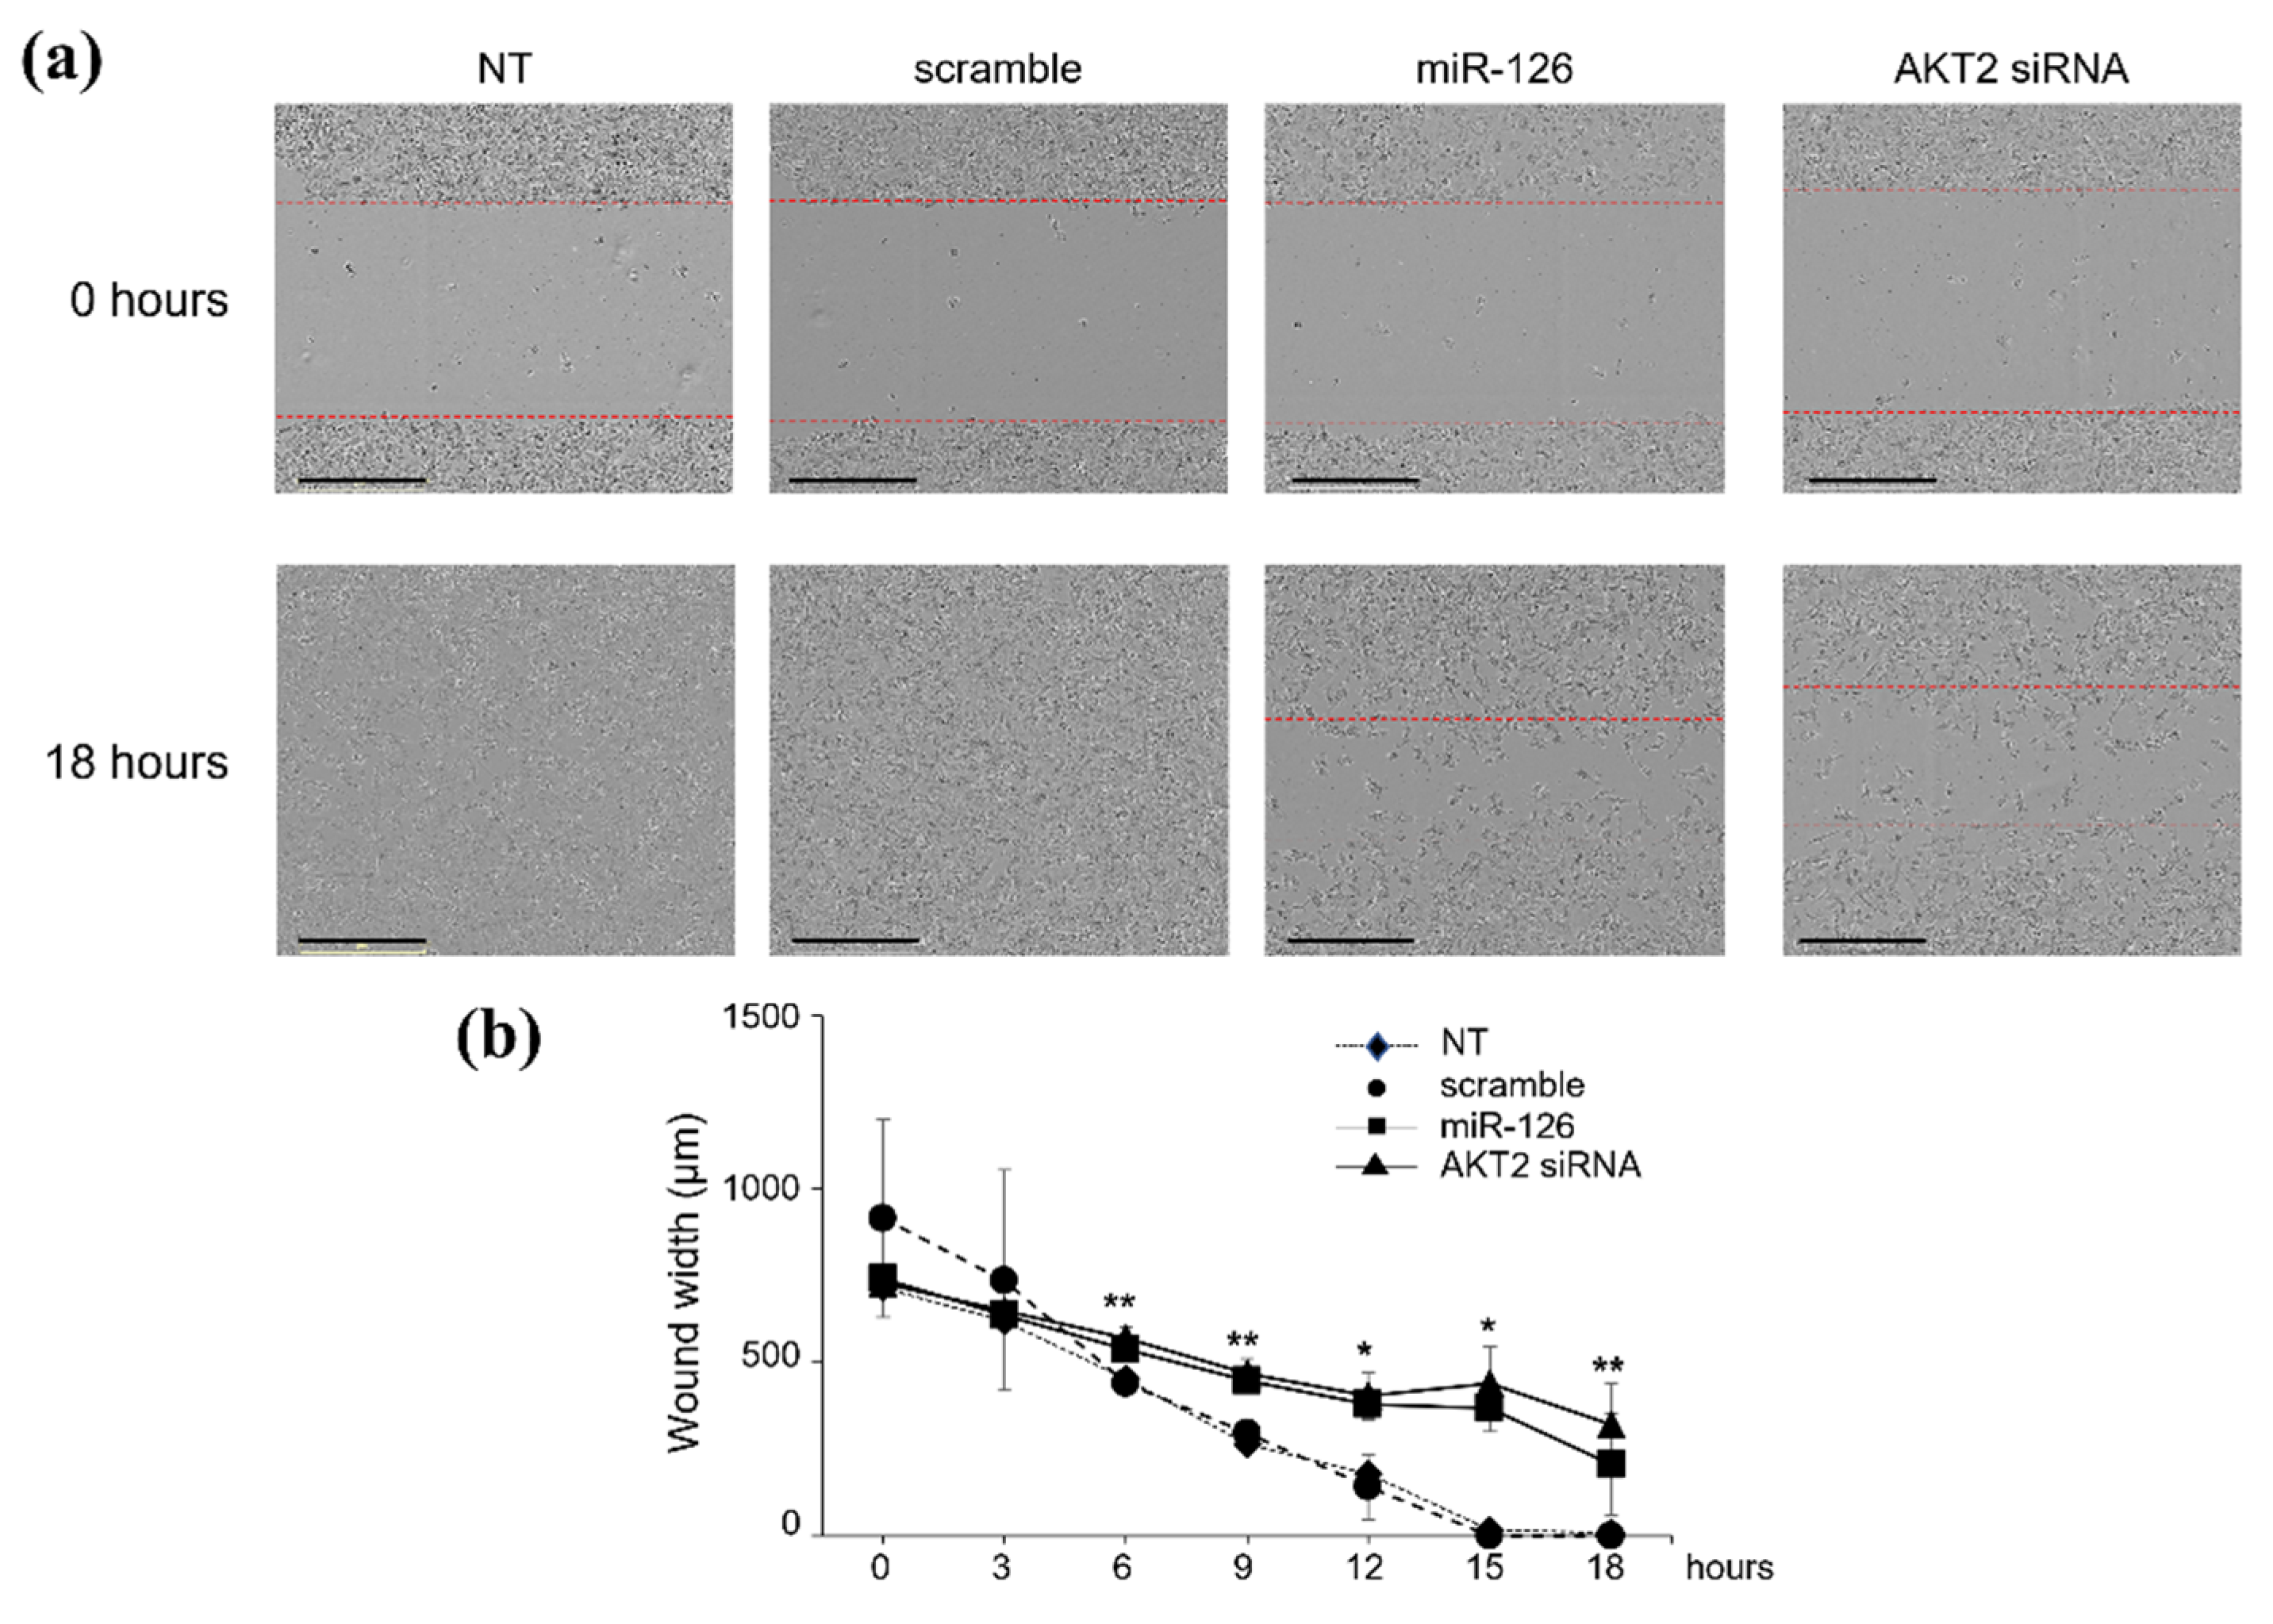
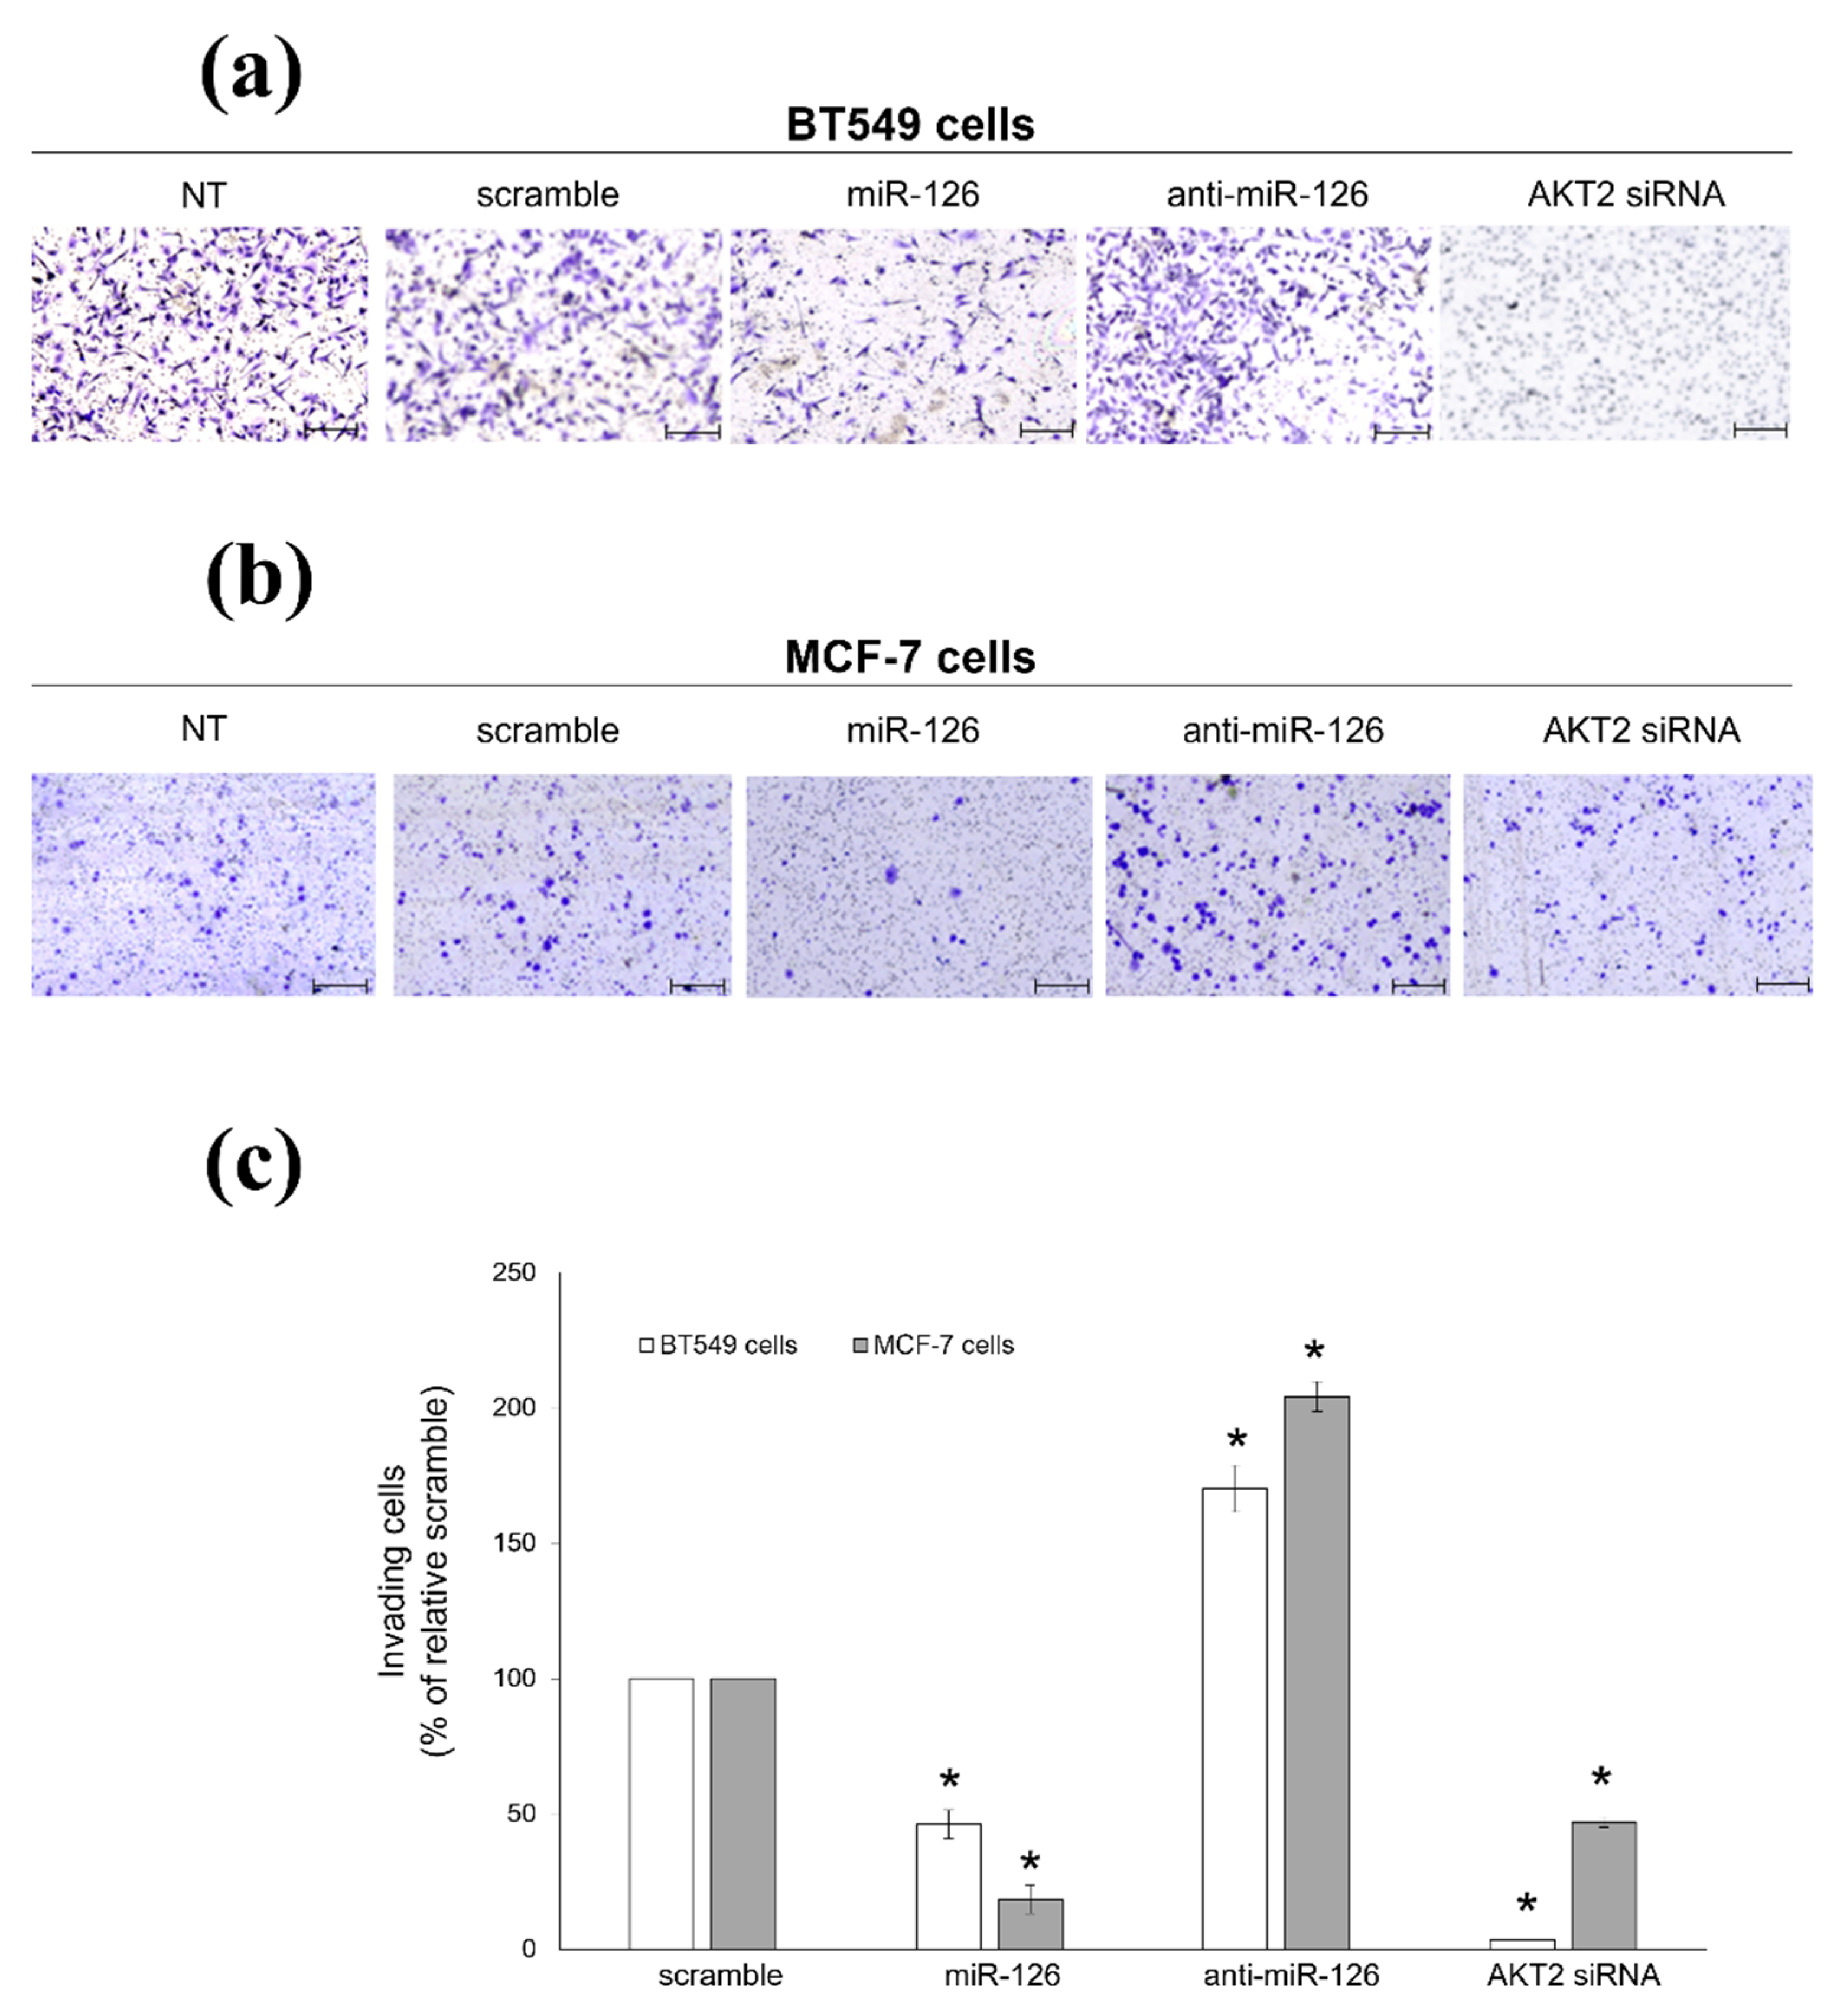
2.2. miR-126-3p-Mediated Downregulation of AKT2 Inhibits Migration and Invasiveness of BC Cells
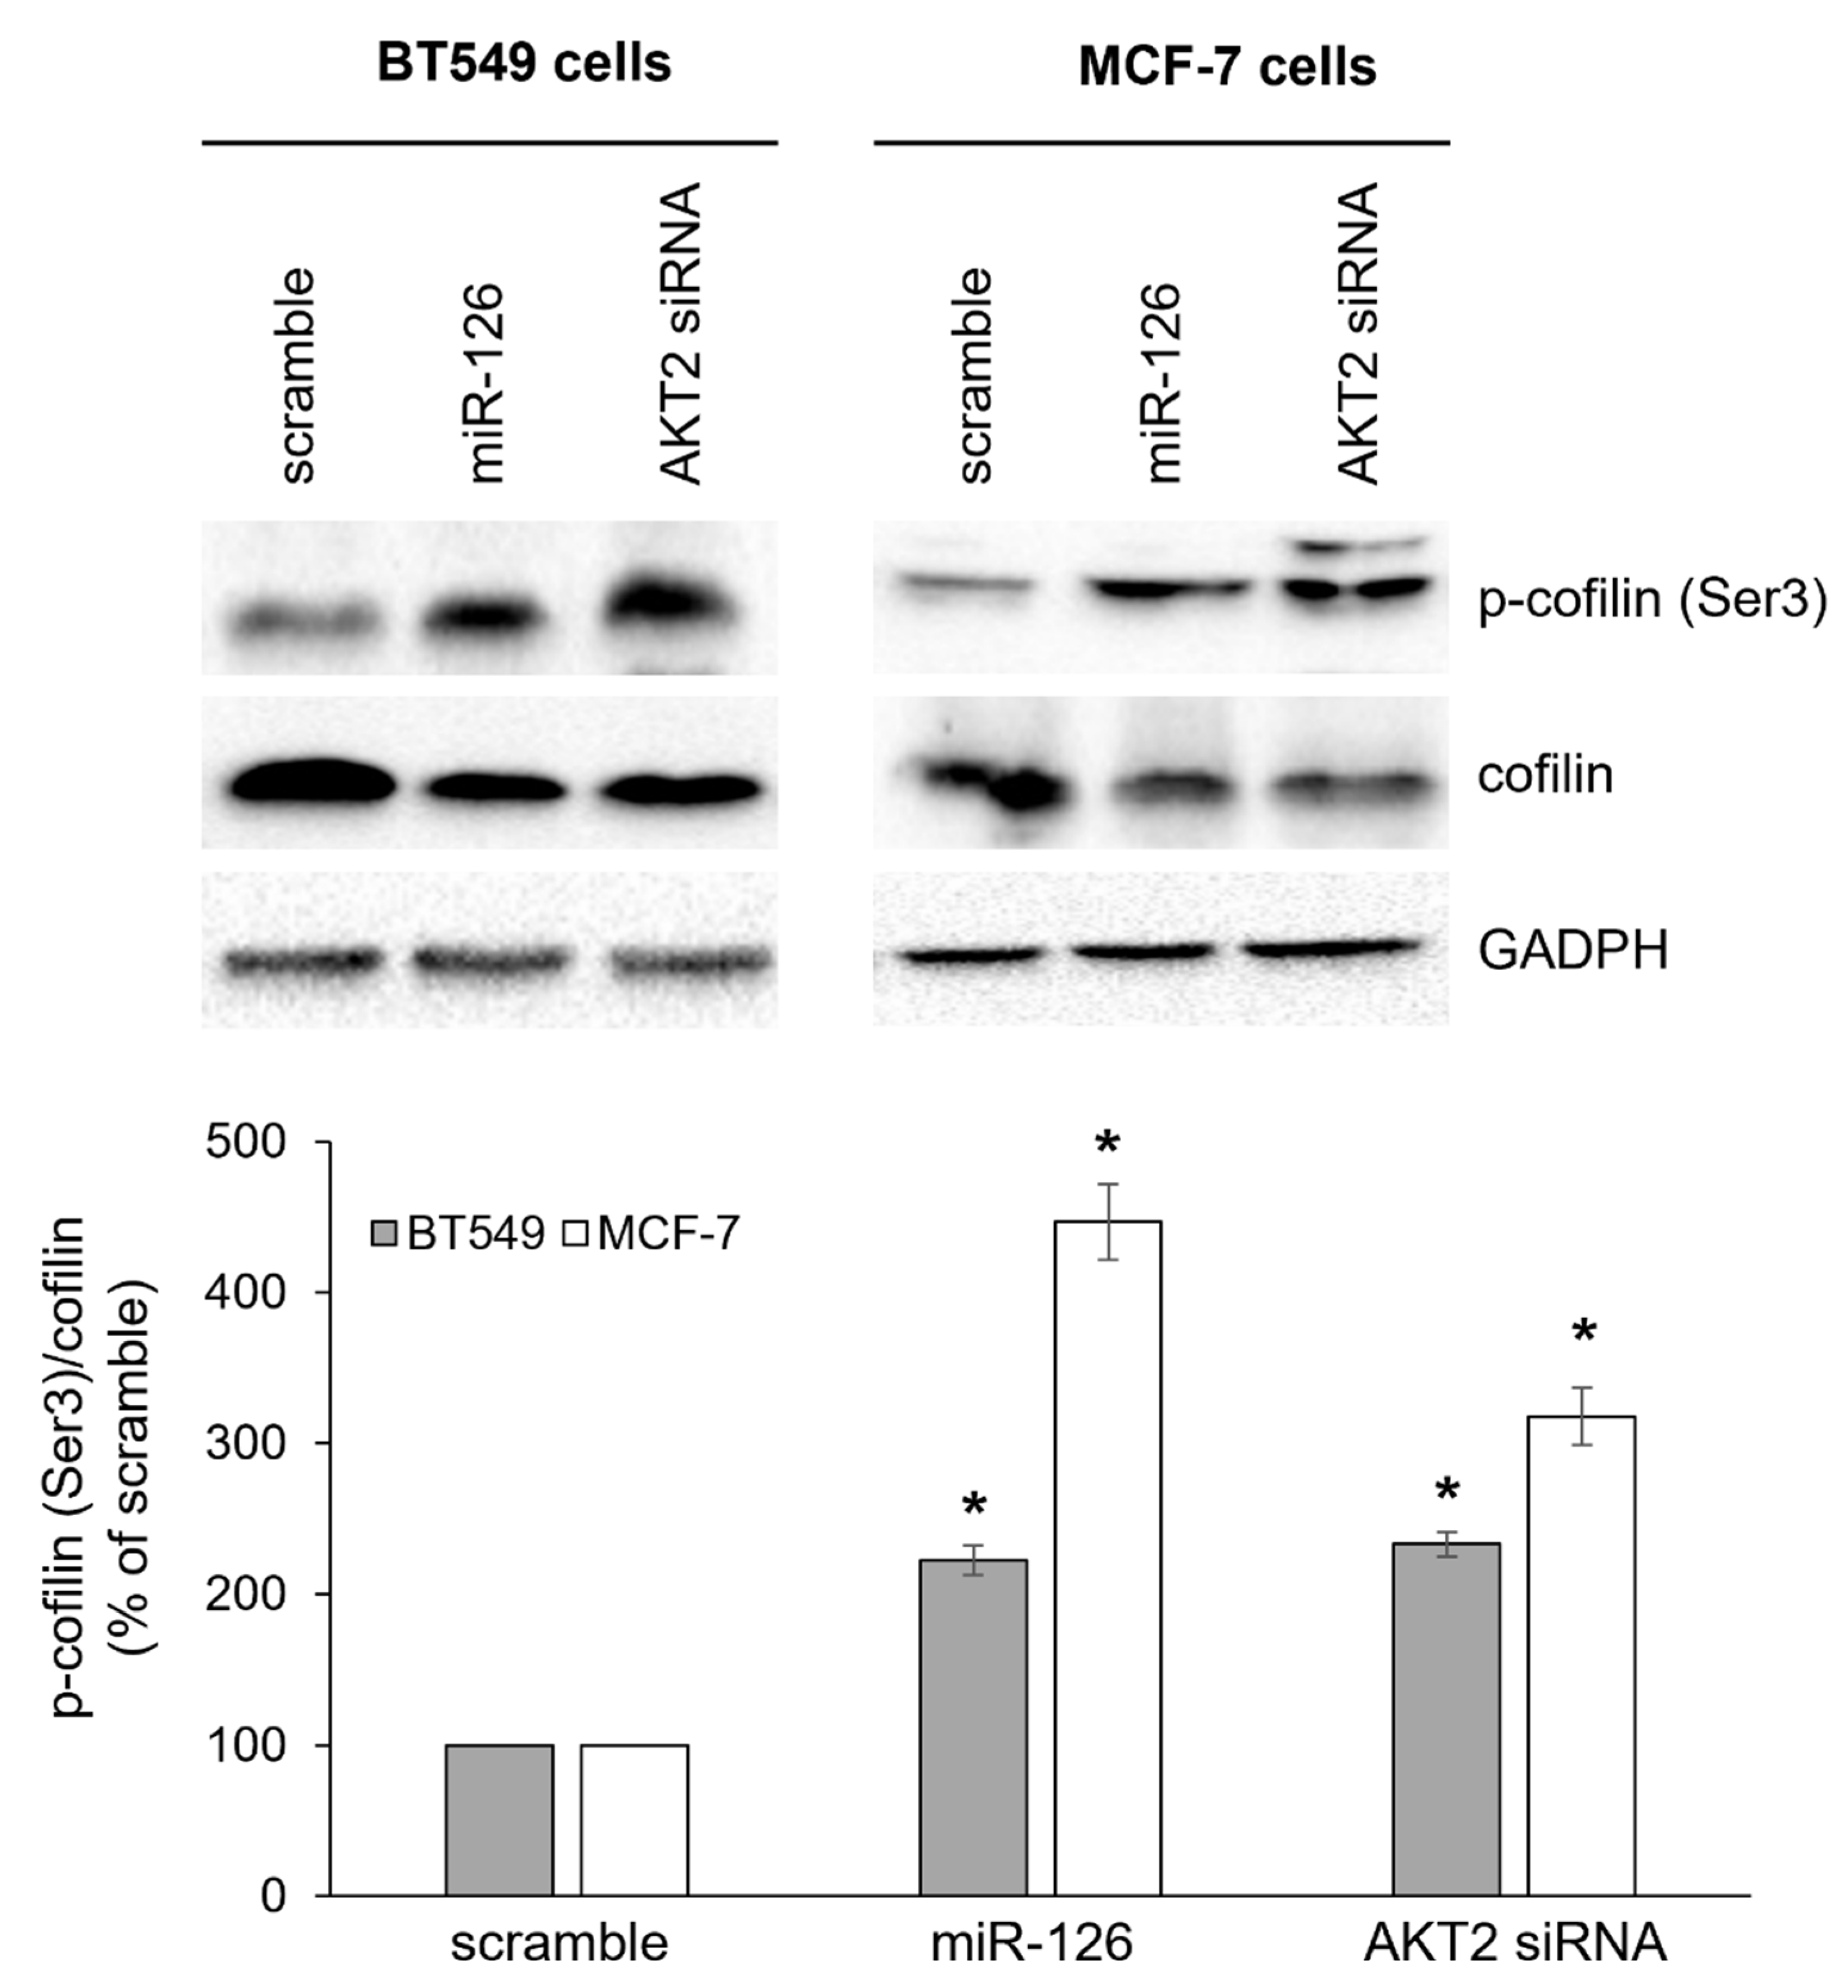
2.3. miR-126-3p-Mediated Downregulation of AKT2 Inhibits Phosphorylation-Dependent Cofilin Activity
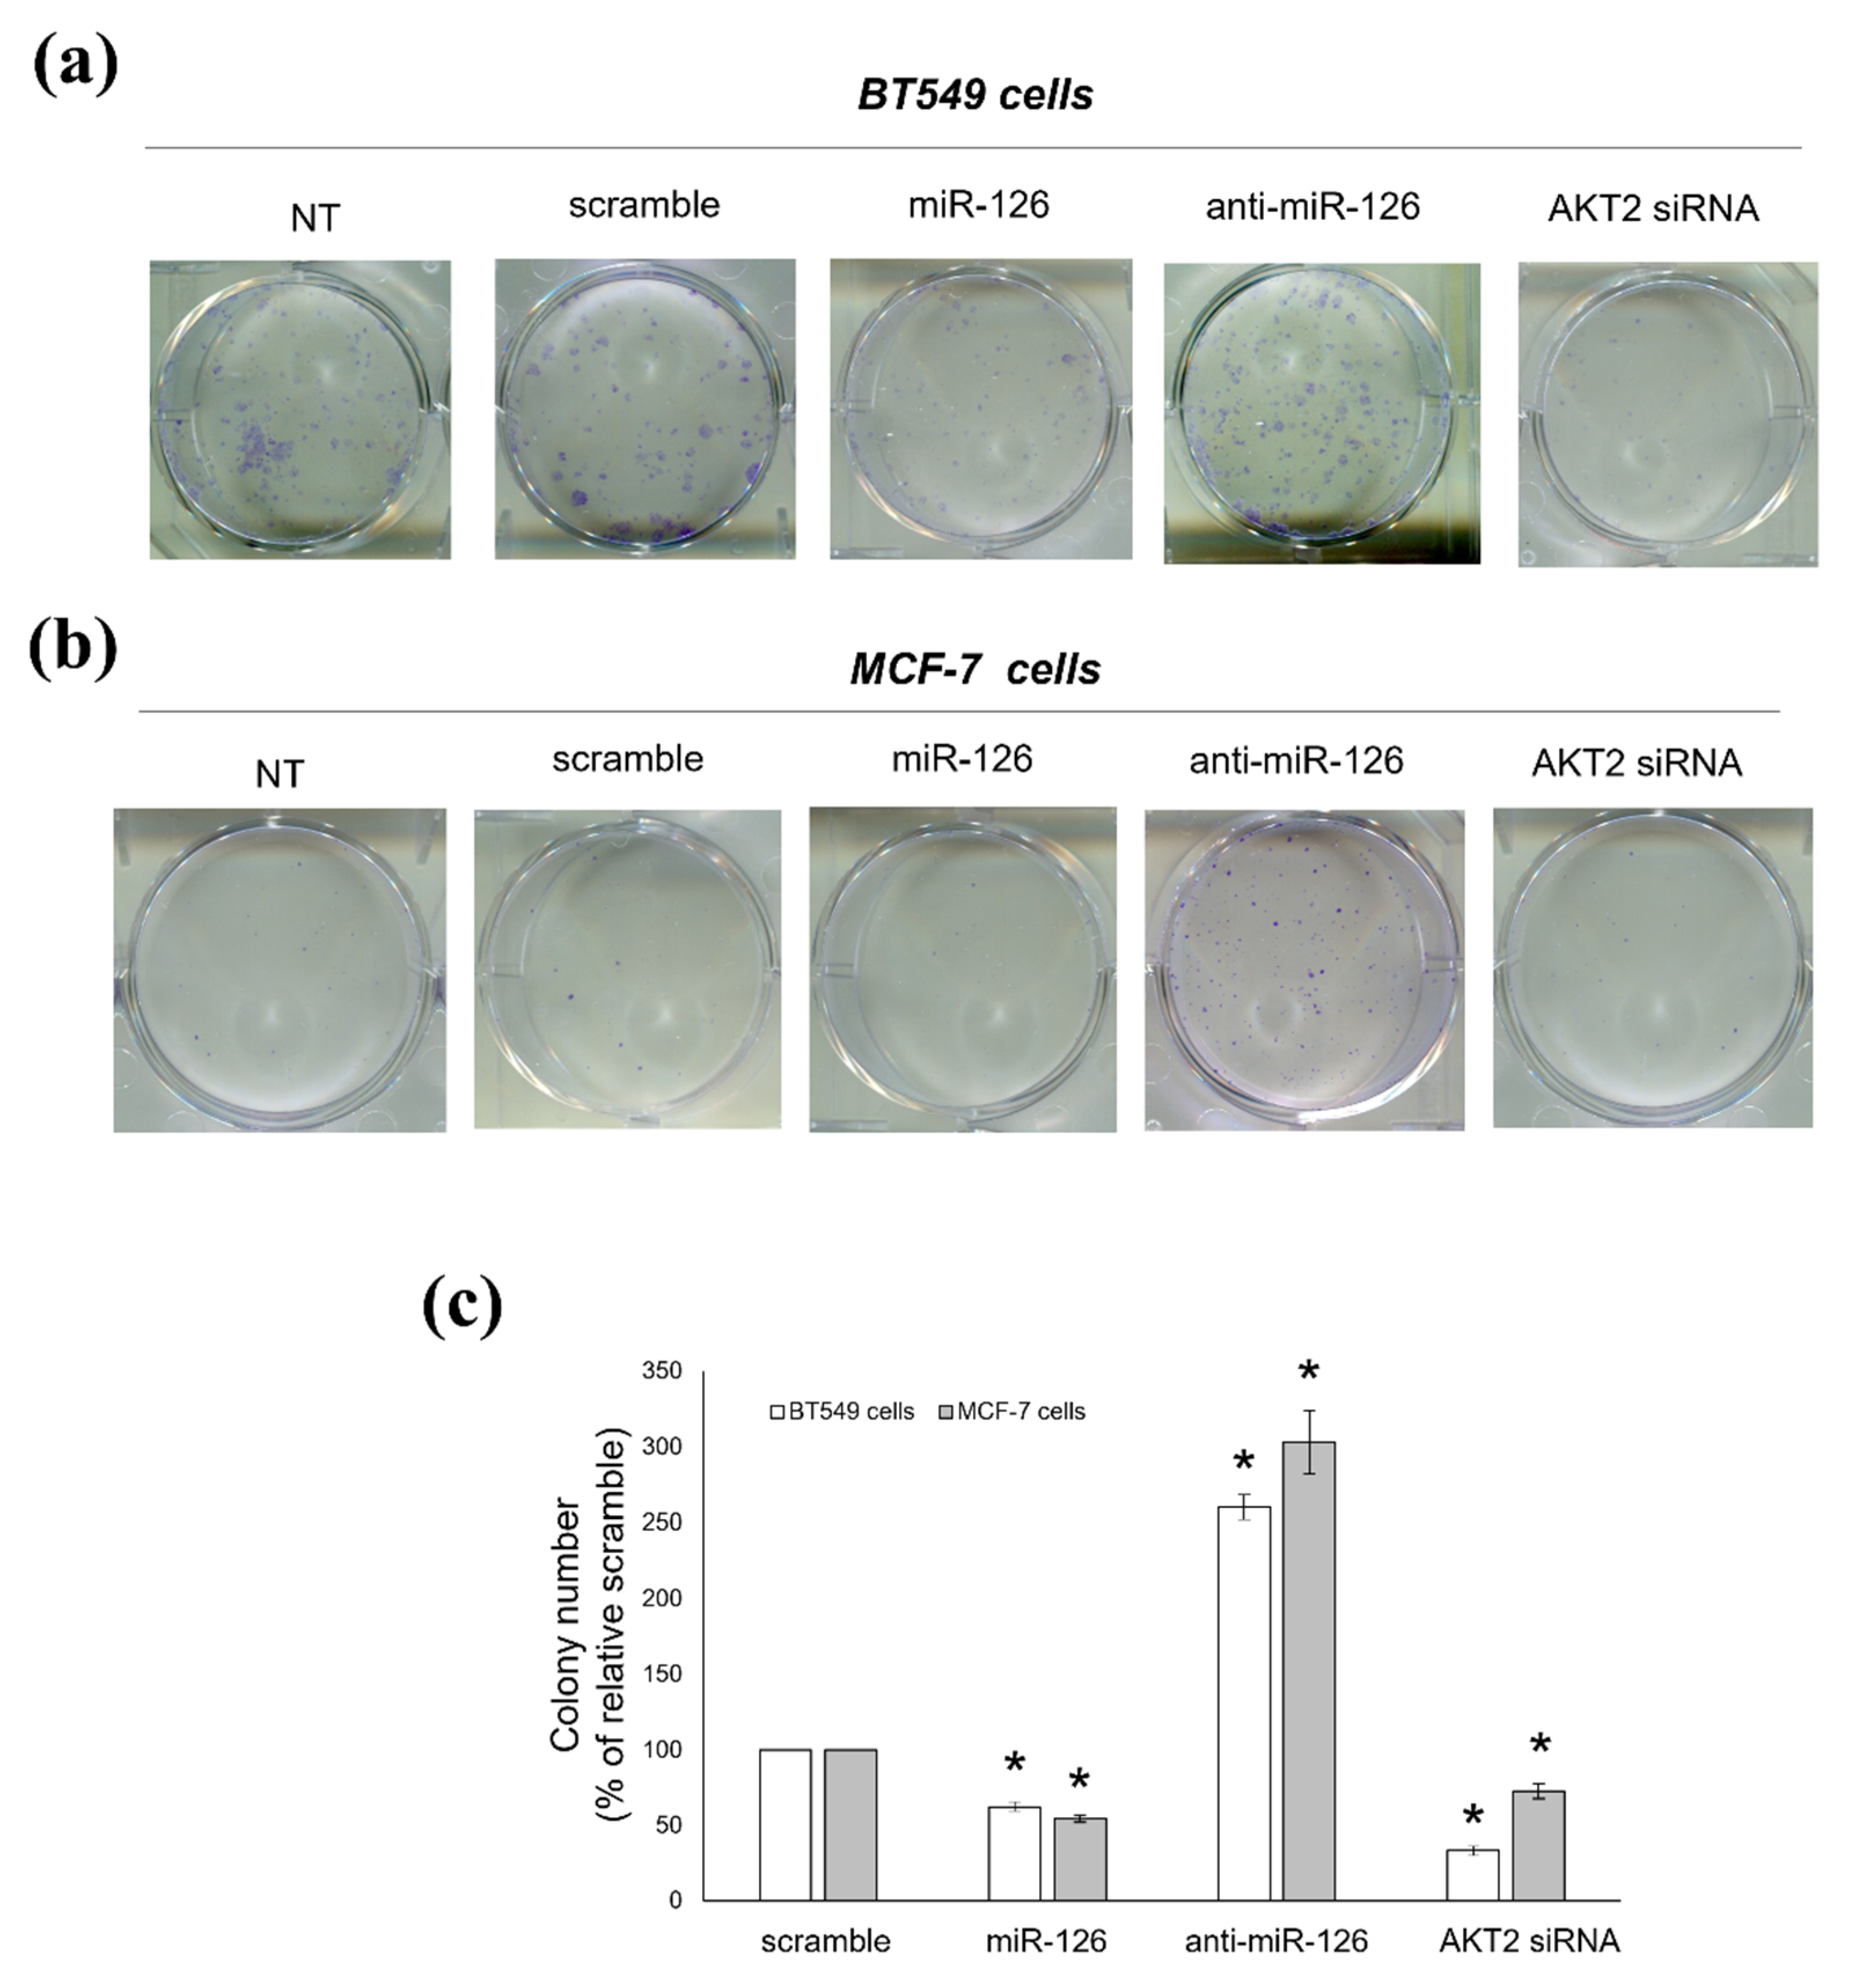
2.4. miR-126-3p-Mediated Downregulation of AKT2 Decreases the Clonogenic Potential of BC Cells
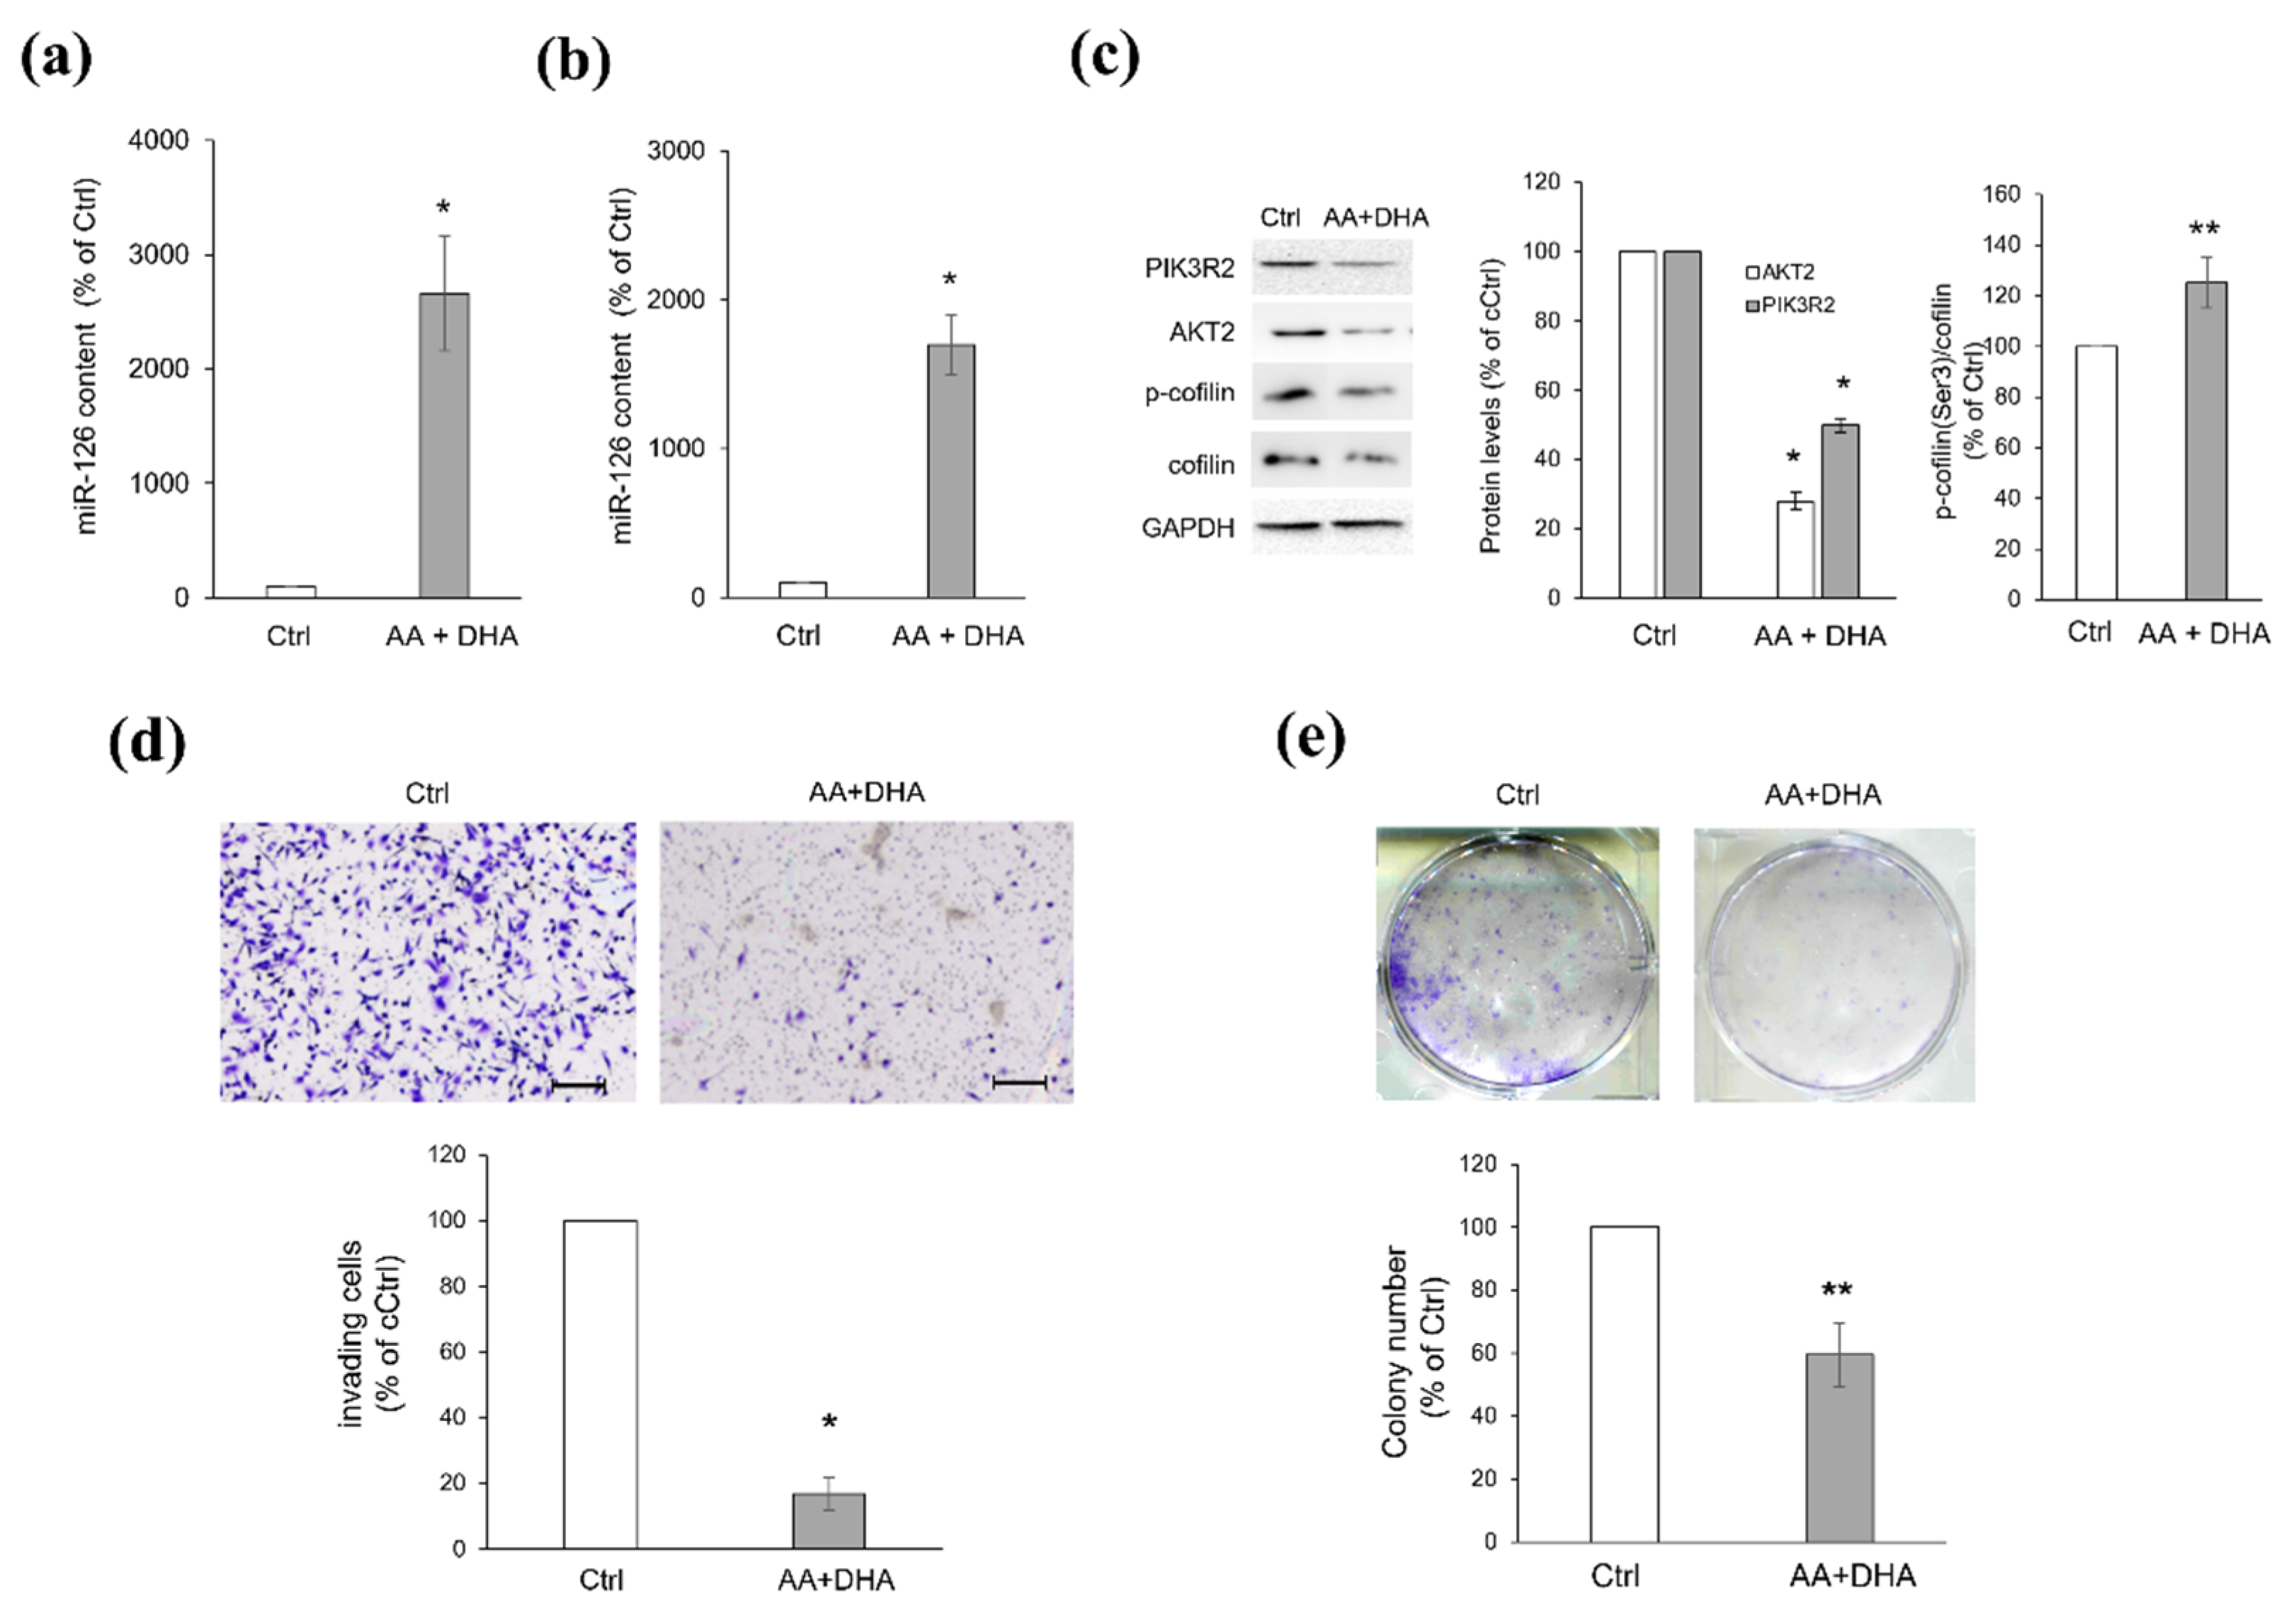
2.5. Platelets Regulate BC Cell Behaviours via miR-126-3p-Mediated Downregulation of AKT2
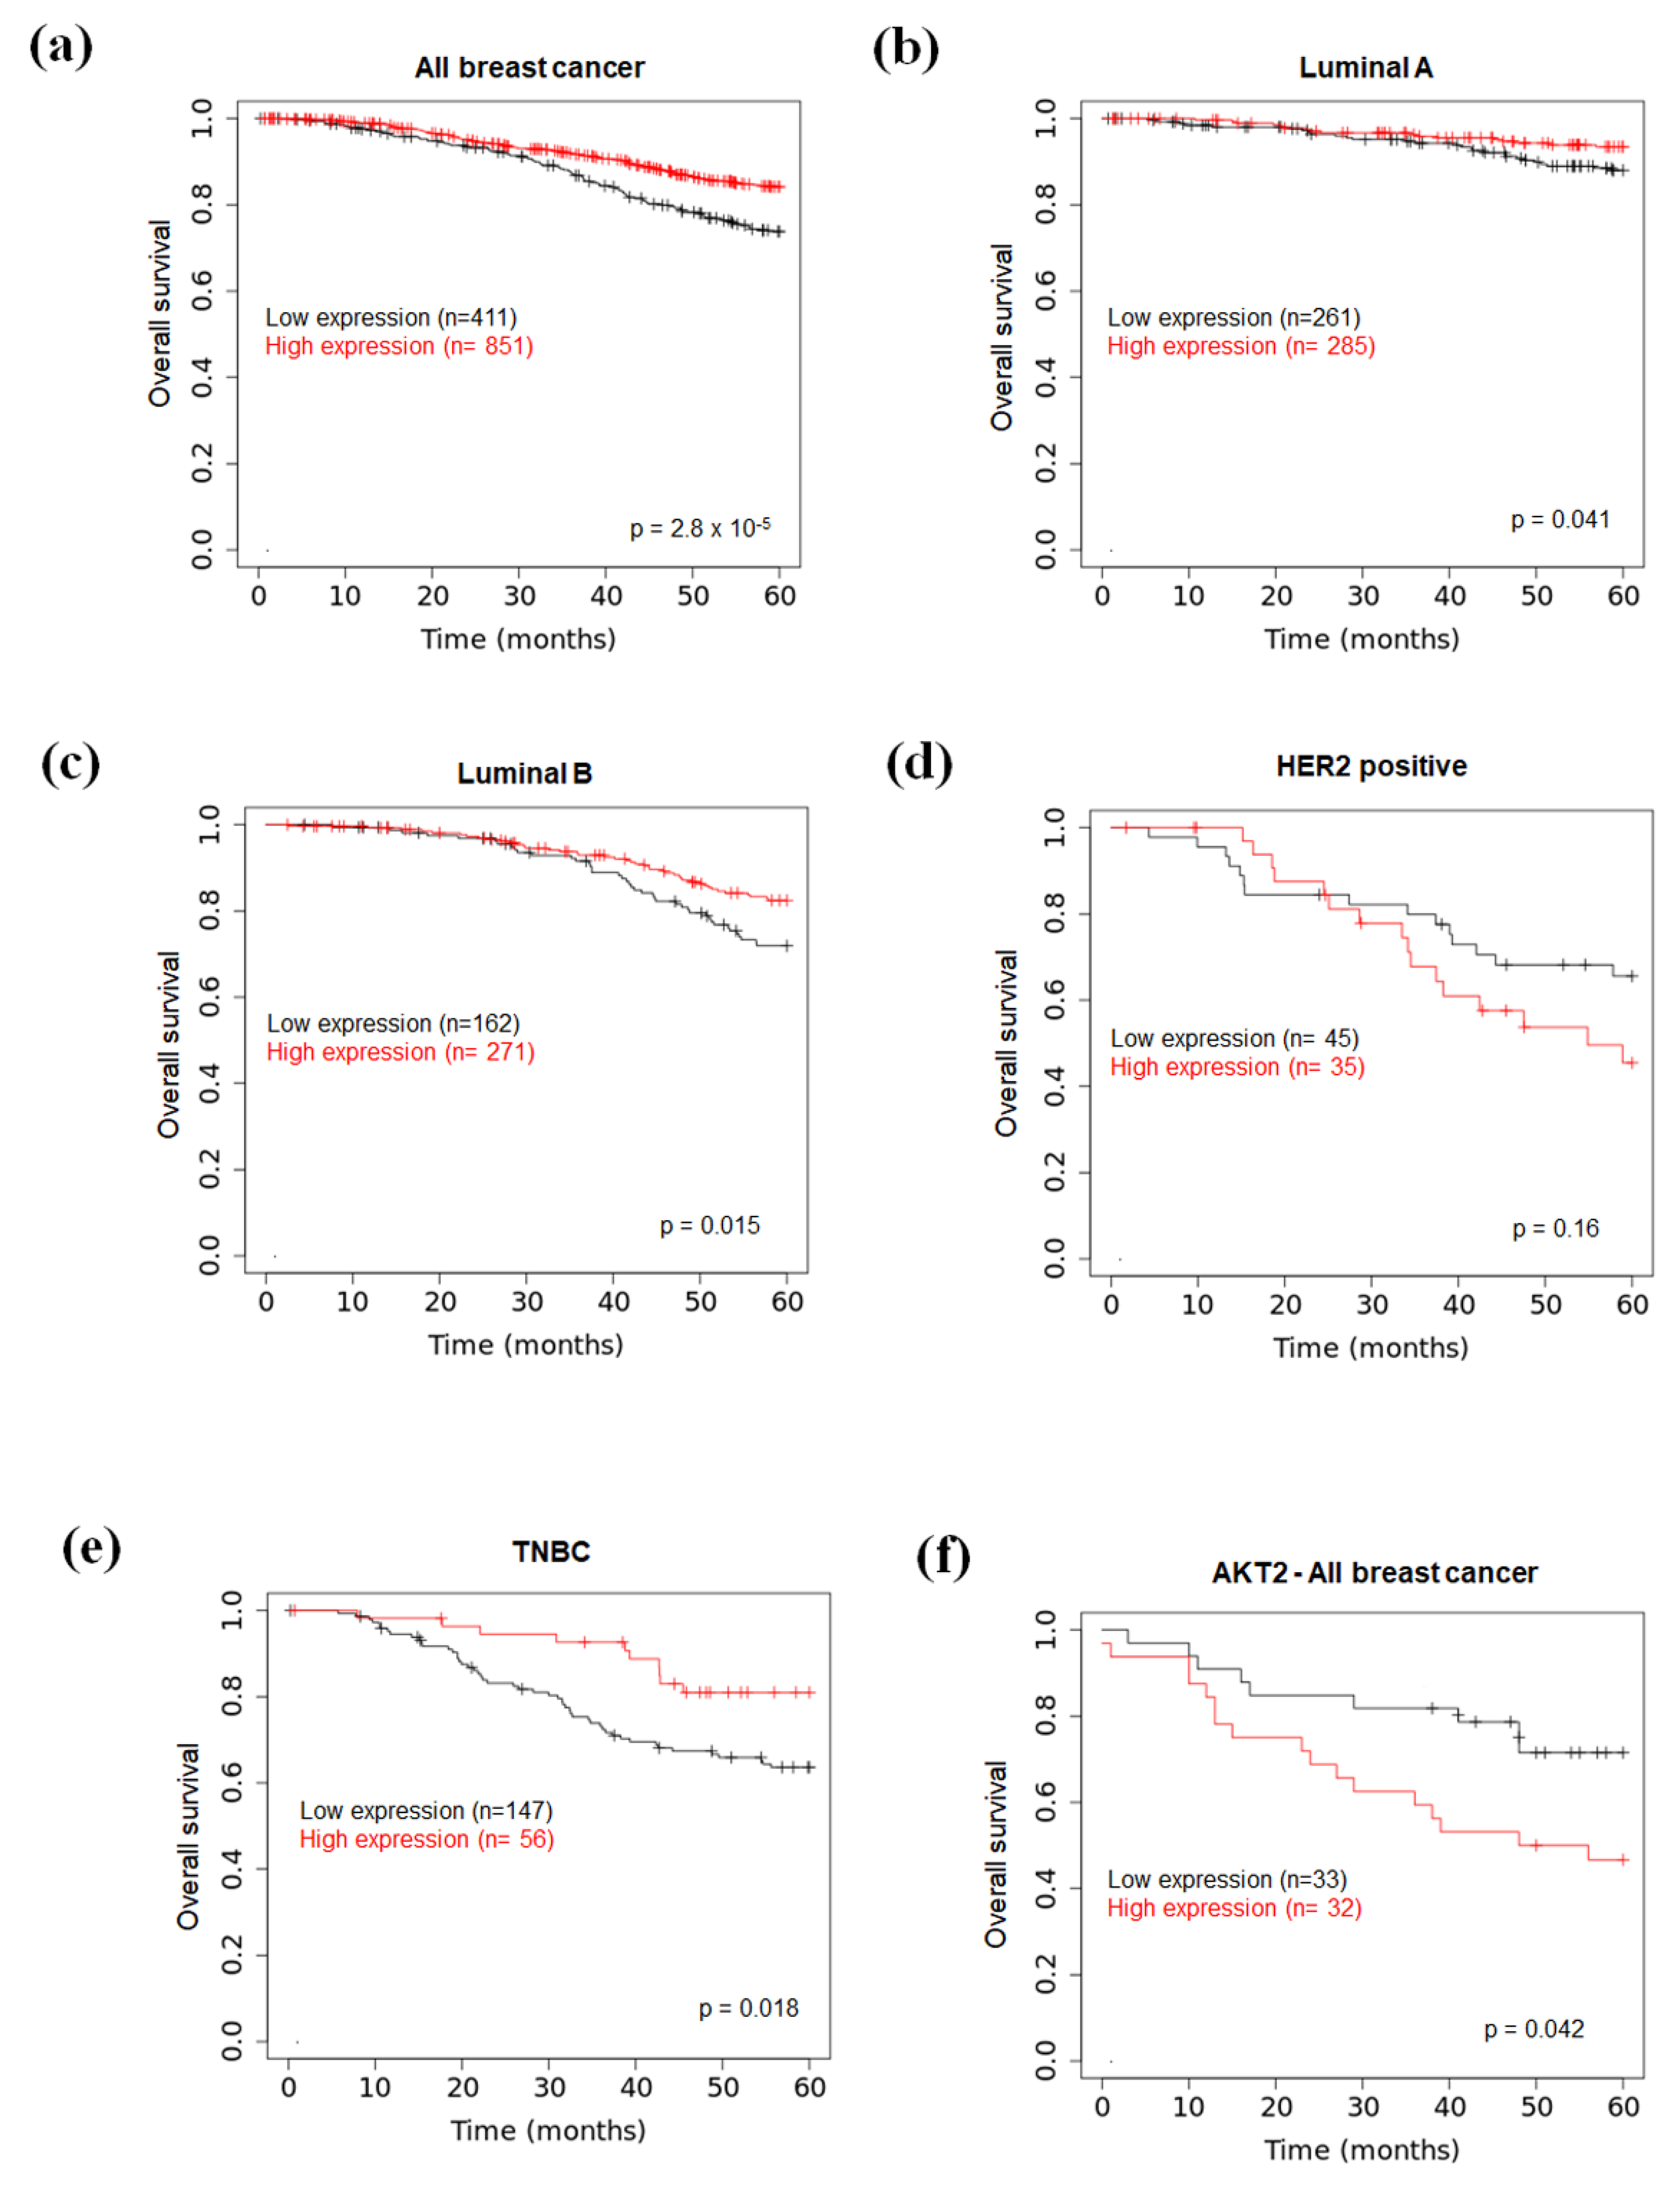
2.6. Prognostic Value of miR-126 and AKT2 Levels in BC
3. Discussion
4. Materials and Methods
4.1. Cell Cultures
4.2. Platelet Isolation
4.3. Isolation of Platelet-Derived MVs and Delivery to Cancer Cells
4.4. Bioinformatic Studies
4.5. In Vitro Transient Transfections
4.6. Cloning of AKT2 3′UTR and Luciferase Assay
4.7. Scratch Wound Healing Assay
4.8. Invasion Assay
4.9. Colony Forming Unit (CFU) Assay
4.10. Real-Time PCR
4.11. Western Blot
4.12. Statistical Analysis
Supplementary Materials
Author Contributions
Funding
Institutional Review Board Statement
Informed Consent Statement
Conflicts of Interest
References
- Catani, M.V.; Savini, I.; Tullio, V.; Gasperi, V. The “janus face” of platelets in cancer. Int. J. Mol. Sci. 2020, 21, 788. [Google Scholar] [CrossRef] [PubMed] [Green Version]
- Crescente, M.; Menke, L.; Chan, M.V.; Armstrong, P.C.; Warner, T.D. Eicosanoids in platelets and the effect of their modulation by aspirin in the cardiovascular system (and beyond). Br. J. Pharmacol. 2019, 176, 988–999. [Google Scholar] [CrossRef] [PubMed]
- Porro, B.; Songia, P.; Squellerio, I.; Tremoli, E.; Cavalca, V. Analysis, physiological and clinical significance of 12-HETE: A neglected platelet-derived 12-lipoxygenase product. J. Chromatogr. B Anal. Technol. Biomed. Life Sci. 2014, 964, 26–40. [Google Scholar] [CrossRef] [PubMed]
- Rauzi, F.; Kirkby, N.S.; Edin, M.L.; Whiteford, J.; Zeldin, D.C.; Mitchell, J.A.; Warner, T.D. Aspirin inhibits the production of proangiogenic 15(S)-HETE by platelet cyclooxygenase-1. FASEB J. 2016, 30, 4256–4266. [Google Scholar] [CrossRef] [PubMed] [Green Version]
- Tsoi, K.K.F.; Ho, J.M.W.; Chan, F.C.H.; Sung, J.J.Y. Long-term use of low-dose aspirin for cancer prevention: A 10-year population cohort study in Hong Kong. Int. J. Cancer 2019, 145, 267–273. [Google Scholar] [CrossRef]
- Müller, K.; Gilbertz, K.P.; Meineke, V. Serotonin and ionizing radiation synergistically affect proliferation and adhesion molecule expression of malignant melanoma cells. J. Dermatol. Sci. 2012, 68, 89–98. [Google Scholar] [CrossRef]
- Nocito, A.; Dahm, F.; Jochum, W.; Jae, H.J.; Georgiev, P.; Bader, M.; Graf, R.; Clavien, P.A. Serotonin regulates macrophage-mediated angiogenesis in a mouse model of colon cancer allografts. Cancer Res. 2008, 68, 5152–5158. [Google Scholar] [CrossRef] [Green Version]
- Goubran, H.A.; Kotb, R.R.; Stakiw, J.; Emara, M.E.; Burnouf, T. Regulation of Tumor Growth and Metastasis: The Role of Tumor Microenvironment. Cancer Growth Metastasis 2014, 7, 9–18. [Google Scholar] [CrossRef] [Green Version]
- Goubran, H.A.; Stakiw, J.; Radosevic, M.; Burnouf, T. Platelet-cancer interactions. Semin. Thromb. Hemost. 2014, 40, 296–305. [Google Scholar] [CrossRef]
- Mezouar, S.; Mege, D.; Darbousset, R.; Farge, D.; Debourdeau, P.; Dignat-George, F.; Panicot-Dubois, L.; Dubois, C. Involvement of platelet-derived microparticles in tumor progression and thrombosis. Semin. Oncol. 2014, 41, 346–358. [Google Scholar] [CrossRef]
- Janowska-Wieczorek, A.; Wysoczynski, M.; Kijowski, J.; Marquez-Curtis, L.; Machalinski, B.; Ratajczak, J.; Ratajczak, M.Z. Microvesicles derived from activated platelets induce metastasis and angiogenesis in lung cancer. Int. J. Cancer 2005, 113, 752–760. [Google Scholar] [CrossRef] [PubMed]
- Lazar, S.; Goldfinger, L.E. Platelet Microparticles and miRNA Transfer in Cancer Progression: Many Targets, Modes of Action, and Effects Across Cancer Stages. Front. Cardiovasc. Med. 2018, 5, 13. [Google Scholar] [CrossRef] [PubMed]
- Zarà, M.; Guidetti, G.; Boselli, D.; Villa, C.; Canobbio, I.; Seppi, C.; Visconte, C.; Canino, J.; Torti, M. Release of Prometastatic Platelet-Derived Microparticles Induced by Breast Cancer Cells: A Novel Positive Feedback Mechanism for Metastasis. TH Open 2017, 01, e155–e163. [Google Scholar] [CrossRef] [PubMed] [Green Version]
- Cao, L.; Zhang, X.; Cao, F.; Wang, Y.; Shen, Y.; Yang, C.; Uzan, G.; Peng, B.; Zhang, D. Inhibiting inducible miR-223 further reduces viable cells in human cancer cell lines MCF-7 and PC3 treated by celastrol. BMC Cancer 2015, 15, 873. [Google Scholar] [CrossRef] [PubMed]
- Gasperi, V.; Vangapandu, C.; Savini, I.; Ventimiglia, G.; Adorno, G.; Catani, M.V. Polyunsaturated fatty acids modulate the delivery of platelet microvesicle-derived microRNAs into human breast cancer cell lines. J. Nutr. Biochem. 2019, 74, 108242. [Google Scholar] [CrossRef] [PubMed]
- Michael, J.V.; Wurtzel, J.G.T.; Mao, G.F.; Rao, A.K.; Kolpakov, M.A.; Sabri, A.; Hoffman, N.E.; Rajan, S.; Tomar, D.; Madesh, M.; et al. Platelet microparticles infiltrating solid tumors transfer miRNAs that suppress tumor growth. Blood 2017, 130, 567–580. [Google Scholar] [CrossRef] [PubMed] [Green Version]
- Sun, X.; Li, Y.; Zheng, M.; Zuo, W.; Zheng, W. MicroRNA-223 increases the sensitivity of triple-negative breast cancer stem cells to TRAIL-Induced apoptosis by targeting HAX-1. PLoS ONE 2016, 11, 1DUMMUY. [Google Scholar] [CrossRef] [Green Version]
- Fish, J.E.; Santoro, M.M.; Morton, S.U.; Yu, S.; Yeh, R.-F.; Wythe, J.D.; Ivey, K.N.; Bruneau, B.G.; Stainier, D.Y.R.; Srivastava, D. miR-126 Regulates Angiogenic Signaling and Vascular Integrity. Dev. Cell 2008, 15, 272–284. [Google Scholar] [CrossRef] [Green Version]
- Kuhnert, F.; Mancuso, M.R.; Hampton, J.; Stankunas, K.; Asano, T.; Chen, C.-Z.; Kuo, C.J. Attribution of vascular phenotypes of the murine Egfl7 locus to the microRNA miR-126. Development 2008, 135, 3989–3993. [Google Scholar] [CrossRef] [Green Version]
- Feng, R.; Chen, X.; Yu, Y.; Su, L.; Yu, B.; Li, J.; Cai, Q.; Yan, M.; Liu, B.; Zhu, Z. miR-126 functions as a tumour suppressor in human gastric cancer. Cancer Lett. 2010, 298, 50–63. [Google Scholar] [CrossRef]
- Feng, R.; Sah, B.K.; Beeharry, M.K.; Yuan, F.; Su, L.; Jin, X.; Yan, M.; Liu, B.; Li, C.; Zhu, Z. Dysregulation of miR-126/Crk protein axis predicts poor prognosis in gastric cancer patients. Cancer Biomark. 2018, 21, 335–343. [Google Scholar] [CrossRef] [PubMed]
- Guo, C.; Sah, J.F.; Beard, L.; Willson, J.K.V.; Markowitz, S.D.; Guda, K. The noncoding RNA, miR-126, suppresses the growth of neoplastic cells by targeting phosphatidylinositol 3-kinase signaling and is frequently lost in colon cancers. Genes Chromosom. Cancer 2008, 47, 939–946. [Google Scholar] [CrossRef] [PubMed] [Green Version]
- Jia, A.Y.; Castillo-Martin, M.; Bonal, D.M.; Sánchez-Carbayo, M.; Silva, J.M.; Cordon-Cardo, C. MicroRNA-126 inhibits invasion in bladder cancer via regulation of ADAM9. Br. J. Cancer 2014, 110, 2945–2954. [Google Scholar] [CrossRef] [PubMed] [Green Version]
- Musiyenko, A.; Bitko, V.; Barik, S. Ectopic expression of miR-126*, an intronic product of the vascular endothelial EGF-like 7 gene, regulates prostein translation and invasiveness of prostate cancer LNCaP cells. J. Mol. Med. 2008, 86, 313–322. [Google Scholar] [CrossRef] [Green Version]
- Saito, Y.; Friedman, J.M.; Chihara, Y.; Egger, G.; Chuang, J.C.; Liang, G. Epigenetic therapy upregulates the tumor suppressor microRNA-126 and its host gene EGFL7 in human cancer cells. Biochem. Biophys. Res. Commun. 2009, 379, 726–731. [Google Scholar] [CrossRef]
- Wang, S.; Aurora, A.B.; Johnson, B.A.; Qi, X.; McAnally, J.; Hill, J.A.; Richardson, J.A.; Bassel-Duby, R.; Olson, E.N. The Endothelial-Specific MicroRNA miR-126 Governs Vascular Integrity and Angiogenesis. Dev. Cell 2008, 15, 261–271. [Google Scholar] [CrossRef] [Green Version]
- Zhang, J.; Du, Y.; Lin, Y.; Chen, Y.; Yang, L.; Wang, H.; Ma, D. The cell growth suppressor, mir-126, targets IRS-1. Biochem. Biophys. Res. Commun. 2008, 377, 136–140. [Google Scholar] [CrossRef]
- Fu, R.; Tong, J. miR-126 reduces trastuzumab resistance by targeting PIK3R2 and regulating AKT/mTOR pathway in breast cancer cells. J. Cell. Mol. Med. 2020, 24, 7600–7608. [Google Scholar] [CrossRef]
- Liu, B.; Peng, X.C.; Zheng, X.L.; Wang, J.; Qin, Y.W. MiR-126 restoration down-regulate VEGF and inhibit the growth of lung cancer cell lines in vitro and in vivo. Lung Cancer 2009, 66, 169–175. [Google Scholar] [CrossRef]
- Negrini, M.; Calin, G.A. Breast cancer metastasis: A microRNA story. Breast Cancer Res. 2008, 10, 303. [Google Scholar] [CrossRef] [Green Version]
- Tavazoie, S.F.; Alarcón, C.; Oskarsson, T.; Padua, D.; Wang, Q.; Bos, P.D.; Gerald, W.L.; Massagué, J. Endogenous human microRNAs that suppress breast cancer metastasis. Nature 2008, 451, 147–152. [Google Scholar] [CrossRef] [PubMed] [Green Version]
- Hinz, N.; Jücker, M. Distinct functions of AKT isoforms in breast cancer: A comprehensive review. Cell Commun. Signal. 2019, 17, 154. [Google Scholar] [CrossRef] [PubMed] [Green Version]
- Dillon, R.L.; Marcotte, R.; Hennessy, B.T.; Woodgett, J.R.; Mills, G.B.; Muller, W.J. Akt1 and Akt2 Play Distinct Roles in the Initiation and Metastatic Phases of Mammary Tumor Progression. Cancer Res. 2009, 69, 5057–5064. [Google Scholar] [CrossRef] [PubMed] [Green Version]
- Riggio, M.; Perrone, M.C.; Polo, M.L.; Rodriguez, M.J.; May, M.; Abba, M.; Lanari, C.; Novaro, V. AKT1 and AKT2 isoforms play distinct roles during breast cancer progression through the regulation of specific downstream proteins. Sci. Rep. 2017, 7, 44244. [Google Scholar] [CrossRef] [Green Version]
- Yu, Z.; Xu, Z.; DiSante, G.; Wright, J.; Wang, M.; Li, Y.; Zhao, Q.; Ren, T.; Ju, X.; Gutman, E.; et al. miR-17/20 sensitization of breast cancer cells to chemotherapy-induced apoptosis requires Akt1. Oncotarget 2014, 5, 1083–1090. [Google Scholar] [CrossRef] [Green Version]
- Ju, X.; Katiyar, S.; Wang, C.; Liu, M.; Jiao, X.; Li, S.; Zhou, J.; Turner, J.; Lisanti, M.P.; Russell, R.G.; et al. Akt1 governs breast cancer progression in vivo. Proc. Natl. Acad. Sci. USA 2007, 104, 7438–7443. [Google Scholar] [CrossRef] [Green Version]
- Arboleda, M.J.; Lyons, J.F.; Kabbinavar, F.F.; Bray, M.R.; Snow, B.E.; Ayala, R.; Danino, M.; Karlan, B.Y.; Slamon, D.J. Overexpression of AKT2/protein kinase Bbeta leads to up-regulation of beta1 integrins, increased invasion, and metastasis of human breast and ovarian cancer cells. Cancer Res. 2003, 63, 196–206. [Google Scholar]
- Pereira, L.; Horta, S.; Mateus, R.; Videira, M.A. Implications of Akt2/Twist crosstalk on breast cancer metastatic outcome. Drug Discov. Today 2015, 20, 1152–1158. [Google Scholar] [CrossRef]
- Wang, J.; Wan, W.; Sun, R.; Liu, Y.; Sun, X.; Ma, D.; Zhang, N. Reduction of Akt2 expression inhibits chemotaxis signal transduction in human breast cancer cells. Cell. Signal. 2008, 20, 1025–1034. [Google Scholar] [CrossRef]
- Tserga, A.; Chatziandreou, I.; Michalopoulos, N.V.; Patsouris, E.; Saetta, A.A. Mutation of genes of the PI3K/AKT pathway in breast cancer supports their potential importance as biomarker for breast cancer aggressiveness. Virchows Arch. 2016, 469, 35–43. [Google Scholar] [CrossRef]
- Deng, L.; Chen, J.; Zhong, X.R.; Luo, T.; Wang, Y.P.; Huang, H.F.; Yin, L.-J.; Qiu, Y.; Bu, H.; Lv, Q.; et al. Correlation between Activation of PI3K/AKT/mTOR Pathway and Prognosis of Breast Cancer in Chinese Women. PLoS ONE 2015, 10, e0120511. [Google Scholar] [CrossRef] [PubMed] [Green Version]
- Kołodziej, P.; Nicoś, M.; Krawczyk, P.A.; Bogucki, J.; Karczmarczyk, A.; Zalewski, D.; Kubrak, T.; Kołodziej, E.; Makuch-Kocka, A.; Madej-Czerwonka, B.; et al. The Correlation of Mutations and Expressions of Genes within the PI3K/Akt/mTOR Pathway in Breast Cancer—A Preliminary Study. Int. J. Mol. Sci. 2021, 22, 2061. [Google Scholar] [CrossRef] [PubMed]
- Pérez-Tenorio, G.; Stål, O.; Arnesson, L.G.; Malmström, A.; Nordenskjöld, B.; Nordenskjöld, K.; Bång, H.; Källström, A.C.; Einarsson, E.; Norberg, B.; et al. Activation of Akt/PKB in breast cancer predicts a worse outcome among endocrine treated patients. Br. J. Cancer 2002, 86, 540–545. [Google Scholar] [CrossRef] [PubMed] [Green Version]
- Tokunaga, E.; Kimura, Y.; Oki, E.; Ueda, N.; Futatsugi, M.; Mashino, K.; Yamamoto, M.; Ikebe, M.; Kakeji, Y.; Baba, H.; et al. Akt is frequently activated in HER2/neu-positive breast cancers and associated with poor prognosis among hormone-treated patients. Int. J. Cancer 2006, 118, 284–289. [Google Scholar] [CrossRef]
- Yang, Z.-Y.; Di, M.-Y.; Yuan, J.-Q.; Shen, W.-X.; Zheng, D.-Y.; Chen, J.-Z.; Mao, C.; Tang, J.-L. The prognostic value of phosphorylated Akt in breast cancer: A systematic review. Sci. Rep. 2015, 5, 7758. [Google Scholar] [CrossRef] [Green Version]
- Pérez-Tenorio, G.; Karlsson, E.; Stål, O. Clinical value of isoform-specific detection and targeting of AKT1, AKT2 and AKT3 in breast cancer. Breast Cancer Manag. 2014, 3, 409–421. [Google Scholar] [CrossRef]
- Haemmerle, M.; Stone, R.L.; Menter, D.G.; Afshar-Kharghan, V.; Sood, A.K. The Platelet Lifeline to Cancer: Challenges and Opportunities. Cancer Cell 2018, 33, 965–983. [Google Scholar] [CrossRef] [Green Version]
- Maimaiti, Y.; Tan, J.; Liu, Z.; Guo, Y.; Yan, Y.; Nie, X.; Huang, B.; Zhou, J.; Huang, T. Overexpression of cofilin correlates with poor survival in breast cancer: A tissue microarray analysis. Oncol. Lett. 2017, 14, 2288–2294. [Google Scholar] [CrossRef] [Green Version]
- Coumans, J.V.F.; Davey, R.J.; Moens, P.D.J. Cofilin and profilin: Partners in cancer aggressiveness. Biophys. Rev. 2018, 10, 1323–1335. [Google Scholar] [CrossRef]
- Lánczky, A.; Nagy, Á.; Bottai, G.; Munkácsy, G.; Szabó, A.; Santarpia, L.; Győrffy, B. miRpower: A web-tool to validate survival-associated miRNAs utilizing expression data from 2178 breast cancer patients. Breast Cancer Res. Treat. 2016, 160, 439–446. [Google Scholar] [CrossRef]
- Lánczky, A.; Győrffy, B. Web-Based Survival Analysis Tool Tailored for Medical Research (KMplot): Development and Implementation. J. Med. Internet Res. 2021, 23, e27633. [Google Scholar] [CrossRef] [PubMed]
- Ősz, Á.; Lánczky, A.; Győrffy, B. Survival analysis in breast cancer using proteomic data from four independent datasets. Sci. Rep. 2021, 11, 16787. [Google Scholar] [CrossRef] [PubMed]
- Tang, W.; Zhou, M.; Dorsey, T.H.; Prieto, D.A.; Wang, X.W.; Ruppin, E.; Veenstra, T.D.; Ambs, S. Integrated proteotranscriptomics of breast cancer reveals globally increased protein-mRNA concordance associated with subtypes and survival. Genome Med. 2018, 10, 94. [Google Scholar] [CrossRef] [PubMed] [Green Version]
- Maimaiti, Y.; Liu, Z.; Tan, J.; Abudureyimu, K.; Huang, B.; Liu, C.; Guo, Y.; Wang, C.; Nie, X.; Zhou, J.; et al. Dephosphorylated cofilin expression is associated with poor prognosis in cases of human breast cancer: A tissue microarray analysis. OncoTargets Ther. 2016, 9, 6461–6466. [Google Scholar] [CrossRef] [PubMed] [Green Version]
- Sidani, M.; Wessels, D.; Mouneimne, G.; Ghosh, M.; Goswami, S.; Sarmiento, C.; Wang, W.; Kuhl, S.; El-Sibai, M.; Backer, J.M.; et al. Cofilin determines the migration behavior and turning frequency of metastatic cancer cells. J. Cell Biol. 2007, 179, 777–791. [Google Scholar] [CrossRef] [PubMed] [Green Version]
- Wang, W.; Mouneimne, G.; Sidani, M.; Wyckoff, J.; Chen, X.; Makris, A.; Goswami, S.; Bresnick, A.R.; Condeelis, J.S. The activity status of cofilin is directly related to invasion, intravasation, and metastasis of mammary tumors. J. Cell Biol. 2006, 173, 395–404. [Google Scholar] [CrossRef] [Green Version]
- Wang, W.; Eddy, R.; Condeelis, J. The cofilin pathway in breast cancer invasion and metastasis. Nat. Rev. Cancer 2007, 7, 429–440. [Google Scholar] [CrossRef] [Green Version]
- Nwabo Kamdje, A.H.; Seke Etet, P.F.; Vecchio, L.; Muller, J.M.; Krampera, M.; Lukong, K.E. Signaling pathways in breast cancer: Therapeutic targeting of the microenvironment. Cell. Signal. 2014, 26, 2843–2856. [Google Scholar] [CrossRef]
- Feng, Y.; Spezia, M.; Huang, S.; Yuan, C.; Zeng, Z.; Zhang, L.; Ji, X.; Liu, W.; Huang, B.; Luo, W.; et al. Breast cancer development and progression: Risk factors, cancer stem cells, signaling pathways, genomics, and molecular pathogenesis. Genes Dis. 2018, 5, 77–106. [Google Scholar] [CrossRef]
- Guerrero-Zotano, A.; Mayer, I.A.; Arteaga, C.L. PI3K/AKT/mTOR: Role in breast cancer progression, drug resistance, and treatment. Cancer Metastasis Rev. 2016, 35, 515–524. [Google Scholar] [CrossRef]
- Samuels, Y.; Wang, Z.; Bardelli, A.; Silliman, N.; Ptak, J.; Szabo, S.; Yan, H.; Gazdar, A.; Powell, S.M.; Riggins, G.J.; et al. High Frequency of Mutations of the PIK3CA Gene in Human Cancers. Science 2004, 304, 554. [Google Scholar] [CrossRef] [PubMed] [Green Version]
- DeGraffenried, L.A.; Friedrichs, W.E.; Russell, D.H.; Donzis, E.J.; Middleton, A.K.; Silva, J.M.; Roth, R.A.; Hidalgo, M. Inhibition of mTOR Activity Restores Tamoxifen Response in Breast Cancer Cells with Aberrant Akt Activity. Clin. Cancer Res. 2004, 10, 8059–8067. [Google Scholar] [CrossRef] [Green Version]
- Escuin, D.; López-Vilaró, L.; Mora, J.; Bell, O.; Moral, A.; Pérez, I.; Arqueros, C.; García-Valdecasas, B.; Ramón y Cajal, T.; Lerma, E.; et al. Circulating microRNAs in Early Breast Cancer Patients and Its Association with Lymph Node Metastases. Front. Oncol. 2021, 11, 627811. [Google Scholar] [CrossRef] [PubMed]
- Loh, H.Y.; Norman, B.P.; Lai, K.S.; Rahman, N.M.A.N.A.; Alitheen, N.B.M.; Osman, M.A. The regulatory role of microRNAs in breast cancer. Int. J. Mol. Sci. 2019, 20, 4940. [Google Scholar] [CrossRef] [PubMed] [Green Version]
- Zhang, L.; Xu, Y.; Jin, X.; Wang, Z.; Wu, Y.; Zhao, D.; Chen, G.; Li, D.; Wang, X.; Cao, H.; et al. A circulating miRNA signature as a diagnostic biomarker for non-invasive early detection of breast cancer. Breast Cancer Res. Treat. 2015, 154, 423–434. [Google Scholar] [CrossRef]
- Tang, M.; Jiang, L.; Lin, Y.; Wu, X.; Wang, K.; He, Q.; Wang, X.; Li, W. Platelet microparticle-mediated transfer of miR-939 to epithelial ovarian cancer cells promotes epithelial to mesenchymal transition. Oncotarget 2017, 8, 97464–97475. [Google Scholar] [CrossRef] [Green Version]
- Cao, W.; Yao, X.; Cen, D.; Zhi, Y.; Zhu, N.; Xu, L. Prognostic role of pretreatment thrombocytosis on survival in patients with cervical cancer: A systematic review and meta-analysis. World J. Surg. Oncol. 2019, 17, 132. [Google Scholar] [CrossRef] [Green Version]
- Giannakeas, V.; Kotsopoulos, J.; Cheung, M.C.; Rosella, L.; Brooks, J.D.; Lipscombe, L.; Akbari, M.R.; Austin, P.C.; Narod, S.A. Analysis of Platelet Count and New Cancer Diagnosis Over a 10-Year Period. JAMA Netw. Open 2022, 5, e2141633. [Google Scholar] [CrossRef]
- Stone, R.L.; Nick, A.M.; McNeish, I.A.; Balkwill, F.; Han, H.D.; Bottsford-Miller, J.; Rupaimoole, R.; Armaiz-Pena, G.N.; Pecot, C.V.; Coward, J.; et al. Paraneoplastic Thrombocytosis in Ovarian Cancer. N. Engl. J. Med. 2012, 366, 610–618. [Google Scholar] [CrossRef] [Green Version]
- Hufnagel, D.H.; Cozzi, G.D.; Crispens, M.A.; Beeghly-Fadiel, A. Platelets, thrombocytosis, and ovarian cancer prognosis: Surveying the landscape of the literature. Int. J. Mol. Sci. 2020, 21, 8169. [Google Scholar] [CrossRef]
- Harano, K.; Kogawa, T.; Wu, J.; Yuan, Y.; Cohen, E.N.; Lim, B.; Reuben, J.M.; Ueno, N.T. Thrombocytosis as a prognostic factor in inflammatory breast cancer. Breast Cancer Res. Treat. 2017, 166, 819–832. [Google Scholar] [CrossRef] [PubMed]
- Garmi, N.; Nasrallah, S.; Baram, Y.; Katz, A.; Koren, A.; First, M.; Blum, A. Platelets and Breast Cancer. Isr. Med. Assoc. J. 2020, 22, 613–617. [Google Scholar] [PubMed]
- Li, Z.; Chen, P.; Su, R.; Li, Y.; Hu, C.; Wang, Y.; Arnovitz, S.; He, M.; Gurbuxani, S.; Zuo, Z.; et al. Overexpression and knockout of miR-126 both promote leukemogenesis. Blood 2015, 126, 2005–2015. [Google Scholar] [CrossRef] [PubMed] [Green Version]
- Zhang, L.; Nguyen, L.X.T.; Chen, Y.-C.; Wu, D.; Cook, G.J.; Hoang, D.H.; Brewer, C.J.; He, X.; Dong, H.; Li, S.; et al. Targeting miR-126 in inv(16) acute myeloid leukemia inhibits leukemia development and leukemia stem cell maintenance. Nat. Commun. 2021, 12, 6154. [Google Scholar] [CrossRef]
- McGeary, S.E.; Lin, K.S.; Shi, C.Y.; Pham, T.M.; Bisaria, N.; Kelley, G.M.; Bartel, D.P. The biochemical basis of microRNA targeting efficacy. Science 2019, 366, 6472. [Google Scholar] [CrossRef]


Publisher’s Note: MDPI stays neutral with regard to jurisdictional claims in published maps and institutional affiliations. |
© 2022 by the authors. Licensee MDPI, Basel, Switzerland. This article is an open access article distributed under the terms and conditions of the Creative Commons Attribution (CC BY) license (https://creativecommons.org/licenses/by/4.0/).
Share and Cite
Sibilano, M.; Tullio, V.; Adorno, G.; Savini, I.; Gasperi, V.; Catani, M.V. Platelet-Derived miR-126-3p Directly Targets AKT2 and Exerts Anti-Tumor Effects in Breast Cancer Cells: Further Insights in Platelet-Cancer Interplay. Int. J. Mol. Sci. 2022, 23, 5484. https://doi.org/10.3390/ijms23105484
Sibilano M, Tullio V, Adorno G, Savini I, Gasperi V, Catani MV. Platelet-Derived miR-126-3p Directly Targets AKT2 and Exerts Anti-Tumor Effects in Breast Cancer Cells: Further Insights in Platelet-Cancer Interplay. International Journal of Molecular Sciences. 2022; 23(10):5484. https://doi.org/10.3390/ijms23105484
Chicago/Turabian StyleSibilano, Matteo, Valentina Tullio, Gaspare Adorno, Isabella Savini, Valeria Gasperi, and Maria Valeria Catani. 2022. "Platelet-Derived miR-126-3p Directly Targets AKT2 and Exerts Anti-Tumor Effects in Breast Cancer Cells: Further Insights in Platelet-Cancer Interplay" International Journal of Molecular Sciences 23, no. 10: 5484. https://doi.org/10.3390/ijms23105484